chapter 12: part d prescription drug coverage in patients ... · chapter 12: part d prescription...
TRANSCRIPT

USRDSUNITED STATES RENAL DATA SYSTEM
2015 USRDS Annual Data Report | Volume 2 - ESRD in the United States 283
Chapter 12: Part D Prescription Drug Coverage in Patients With ESRD
• Among persons with part D enrollment, a higher proportion of hemodialysis (66%), peritoneal dialysis (56%), and transplant (53%) patients receive the low-income subsidy (LIS) than in the general Medicare population (33%).• In 2013, per patient per year Medicare Part D spending for ESRD patients ($6,673) was 2.6 times higher than for general Medicare patients ($2,592). Hemodialysis patients had the highest per person per year (PPPY) Medicare costs in 2013, at $7,142, compared to $6,566 and $4,875 for peritoneal dialysis and transplant patients.• Across general Medicare and ESRD populations, PPPY net Part D costs were 2.7-3.5 times greater for patients with LIS benefits than for those without. In addition, out-of-pocket costs represented only 1-2% of total expenditures in each of the LIS populations, compared to 28-32% in the non-LIS populations.• Among the six most common drug classes used by dialysis patients during 2013, phosphate binders were the most frequently prescribed (72.5%), and also ranked first in terms of Medicare spending. Calcimimetic agents were the second most costly class of medications, although only 29.1% of dialysis patients had at least one such prescription filled.
Introduction
2016 will mark ten years of operation for the Medicare Part D prescription drug benefit. Over that time period, Part D has become an important component of Medicare as whole. Given the clinical and socioeconomic status of those in the ESRD population, this benefit has been particularly significant. In December 2013, more than 37 million Medicare recipients, representing 69% of the entire Medicare population, enrolled in a Medicare Part D prescription drug plan. With 74% participation, Medicare-covered ESRD patients exceed the Part D enrollment rate of the general Medicare population. When distinguished by renal replacement modality, 78, 67, and 63% of Medicare-enrolled hemodialysis, peritoneal dialysis, and kidney transplant patients, respectively, participated. Given that very few ESRD beneficiaries are enrolled in Medicare Advantage plans that provide both medical and prescription coverage, most obtain Part D benefits through a stand-alone prescription drug plan (PDP).
Prior to the initiation of this benefit on January 1, 2006, some Medicare beneficiaries were able to obtain drug coverage through various private insurance
plans, state Medicaid programs, or the Department of Veterans Affairs. Others received partial support through pharmaceutical-assistance programs or free samples available from their physicians. However, many ESRD patients did not have reliable coverage, and incurred substantial out-of-pocket expenses for their medications.
Enrollment in Part D is not mandatory; non-Part D Medicare enrollees may choose to obtain outpatient medication benefits through other creditable coverage sources that provide benefits equivalent to or better than Part D. These include employer group health plans, retiree health plans, Veterans Administration benefits, and state kidney programs. Those without an alternative source of coverage pay for their prescriptions out-of-pocket. The proportion of Medicare-covered ESRD patients with no known source of drug coverage is highest in the peritoneal dialysis and transplant populations. Given that more of these patients are employed (relative to hemodialysis patients), it is likely that some have sources of prescription drug coverage not currently tracked by Medicare.

284
Chapter 12: Part D Prescription Drug Coverage in Patients With ESRDPatients dually-enrolled in Medicare and Medicaid are automatically eligible for Part D under the Low-income Subsidy (LIS) benefit. Non-Medicaid eligible patients can also qualify for the LIS based on limited assets and income. The LIS provides full or partial waivers for many out-of-pocket cost-sharing requirements, including premiums, deductibles, and copayments, and provides full or partial coverage during the coverage gap (“donut hole”). In 2013, 63% of Medicare-covered ESRD patients enrolled in Part D received the LIS benefit, compared to 33% of the general Medicare Part D population. By modality, 66, 56, and 53% of enrolled hemodialysis, peritoneal dialysis, and transplant patients, respectively, qualified for the LIS. Out-of-pocket costs are thus proportionally lower for Part D enrollees in the ESRD population than for their general Medicare counterparts ($375 vs $412). By race, White dialysis patients are the least likely to qualify for LIS benefits.
Phosphate binding agents are the most frequently prescribed of six common medication drug classes used by Part D dialysis patients, while cardiovascular agents (beta blockers, statins, and calcium channel blockers) account for three of the top four. Prescribed phosphate binding agents and calcimimetic agents incur the highest medication costs, as these are not available in generic form.
In 2013, total estimated net Medicare Part D costs for ESRD and general Medicare Part D enrollees were $2.3 billion and $52.8 billion, respectively. Between 2011 and 2013, total net costs increased by 27 and 41% for hemodialysis and peritoneal dialysis patients, compared to 13% for general Medicare patients; for transplant patients, costs rose by 26%. In 2013, regardless the LIS status, Medicare Part D costs for hemodialysis, peritoneal dialysis, and transplant patients were $7,142 and $6,566, and $4,875per person per year (PPPY), respectively, compared to $2,592for general Medicare patients. Out-of-pocket Part D costs for ESRD patients were slightly lower than for general Medicare patients, at $375 versus $412. This is not surprising, as among Part D enrollees, a higher percentage of ESRD patients enrolled in Part D received the LIS benefit (63% versus 33%). The Medicare Part D program functions in concert with Medicare Part B; this benefit covers medications administered in physician offices, some of those administered during hemodialysis (e.g. intravenous antibiotics that are not associated with dialysis-related infections), and most immunosuppressant
medications required following a kidney transplant. Immunosuppression coverage continues as long as the transplant recipient maintains Medicare eligibility. Entitlement may end at three years post-transplant or be continued due to disability or age. Patients whose kidney transplant is not covered by Medicare, but who become Medicare-eligible due to age or disability can enroll in and receive their immunosuppressant medications through Part D. Prescription drugs not covered for beneficiaries under Part B may be covered by Part D, depending upon whether the drug is included on the plan formulary. Until January 2011, costs of erythropoietin stimulating agents, IV vitamin D, iron, and antibiotic agents administered during dialysis were separately reimbursable under Medicare Part B. Since 2011, coverage for these products has been included in the monthly bundled payment to dialysis providers. Part B costs are thus not displayed in chapter figures, as they have been in previous ADRs.
Analytical MethodsSee the ESRD Analytical Methods chapter for an explanation of analytical methods used to generate thefigures and tables in this chapter.
Part D Enrollment Patterns
Patients with Medicare coverage have the option to enroll in Medicare Part D for prescription drug coverage; overall, 74% of Medicare ESRD beneficiaries were enrolled in a Part D plan in 2013. By modality, enrollment was 78, 67, and 63% for hemodialysis, peritoneal dialysis and transplant patients, respectively, compared to 69% of general Medicare patients.
Compared to general Medicare Part D enrollees, more hemodialysis, peritoneal dialysis, and transplant patients with Part D receive the Low-income Subsidy (LIS)—66, 56, and 53%, respectively, compared to 33% of the general Medicare population. About 16% of ESRD beneficiaries have no identified prescription drug coverage. By modality, peritoneal dialysis and transplant patients are least likely to have known coverage, but these groups are traditionally more likely to be employed than hemodialysis patients and thus may be more likely to have coverage that is not tracked by Medicare (see Figure 12.1).

2015 USRDS Annual Data Report | Volume 2 - ESRD in the United States
285
vol 2 Figure 12.1 Sources of prescription drug coverage in Medicare ESRD enrollees, by population, 2013
Data source: 2013 Medicare Data, point prevalent Medicare enrollees alive on January 1, 2013. Abbreviations: ESRD, end-stage renal disease; HD, hemodialysis; LIS, Low-income Subsidy; Part D, Medicare Part D prescription drug coverage; PD, peritoneal dialysis; Tx, kidney transplant.
Sources of prescription drug coverage among ESRD patients vary widely by age (Figure 12.2). Dialysis patients aged 20-44 had the highest Part D enrollment in 2013, while transplant patients aged 65-74 had the highest Part D enrollment. In addition, receipt of the LIS decreases substantially with age—from 75 and 54% among dialysis and transplant patients aged 20–44 to just 35 and 17% among those aged 75 and older. In each age category, transplant patients are markedly less likely than those on dialysis to receive the LIS benefit.
vol 2 Figure 12.2 Sources of prescription drug coverage in Medicare ESRD enrollees, by age & modality, 2013
(a) Dialysis patients
(b) Transplant patients
Data source: 2013 Medicare Data, point prevalent Medicare enrollees alive on January 1, 2013. Abbreviations: ESRD, end-stage renal disease; LIS, Low-income Subsidy; Part D, Medicare Part D prescription drug coverage.
The percentage of dialysis patients enrolled in Part D also varied by race, from 75% of Whites to 81 and 83% of Blacks/African Americans and Hispanics, respectively (Figure 12.3). Seventy-six percent of Blacks and 78% of Hispanics with Part D coverage qualified for the LIS benefit, compared to 58% of Whites; Blacks were the least likely to have no known prescription drug coverage. Overall and by race, Part D enrollment among transplant patients was lower than that of dialysis patients, with 62% of Whites, 69% of Blacks, and 73% of Hispanic transplant patients enrolled. Sixty-six percent of Blacks and 73% of Hispanics with Part D coverage have the LIS, compared to 48% of Whites and 60% of Asians (Figures 12.3).

286
Chapter 12: Part D Prescription Drug Coverage in Patients With ESRDvol 2 Figure 12.3 Sources of prescription drug coverage in Medicare ESRD enrollees, by race/ethnicity & modality, 2013
(a) Dialysis patients
(b) Transplant patients
Data source: 2013 Medicare Data, point prevalent Medicare enrollees alive on January 1, 2013. Abbreviations: Blk/Af Am, Black or African American; ESRD, end-stage renal disease; LIS, Low-income Subsidy; Part D, Medicare Part D prescription drug coverage.
The LIS provides assistance for the premiums, deductibles, and co-payments of the Medicare Part D program. Some Medicare enrollees are automatically deemed eligible for LIS and do not need to file an application (deemed LIS beneficiaries). Such patients include persons dually eligible for both Medicaid and Medicare, those receiving supplemental security income, and those participating in Medicare savings programs (e.g., Qualified Medicare Beneficiaries (QMB) and Qualified Individuals (QI)). Dual-eligible ESRD patients who do not actively select a plan are automatically enrolled in a stand-alone Medicare Part D plan by the Center for Medicare and Medicaid Services (CMS). Other Medicare beneficiaries with limited incomes and resources who do not automatically qualify for LIS (non-deemed beneficiaries) can apply for the LIS and have their eligibility determined by their state Medicaid agency or the Social Security Administration.
In 2013, 89% of dialysis patients with Part D LIS coverage were deemed LIS beneficiaries, compared to 83% and 86%, respectively, of and transplant and general Medicare patients (Figure 12.4).
vol 2 Figure 12.4 Distribution of Low-income Subsidy categories in Part D general Medicare & ESRD patients, 2013
Data source: 2013 Medicare data, point prevalent Medicare enrollees alive on January 1, 2013. Abbreviations: ESRD, end-stage renal disease; Part D, Medicare Part D prescription drug coverage.
Within each race group, receipt of the LIS generally decreases with age. For those aged 75 and older, however, an uptick is seen for general Medicare patients across all races and several subsets of the ESRD population, including hemodialysis and peritoneal dialysis patients of other races, and Black transplant patients (see Table 12.1).

2015 USRDS Annual Data Report | Volume 2 - ESRD in the United States
287
vol 2 Table 12.1 Medicare Part D enrollees (%) with or without the Low-income Subsidy, by age & race, 2013
General Medicare All ESRD Hemodialysis Peritoneal dialysis Transplant
Part D with LIS
Part D without
LIS
Part D with LIS
Part D without
LIS
Part D with LIS
Part D without
LIS
Part D with LIS
Part D without
LIS
Part D with LIS
Part D without
LISWhite
All ages 26.0 74.0 55.1 44.9 58.6 41.4 49.1 50.9 47.8 52.2
20-44 88.9 11.1 87.8 12.2 91.0 9.0 88.4 11.6 82.4 17.6
45-64 52.3 47.7 70.1 30.0 75.5 24.5 63.4 36.6 56.9 43.1
65-74 15.5 84.6 40.6 59.4 48.6 51.4 25.2 74.8 22.1 78.0
75+ 20.4 79.6 34.8 65.2 37.6 62.4 17.3 82.7 18.6 81.4
Black/Af Am
All ages 59.8 40.2 75.0 25.0 76.7 23.3 71.9 28.1 66.0 34.0
20-44 93.6 6.5 92.0 8.0 93.7 6.3 91.4 8.6 86.0 14.0
45-64 75.3 24.7 80.2 19.8 82.6 17.4 73.8 26.2 68.8 31.2
65-74 43.7 56.3 60.4 39.6 64.1 35.9 42.7 57.4 41.6 58.4
75+ 52.0 48.0 61.1 38.9 62.7 37.4 36.7 63.3 41.7 58.3
Other race
All ages 59.3 40.7 71.4 28.6 75.8 24.2 60.4 39.6 60.9 39.1
20-44 87.5 12.5 87.3 12.7 90.8 9.2 84.8 15.2 80.8 19.3
45-64 62.1 37.9 75.6 24.4 80.4 19.6 62.0 38.0 66.0 34.0
65-74 49.9 50.1 61.5 38.5 68.2 31.8 42.6 57.4 47.6 52.5
75+ 63.6 36.4 68.3 31.7 71.8 28.2 54.8 45.2 44.9 55.2
Data source: 2013 Medicare data, point prevalent Medicare enrollees alive on January 1, 2013. Abbreviations: Af Am, African American; ESRD, end-stage renal disease; LIS, Low-income Subsidy; Part D, Medicare Part D prescription drug coverage.
Part D Coverage Plans
CMS provides participating prescription drug plans (PDPs) with guidance on structuring a ‘‘standard’’ Part D PDP. The upper portion of Table 12.2 illustrates the standard benefit design for PDPs in 2008 and 2013. In 2013, for example, beneficiaries shared costs with the PDP through co-insurance or copayments, until the combined total during the initial coverage period reached $2,970. After reaching this threshold, beneficiaries entered a coverage gap, or “donut hole,” where they were then required to pay 100% of their prescription costs.
In each year since 2010, the U.S. government has been providing increasing assistance to those reaching this coverage gap. In 2013, patients received a 52.5% discount on brand name medications from drug manufacturers, and Part D plans paid 21% of generic drug costs for those in the gap (Q1 Medicare, 2013).
Beneficiaries who reached annual out-of-pocket drug costs of $4,750 entered the catastrophic coverage phase, in which they then paid only a small copayment for any additional prescriptions until the end of that year (Table 12.2).
PDPs have the latitude to structure their plans differently from the example presented, but companies offering non-standard plans must demonstrate that their coverage is at least actuarially equivalent to the standard plan. Many have developed plans featuring no deductibles, or with drug copayments instead of the 25% co-insurance, and some plans provide generic and/or brand name drug coverage during the coverage gap (Table 12.2; Q1 Medicare, 2013).

288
Chapter 12: Part D Prescription Drug Coverage in Patients With ESRD
The catastrophic coverage amount is the greater of 5% of medication cost or the values shown in the chart above. In 2013, beneficiaries were charged $2.65 for those generic or preferred multisource drugs with a retail price less than $53 and 5% for those with a retail price over $53. For brand name drugs, beneficiaries paid $6.60 for those drugs with a retail price less than $132 and 5% for those with a retail price over $132.Table adapted from http://www.q1medicare.com/PartD-The-2013-Medicare-Part-D-Outlook.php.
Part D enrollment increased between 2011 and 2013 among Medicare-covered patients with ESRD. Enrollment growth was in the 7-11% range for all ESRD modalities compared to the 13% in the general Medicare population (Table 12.3).
vol 2 Table 12.2 Medicare Part D parameters for defined standard benefit, 2008 & 2013
2008 2013Deductible
$275 $325After the deductible is met, the beneficiary pays 25% of total prescription costs up to the initial cov-erage limit.
Initial coverage limit
$2,510 $2,970The coverage gap (“donut hole”) begins at this point.The beneficiary pays 100% of their prescription costs up to the out-of-pocket thresholdOut-of-pocket threshold
$4,050 $4,750The total out-of-pocket costs including the “donut hole”Total covered Part D prescription out-of-pocket spending:
$5,726.25 $6,733.75(including the coverage gap). Catastrophic coverage begins after this point.Catastrophic coverage benefit
Generic/preferred multi-source drug $2.25 $2.651
Other drugs $5.60 $6.601 1plus a 52.50% brand name medication discount
2013 Example:
$325 (deductible) $275 $325
+(($$2970-$325)*25%)(initial coverage) $558.75 $652.50
+(($6733.75-$2970)*100%)(coverage gap) $3,216.25 $3,763.75
Total$4,050.00 $4,750.00(maximum out-of-pocket costs prior to catastrophic
coverage, excluding plan premium)
The catastrophic coverage amount is the greater of 5% of medication cost or the values shown in the chart above. In 2013, beneficiaries were charged $2.65 for those generic or preferred multisource drugs with a retail price less than $53, and 5% for those with a retail price over $53. For brand name drugs, beneficiaries paid $6.60 for those drugs with a retail price less than $132, and 5% for those with a retail price over $132. Table adapted from http://www.q1medicare.com/PartD-The-2013-Medicare-Part-D-Outlook.php.

2015 USRDS Annual Data Report | Volume 2 - ESRD in the United States
289
vol 2 Table 12.3 General Medicare & ESRD patients enrolled in Part D (%)
General Medicare All ESRD Hemodialysis Peritoneal dial-ysis
Transplant
2011 61.01 68.93 73.17 61.83 57.15
2013 68.68 74.21 78.23 67.31 63.46
Data source: 2011 and 2013 Medicare data, point prevalent Medicare enrollees alive on January 1. Medicare data: general Medicare, 5% Medicare sample (ESRD, hemodialysis, peritoneal dialysis, and transplant, 100% ESRD population). Abbreviations: ESRD, end-stage renal disease; Part D, Medicare Part D prescription drug coverage.
Overall Costs of Part D Enrollment: Coverage Analysis
Total net Part D expenditures for ESRD patients increased from $1.80 billion in 2011 to $2.30 billion in 2013 (Table 12.4). These amounts do not include costs of medications subsumed under the ESRD prospective payment system (e.g. ESAs, IV vitamin D, and iron) or billed to Medicare Part B (e.g. immunosuppressants). Between 2011 and 2013, total estimated Part D costs increased by 27, 41, and 26% for hemodialysis, peritoneal dialysis, and kidney transplant patients, respectively.vol 2 Table 12.4 Total estimated Medicare Part D costs for enrollees, in billions, 2011 & 2013
General Medicare All ESRD Hemodialysis Peritoneal dialysis
Transplant
2011 46.49 1.80 1.45 0.10 0.22
2013 52.75 2.30 1.83 0.14 0.27
Data source: 2011 and2013 Medicare data, period prevalent Medicare enrollees alive on January 1, excluding those in Medicare Advantage Part D plans and Medicare secondary payer, using as-treated model (see ESRD Methods chapter for analytical methods).
By ESRD modality, hemodialysis patients had the highest per person per year (PPPY) Medicare costs in 2013, at $7,142, compared to $6,566 and $4,875 for peritoneal dialysis and transplant patients. PPPY net Part D costs in the overall ESRD population were 2.6 times greater than those for general Medicare patients, at $6,673 as compared to $2,592. As a proportion of total Part D costs, however, out-of-pocket costs were lower in ESRD patients, representing five, seven, and nine percent of PPPY costs for hemodialysis, peritoneal dialysis, and transplant patients, compared to 14% in the general Medicare population (Figure 12.5a).
Across general Medicare and ESRD populations, PPPY net Part D costs are 2.7-3.5 times greater for patients with LIS benefits than in those without. In the LIS population, however, out-of-pocket costs represented only 1-2% of these total expenditures, compared to 28-32% in each of the non-LIS populations across general Medicare and ESRD populations. PPPY net Part D costs are 83% and 93% greater for patients with ESRD than for general Medicare patients in the LIS and non-LIS populations, respectively (Figure 12.5b).
vol 2 Figure 12.5 Per person per year Medicare & out-of-pocket Part D costs for enrollees, 2013
(a) All Part D enrollees
(b) Part D enrollees by Low-income Subsidy status
Data source: 2013 Medicare data, period prevalent Medicare enrollees alive on January 1, 2013, excluding those in Medicare Advantage Part D plans and Medicare secondary payer, using as-treated model (see ESRD Methods chapter for analytical methods).
Total per person per year (PPPY) Medicare Part D costs vary by age, sex, and race. Generally, younger patients, whose Medicare entitlement is based on disability, have higher costs than older patients. Costs varied only modestly by sex and race (Table 12.5).
290
Chapter 12: Part D Prescription Drug Coverage in Patients With ESRD
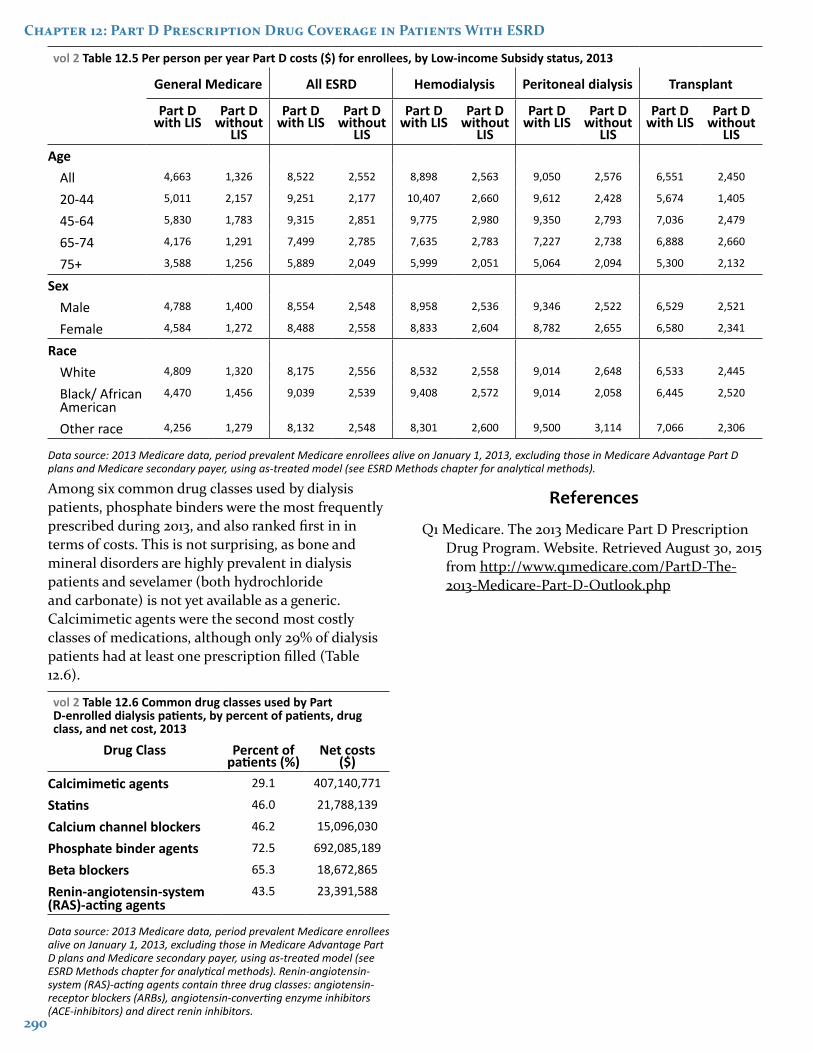
vol 2 Table 12.5 Per person per year Part D costs ($) for enrollees, by Low-income Subsidy status, 2013
General Medicare All ESRD Hemodialysis Peritoneal dialysis Transplant
Part D with LIS
Part D without
LIS
Part D with LIS
Part D without
LIS
Part D with LIS
Part D without
LIS
Part D with LIS
Part D without
LIS
Part D with LIS
Part D without
LISAge
All 4,663 1,326 8,522 2,552 8,898 2,563 9,050 2,576 6,551 2,450
20-44 5,011 2,157 9,251 2,177 10,407 2,660 9,612 2,428 5,674 1,405
45-64 5,830 1,783 9,315 2,851 9,775 2,980 9,350 2,793 7,036 2,479
65-74 4,176 1,291 7,499 2,785 7,635 2,783 7,227 2,738 6,888 2,660
75+ 3,588 1,256 5,889 2,049 5,999 2,051 5,064 2,094 5,300 2,132
SexMale 4,788 1,400 8,554 2,548 8,958 2,536 9,346 2,522 6,529 2,521
Female 4,584 1,272 8,488 2,558 8,833 2,604 8,782 2,655 6,580 2,341
RaceWhite 4,809 1,320 8,175 2,556 8,532 2,558 9,014 2,648 6,533 2,445
Black/ African American
4,470 1,456 9,039 2,539 9,408 2,572 9,014 2,058 6,445 2,520
Other race 4,256 1,279 8,132 2,548 8,301 2,600 9,500 3,114 7,066 2,306
Data source: 2013 Medicare data, period prevalent Medicare enrollees alive on January 1, 2013, excluding those in Medicare Advantage Part D plans and Medicare secondary payer, using as-treated model (see ESRD Methods chapter for analytical methods).
Among six common drug classes used by dialysis patients, phosphate binders were the most frequently prescribed during 2013, and also ranked first in in terms of costs. This is not surprising, as bone and mineral disorders are highly prevalent in dialysis patients and sevelamer (both hydrochloride and carbonate) is not yet available as a generic. Calcimimetic agents were the second most costly classes of medications, although only 29% of dialysis patients had at least one prescription filled (Table 12.6).
vol 2 Table 12.6 Common drug classes used by Part D-enrolled dialysis patients, by percent of patients, drug class, and net cost, 2013
Drug Class Percent of patients (%)
Net costs ($)
Calcimimetic agents 29.1 407,140,771
Statins 46.0 21,788,139
Calcium channel blockers 46.2 15,096,030
Phosphate binder agents 72.5 692,085,189
Beta blockers 65.3 18,672,865
Renin-angiotensin-system (RAS)-acting agents
43.5 23,391,588
Data source: 2013 Medicare data, period prevalent Medicare enrollees alive on January 1, 2013, excluding those in Medicare Advantage Part D plans and Medicare secondary payer, using as-treated model (see ESRD Methods chapter for analytical methods). Renin-angiotensin-system (RAS)-acting agents contain three drug classes: angiotensin-receptor blockers (ARBs), angiotensin-converting enzyme inhibitors (ACE-inhibitors) and direct renin inhibitors.
References
Q1 Medicare. The 2013 Medicare Part D Prescription Drug Program. Website. Retrieved August 30, 2015 from http://www.q1medicare.com/PartD-The-2013-Medicare-Part-D-Outlook.php