chapter 11: air quality - udot west davis corridor
TRANSCRIPT

Chapter 11: Air Quality
11.1 Introduction ........................................................................................................... 11-1
11.2 Regulatory Setting ................................................................................................. 11-2 11.2.1 National Ambient Air Quality Standards ................................................... 11-2 11.2.2 Requirements of the National Environmental Policy Act .......................... 11-3 11.2.3 Transportation Conformity Requirements .................................................. 11-3 11.2.4 Hazardous Air Pollutants ........................................................................... 11-4
11.3 Affected Environment ........................................................................................... 11-5
11.4 Environmental Consequences .............................................................................. 11-8 11.4.1 Methodology .............................................................................................. 11-8 11.4.2 Effects on Air Quality in the WDC Study Area ....................................... 11-12 11.4.3 Effects on Local Air Quality .................................................................... 11-20 11.4.4 Wetland Avoidance Options .................................................................... 11-26 11.4.5 Transportation Conformity ....................................................................... 11-27 11.4.6 Mitigation Measures ................................................................................. 11-28 11.4.7 Cumulative Impacts .................................................................................. 11-28 11.4.8 Summary of Impacts ................................................................................ 11-29
11.5 References ............................................................................................................ 11-30
11.1 Introduction This chapter describes the existing air quality in the West Davis Corridor (WDC) study area and the effects of the proposed WDC alternatives on air quality. Air quality in a given area depends on several factors such as the area itself (size and topography), the prevailing weather patterns (meteorology and climate), and the pollutants released into the air. Air quality is described in terms of the concentrations of various pollutants in a given area of atmosphere (for example, parts per million or micrograms per cubic meter).
The local air quality impacts analyzed in this chapter focus on the areas around the proposed alternatives. The air quality analysis used output from the same Wasatch Front Regional Council (WFRC) travel demand model used by the WDC team to develop and screen alternatives. Output from the model was based on the WDC study area described in Section 1.2, Description of the Needs Assessment Study Area.
What is a travel demand model?
A travel demand model is a computer model that predicts the number of transportation trips (travel demand) in an area at a given time. The travel demand model used for the WDC Project is maintained by WFRC.
Chapter 11: Air Quality 11-1

11.2 Regulatory Setting 11.2.1 National Ambient Air Quality Standards
The U.S. Environmental Protection Agency (EPA) has set National Ambient Air Quality Standards (NAAQS) for pollutants considered harmful to public health and the environment. These standards include both primary and secondary standards. Primary standards protect public health, while secondary standards protect public welfare (such as protecting property and vegetation from the effects of air pollution).
These standards have been adopted by the Utah Division of Air Quality as the official ambient air quality standards for Utah. For the pollutants addressed in this chapter, the primary and secondary standards are the same. The current NAAQS are listed in Table 11-1. The pollutants in Table 11-1 are referred to as criteria pollutants because air quality standards (criteria) have been established for these pollutants.
If an area meets the NAAQS for a given air pollutant, the area is called an attainment area for that pollutant (because the NAAQS have been attained). If an area does not meet the NAAQS for a given air pollutant, the area is called a non-attainment area. A maintenance area is an area previously designated as a non-attainment area that has been redesignated as an attainment area and is required by Section 175A of the Clean Air Act, as amended, to have a maintenance plan.
Table 11-1. National and Utah Ambient Air Quality Standards (NAAQS) for Transportation-Related Criteria Pollutants
Pollutant Primary/ Secondary Averaging Time Level Form
Carbon monoxide (CO) Primary
8-hour average 9 ppm Not to be exceeded more than once per year 1-hour average 35 ppm
Particulate matter (PM2.5)
Primary Annual average 12 µg/m3 Annual mean, averaged over 3 years
Secondary Annual average 15 µg/m3 Annual mean, averaged over 3 years
Primary and secondary 24-hour average 35 µg/m3 98th percentile, averaged over 3 years
Particulate matter (PM10)
Primary and secondary 24-hour average 150 µg/m3 Not to be exceeded more than once
per year on average over 3 years
Source: EPA 2017a PM10 = particulate matter 10 microns in diameter or less PM2.5 = particulate matter 2.5 microns in diameter or less
µg/m3 = micrograms per cubic meter ppm = parts per million
What are attainment, non-attainment, and maintenance areas?
An attainment area is an area that meets (or “attains”) the NAAQS for a given air pollutant.
A non-attainment area is an area that does not meet the NAAQS for a given air pollutant.
A maintenance area is an area previously designated as a non-attainment area that has been redesignated as an attainment area and is required to have a maintenance plan.
11-2 Final Environmental Impact Statement

11.2.2 Requirements of the National Environmental Policy Act The Federal Highway Administration’s (FHWA) guidance (T 6640.8A) for preparing environmental documents under the National Environmental Policy Act (NEPA) includes guidance for evaluating air quality in terms of mesoscale and microscale impacts. Mesoscale evaluations analyze air quality impacts in the WDC study area, while microscale evaluations analyze local air quality impacts, usually for individual roads or intersections.
This EIS complies with NEPA requirements as described above in FHWA guidance, further describes the transportation conformity requirements (see Section 11.2.3 below), and applies those conformity requirements to the proposed project.
11.2.3 Transportation Conformity Requirements All state governments are required to develop a State Implementation Plan (SIP), which explains how the State will comply with the requirements of the federal Clean Air Act of 1990, as amended. Section 176(c) of the Clean Air Act, and its related amendments, require that transportation plans, programs, and projects that are developed, funded, or approved by FHWA and metropolitan planning organizations must demonstrate that such activities conform to the SIP. Transportation conformity requirements apply to any transportation-related criteria pollutants (for example, carbon monoxide or particulate matter) for which the project area has been designated a non-attainment or maintenance area.
According to Section 176(c) of the Clean Air Act, a transportation project is said to “conform” to the provisions and purposes of the SIP if the project, both alone and in combination with other planned projects, does not:
• Cause or contribute to new air quality violations of the NAAQS,
• Worsen existing violations of the NAAQS, or
• Delay timely attainment of the NAAQS or required interim milestones.
The transportation conformity rule (40 Code of Federal Regulations [CFR] 93, Subpart A) establishes the criteria and procedures for determining whether projects conform to the SIP (EPA 2012). Since the WDC study area is in an attainment area for CO, PM10, ozone (O3), and nitrogen dioxide (NO2), a transportation conformity determination is not required for these pollutants.
The WDC study area is in a non-attainment area for PM2.5. This non-attainment status for PM2.5 was formalized by EPA in December 2009. At that time, the State was given 3 years to develop a new section of the SIP demonstrating how the region would attain the 24-hour PM2.5 standard of 35 μg/m3. Because the State failed to meet statutory deadlines for
What is a State Implementation Plan (SIP)?
A State Implementation Plan explains how a State will comply with the requirements of the federal Clean Air Act of 1990, as amended.
What are criteria pollutants?
Criteria pollutants are the six pollutants for which EPA has established air quality standards (criteria). The three transportation-related criteria pollutants are listed in Table 11-1 above.
Chapter 11: Air Quality 11-3
demonstrating compliance with the 24-hour PM2.5 standard, EPA has proposed to redesignate the region as a “serious” non-attainment area for PM2.5 (Federal Register, Volume 81, Number 242, December 16, 2016). Within 18 months to 2 years of the effective date of the reclassification, the State will be required to submit SIP revisions that comply with the statutory and regulatory requirements for serious PM2.5 non-attainment areas.
Until motor vehicle emissions budgets for PM2.5 and any precursors have been found adequate or the SIP has been approved by EPA, WFRC uses the interim emissions tests to demonstrate the conformity of its Regional Transportation Plan and Transportation Improvement Program to the transportation conformity regulations. WFRC has chosen the baseline year test to show that PM2.5 and nitrogen oxide (NOx) emissions from projects in the Regional Transportation Plan and Transportation Improvement Program in future analysis years are below 2008 levels (WFRC 2016). For the proposed WDC Project, a project-level conformity determination will be made on the preferred alternative before FHWA issues a Record of Decision.
For more information regarding the conformity analysis, see Section 11.4.5, Transportation Conformity.
11.2.4 Hazardous Air Pollutants In addition to the NAAQS, EPA has also established a list of 30 air toxics that present the greatest threat to public health in the largest number of urban areas (EPA 2017b). Air toxics are pollutants that can cause cancer or other serious health effects or adverse environmental effects. Most air toxics originate from human-made sources including road mobile sources, non-road mobile sources (such as airplanes), and stationary sources (such as factories or refineries).
Air toxics are in the atmosphere as a result of industrial activities and motor vehicle emissions. Scientific research has shown that the health risks to people exposed to air toxics at sufficiently high concentrations or lengthy durations include an increased risk of contracting cancer, damage to the immune system, and neurological, reproductive, and/or developmental problems (EPA 2000).
To better understand the effects that air toxics have on human health, EPA developed a list of 21 mobile-source air toxics (MSATs) including acetaldehyde, benzene, formaldehyde, diesel exhaust, acrolein, and 1,3-butadiene (66 Federal Register 17230). EPA assessed the risks of various kinds of exposures to these pollutants.
In July 1999, EPA published a strategy to reduce air toxics; in March 2001, EPA issued regulations for automobile and truck manufacturers to decrease the amounts of these
What other pollutants are of concern for transportation projects?
Other pollutants of concern are urban air toxics and mobile-source air toxics (MSATs).
What is a baseline year test?
A baseline year test is a comparison of projected future emissions to a past year’s emissions. The past year that is used for comparison is considered the baseline year.
11-4 Final Environmental Impact Statement
pollutants by target dates in 2007 and 2020. Under the March 2001 regulation, between 1990 and 2020, highway emissions of benzene, formaldehyde, 1,3-butadiene, and acetaldehyde will be reduced by 67% to 76% and on-highway diesel particulate matter emissions will be reduced by 90%. These reductions will be achieved by implementing mobile-source control programs including the reformulated gasoline program, a new cap on the toxics content of gasoline, the national low-emission vehicle standards, the Tier 2 motor vehicle emission standards and gasoline sulfur-control requirements, the heavy-duty engine and vehicle standards, and the on-highway diesel fuel sulfur-control requirements (EPA 2000).
In February 2007, EPA issued a final rule to reduce hazardous air pollutants from mobile sources. The final standards will lower emissions of benzene and other air toxics in three ways: (1) by lowering the benzene content in gasoline, (2) by reducing exhaust emissions from passenger vehicles operated at cold temperatures, and (3) by reducing emissions that evaporate from, and permeate through, portable fuel containers.
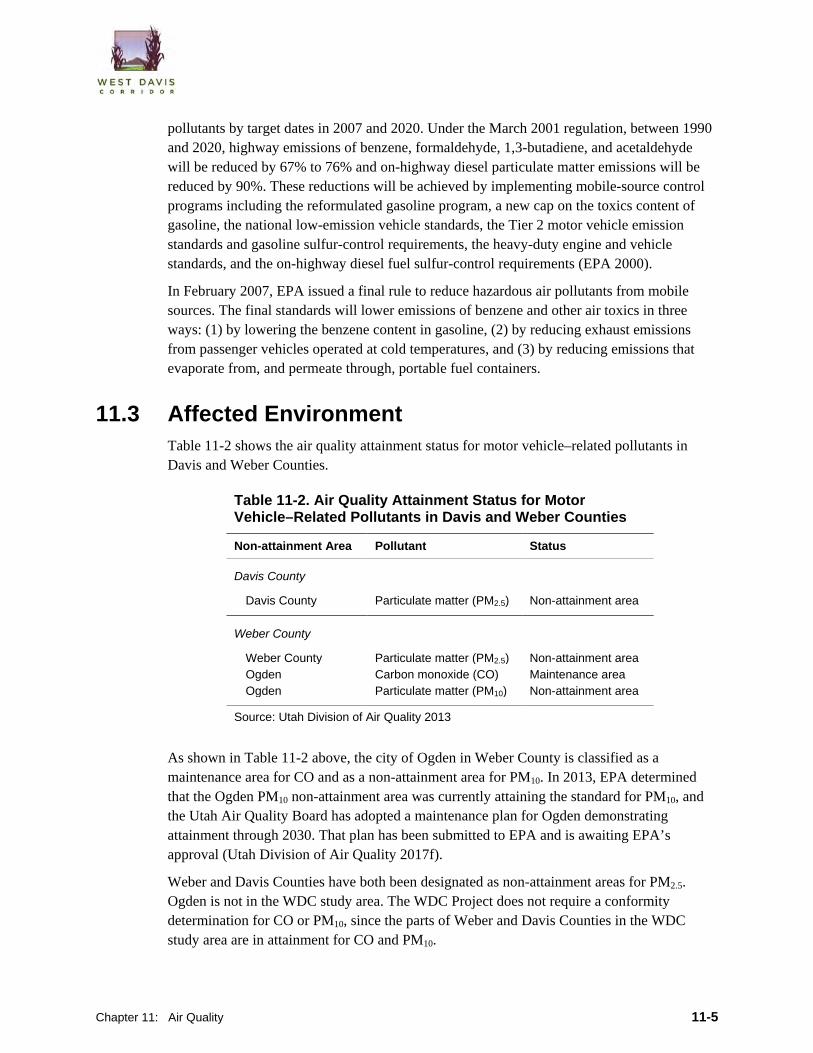
11.3 Affected Environment Table 11-2 shows the air quality attainment status for motor vehicle–related pollutants in Davis and Weber Counties.
Table 11-2. Air Quality Attainment Status for Motor Vehicle–Related Pollutants in Davis and Weber Counties
Non-attainment Area Pollutant Status
Davis County
Davis County Particulate matter (PM2.5) Non-attainment area
Weber County
Weber County Particulate matter (PM2.5) Non-attainment area Ogden Carbon monoxide (CO) Maintenance area Ogden Particulate matter (PM10) Non-attainment area
Source: Utah Division of Air Quality 2013
As shown in Table 11-2 above, the city of Ogden in Weber County is classified as a maintenance area for CO and as a non-attainment area for PM10. In 2013, EPA determined that the Ogden PM10 non-attainment area was currently attaining the standard for PM10, and the Utah Air Quality Board has adopted a maintenance plan for Ogden demonstrating attainment through 2030. That plan has been submitted to EPA and is awaiting EPA’s approval (Utah Division of Air Quality 2017f).
Weber and Davis Counties have both been designated as non-attainment areas for PM2.5. Ogden is not in the WDC study area. The WDC Project does not require a conformity determination for CO or PM10, since the parts of Weber and Davis Counties in the WDC study area are in attainment for CO and PM10.
Chapter 11: Air Quality 11-5

The WDC study area includes the northwestern part of Davis County and the southwestern part of Weber County, which are the parts of the counties where the WDC alternatives are located. The WDC study area is shown in Figure 1-1, West Davis Corridor Needs Assessment Study Area, in Volume IV. Table 11-2 above includes summary information about the attainment status of the two counties. Current sources of air pollutants in the WDC study area include wind-blown dust and particulates from exposed soils and agricultural tilling practices, and vehicle emissions (primarily CO) from traffic on existing highways and local roads.
The Utah Division of Air Quality maintains a network of air quality monitoring stations throughout the state. In general, these monitoring stations are located where there are known air quality problems, so they are usually in or near urban areas or close to specific emission sources. Other stations are located in suburban locations or remote areas to provide an indication of regional air pollution levels. Figure 24-3, Air Monitoring Locations, in Volume IV shows a map of the air quality monitoring station locations.
Table 11-3 through Table 11-6 below show the monitoring results for criteria pollutants (CO, PM10, and PM2.5) from 2010 through 2015 at the monitoring stations in Davis and Weber Counties. Figure 24-3, Air Monitoring Locations, in Volume IV shows the location of each monitoring station.
Table 11-3. Summary of CO Monitoring Data for Weber County
Station Parameter (ppm) 2015 2014 2013 2012 2011 2010
Weber County
Ogden (2540 S. Washington Blvd., Ogden)
Peak 1-hour valuea
Peak 8-hour valueb ND ND
ND ND
9.0 2.8
4.4 1.8
2.6 1.8
6.6 2.0
Ogden (228 32nd St., Ogden) Peak 1-hour valuea Peak 8-hour valueb
2.8 2.1
9.4 2.6
2.8 1.0
2.7 2.0
2.8 1.6
16.9 2.4
Source: Utah Division of Air Quality 2017a ND = No data available a 1-hour CO standard = 35 ppm (not to be exceeded more than once per year) b 8-hour CO standard = 9 ppm (not to be exceeded more than once per year)
Table 11-4. Summary of PM10 Monitoring Data for Davis and Weber Counties
Station Parameter (µg/m3) 2015 2014 2013 2012 2011 2010
Davis County
Bountiful #2 (171 West 1370 North, Bountiful)
Peak 24-hour valuea 38 81 54 54 46 116
Weber County
Ogden (228 32nd St., Ogden) Peak 24-hour valuea 96 115 95 95 79 216
Source: Utah Division of Air Quality 2017b a 24-hour PM10 standard = 150 µg/m3 (not to be exceeded more than once per year on average over 3 years)
11-6 Final Environmental Impact Statement

Table 11-5. Summary of PM2.5 Monitoring Data for Davis and Weber Counties
Station Parameter (µg/m3) 2015 2014 2013 2012 2011 2010
Davis Countya
Bountiful (171 West 1370 North, Bountiful)
Peak 24-hour valueb
98th percentilec Annual mean
34.7 20.2 6.1
47.1 43.9 7.4
51.2 45.1 9.5
34.7 25.9 7.6
56.4 33.7 8.4
57.0 43.5 9.0
Weber County
Ogden (228 32nd St., Ogden) Peak 24-hour valueb 98th percentilec Annual mean
44.5 28.0 7.1
67.6 25.7 7.6
67.2 49.4 11.5
63.7 26.7 9.0
64.6 43.8 9.1
56.1 42.1 9.2
Ogden (425 West 2550 North, Ogden)
Peak 24-hour valueb 98th percentilec Annual mean
ND ND ND
ND ND ND
61.9 44.6 10.7
35.4 27.4 7.0
52.6 32.9 7.5
55.3 39.3 8.3
Sources: Utah Division of Air Quality 2017c ND = No data available a Compliance with the PM2.5 annual standard (12 μg/m3) is based on a 3-year average of annual mean
concentrations. b 24-hour PM2.5 standard = 35 µg/m3. c Compliance with the PM2.5 24-hour standard is based on the 98th-percentile value averaged over a 3-year period.
The 98th-percentile values shown in the table for a given year can exceed the 35-µg/m3 standard but would not necessarily cause the NAAQS to be exceeded.
Table 11-6. Summary of NO2 Monitoring Data for Davis and Weber Counties
Station Parameter (ppb) 2015 2014 2013 2012 2011 2010
Davis County
Bountiful (171 West 1370 North, Bountiful)
Peak 1-hour valuea
98th percentileb Annual mean
62.0 43.0 28.26
64.0 48.0 27.71
107.0 52.0 29.74
77.0 39.0 26.42
62.0 42.0 27.61
58.0 41.0 28.26
Weber County
Ogden (228 32nd St., Ogden) Peak 1-hour valuea 98th percentileb Annual mean
54.0 40.0 31.38
60.0 45.0 31.71
73.0 52.0 34.66
55.0 41.0 34.06
66.0 42.0 32.97
82.0 48.0 31.96
Sources: Utah Division of Air Quality 2017d, 2017e ppb = parts per billion a 1-hour NO2 standard = 100 ppb. Annual NO2 standard = 53 ppb. b Compliance with the NO2 1-hour standard is based on the 98th percentile of 1-hour daily maximum concentrations
averaged over a 3-year period.
Chapter 11: Air Quality 11-7
11.4 Environmental Consequences This section describes the effects of the WDC action alternatives on air quality. Air quality effects were evaluated using guidelines and modeling procedures from EPA, FHWA, and the Utah Department of Transportation (UDOT) as applicable to the WDC Project. The impacts of construction activities would be temporary and are discussed in Section 20.3.3, Air Quality Construction Impacts. The operational impacts of the WDC action alternatives would be long-term and would be directly due to highway traffic and vehicle speeds on the highway.
For the WDC air quality analysis, the 2040 No-Action conditions assume that all funded transit and roadway projects in WFRC’s 2040 Regional Transportation Plan, except the WDC, would be in place.
11.4.1 Methodology The FHWA publication Guidance for Preparing and Processing Environmental and Section 4(f) Documents (FHWA 1987) suggests procedures for evaluating air quality impacts associated with transportation projects and provides guidance on completing mesoscale and microscale air quality evaluations. In addition, EPA guidance provides details about the applicability of detailed MOVES2014a and CAL3QHCR modeling requirements for quantitative analyses in PM10, PM2.5, and CO non-attainment and maintenance areas (EPA 1992, 2015a, 2015b). Although CO was modeled with CAL3QHCR for this project, CO can also be modeled with CAL3QHC. Appendix 11A, Air Quality Technical Report, provides more information about the methodology used for the analysis.
11.4.1.1 Mesoscale Evaluations Mesoscale evaluations look at air quality impacts in a project study area and are typically conducted by the local metropolitan planning organization. The WDC team used two types of mesoscale evaluations for the WDC air quality analysis: a regional conformity analysis and a study area emissions inventory.
Conformity Analysis. For the WDC Project, the metropolitan planning organization responsible for completing regional conformity analyses is WFRC. The most recent conformity analysis completed by WFRC is described in Section 11.4.2, Effects on Air Quality.
Emissions Inventory. The WDC team also prepared an emissions inventory that estimates the air quality effects of the WDC alternatives in the WDC study area. The WDC team prepared an emissions inventory using EPA’s Motor Vehicle Emissions Simulator (MOVES2014a) model. The team used the MOVES2014a model to estimate the amounts of CO, NOx, PM10, and PM2.5 (in tons per day or tons per year, as appropriate) in the WDC study area in 2015
What is the West Davis Corridor team?
The West Davis Corridor team consists of the lead agencies for the WDC Project (FHWA and UDOT).
What is the Regional Transportation Plan?
The Regional Transportation Plan developed by WFRC in partnership with UDOT, city and county governments, and other stakeholders is the region’s plan for highway, transit, and other transportation-related improvements to meet the area’s growing transportation needs over the next 30 years.
11-8 Final Environmental Impact Statement
and 2040 with and without the WDC. The team also used the MOVES2014a model to estimate the amount of MSATs due to the project. Greenhouse gases in the WDC study area were also estimated. The results of the project-level MOVES2014a analysis are discussed in Section 11.4.2, Effects on Air Quality.
11.4.1.2 Microscale Evaluations Microscale evaluations look at local air quality impacts from a project.
The WDC team conducted a more detailed project-level quantitative analysis of CO, PM10, and PM2.5 in the vicinity of the Alternative B1 Antelope Drive interchange. The Alternative B1 Antelope Drive interchange was selected for the project-level quantitative analysis because it was the interchange with the highest number of residences located close to the interchange. Additionally, the Alternative B1 Antelope Drive interchange is located close to the Syracuse Arts Academy. None of the other access interchanges that would be constructed with any of the other alternatives would be located close to both residential areas and schools.
The project-level quantitative analysis used the MOVES2014a model to generate project-specific emission rates, which were then incorporated into the CAL3QHCR model (for PM10, PM2.5, and CO) along with other meteorological data and traffic volumes as derived from the travel demand model. The CAL3QHCR model was then used to determine whether the vehicle emissions from the WDC would cause the applicable NAAQS for PM10, PM2.5, or CO to be exceeded at specific receptor locations near the Alternative B1 Antelope Drive interchange. Figure 11A-1, Antelope Drive Air Quality Model Receptors and Links, in Volume IV shows the receptors and interchange links modeled in the project-level quantitative analysis. The results of the project-level quantitative analysis are discussed in Section 11.4.3, Effects on Local Air Quality.
11.4.1.3 Emissions Inventory Methodology for Criteria Pollutants and Mobile-Source Air Toxics
The WDC team used the MOVES2014a model to estimate emissions of criteria pollutants (CO, PM10, and PM2.5); NOx, a precursor to several criteria pollutants; and MSATs from the WDC action alternatives.
The specific boundaries of the WDC study area, which are shown in Figure 1-1, West Davis Corridor Needs Assessment Study Area, in Volume IV, are:
• Northern boundary: 3000 South in Hooper and West Haven • Southern boundary: about Parrish Lane in Centerville • Western boundary: just east of the Great Salt Lake • Eastern boundary: Interstate 15 (I-15)
The traffic data used in the analyses were derived from version 8.1 of the WFRC travel demand model, which was also used in the traffic analyses that supported the alternatives-development process (for more information, see Section 2.2, Alternatives-Development Process for the Final EIS). The traffic data used in the MOVES2014a model included link distances and
Chapter 11: Air Quality 11-9

geometry, lane capacity, average daily traffic volumes for various times of the day, vehicle-miles of travel (VMT), and travel speeds for the various roads in the WDC study area.
The emissions inventory (see Section 11.4.1.2, Microscale Evaluations) included all major roads (including I-15) in the WDC study area, not just the WDC alternatives with their relatively low daily traffic volumes. The WDC team derived additional MOVES2014a input parameters such as VMT fractions (monthly, daily, and hourly), vehicle source types, road types, vehicle age distribution, inspection-maintenance parameters, and local fuel parameters from regional data provided by WFRC.
The amount of daily VMT by motorists in the WDC study area would be similar for all of the action alternatives. The daily VMT would range from about 6,090,400 VMT per day with the No-Action Alternative in 2040 to about 6,270,000 VMT per day with Alternative B1 in 2040 (a difference of about 3% among all alternatives). As a result, any difference in air quality impacts in the WDC study area from the various alternatives would be small.
Alternatives B1 and B2 would have higher traffic volumes than Alternatives A1 and A2. Alternative B1 would have slightly higher traffic volumes than Alternative B2, and Alternative A1 would have slightly higher traffic volumes than Alternative A2. The emissions inventory focuses on Alternatives A1 and B1 because they are the two higher-traffic-volume alternatives of the A and B Alternatives. The emissions with Alternative A2 would be slightly less than the emissions with Alternative A1, and the emissions with Alternative B2 would be slightly less than the emissions with Alternative B1.
Table 11-7 shows the amount of VMT with Alternatives A1 and B1 in 2040 as well as the amounts of VMT under existing conditions in 2015 and with the No-Action Alternative in 2040.
Table 11-7. Vehicle-Miles Traveled in the WDC Study Area
2015 2040
Parameter Existing
Conditions No-Action Alternative
Alternative A1
Alternative B1
Vehicle-miles traveled (VMT) 4,170,900 6,090,400 6,243,800 6,270,900
Sources: Cluff 2016; Horrocks Engineers 2016
11-10 Final Environmental Impact Statement
Analyzing Mobile-Source Air Toxics FHWA has developed a tiered approach to analyzing MSATs in environmental documents, including assessing incomplete or unavailable information as required by 40 CFR 1502.22(b) (FHWA 2016). Under FHWA’s approach to evaluating MSATs, three levels of analysis are identified, depending on the project circumstances and other considerations:
• No analysis required for projects with no potential for meaningful MSAT effects,
• Qualitative analysis for projects with low potential MSAT effects, or
• Quantitative analysis to differentiate alternatives for projects with higher potential MSAT effects.
Projects with low potential MSAT effects include those that are intended to improve the operations of highway, transit, or freight facilities without adding substantial new capacity or without creating a facility that is likely to meaningfully increase MSAT emissions. Examples of projects with low potential MSAT effects include highway-widening projects, new interchanges, and projects for which the design-year traffic volume is projected to be less than 140,000 to 150,000 vehicles per day.
Traffic volumes on the proposed WDC in 2040 are expected to be less than 30,000 vehicles per day, which is well below FHWA’s suggested guideline of 140,000 to 150,000 vehicles per day at which point a quantitative analysis of MSAT effects might be warranted.
Even though the WDC does not meet FHWA’s suggested guideline for a quantitative MSAT analysis, the WDC team used the MOVES2014a model to quantitatively estimate annual MSAT emissions in the WDC study area and differentiate between existing conditions in 2015, conditions in 2040 with the No-Action Alternative, and conditions in 2040 with the action alternatives. The emissions estimate conducted for the WDC Project included all major roads in the WDC study area (including I-15), not just the WDC alternatives with their relatively low daily traffic volumes.
The emissions in the WDC study area are much greater than the emissions for just the WDC action alternatives. However, because the WDC would change travel patterns and expected traffic volumes on the other major roads in the WDC study area, using the WDC study area shows the differences in emissions among the No-Action Alternative and the WDC action alternatives.
What are quantitative and qualitative analyses?
A quantitative analysis is one that estimates specific numeric results, such as an increase in the number of vehicle-miles traveled. A qualitative analysis looks at impacts in more general and comparative terms.
What is a design year?
The design year is the year for which a project is engineered. Design years for infrastructure projects are typically 20 to 30 years from the year of construction in order to provide long-term benefits. The design year for the WDC is 2040.
Chapter 11: Air Quality 11-11

11.4.2 Effects on Air Quality in the WDC Study Area
11.4.2.1 Emissions Inventory for Criteria Pollutants Table 11-8 below shows the results of the MOVES2014a emissions inventory for CO, PM10, PM2.5, and NOx under existing conditions and with the No-Action Alternative and Alternatives A1 and B1 in the WDC study area.
No-Action Alternative With the No-Action Alternative, the WDC would not be built. However, other regionally significant transportation projects identified in WFRC’s long-range plans and by the local communities would be built with or without the WDC, and these projects would contribute to local air quality impacts throughout the WDC study area.
As shown below in Table 11-8, daily VMT in the WDC study area between 2015 and 2040 are expected to increase by more than 46% due to population and development growth in the study area. This growth will occur with or without the WDC. However, over the same period, daily emissions of criteria pollutants are expected to decrease as shown below in Table 11-8.
The increased PM10 emissions in 2040 are a result of increased road dust emissions (road dust emissions increase with increasing VMT). PM10 emissions without the road dust component (that is, PM10 emissions from vehicle exhaust, tire wear, and brake wear) are expected to decrease compared to emissions in 2015 from the same emission sources. The expected decrease in emissions in 2040 is due to improved emission standards in the future as well as improved fuel standards resulting in lower emissions.
11-12 Final Environmental Impact Statement

Chapter 11: Air Quality 11-13
Table 11-8. Emissions of Criteria Pollutants with Alternatives A1 and B1 in the WDC Study Area
2015 2040
Parameter
Emissions under
Existing Conditions
No-Action Alternative Alternative A1 Alternative B1
Emissions with No-Action
Alternative
Percent Change from Existing
Conditions
Emissions with
Alternative A1
Percent Change from
No-Action
Emissions with
Alternative B1
Percent Change from
No-Action
VMT (million miles/day) 4.17 6.09 46.0% 6.24 2.5% 6.27 3.0%
CO (tons/day) 22.51 12.77 –43.2% 13.18 3.21% 13.28 3.99%
Particulate matter NOx (tons/day) 4.023 1.061 –73.6% 1.095 3.20% 1.102 3.86% PM10 (tons/day)a 1.391 1.628 17.04% 1.656 1.72% 1.664 2.21% PM2.5 (tons/day)b 0.118 0.075 –36.44% 0.076 1.33% 0.076 1.33%
a PM10 emissions include vehicle exhaust emissions, tire wear, brake wear, and road dust. b PM2.5 emissions include vehicle exhaust emissions, tire wear, and brake wear.
WDC Action Alternatives As described in Section 11.4.1.3, Emissions Inventory Methodology for Criteria Pollutants and Mobile-Source Air Toxics, the emissions inventory focuses on two of the four WDC action alternatives: Alternatives A1 and B1. The emissions with Alternative A2 would be slightly less than the emissions with Alternative A1, and the emissions with Alternative B2 would be slightly less than the emissions with Alternative B1. More information about the WDC action alternatives and the preferred alternative is provided in Chapter 2, Alternatives, and in the Executive Summary of this Final EIS.
Alternative A1
As shown above in Table 11-8, daily VMT in the WDC study area with Alternative A1 would increase by 2.5% over the daily VMT with the No-Action Alternative in 2040. Daily emissions of criteria pollutants in the study area would increase by about 1.3% to 3.2%, depending on the pollutant, over emissions with the No-Action Alternative in 2040.
Alternative B1
As shown above in Table 11-8, daily VMT in the WDC study area with Alternative B1 would increase by about 3% over the daily VMT with the No-Action Alternative in 2040 (slightly more than with Alternative A1). Daily emissions of criteria pollutants in the study area would increase by about 1.3% to 4.0%, depending on the pollutant, over emissions with the No-Action Alternative in 2040.
11.4.2.2 Incomplete and Unavailable Information for Mobile-Source Air Toxics
This section presents an evaluation of MSAT emissions from the WDC. In FHWA’s view, information is incomplete or unavailable to credibly predict the project-specific health impacts due to changes in MSAT emissions associated with a proposed set of highway alternatives (for example, the WDC action alternatives). The outcome of such an assessment, adverse or not, would be influenced more by the uncertainty introduced into the process through assumption and speculation rather than any genuine insight into the actual health impacts directly attributable to MSAT exposure associated with a proposed action.
EPA is responsible for protecting the public health and welfare from any known or anticipated effect of an air pollutant. EPA is the lead authority for administering the Clean Air Act and its amendments and has specific statutory obligations with respect to hazardous air pollutants and MSATs. EPA is in the continual process of assessing human health effects, exposures, and risks posed by air pollutants. It maintains the Integrated Risk Information System (IRIS), which is “a compilation of electronic reports on specific substances found in the environment and their potential to cause human health effects” (https://www.epa.gov/iris). Each report contains assessments of non-cancerous and cancerous effects for individual compounds and quantitative estimates of risk levels from lifetime oral and inhalation exposures with uncertainty spanning perhaps an order of magnitude.
11-14 Final Environmental Impact Statement

Other organizations are also active in the research and analysis of the human health effects of MSATs, including the Health Effects Institute (HEI). A number of HEI studies are summarized in Appendix D of FHWA’s Updated Interim Guidance on Mobile-Source Air Toxic Analysis in NEPA Documents (FHWA 2016). Among the adverse health effects linked to MSAT compounds at high exposures are cancer in humans in occupational settings, cancer in animals, and irritation to the respiratory tract, including the exacerbation of asthma. Less obvious are the adverse human health effects of MSAT compounds at current environmental concentrations (HEI 2007) or in the future as vehicle emissions substantially decrease.
The methodologies for forecasting health impacts include emissions modeling, dispersion modeling, exposure modeling, and then final determination of health impacts—each step in the process building on the model predictions obtained in the previous step. All are encumbered by technical shortcomings or uncertain science that prevents a more complete differentiation of the MSAT health impacts among a set of project alternatives. These difficulties are magnified for lifetime (that is, 70-year) assessments, particularly because unsupportable assumptions would have to be made regarding changes in travel patterns and vehicle technology (which affects emissions rates) over that timeframe, since such information is unavailable.
It is particularly difficult to reliably forecast 70-year lifetime MSAT concentrations and exposure near roads, to determine the portion of time that people are actually exposed at a specific location, and to establish the extent attributable to a proposed action, especially given that some of the information needed is unavailable.
There are considerable uncertainties associated with the existing estimates of toxicity of the various MSATs because of factors such as low-dose extrapolation and translation of occupational exposure data to the general population, a concern that has been expressed by HEI (2007). As a result, there is no national consensus on air dose-response values assumed to protect the public health and welfare for MSAT compounds, and in particular for diesel PM. EPA states that, with respect to diesel engine exhaust, “[t]he absence of adequate data to develop a sufficiently confident dose-response relationship from the epidemiologic studies has prevented the estimation of inhalation carcinogenic risk” (EPA 2003).
There is also the lack of a national consensus on an acceptable level of risk. The current context is the process used by EPA as provided by the Clean Air Act to determine whether more-stringent controls are required in order to provide an ample margin of safety to protect public health or to prevent an adverse environmental effect for industrial sources subject to the maximum achievable control technology standards, such as benzene emissions from refineries. The decision framework is a two-step process. The first step requires EPA to determine an “acceptable” level of risk due to emissions from a source, which is generally no greater than approximately 100 in a million. Additional factors are considered in the second step, the goal of which is to maximize the number of people with risks less than 1 in a million due to emissions from a source.
The results of this statutory two-step process do not guarantee that cancer risks from exposure to air toxics are less than 1 in a million; in some cases, the residual risk determination could result in maximum individual cancer risks that are as high as approximately 100 in a million.
Chapter 11: Air Quality 11-15
In a June 2008 decision, the U.S. Court of Appeals for the District of Columbia Circuit upheld EPA’s approach to addressing risk in its two-step decision framework. Information is incomplete or unavailable to establish that even the largest of highway projects would result in levels of risk greater than those deemed acceptable.
Because of the limitations in the methodologies for forecasting health impacts, any predicted difference in health impacts between alternatives is likely to be much smaller than the uncertainties associated with predicting the impacts. Consequently, the results of such assessments would not be useful to decision-makers, who would need to weigh this information against project benefits, such as reducing traffic congestion, accident rates, and fatalities plus improved access for emergency response, that are better suited for quantitative analysis.
Table 11-9 below shows the MSAT emissions inventory modeling results for Alternatives A1 and B1. Annual emissions for each individual MSAT would decrease with the No-Action Alternative relative to existing conditions due to EPA’s ongoing programs to control hazardous air pollutants from mobile sources. Despite an increase of nearly 46% in VMT between existing conditions and the No-Action Alternative, all MSAT emissions would decrease by a range of about 50% to more than 90% depending on the individual air toxic.
With Alternatives A1 and B1, the annual amount of MSATs emitted would be proportional to the VMT, assuming that other variables such as fleet mix are the same for each alternative. The VMT estimated for each alternative are no more than 3.0% greater than the VMT with the No-Action Alternative in 2040 and would be lower than the emissions in 2015.
This slight increase in VMT would lead to slightly higher MSAT emissions for the action alternatives along the WDC. The emissions increase would be offset somewhat by lower MSAT emission rates due to the increased speeds of vehicles on the WDC. The extent to which these speed-related emission decreases would offset VMT-related emissions increases cannot be reliably projected due to the inherent limitations of technical models. Because the estimated VMT with each of the action alternatives vary by less than 3%, the WDC team expects no appreciable difference in overall MSAT emissions among the action alternatives.
11-16 Final Environmental Impact Statement

Table 11-9. Emissions of Mobile-Source Air Toxics with Alternatives A1 and B1 in the WDC Study Area
Scenario
Daily VMT
(millions)
Tons per Year
Acrolein Benzene 1,3-
Butadiene Naph-
thalene Form-
aldehyde Acet-
aldehyde Ethyl
Benzene
Diesel Particulate
Matter
Polycyclic Organic Matter
Existing Conditions in 2015
Existing 4.17 0.179 5.058 0.373 0.372 3.028 1.754 2.123 6.275 0.203
With the WDC Alternatives in 2040
No-Action 6.09 0.0560 2.177 0.0020 0.1375 1.243 0.588 0.777 1.238 0.0589 A1 6.24 0.0633 2.445 0.0022 0.1413 1.394 0.565 0.790 1.249 0.0612 B1 6.27 0.0636 2.458 0.0022 0.1400 1.400 0.568 0.794 1.257 0.0605
Chapter 11: Air Quality 11-17

11.4.2.3 Greenhouse Gases Human activity is changing the earth’s climate by causing the buildup of heat-trapping greenhouse gas (GHG) emissions through the burning of fossil fuels and other human activities. Carbon dioxide (CO2) is the largest component of human-produced emissions; other prominent emissions include methane (CH4), nitrous oxide (N2O), and hydrofluorocarbons. These emissions are different from criteria air pollutants since their effects in the atmosphere are global rather than local, and also since they remain in the atmosphere for decades to centuries, depending on the species.
GHG emissions have accumulated rapidly as the world has industrialized, with concentration of atmospheric CO2 increasing form roughly 300 parts per million (ppm) in 1900 to over 400 ppm today. Over this timeframe, global average temperatures have increased by roughly 1.5 degrees Fahrenheit (1 degree Celsius), and the most rapid increases have occurred over the past 50 years. Scientists have warned that significant and potentially dangerous shifts in climate and weather are possible without substantial reductions in GHG emissions. They commonly have cited 2 degrees Celsius (1 degree Celsius beyond warming that has already occurred) as the total amount of warming the earth can tolerate without serious and potentially irreversible climate effects. For warming to be limited to this level, atmospheric concentrations of CO2 would need to stabilize at a maximum of 450 ppm, requiring annual global emissions to be reduced 40% to 70% below 2010 levels by 2050 (IPCC 2014).
State and national governments in many developed countries have set GHG emissions-reduction targets of 80% below current levels by 2050, recognizing that post-industrial economies are primarily responsible for GHGs already in the atmosphere. As part of a 2014 bilateral agreement with China, the United States pledged to reduce GHG emissions 26% to 28% below 2005 levels by 2025; this emissions reduction pathway is intended to support economy-wide reductions of 80% or more by 2050 (The White House 2014).
GHG emissions from vehicles using roads are a function of distance traveled (expressed as VMT), vehicle speed, and road grade. A major factor in mitigating increases in VMT is EPA’s GHG emissions standards, implemented in concert with national fuel economy standards. The U.S. Energy Information Administration projects that vehicle energy efficiency (and thus, GHG emissions) on a per-mile basis will improve by 28% between 2012 and 2040 (EIA 2016). This improvement in vehicle emissions rates is more than sufficient to offset the increase in VMT.
Construction and subsequent maintenance of the selected WDC alternative would generate GHG emissions. Preparing the roadway corridor (for example, by earth-moving activities) would involve a considerable amount of energy consumption and resulting GHG emissions; manufacturing of the materials used in construction and fuel used by construction equipment would also contribute GHG emissions. Typically, construction emissions associated with a new road account for about 5% of the total 20-year lifetime emissions from the road, although this can vary widely with the extent of construction activity and the number of vehicles that use the road.
The addition of new road-miles to the roadway network in the WDC study area would also increase the energy and GHG emissions associated with maintaining those new road-miles in
11-18 Final Environmental Impact Statement

the future. The increase in maintenance needs as a result of adding new roadway infrastructure would be partially offset by the reduced need for maintenance on existing routes (because of lower total traffic and truck volumes on those routes).
Greenhouse Gas Inventory EPA’s MOVES2014a model can be used to estimate vehicle exhaust emissions of CO2 and other GHGs. CO2 is frequently used as an indicator of overall transportation GHG emissions because the quantity of these emissions is much larger than that of all other transportation GHGs combined, and because CO2 accounts for 90% to 95% of the overall climate impact from transportation sources. For informational purposes, the WDC team used the MOVES2014a model to estimate GHG emissions in the WDC study area with the No-Action Alternative and Alternatives A1 and B1. Input parameters for the model were the same as those used for other MOVES2014a analyses. Table 11-10 shows the GHG emissions associated with the WDC.
Table 11-10. Emissions of Greenhouse Gases with Alternatives A1 and B1 in the WDC Study Area in 2040 in tons per year
2015 2040
Greenhouse Gas Existing
Conditions No-Action Alternative
Emissions and Percent Change from No-Action Alternative
Alternative A1 Alternative B1
Methane (CH4) 10.208 7.528 7.645 (+1.55%) 7.684 (+2.07%) Nitrous oxide (N2O) 2.461 2.154 2.144 (–0.46%) 2.150 (–0.19%) Atmospheric CO2 519,121 489,027 498,140 (+1.86%) 500,884 (+2.42%)
Total 519,134 489,037 489,150 (+1.86%) 500,894 (+2.42%)
As shown in Table 11-10 above, GHG emissions would decrease in 2040 due to improvements in vehicle emission rates, even with increased VMT in 2040. There are minor increases in the modeled GHG emissions for the WDC action alternatives compared to the No-Action Alternative. When comparing the 2040 No-Action and action alternatives, the GHG emissions would increase by about 1.5% to 2.5% depending on the GHG.
To help address the global issue of climate change, the U.S. Department of Transportation (USDOT) is committed to reducing GHG emissions from vehicles traveling on highways. USDOT and EPA are working together to reduce these emissions by substantially improving vehicle efficiency standards and moving toward less-carbon-intensive fuels. The agencies have jointly established new, more-stringent fuel economy standards and the first-ever GHG emissions standards for cars and light trucks in model years 2012 to 2025, with an ultimate real-world fuel economy goal of 36 miles per gallon for cars and light trucks by model year 2025. In addition, on September 15, 2011, the agencies jointly published the first-ever fuel economy and GHG emissions standards for heavy-duty trucks and buses. Also, increasing use
Chapter 11: Air Quality 11-19

of technological innovations that can improve fuel economy, such as gasoline- and diesel-electric hybrid vehicles, will improve air quality and reduce CO2 emissions in future years.
In Utah, the Governor’s Blue Ribbon Advisory Council on Climate Change identified measures that the State could take to minimize the impacts of transportation-related GHG emissions. The recommended measures include reducing VMT through developing and encouraging the use of mass transit, ridesharing, and telecommuting. Other strategies identified in the Advisory Council’s report include promoting alternative fuels and hybrid vehicles and vehicle technologies resulting in greater fuel efficiency. In addition, the report encourages an idle-reduction program for school buses and heavy-duty trucks (BRAC 2007).
Finally, the construction best practices described in Section 20.3.3.1, Mitigation Measures for Construction-Related Impacts to Air Quality, are practicable project-level measures that could help reduce GHG emissions on an incremental basis and could contribute in the long term to meaningful cumulative reduction when considered across the federal-aid highway program.
11.4.3 Effects on Local Air Quality The transportation conformity regulations (40 CFR 93.123) require project-level quantitative analyses for certain types of transportation projects that are located in CO, PM10, and PM2.5 non-attainment and maintenance areas. However, project-level quantitative analyses for PM10 or PM2.5 are required only for projects that are of “local air quality concern.” According to the transportation conformity guidance, examples of projects that could be of local air quality concern for PM10 or PM2.5 and require project-level quantitative analysis could include:
• A new highway or expressway that serves a significant amount of diesel truck traffic, such as facilities with greater than 125,000 annual average daily traffic (AADT) and 8% or more such AADT is diesel truck traffic (EPA 2015b, Appendix B, page B-1)
Projects that are not considered to be of air quality concern for PM10 or PM2.5 and that would not require project-level quantitative analysis include:
• Any new or expanded highway that primarily services gasoline-powered vehicle traffic (that is, does not involve a significant number or increase in the number of diesel vehicles), including such projects involving congested intersections operating at levels of service (LOS) of D, E, or F (EPA 2015b, Appendix B, page B-2)
The WDC would be located in an attainment area for CO and PM10; therefore, a project-level quantitative analysis is not required for those pollutants.
The WDC is intended to reduce congestion in western Davis County and facilitate local traffic movement in the growing part of the county. The WDC would not connect to I-15 at its north end and is not expected to have a substantial
What is level of service (LOS)?
Level of service is a measure of the operating conditions on a road or at an intersection. Level of service is represented by a letter “grade” ranging from A (free-flowing traffic and little delay) to F (extremely congested, stop-and-go traffic and excessive delay). LOS B through LOS E represent progressively worse operating conditions.
11-20 Final Environmental Impact Statement
number of diesel trucks. As described in Section 2.5.4, Operational Characteristics of the WDC, the highest daily traffic volumes associated with the WDC alternatives are less than 30,000 vehicles per day, which is well below EPA’s example of 125,000 vehicles per day at which project-level quantitative modeling could be warranted for PM2.5. Section 2.5.4 also shows that the expected amount of truck traffic on the WDC is no more than 8% of the total vehicles.
Therefore, because the WDC would have low traffic volumes and a relatively small volume of diesel truck traffic, under the transportation conformity regulations and guidelines, the WDC Project is not a project of air quality concern. Since the WDC Project is not a project of air quality concern, project-level quantitative modeling for PM2.5 is not required.
Even though detailed transportation conformity modeling is not required for the WDC, for this EIS and for NEPA disclosure purposes, the WDC team used the MOVES2014a and CAL3QHCR models to prepare project-level quantitative analyses for CO, PM10, and PM2.5 at the Alternative B1 Antelope Drive interchange. This interchange was selected for detailed modeling because it would have nearby residences and a school (the Syracuse Arts Academy) that could be exposed to vehicle emissions. The WDC team also received many comments from the public questioning the air quality impacts at this location. In addition, comments were received about other schools along the alternatives including elementary schools in Farmington and Kaysville. The Syracuse interchange location would be representative of potential impacts along the entire WDC.
Although these quantitative analyses are for disclosure purposes only and are not conformity determinations, they followed the transportation conformity procedures. Transportation conformity procedures require project-level quantitative analyses to evaluate emissions associated with the year of expected peak emissions from a project. For CO, PM10, and PM2.5, the year of expected peak emissions at the project level for the WDC Project would be after the WDC is completed in 2040 and the maximum number of vehicles are using the facility on a daily basis. Although vehicle emission rates are expected to be lower in 2040 than they are today (thereby improving air quality in the WDC study area), VMT on the WDC would be at its highest; therefore, the highest project-level CO, PM10, and PM2.5, emissions would be in 2040.
11.4.3.1 Project-Level Quantitative Analyses for CO Detailed modeling for CO was conducted at the Alternative B1 Antelope Drive interchange using the MOVES2014a model and EPA guidelines for project-level CO analyses (EPA 1992, 2015c).
The WDC team used MOVES2014a emission rates (see Section 11.4.3, Effects on Local Air Quality) for CO in the CAL3QHCR model to estimate CO concentrations at residences near the Alternative B1 Antelope Drive interchange and at residences close to the WDC mainline north and south of this interchange. The CAL3QHCR model uses speed-related emission rates in conjunction with roadway geometry, wind direction, and other meteorological data to estimate 1-hour CO concentrations at receptor locations near the highway.
Chapter 11: Air Quality 11-21
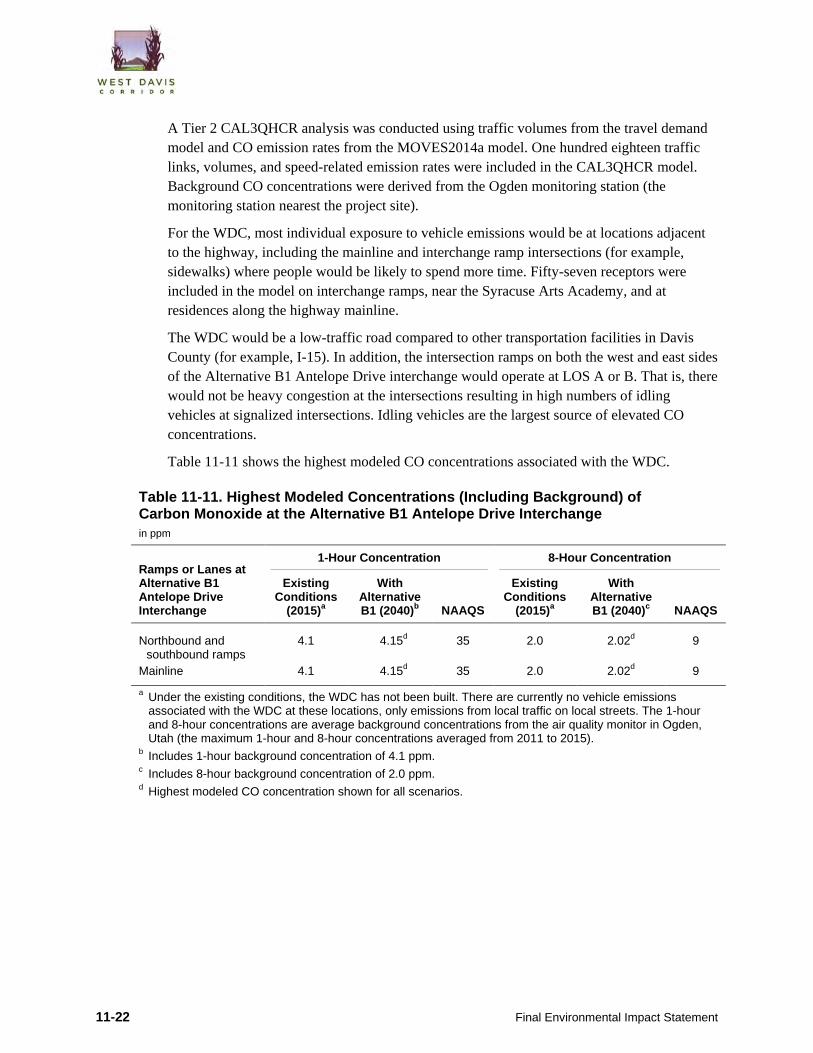
A Tier 2 CAL3QHCR analysis was conducted using traffic volumes from the travel demand model and CO emission rates from the MOVES2014a model. One hundred eighteen traffic links, volumes, and speed-related emission rates were included in the CAL3QHCR model. Background CO concentrations were derived from the Ogden monitoring station (the monitoring station nearest the project site).
For the WDC, most individual exposure to vehicle emissions would be at locations adjacent to the highway, including the mainline and interchange ramp intersections (for example, sidewalks) where people would be likely to spend more time. Fifty-seven receptors were included in the model on interchange ramps, near the Syracuse Arts Academy, and at residences along the highway mainline.
The WDC would be a low-traffic road compared to other transportation facilities in Davis County (for example, I-15). In addition, the intersection ramps on both the west and east sides of the Alternative B1 Antelope Drive interchange would operate at LOS A or B. That is, there would not be heavy congestion at the intersections resulting in high numbers of idling vehicles at signalized intersections. Idling vehicles are the largest source of elevated CO concentrations.
Table 11-11 shows the highest modeled CO concentrations associated with the WDC.
Table 11-11. Highest Modeled Concentrations (Including Background) of Carbon Monoxide at the Alternative B1 Antelope Drive Interchange in ppm
Ramps or Lanes at Alternative B1 Antelope Drive Interchange
1-Hour Concentration 8-Hour Concentration
Existing Conditions
(2015)a
With Alternative B1 (2040)b NAAQS
Existing Conditions
(2015)a
With Alternative B1 (2040)c NAAQS
Northbound and southbound ramps
4.1 4.15d 35 2.0 2.02d 9
Mainline 4.1 4.15d 35 2.0 2.02d 9
a Under the existing conditions, the WDC has not been built. There are currently no vehicle emissions associated with the WDC at these locations, only emissions from local traffic on local streets. The 1-hour and 8-hour concentrations are average background concentrations from the air quality monitor in Ogden, Utah (the maximum 1-hour and 8-hour concentrations averaged from 2011 to 2015).
b Includes 1-hour background concentration of 4.1 ppm. c Includes 8-hour background concentration of 2.0 ppm. d Highest modeled CO concentration shown for all scenarios.
11-22 Final Environmental Impact Statement

No-Action Alternative With the No-Action Alternative, the WDC would not be built, so there would be no CO emissions from the proposed WDC. CO emissions would continue to be generated by vehicles using other roads, such as Bluff Road and Antelope Drive, in the WDC study area.
WDC Action Alternatives Davis County is an attainment area for CO, so there are no CO monitors in Davis County. The nearest CO monitors are in the Ogden CO maintenance area. Worst-case CO background concentrations near the Alternative B1 Antelope Drive interchange were calculated by averaging the highest measured 1-hour and 8-hour concentrations from the Ogden monitor over the period 2011 through 2015. As a result, the background CO concentrations used for this CO evaluation are higher than what would be expected in Davis County.
The modeled CO concentrations at all receptor locations in the vicinity of this interchange are well below the 1-hour and 8-hour NAAQS. Though this location would have higher traffic volumes and would be adjacent to residences and a school, the modeling did not predict that CO levels would exceed the NAAQS. Therefore, none of the WDC action alternatives are estimated to produce CO levels that would exceed the NAAQS.
11.4.3.2 Project-Level Quantitative Analyses for PM10 and PM2.5 The WDC would be located in an attainment area for PM10; therefore, a project-level quantitative analysis is not required for PM10.
According to the transportation conformity regulations in 40 CFR 93.123(b), project-level quantitative analyses for PM2.5 are required for “projects of air quality concern.” A new highway could be considered a “project of air quality concern” if it is expected to carry traffic volumes of at least 125,000 vehicles per day (vpd) with 8% or more truck traffic (that is, at least 10,000 trucks per day). As described in Section 2.5.4, Operational Characteristics of the WDC, the highest daily traffic volumes associated with the WDC alternatives would be less than 30,000 vehicles per day, which is well below EPA’s example of 125,000 vehicles per day at which project-level quantitative modeling could be required for PM2.5. Section 2.5.4 also shows that the expected amount of truck traffic on the WDC is no more than 8% of the total vehicles.
Therefore, because the WDC would have low traffic volumes and a small amount of truck traffic, under the transportation conformity regulations the WDC Project is not considered a project of air quality concern. Since the WDC Project is not a project of air quality concern, project-level quantitative modeling for PM2.5 is not required to demonstrate transportation conformity and quantitative PM2.5 analysis is not required under the transportation conformity regulations. For more information, see Section 11.4.5, Transportation Conformity.
Even though project-level quantitative modeling for PM10 and PM2.5 is not required by the transportation conformity regulations, the WDC team decided to perform such modeling for this EIS for NEPA disclosure purposes. The WDC team used the MOVES2014a and CAL3QHCR models to estimate PM10 and PM2.5 design values at residential receptors near
Chapter 11: Air Quality 11-23

the Alternative B1 Antelope Drive interchange (the same receptor locations used for the CO modeling discussed above). Similar to the CO modeling, a detailed Tier 2 CAL3QHCR analysis was prepared for PM10 (24-hour standard) and PM2.5 (24-hour and annual standards).
Following EPA guidelines for project-level quantitative analyses, the WDC team developed vehicle emission rates in 2040 from the MOVES2014a model for the following months (and hours of the day):
• January (8 AM, noon, 6 PM, and 10 PM) • April (8 AM, noon, 6 PM, and 10 PM) • July (8 AM, noon, 6 PM, and 10 PM) • October (8 AM, noon, 6 PM, and 10 PM)
Fifty-seven model receptors that were closest to the mainline alignment and interchange ramps were included in the model to capture the highest emissions from the alignment.
In addition, the WDC team obtained a 5-year meteoro-logical data set (2011 to 2015) from the Ogden-Hinckley Municipal Airport and used it in the CAL3QHCR model input file. Weather directly influences air quality, and important meteorological factors include wind speed and direction, atmospheric stability, temperature, sunlight intensity, and mixing height.
In general, weather patterns along the Wasatch Front exhibit a characteristic daily pattern. Winds generally flow out over the Great Salt Lake during the night and early-morning hours as the land cools off more quickly than the surface of the lake. This process is reversed during the afternoon and evening hours when the lake surface is cooler than the surface of the land (Utah Division of Air Quality 2012). The WDC team concluded that the 2011 to 2015 5-year meteorological data file from the Ogden-Hinckley airport is representative of typical conditions along the Wasatch Front, is relatively close to the proposed location of the WDC, and is appropriate for use in the CAL3QHCR model for this project.
A Tier 2 CAL3QHCR analysis was conducted using traffic volumes from the travel demand model and PM2.5 emission rates from the MOVES2014a model. One hundred eighteen traffic links, volumes, and speed-related emission rates were included in the CAL3QHCR model. Monitor values, receptor values, and design values for PM10 and PM2.5 were calculated according to EPA procedures and guidelines (EPA 2015c). The EPA guidelines have a specific procedure and calculation for each monitor value, receptor value, and design value shown in Table 11-12 below. These specific procedures and calculations are described in more detail in Appendix 11A, Air Quality Technical Report.
Table 11-12 shows the CAL3QHCR model results at modeled receptors around the Alternative B1 Antelope Drive interchange.
What is mixing height?
Mixing height is the height at which vertical mixing of air takes place.
11-24 Final Environmental Impact Statement

Table 11-12. Design Values for PM10 and PM2.5 at the Alternative B1 Antelope Drive Interchange in 2040 in μg/m3
PM10 and PM2.5 Design Values Calculated from
CAL3QHRC Analysis
PM10 PM2.5
24-hour Average 24-hour Average Annual Average
NAAQS 150 35 12 Background concentrationa (Ogden, Utah, monitor) 92 33.7 8.6 Receptor valuea 2.4 0.9 0.7 Design valuea 90 35 9.4 Is design value ≤ NAAQS? Yes Yes Yes
a Monitor, receptor, and design values calculated per EPA guidelines (EPA 2015a). Design values are the sum of the monitor value and the receptor value. Design values are rounded according to EPA guidelines. Appendix A, Air Quality Technical Report, provides additional information about the data sources and methodology used for the analysis.
No-Action Alternative With the No-Action Alternative, the WDC would not be built, so there would be no PM emissions due to the proposed WDC. PM emissions would continue to be generated by vehicles using other roads in the WDC study area, such as Bluff Road and Antelope Drive. PM emissions with the No-Action Alternative would be similar to background concentrations in other suburban areas. Because both Davis and Weber Counties are non-attainment areas for PM2.5, if Davis and Weber Counties exceed the PM2.5 NAAQS during winter inversions in the future, the WDC study area and the Antelope Drive area in Syracuse would also likely exceed the PM2.5 NAAQS.
WDC Action Alternatives As shown in Table 11-12 above, the design values calculated for PM10 and PM2.5 following EPA guidance for quantitative hot-spot analyses would be less than or equal to their respective NAAQS and would not be exceeded under the modeling procedures used in the MOVES2014a and Tier 2 CAL3QHCR analyses for both PM10 and PM2.5.
Therefore, none of the WDC action alternatives would result in design-value PM10 or PM2.5 concentrations that would exceed the NAAQS. As shown in Table 11-12 above, the modeling predicts that the PM2.5 24-hour average design value would be equal to the NAAQS of 35 µg/m3 for the 24-hour average. However, the modeling shows that the project-specific calculated receptor values at the Antelope Drive interchange are a relatively small proportion of the overall design value for PM2.5 compared to the Ogden monitor value. The modeling shows that 24-hour average design values are primarily a function of the Ogden monitor value of 33.7 µg/m3 for the area.
The PM2.5 modeling data for Davis and Weber County show that background values for PM2.5 are low with the exception of the occurrences under inversion conditions during the winter.
Chapter 11: Air Quality 11-25

As previously stated in Section 11.3, Affected Environment, both Davis and Weber Counties are PM2.5 non-attainment areas, and the State of Utah will be preparing and submitting SIP revisions that comply with the statutory and regulatory requirements for serious PM2.5 non-attainment areas. These SIP revisions will describe how the State will get the area to be in compliance with the PM2.5 24-hour average NAAQS.
As discussed in Section 11.4.2.1, Emissions Inventory for Criteria Pollutants, the PM2.5 emissions in 2040 in the entire WDC study area for any of the action alternatives are predic-ted to be about 30% to 35% less than they were in 2015 due to lower vehicle emission rates.
11.4.4 Wetland Avoidance Options Two wetland avoidance options are being evaluated in this Final EIS, as shown in Table 11-13. The purpose of these options is to avoid wetland impacts per guidance from the U.S. Army Corps of Engineers on wetland avoidance. Either wetland avoidance option could be implemented with any of the A or B Alternatives.
In this section, the impact information for the wetland avoidance options provides only the differences in impacts for the A and B Alternatives as a result of using the wetland avoidance options. The differences in impacts would apply to any of the A and B Alternatives if they were to use the wetland avoidance options.
Table 11-13. Components of the Wetland Avoidance Options
Option Location City Description
Farmington Prairie View Drive and West Ranches Road
Farmington Shift the A and B Alternatives in Farmington about 150 feet east to the southwest side of the intersection of Prairie View Drive and West Ranches Road.
Layton 2200 West and 1000 South
Layton Shift the A and B Alternatives in Layton about 500 feet east to the northeast side of the intersection of 2200 West and 1000 South.
There would be no difference in air pollutant emission impacts from the wetland avoidance options because there would be no difference in VMT between the alternatives with the wetland avoidance options and the alternatives without the wetland avoidance options.
11-26 Final Environmental Impact Statement

11.4.5 Transportation Conformity The analyses summarized in Section 11.4.3, Effects on Local Air Quality, were conducted in order to disclose the likely impacts of the project pursuant to NEPA. However, as discussed in Section 11.2.3, Transportation Conformity Requirements, transportation conformity requirements also apply to this action. Section 176(c) of the Clean Air Act, and its related amendments, require that transportation plans, programs, and projects that are developed, funded, or approved by FHWA and metropolitan planning organizations must demonstrate that such activities conform to the SIP. Transportation conformity requirements apply to any transportation-related criteria pollutants for which the project area has been designated a non-attainment or maintenance area. The WDC study area is in a non-attainment area for PM2.5. Since the WDC study area is in an attainment area for carbon monoxide, PM10, O3, and NO2, a transportation conformity determination is not required for these pollutants.
According to Section 176(c) of the Clean Air Act, a transportation project is said to “conform” to the provisions and purposes of the SIP if the project, both alone and in combination with other planned projects, does not:
• Cause or contribute to new air quality violations of the NAAQS, • Worsen existing violations of the NAAQS, or • Delay timely attainment of the NAAQS or required interim milestones.
The WDC is included in the conforming Amended WFRC 2015–2040 Regional Transportation Plan (WFRC 2016), and the design concept and scope of the project are consistent with the project evaluated as part of the regional emissions analysis for the plan’s conformity determination. This regional emissions analysis found that all of the regionally significant transportation projects included in WFRC’s Regional Transportation Plan, including the WDC Project, would conform to the CO and PM10 emission budgets in the SIP as well as to the applicable PM2.5 regulatory requirements that were in place at the time of the analysis.
As stated in Section 11.4.3.2, Project-Level Quantitative Analyses for PM10 and PM2.5, no hot-spot analysis is required for PM2.5 because the WDC Project is not a project of air quality concern under 40 CFR 93.123(b). Since there is no approved SIP for PM2.5, 40 CFR 93.117 (compliance with PM2.5 control measures in the SIP) does not apply. Thus, the WDC Project complies with all applicable conformity requirements of 40 CFR 93.
Chapter 11: Air Quality 11-27

11.4.6 Mitigation Measures The analyses conducted for the WDC Project show that the WDC would not cause an exceedance of the applicable transportation-related criteria pollutants for which NAAQS have been established. Due to EPA’s ongoing programs to control hazardous air pollutants from mobile sources, annual MSAT emissions with the No-Action Alternative would decrease by a range of about 50% to more than 90% despite a 46% increase in VMT from 2015 to 2040.
VMT with any of the action alternatives would be similar to VMT with the No-Action Alternative, and MSAT emissions are also expected to be similar.
GHG emissions would increase in 2040 due to the higher number of vehicles and increased VMT in 2040. This increase would occur with or without the WDC. According to the analyses conducted for the WDC, the action alternatives would have similar GHG emissions, and these additional amounts of GHGs would be small compared to the expected amount without the WDC.
Because the WDC would not cause violations of existing air quality standards and would cause small increases for other pollutants such as MSATs and GHGs, no mitigation measures are proposed.
11.4.7 Cumulative Impacts Regional modeling conducted by WFRC for the 2040 transportation conformity analyses demonstrated that all regionally significant transportation projects (including the WDC) would be in compliance with the NAAQS.
Fugitive Dust. During construction of the WDC and other developments in the WDC study area, fugitive-dust-control measures would be needed in certain areas to protect disturbed soils from wind erosion until permanent, stabilized cover is established. After the construction phase is completed, the soil would have a lower potential for wind erosion compared to its undeveloped state.
Vehicle Emissions. Vehicle emissions have continued to decrease substantially over time as EPA has imposed a series of tighter emission-control requirements on engine emissions. As the region’s vehicle fleet becomes newer and the older, high-emitting vehicles are replaced, the WDC team expects that the tighter emission standards will substantially offset the regional growth in VMT. Although it is difficult to predict fleet-average emissions 20 to 30 years in the future, the WDC team expects that the more stringent federal regulation of motor vehicle emissions will continue to drive vehicle emissions even lower, thus helping to offset the growth in VMT.
Mobile-Source Air Toxics. The cumulative impact of annual MSAT emissions in 2040 (that is, MSAT emissions from the WDC and regionally significant projects in the WDC study area) are shown in Table 11-9 above, Emissions of Mobile-Source Air Toxics with Alternatives A1 and B1 in the WDC Study Area. With the No-Action Alternative, the level of
What are cumulative impacts?
Cumulative impacts are the resulting impacts from the proposed action combined with impacts from other past, present, and reasonably foreseeable future actions.
11-28 Final Environmental Impact Statement

each individual MSAT in 2040 is expected to decrease relative to existing conditions (2015) due to EPA’s ongoing programs to control hazardous air pollutants from mobile sources. Despite an expected increase of 46% in VMT between existing conditions in 2015 and the No-Action Alternative in 2040, MSAT emissions would decrease by about 50% to more than 90%, depending on the individual pollutant.
With the WDC, the annual amount of MSATs emitted would be proportional to the VMT, assuming that other variables such as fleet mix are the same for each alternative. The VMT estimated for each alternative are no more than 3% greater than the VMT with the No-Action Alternative in 2040. This slight increase in VMT would lead to slightly higher MSAT emissions along the WDC. The increase in emissions would be somewhat offset by lower MSAT emission rates due to the increased speeds of vehicles in the WDC study area as a result of the WDC.
MSAT emissions on some streets would decrease with the WDC action alternatives as vehicles use the WDC instead, while MSAT emissions on other roads would increase slightly. For example, MSAT emissions on Bluff Road, which is adjacent to existing residential developments, would decrease, while MSAT emissions on Antelope Drive would increase slightly as the result of a WDC interchange on Antelope Drive.
Overall, because MSAT emissions would decrease between 2015 and 2040 with any of the WDC action alternatives and because emissions are estimated to increase up to 3% over the emissions with the No-Action Alternative, the WDC would not substantially contribute to cumulative air quality impacts.
11.4.8 Summary of Impacts WFRC has prepared regional air quality evaluations for Davis and Weber Counties, evaluations that include the WDC Project. These evaluations concluded that, in 2040, the region would be in compliance with the emissions budgets in the SIP at that time.
Quantitative modeling was performed at the project level for CO, PM10, and PM2.5 at the interchange with the most dense residential development nearest the alignment (the Alternative B1 Antelope Drive interchange). Modeling was performed with the MOVES2014a and CAL3QHCR models. This modeling found that the WDC would not cause the NAAQS for CO, PM10, or PM2.5 to be exceeded.
Emissions inventory modeling was conducted for criteria pollutants (CO, PM10, PM2.5, and NOx) and MSATs. This modeling found that, due to technological improvements in vehicle emission systems in the future, the total emissions in the WDC study area with the WDC would improve over existing conditions despite the expected increase in VMT.
Chapter 11: Air Quality 11-29
11.5 References [BRAC] Governor’s Blue Ribbon Advisory Council on Climate Change
2007 Governor’s Blue Ribbon Advisory Council on Climate Change: Final Report. https://deq.utah.gov/Admin/DocLibrary/index.htm#g. October 3.
Cluff, Jayson 2016 E-mail correspondence from Jayson Cluff of Horrocks Engineers to Curt Overcast of HDR
Engineering regarding screenline summary information from the WFRC travel demand model. November 21.
[EIA] U.S. Energy Information Administration 2016 International Energy Outlook 2016. www.eia.gov/energyexplained/index.cfm?page=
environment_outlook_for_emissions. May. Accessed January 13, 2017.
[EPA] U.S. Environmental Protection Agency 1992 Guideline for Modeling Carbon Monoxide from Roadway Intersections. EPA-45R/R-92-005.
November. 2000 Technical Support Document: Control of Emissions of Hazardous Air Pollutants from Motor
Vehicles and Motor Vehicle Fuels. EPA 420-R-00-023. 2003 EPA IRIS Database, Diesel Engine Exhaust, Section II.C.
https://cfpub.epa.gov/ncea/iris/iris_documents/documents/subst/0642.htm#quainhal. 2012 Transportation Conformity Regulations as of April 2012. EPA-420-B-12-013. April.
https://nepis.epa.gov/Exe/ZyPDF.cgi/P100E7CS.PDF?Dockey=P100E7CS.PDF. Accessed January 11, 2017.
2015a Transportation Conformity Guidance for Quantitative Hot-spot Analyses in PM2.5 and PM10 Nonattainment and Maintenance Areas. EPA-420-B-15-040. November.
2015b Transportation Conformity Guidance for Quantitative Hot-Spot Analyses in PM2.5 and PM10 Non-attainment and Maintenance Areas (Appendices). EPA-420-B-15-084. November.
2015c Using MOVES2014 in Project-Level Carbon Monoxide Analyses. EPA-420-B-15-028. March.
2017a National Ambient Air Quality Standards (NAAQS). www.epa.gov/criteria-air-pollutants/naaqs-table. Accessed January 11, 2017.
2017b About Urban Air Toxics. https://www.epa.gov/urban-air-toxics/about-urban-air-toxics. Accessed January 12, 2017.
[FHWA] Federal Highway Administration 1987 Guidance for Preparing and Processing Environmental and Section 4(f) Documents. 2016 Updated Interim Guidance on Mobile-Source Air Toxic Analysis in NEPA Documents.
October 18.
[HEI] Health Effects Institute 2007 Mobile-Source Air Toxics: A Critical Review of the Literature on Exposure and Health
Effects. Special Report 16. https://www.healtheffects.org/publication/mobile-source-air-toxics-critical-review-literature-exposure-and-health-effects. Accessed May 15, 2012.
11-30 Final Environmental Impact Statement
Horrocks Engineers 2016 WDC EIS Technical Report 6 Supplemental: Existing Conditions. June 29.
[IPCC] Intergovernmental Panel of Climate Change 2014 Climate Change 2014: Synthesis Report Summary for Policymakers. Contribution of
Working Groups I, II, and III to the Fifth Assessment Report of the Intergovernmental Panel on Climate Change. ipcc.ch/pdf/assessment-report/ar5/syr/AR5_SYR_FINAL_SPM.pdf.
The White House, Office of the Press Secretary 2014 “U.S.–China Joint Announcement on Climate Change.” November 11.
www.whitehouse.gov/the-press-office/2014/11/11/us-china-joint-announcement-climate-change. Accessed June 5, 2015.
Utah Division of Air Quality 2012 Modeling – Wasatch Front Winds. www.airquality.utah.gov/Planning/Modeling/images/
Wind.htm. Accessed June 28, 2012. 2013 Draft Utah State Implementation Plan: Control Measures for Area and Point Sources, Fine
Particulate Matter, PM2.5 SIP for the Salt Lake City Non-attainment Area. www.airquality.utah.gov/Public-Interest/Public-Commen-Hearings/pdf-files/September2012/9-26/SIP%20Doc%20-%20SLC%20V5.pdf. September 2012. Accessed March 11, 2013.
2017a Utah Air Monitoring Center Data Archive: Carbon Monoxide. www.airmonitoring.utah.gov/dataarchive/archco.htm. Accessed January 3, 2017.
2017b Utah Air Monitoring Center Data Archive: Particulate PM10. www.airmonitoring.utah.gov/dataarchive/archpm10.htm. Accessed January 3, 2017.
2017c Utah Air Monitoring Center Data Archive: Particulate PM2.5. www.airmonitoring.utah.gov/dataarchive/archpm25.htm. Accessed January 4 2017.
2017d Utah Air Monitoring Center Data Archive: NO2 (peak 1-hour value). http://www.airmonitoring.utah.gov/dataarchive/2015DailyMaxNO2.pdf. Accessed January 12, 2017.
2017e Utah Air Monitoring Center Data Archive: NO2 (98th percentile). www.airmonitoring.utah.gov/dataarchive/FD-NO2-2015.pdf. Accessed January 12, 2017.
2017f PM10 State Implementation Plan. https://deq.utah.gov/Pollutants/P/pm/PM10/index.htm. Accessed March 2, 2017.
[WFRC] Wasatch Front Regional Council 2016 Draft Conformity Analysis for the Amended WFRC 2015– 2040 Regional Transportation
Plan. Report No. 35 (Draft). November 21.
Chapter 11: Air Quality 11-31

This page is intentionally blank.
11-32 Final Environmental Impact Statement