chapter 10: terbacil - us epa · chapter 10: terbacil . a chapter from: regulatory determinations...
TRANSCRIPT
EPA – OGWDW Regulatory Determinations Support Document for CCL 2 June 2008
Chapter 10: Terbacil
A chapter from:
Regulatory Determinations Support Document for Selected Contaminants from the Second Drinking Water Contaminant Candidate List (CCL 2)
EPA Report 815-R-08-012
10-1
EPA – OGWDW Regulatory Determinations Support Document for CCL 2 June 2008
10-2
EPA – OGWDW Regulatory Determinations Support Document for CCL 2 June 2008
Executive Summary
Terbacil, a synthetic organic compound (SOC), is a selective herbicide used to control broadleaf weeds and grasses on terrestrial food/feed crops (e.g., apples, mint, peppermint, spearmint, and sugarcane), terrestrial food (e.g., asparagus, blackberry, boysenberry, dewberry, loganberry, peach, raspberry, youngberry, and strawberry), terrestrial feed (e.g., alfalfa, forage, and hay) and forest trees (e.g., cottonwood). Terbacil is a persistent and potentially mobile herbicide in terrestrial environments. Because of its low affinity to soils, it can potentially leach into ground and/or surface waters. In acute and subchronic toxicity studies, terbacil is practically non-toxic. Terbacil is not considered to be a developmental or reproductive toxicant. Terbacil shows no evidence of carcinogenicity and is considered unlikely to be carcinogenic to humans (Group E). Terbacil is not mutagenic. In chronic dietary exposure studies in animals, the liver is a primary target organ. The reference dose (RfD) of 0.013 mg/kg/day for terbacil is calculated from a two-year chronic study in beagle dogs. The lowest-observed-adverse-effect level (LOAEL) of 6.25 mg/kg/day was based on increased thyroid-to-body weight ratios, slight increases in liver weights, and elevated alkaline phosphatase levels with a no-observed-adverse-effect level (NOAEL) of 1.25 mg/kg/day. In deriving the RfD, the Agency applied an uncertainty factor of 100 to account for interspecies and intraspecies differences. Using the RfD of 0.013 mg/kg/day and applying a 20 percent screening relative source contribution, the Agency derived a health reference level (HRL) of 0.090 mg/L (or 90 µg/L) for terbacil. EPA also evaluated whether health information is available regarding the potential effects on children and other sensitive populations. In the case of terbacil, the Agency determined that the RfD is adequately protective of children. No other potentially sensitive subpopulation has been identified. In 1998, EPA estimated that agricultural usage consumed approximately 221,000 to 447,000 pounds of terbacil annually and non-agricultural usage consumed approximately 9,000 to 14,000 pounds. These estimates are based on data collected mostly between 1990 and 1995, and in some cases as early as 1987. According to the National Center for Food and Agricultural Policy (NCFAP), approximately 298,000 pounds of terbacil were applied annually in agriculture around 1992 and approximately 342,000 pounds were applied around 1997. The Toxics Release Inventory (TRI) provides information on industrial releases of terbacil. Data are reported from a single State, Texas, for the time period covering 1995 to 1997. During this three-year period, all reported releases were on-site releases to surface water; these releases varied between 3,000 to 10,000 pounds annually. Data on the ambient occurrence of terbacil are available from the first monitoring cycle (1992-2001) of the United States Geological Survey’s (USGS’s) National Water Quality Assessment (NAWQA) program. While the USGS detected terbacil in both surface and ground waters, in all land use settings the 95th-percentile concentration was less than 0.034 µg/L (the
10-3
EPA – OGWDW Regulatory Determinations Support Document for CCL 2 June 2008
USGS reporting limit). The maximum surface water concentration, 0.54 µg/L (found in an agricultural setting), and the maximum ground water concentration, 0.891 µg/L (found in a mixed land use setting), are both less than the HRL and ½ the HRL.
In order to determine the extent of terbacil contamination of drinking water, EPA included terbacil as an analyte in the first Unregulated Contaminant Monitoring Regulation (UCMR 1). None of the 3,873 public water systems (PWSs) sampled (serving a total population of 226 million) had detections of terbacil at or above the minimum reporting level (MRL) of 2 µg/L. These data indicate that no occurrence and exposure is expected at levels greater than the HRL (90 µg/L) or even ½ the HRL (45 µg/L). EPA also evaluated several sources of supplemental information on terbacil occurrence in drinking water. In the National Pesticide Survey, which collected samples from approximately 1,300 community water systems and rural drinking water wells between 1988 and 1990, terbacil was not detected (using a minimum reporting limit of 1.7 µg/L). The Pesticides in Ground Water Database indicates that terbacil was found in 6 of 288 ground water wells in 6 States. Terbacil was found in 1 ground water well in Oregon (at a concentration of 8.9 µg/L) and 5 ground water wells in West Virginia (with concentrations ranging from 0.3 to1.2 µg/L). None of the detections exceeded the HRL or ½ the HRL. The Agency has made a determination not to regulate terbacil with a national primary drinking water regulation (NPDWR). Because terbacil does not appear to occur at health levels of concern in PWSs, the Agency believes that an NPDWR does not present a meaningful opportunity for health risk reduction. The Agency’s regulatory determination for this contaminant is presented formally in the Federal Register.
10-4
EPA – OGWDW Regulatory Determinations Support Document for CCL 2 June 2008
Contents
Executive Summary ...........................................................................................................................10-3 Contents .............................................................................................................................................10-5 Exhibits ..............................................................................................................................................10-7 Abbreviations.....................................................................................................................................10-9 10 Terbacil ..................................................................................................................................10-11 10.1 Definition ...............................................................................................................................10-11
10.1.1 Properties and Sources...............................................................................................10-11 10.1.2 Environmental Fate and Behavior .............................................................................10-12
10.2 Health Effects.........................................................................................................................10-13 10.3 Occurrence and Exposure ......................................................................................................10-14
10.3.1 Use and Environmental Release ................................................................................10-14 10.3.2 Ambient Water Occurrence .......................................................................................10-17 10.3.3 Drinking Water Occurrence.......................................................................................10-19
10.4 Technology Assessment.........................................................................................................10-22 10.4.1 Analytical Methods....................................................................................................10-22 10.4.2 Treatment Technologies ............................................................................................10-24
10.5 Regulatory Determination......................................................................................................10-24 10.6 References..............................................................................................................................10-24
10-5
EPA – OGWDW Regulatory Determinations Support Document for CCL 2 June 2008
10-6

EPA – OGWDW Regulatory Determinations Support Document for CCL 2 June 2008
Exhibits Exhibit 10-1: Physical and Chemical Properties of Terbacil............................................................10-12 Exhibit 10-2: Estimated Annual Agricultural Use of Terbacil, c. 1997 ...........................................10-16 Exhibit 10-3: Environmental Releases (in pounds) of Terbacil in the United States, 1995-1997....10-16 Exhibit 10-4: USGS National Synthesis Summary of NAWQA Monitoring of Terbacil in
Ambient Surface Water, 1992-2001 ..........................................................................10-17 Exhibit 10-5: USGS National Synthesis Summary of NAWQA Monitoring of Terbacil in
Ambient Ground Water, 1992-2001 ..........................................................................10-18 Exhibit 10-6: EPA Summary Analysis of Terbacil Data from NAWQA Study Units, 1992-2001..10-19 Exhibit 10-7: Summary UCMR 1 Occurrence Statistics for Terbacil in Small Systems (Based on
Statistically Representative National Sample of Small Systems)..............................10-20 Exhibit 10-8: Summary UCMR 1 Occurrence Statistics for Terbacil in Large Systems (Based on
the Census of Large Systems)....................................................................................10-21
10-7
EPA – OGWDW Regulatory Determinations Support Document for CCL 2 June 2008
10-8
EPA – OGWDW Regulatory Determinations Support Document for CCL 2 June 2008
Abbreviations a.i. Active Ingredient AOAC Association of Analytical Communities APHA American Public Health Association ASTM American Society for Testing and Materials CAS Chemical Abstracts Service CCL 2 Second Contaminant Candidate List CWS Community Water System DNA Deoxyribonucleic Acid FQPA Food Quality Protection Act GAC Granular Activated Carbon GC Gas Chromatography GC/MS Gas Chromatography with Mass Spectrometry
GC/NPD Gas Chromatography with a Nitrogen-Phosphorus Detector
GW Ground Water HRL Health Reference Level LLE Liquid-Liquid Extraction LOAEL Lowest-Observed-Adverse-Effect Level LSE Liquid-Solid Extraction MDL Method Detection Limit MRL Minimum Reporting Level MTBE Methyl Tertiary Butyl ether NAWQA National Water Quality Assessment NCFAP National Center for Food and Agricultural Policy NOAEL No-Observed-Adverse-Effect Level NPDWR National Primary Drinking Water Regulation NPS National Pesticide Survey NTNCWS Non-Transient Non-Community Water System PGWDB Pesticides in Ground Water Database PWS Public Water System RfD Reference Dose RL Reporting Limit SOC Synthetic Organic Compound SW Surface Water TRI Toxics Release Inventory UCMR 1 First Unregulated Contaminant Monitoring Regulation USGS United States Geological Survey
10-9

EPA – OGWDW Regulatory Determinations Support Document for CCL 2 June 2008
10-10

EPA – OGWDW Regulatory Determinations Support Document for CCL 2 June 2008
10 Terbacil 10.1 Definition
Terbacil is a synthetic organic compound (SOC), specifically a substituted uracil. The Chemical Abstracts Service (CAS) name for terbacil is 3-tert-butyl-5-chloro-6-methyluracil, and its registry number is 5902-51-2. Terbacil=s trade names include Sinbar (most common), DuPont 732, and Geonter. In the United States, it is manufactured in Delaware by DuPont Agricultural Products. 10.1.1 Properties and Sources
Terbacil is an odorless, white crystalline solid, most often available as a wettable powder (Extoxnet, 1994). As a selective herbicide, it acts by inhibiting photosynthesis. Terbacil is used to control annual and perennial grasses and broad-leaf weeds in agricultural fields and fruit and nut orchards. Occasionally, terbacil will be found in mixed formulations with other herbicides. As a synthetic compound, it does not occur naturally. Some physical and chemical properties of terbacil are listed in Exhibit 10-1.
10-11

EPA – OGWDW Regulatory Determinations Support Document for CCL 2 June 2008
Exhibit 10-1: Physical and Chemical Properties of Terbacil
Identification
CAS number 5902-51-2
Molecular Formula C9H13ClN2O2
Physical and Chemical Properties
Boiling Point -----
Melting Point 175 - 177 °C 1
Molecular Weight 216.67 g/mol 1
Log Koc 1.64 - 1.93 2
Log Kow 1.89 3
Water Solubility 710 mg/L at 25 °C 4
Vapor Pressure 4.7 x 10⁻⁷ mm Hg at 29.5 ° C 5
Henry=s Law Constant 2.7 x 10⁻¹⁰ atm-m3/mole 2 7.8 x 10⁻⁹ (dimensionless), predicted 6 4.8 x 10⁻⁹ (dimensionless), from literature 6
Freundlich Isotherm Constant (K)
69,300 (µg/g)(L/µg)1/n 6
1 Budavari, 1996 (as cited in HSDB, 2004) 2 HSDB, 2004 3 Hansch et al., 1995 (as cited in HSDB, 2004) 4 Tomlin, 1997 (as cited in HSDB, 2004) 5 Ahrens, 1994 (as cited in HSDB, 2004) 6 Speth et al., 2001 10.1.2 Environmental Fate and Behavior
Because terbacil is applied to fields and orchards by ground or aerial spraying, it can contaminate the air, soil, and water. Terbacil is persistent, slow to degrade, and potentially very mobile in the environment. It can undergo photodegradation in surface soil, but this process is slow, with a calculated half-life of 122 days (Barefoot, 1986 as cited in USEPA, 1998). Terbacil=s aerobic and anaerobic half-lives in soil have been measured at 653 days and 235 days, respectively (Atkins et al., 1992a, 1992b both as cited in USEPA, 1998). Thus, in some cases, terbacil can remain in the soil for more than one growing season. The persistence of terbacil varies depending on the application rate, soil type, availability of oxygen, and rainfall (Extoxnet, 1994). Field dissipation studies found terbacil half-lives of 204 days on silty clay soil, 212 days on silt loam soil, and 252 days on sandy loam soil (Dupont, 1995 as cited in USEPA, 1998). Where soil moisture is adequate, terbacil is subject to microbial degradation, although few data are available on the degradation rates and products.
10-12
EPA – OGWDW Regulatory Determinations Support Document for CCL 2 June 2008
Terbacil exhibits low affinity for adsorption to soil (see Exhibit 10-1). This characteristic, combined with moderate water solubility, explains its mobility in the environment. Terbacil is capable of leaching through the soil column and contaminating ground water. Leaching appears to occur more readily in sandy or coarse soils than in organic or fine-textured soils (Extoxnet, 1994). In the field dissipation studies mentioned above (DuPont, 1995 as cited in USEPA, 1998), aerially applied terbacil was later detected in the soil at depths of up to 45 to 50 cm (USEPA, 1998). In laboratory tests, terbacil leached through several different 30 cm soil columns, and was detected primarily in the leachate (Atkins, 1992c as cited in USEPA, 1998). Also observed in the leachate were several terbacil degradates, including t-butylurea, 3-t-butyl-6-methyluracil, and 6-chloro-2,3-dihydro-7-(hydroxymethyl)-3,3-dimethyl-5H-oxazolo(3,2-a)pyrimidin-5-one.
Terbacil can enter surface waters either directly through deposition of spray drift from application or indirectly in runoff from treated soil. It appears to be stable to abiotic hydrolysis at a wide range of pH values, but is susceptible to slow photodegradation, with a half-life of 29 days in standard reference water under natural sunlight (Rhodes, 1975 as cited in USEPA, 1998). If the water contains suspended sediments or particulate material, the rate of photolysis is even slower. Certain compounds, such as methylene blue or riboflavins, act as photosensitizers and can accelerate the light-mediated decomposition process. Modeling studies conducted by EPA suggest that terbacil may accumulate in the range of 28 to 1,470 µg/L in surface water and up to 125 µg/L in ground water (USEPA, 1998). There are currently no data on aerobic metabolism of terbacil in water.
Terbacil has a low vapor pressure and a low Henry=s constant, and thus is unlikely to be found in significant concentrations in the atmosphere (USEPA, 1998). 10.2 Health Effects
In acute and subchronic toxicity studies, terbacil is practically non-toxic (Haskell Laboratories, 1965a, 1965b both as cited in USEPA, 1998). Terbacil does not cause dermal sensitivity in rabbits or guinea pigs and causes mild conjunctival eye irritation in rabbits (Henry, 1986; Hood, 1966 both as cited in USEPA 1998). In rats exposed subchronically to dietary terbacil, effects were seen at a lowest-observed-adverse-effect level (LOAEL) of 25 mg/kg/day and included increased absolute and relative liver weights, vacuolization, and enlargement of liver cells (Wazeter et al.,1964; Haskell Laboratories, 1965c both as cited in USEPA, 1998).
A primary target organ in rats following exposure to terbacil is the liver. Chronic effects of dietary terbacil exposure in two-year studies included increases in thyroid-to-body weight ratios, slight increases in liver weights and elevated alkaline phosphatase levels in beagle dogs, significant decreases in body weight in rats, increases in serum cholesterol levels and increases in liver to body weight ratios in rats (Wazeter et al.,1967a; Malek, 1993 both as cited in USEPA, 1998). In beagle dogs, effects were seen at or above 6.25 mg/kg/day (no-observed-adverse-effect level [NOAEL] = 1.25 mg/kg/day). In rats, effects (i.e., decreases in body weight, increases in liver weights and cholesterol levels) were seen at higher levels (LOAELs = 56 mg/kg/day for males and 83 mg/kg/day for females).
10-13
EPA – OGWDW Regulatory Determinations Support Document for CCL 2 June 2008
Terbacil is not considered to be a developmental or reproductive toxicant. In developmental studies, maternal effects were generally seen prior to or at the same levels as developmental effects. Haskell Laboratories (1980 as cited in USEPA, 1998) reported maternal effects (i.e., decreased body weight) and significant decreases in the number of live fetuses per litter due to early fetal resorption at a LOAEL of 62.5 mg/kg/day in rats. In rabbits administered terbacil via gavage, the maternal and developmental LOAELs were equal (600 mg/kg/day). Maternal toxicity was based on the death of the dams and developmental toxicity was based on a decrease in live fetal weights (Solomon, 1984 as cited in USEPA, 1998). No reproductive effects were seen in a three-generation study where terbacil was administered to male and female rats at dose levels of 2.5 and 12.5 mg/kg/day (Wazeter et al., 1967b as cited in USEPA, 1998).
Terbacil is not mutagenic. Terbacil was tested and found negative in a chromosomal aberration study in rat bone marrow cells, found negative in a gene mutation assay (with and without S9 activation), and found negative for deoxyribonucleic acid (DNA) synthesis when tested up to cytotoxic levels in rats (Cortina, 1984; Haskell Laboratories, 1984 as cited in USEPA, 1998). Terbacil shows no evidence of carcinogenicity and is unlikely to be carcinogenic to humans (Group E) (USEPA, 1998).
The reference dose (RfD) of 0.013 mg/kg/day for terbacil (USEPA, 1998) is calculated from a two-year chronic study in beagle dogs. The LOAEL of 6.25 mg/kg/day was based on increased thyroid-to-body weight ratios, slight increases in liver weights, and elevated alkaline phosphatase levels with a NOAEL of 1.25 mg/kg/day. In deriving the RfD, the Agency applied an uncertainty factor of 100 to account for interspecies and intraspecies differences. Using the RfD of 0.013 mg/kg/day and applying a 20 percent screening relative source contribution, the Agency derived a health reference level (HRL) of 0.090 mg/L (or 90 µg/L) for terbacil.
EPA also evaluated whether health information is available regarding the potential effects on children and other sensitive populations. In the case of terbacil, the Agency determined that there was no need to apply a Food Quality Protection Act (FQPA) factor to the RfD in order to protect children (USEPA, 1998). Other potentially sensitive subpopulations have not been identified. 10.3 Occurrence and Exposure 10.3.1 Use and Environmental Release
Terbacil (3-tert-butyl-5-chloro-6-methyl uracil) is manufactured by E.I. DuPont de Nemours and Company, Inc. It is marketed under several trade names, including Sinbar, DuPont Herbicide 732, and Geonter. Terbacil is currently registered for use as an herbicide on terrestrial food and feed crops, including apple, mint, sugarcane, asparagus, blackberry, boysenberry, dewberry, loganberry, peach, raspberry, youngberry, and strawberry, as well as for applications on ornamentals and in forestry, particularly for cottonwoods. Terbacil is not currently registered for residential use. Terbacil is generally applied by spraying, either from tractor-mounted booms or from aircraft (USEPA, 1998).
EPA has estimated that agricultural usage of terbacil consumes approximately 221,000 to 447,000 pounds of active ingredient (a.i.) annually, and non-agricultural usage consumes
10-14

EPA – OGWDW Regulatory Determinations Support Document for CCL 2 June 2008
approximately 9,000 to 14,000 pounds. These estimates are based on data collected mostly between 1990 and 1995, and in some cases as early as 1987 (USEPA, 1998).
The National Center for Food and Agricultural Policy (NCFAP) estimates of national agricultural terbacil use indicate an increase during the 1990s. According to NCFAP, around 1992 approximately 298,000 pounds of terbacil a.i. were applied annually to 12 types of crops on 353,000 acres, and in 1997 approximately 342,000 pounds a.i. were applied annually to 13 types of crops on 357,000 acres. NCFAP estimates are based on State-level commercial agriculture usage patterns for the periods 1990-1993 and 1995-1998, and State-level crop acreage for 1992 and 1997 (NCFAP, 2004). For more information on NCFAP pesticide use estimates, see Chapter 2.
The United States Geological Survey (USGS) combined data collected by NCFAP with data from the Census of Agriculture to estimate that 285,000 pounds of terbacil a.i. per year were used on approximately 4.0 million agricultural acres in the early 1990s (Thelin and Gianessi, 2000). While USGS has not published national estimates for 1997, an estimate of approximately 317,000 pounds a.i. can be inferred from the “total pounds applied” and “percent national use” data in the 1997 geographical distribution map (Exhibit 10-2).
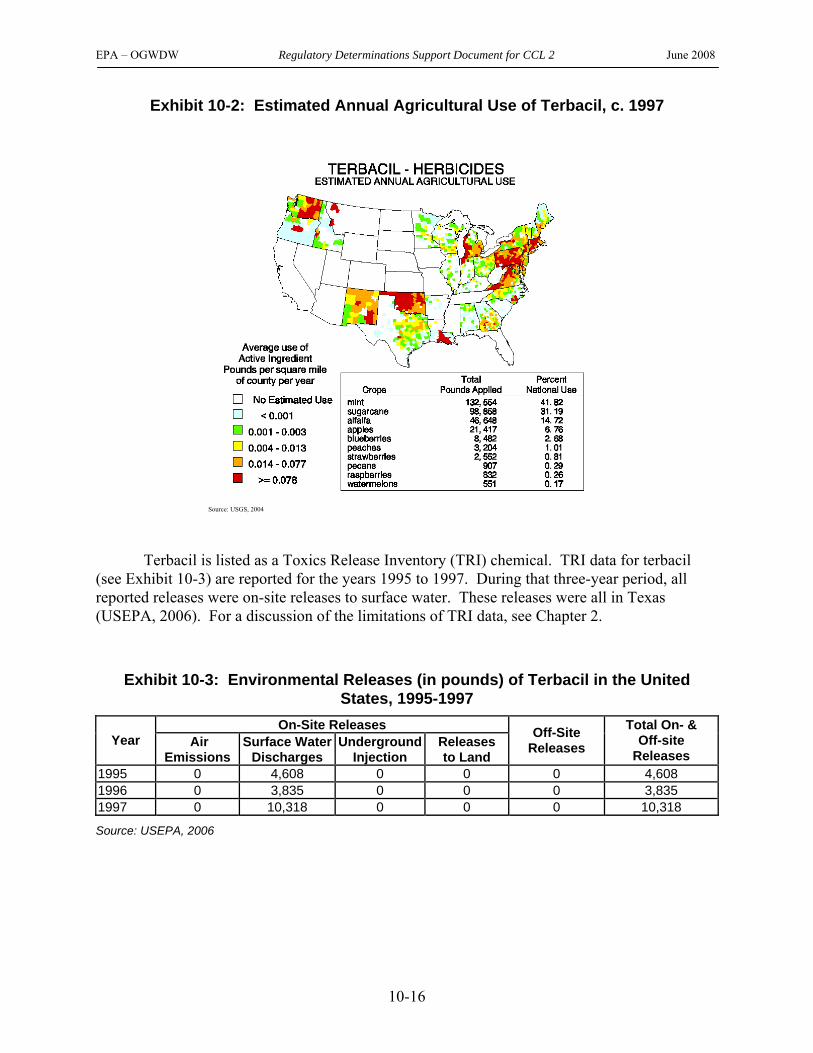
Exhibit 10-2 shows the estimated geographic distribution and intensity of typical annual terbacil use in the United States in the late 1990s. A breakdown of use by crop is also included. The map was created by USGS using State-level data sets on pesticide use rates from 1995-1998 compiled by NCFAP, combined with county-level data on harvested crop acreage obtained from the 1997 Census of Agriculture (USGS, 2004). Due to the nature of the data sources, non-agricultural uses are not reflected on the map and variations in use at the county-level are also not well represented (Thelin and Gianessi, 2000). For background on the USGS pesticide use maps, see Chapter 2. The map indicates that terbacil is commonly used in the Pacific Northwest, the Northeast, the Great Lakes Region, and parts of the South and Southwest.
10-15
EPA – OGWDW Regulatory Determinations Support Document for CCL 2 June 2008
Exhibit 10-2: Estimated Annual Agricultural Use of Terbacil, c. 1997
Source: USGS, 2004
Terbacil is listed as a Toxics Release Inventory (TRI) chemical. TRI data for terbacil (see Exhibit 10-3) are reported for the years 1995 to 1997. During that three-year period, all reported releases were on-site releases to surface water. These releases were all in Texas (USEPA, 2006). For a discussion of the limitations of TRI data, see Chapter 2.
Exhibit 10-3: Environmental Releases (in pounds) of Terbacil in the United States, 1995-1997
On-Site Releases Year Air
Emissions Surface Water
Discharges Underground
Injection Releases to Land
Off-Site Releases
Total On- & Off-site
Releases 1995 0 4,608 0 0 0 4,608 1996 0 3,835 0 0 0 3,835 1997 0 10,318 0 0 0 10,318
Source: USEPA, 2006
10-16

EPA – OGWDW Regulatory Determinations Support Document for CCL 2 June 2008
10.3.2 Ambient Water Occurrence
Ambient lakes, rivers, and aquifers are the source of most drinking water. Data on the occurrence of terbacil in ambient surface and ground water are available from the National Water Quality Assessment (NAWQA) program of the USGS. For details on this program, see the discussion in Chapter 2. NAWQA data have been analyzed independently by USGS and EPA.
NAWQA National Pesticide Synthesis
Under the NAWQA program, USGS monitored terbacil between 1992 and 2001 in representative watersheds and aquifers across the country. Reporting limits varied but did not exceed 0.034 µg/L. All concentrations determined for terbacil are estimated concentrations.
In surface water (Exhibit 10-4), terbacil was detected at frequencies ranging from 1.40% of samples in undeveloped settings to 1.82% in mixed land use settings, 1.98% in urban settings, and 4.52% in agricultural settings. The 95th percentile concentrations were less than the reporting limit in all settings. The highest concentration, 0.540 µg/L, was found in an agricultural setting (Martin et al., 2003).
Exhibit 10-4: USGS National Synthesis Summary of NAWQA Monitoring of Terbacil in Ambient Surface Water, 1992-2001
Land Use Type
No. of Samples
(and No. of Sites)
Detection Frequency
50th Percentile (Median)
Concentration
95th Percentile Concentration
Maximum Concentration
Agricultural 1,858 (77) 4.52% <RL <RL 0.540 µg/L Mixed 996 (46) 1.82% <RL <RL 0.341 µg/L Undeveloped 60 (4) 1.40% <RL <RL 0.092 µg/L Urban 896 (33) 1.98% <RL <RL 0.035 µg/L
Notes: RL = Reporting limit. Reporting limits for terbacil varied, but did not exceed 0.034 µg/L. All terbacil concentrations are estimated concentrations. The USGS Pesticide National Synthesis used one year of data, generally the year with the most sampling results, to represent each site in this analysis. The sampling results were time-weighted, to eliminate bias from more frequent sampling at certain times of year. Detection Frequencies and Percentile Concentrations can be interpreted as representing annual occurrence. For instance, the detection frequency can be thought of as the percent of the year in which detections are found at a typical site in this land use category, and the 95th percentile concentration can be thought of as a concentration that is not exceeded for 95% of the year at a typical site in this land use category.
Source: Martin et al., 2003
In ground water (Exhibit 10-5), terbacil detection frequencies ranged from 0.0% in
undeveloped settings to 0.26% in mixed land use (major aquifer) settings, 0.76% in agricultural settings, and 1.20% in urban land use settings. The 95th percentile concentrations were less than the reporting limit in all settings. The highest concentration, 0.891 µg/L, was in a mixed land use (major aquifer) setting (Kolpin and Martin, 2003).
10-17

EPA – OGWDW Regulatory Determinations Support Document for CCL 2 June 2008
Exhibit 10-5: USGS National Synthesis Summary of NAWQA Monitoring of Terbacil in Ambient Ground Water, 1992-2001
Land Use
Type No. of Wells
Detection Frequency
50th Percentile (Median)
Concentration
95th Percentile Concentration
Maximum Concentration
Agricultural 1,438 0.76% <RL <RL 0.495 µg/L Mixed (Major Aquifer) 2,708 0.26% <RL <RL 0.891 µg/L
Undeveloped 67 0.0% <RL <RL <RL Urban 830 1.20% <RL <RL 0.093 µg/L
Notes: RL = Reporting limit. Reporting limits for terbacil varied, but did not exceed 0.034 µg/L. All terbacil concentrations are estimated concentrations. The USGS Pesticide National Synthesis considered each well a distinct site in this analysis. Each well was represented by one sample: normally the first one taken, but possibly a later sample if the first sample was not analyzed for the full range of analytes. Percentile Concentrations were drawn from the range of detects and non-detects. The method for calculating Percentile Concentrations varied depending on how much of the data was censored at particular levels by the laboratory. Source: Kolpin and Martin, 2003
EPA Summary Analysis of NAWQA Data Whereas the NAWQA program often uses the most representative data for a site to
calculate summary statistics, EPA, with the cooperation of USGS, has performed a summary analysis of all Cycle 1 water monitoring data from all study units (1991-2001) for many of the Second Contaminant Candidate List (CCL 2) contaminants being considered for regulatory determination, including terbacil. Detection frequencies were simply computed as the percentage of samples and sites with detections (i.e., with at least one result equal to or greater than the reporting limit). Note that reporting limits were not uniform. Sample detections can be biased by frequent sampling in areas with high (or low) occurrence. Calculating the percentage of sites with detections can reduce this bias. For more details on the data set and the EPA analysis, see Chapter 2.
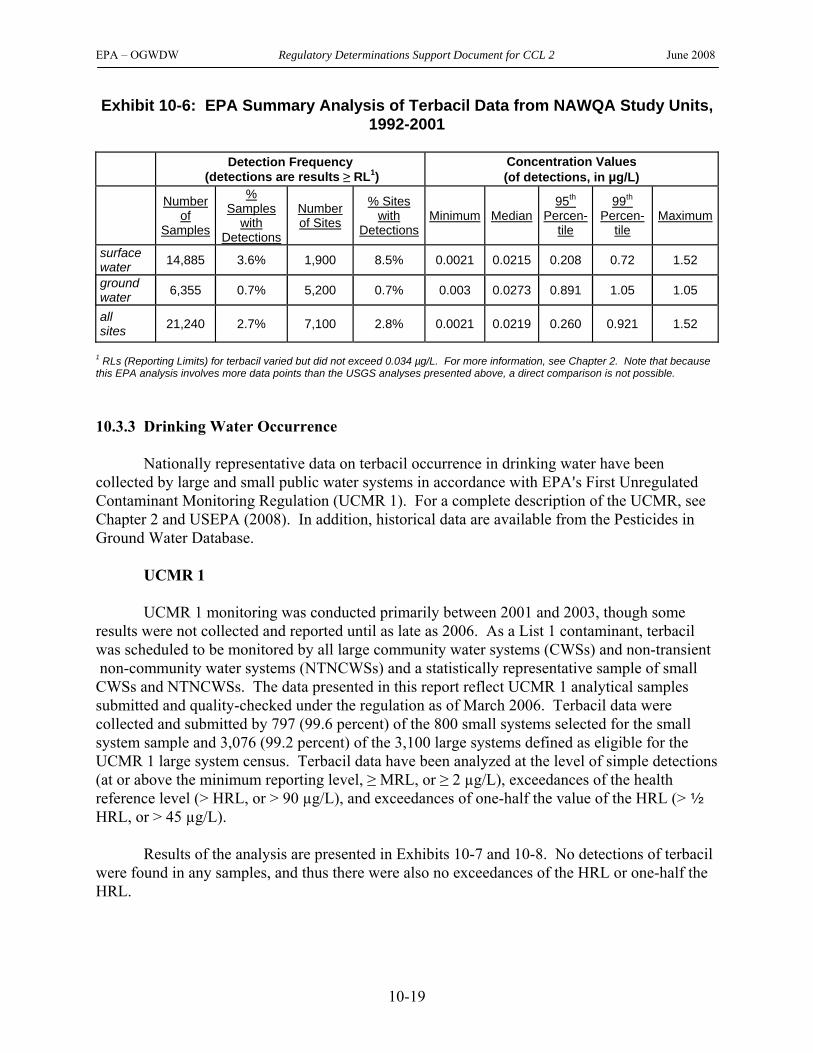
The results of the EPA analysis are presented in Exhibit 10-6. Overall, terbacil was detected in 2.7% of samples and at 2.8% of sites. Terbacil was detected more frequently in surface water than in ground water. Although the highest concentration (1.52 µg/L) was found in surface water, in general ground water concentrations tended to be higher than surface water concentrations.
10-18
EPA – OGWDW Regulatory Determinations Support Document for CCL 2 June 2008
Exhibit 10-6: EPA Summary Analysis of Terbacil Data from NAWQA Study Units, 1992-2001
Detection Frequency
(detections are results ≥ RL1) Concentration Values (of detections, in µg/L)
Number of
Samples
% Samples
with Detections
95th Percen-
tile
99th Percen-
tile
% Sites with
Detections
Number of Sites Minimum Median Maximum
surface water 14,885 3.6% 1,900 8.5% 0.0021 0.0215 0.208 0.72 1.52
ground water 6,355 0.7% 5,200 0.7% 0.003 0.0273 0.891 1.05 1.05
all sites 21,240 2.7% 7,100 2.8% 0.0021 0.0219 0.260 0.921 1.52
1 RLs (Reporting Limits) for terbacil varied but did not exceed 0.034 µg/L. For more information, see Chapter 2. Note that because this EPA analysis involves more data points than the USGS analyses presented above, a direct comparison is not possible. 10.3.3 Drinking Water Occurrence
Nationally representative data on terbacil occurrence in drinking water have been collected by large and small public water systems in accordance with EPA=s First Unregulated Contaminant Monitoring Regulation (UCMR 1). For a complete description of the UCMR, see Chapter 2 and USEPA (2008). In addition, historical data are available from the Pesticides in Ground Water Database.
UCMR 1
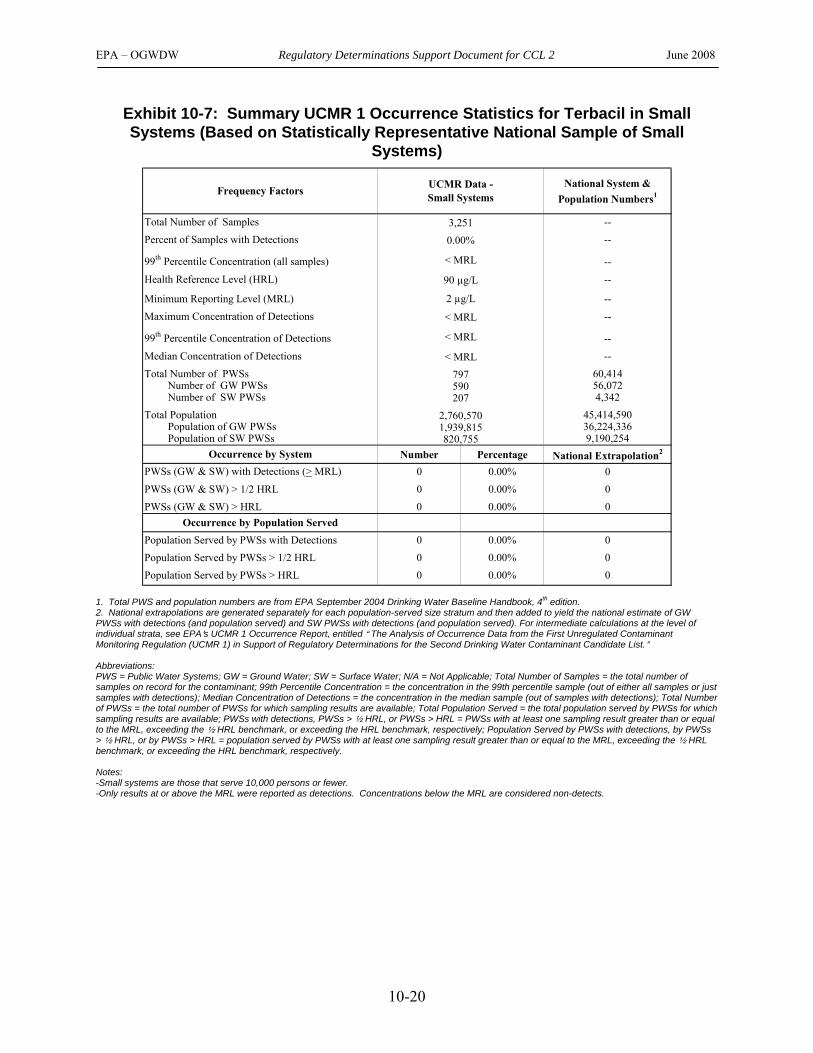
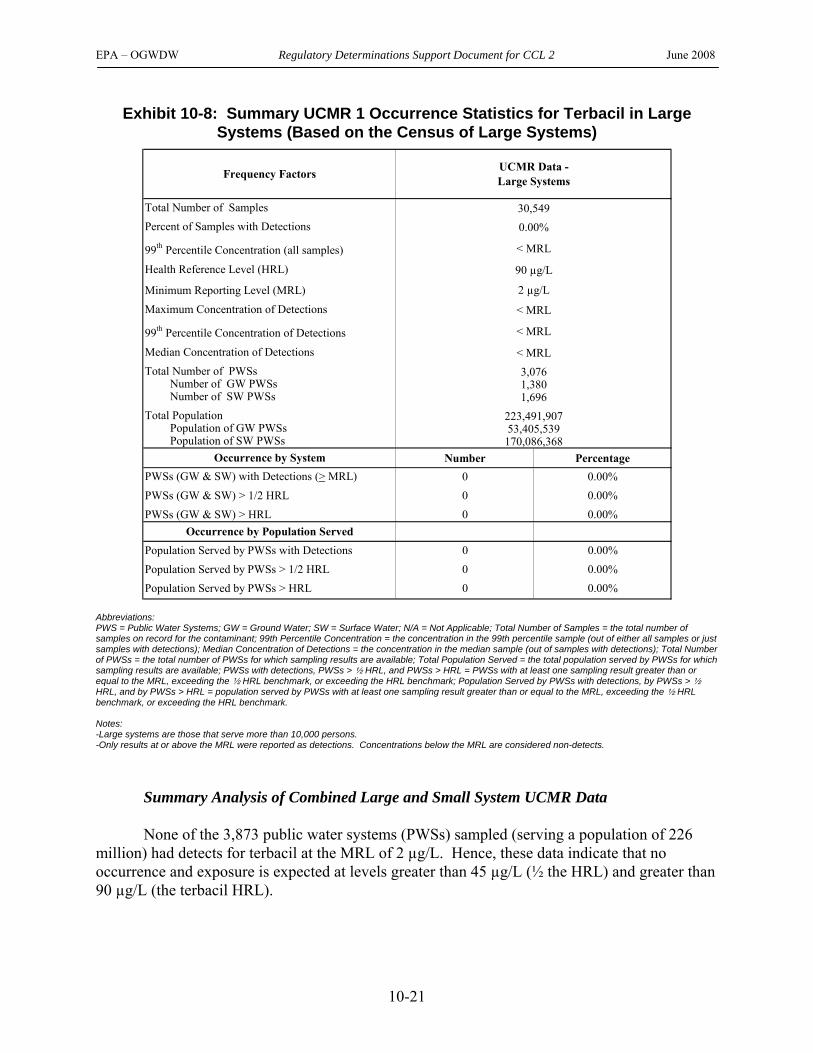
UCMR 1 monitoring was conducted primarily between 2001 and 2003, though some results were not collected and reported until as late as 2006. As a List 1 contaminant, terbacil was scheduled to be monitored by all large community water systems (CWSs) and non-transient non-community water systems (NTNCWSs) and a statistically representative sample of small CWSs and NTNCWSs. The data presented in this report reflect UCMR 1 analytical samples submitted and quality-checked under the regulation as of March 2006. Terbacil data were collected and submitted by 797 (99.6 percent) of the 800 small systems selected for the small system sample and 3,076 (99.2 percent) of the 3,100 large systems defined as eligible for the UCMR 1 large system census. Terbacil data have been analyzed at the level of simple detections (at or above the minimum reporting level, ≥ MRL, or ≥ 2 µg/L), exceedances of the health reference level (> HRL, or > 90 µg/L), and exceedances of one-half the value of the HRL (> 2 HRL, or > 45 µg/L).
Results of the analysis are presented in Exhibits 10-7 and 10-8. No detections of terbacil were found in any samples, and thus there were also no exceedances of the HRL or one-half the HRL.
10-19
EPA – OGWDW Regulatory Determinations Support Document for CCL 2 June 2008
Exhibit 10-7: Summary UCMR 1 Occurrence Statistics for Terbacil in Small Systems (Based on Statistically Representative National Sample of Small
Systems)
National System & Population Numbers1
Total Number of Samples --Percent of Samples with Detections --
99th Percentile Concentration (all samples) --Health Reference Level (HRL) --
Minimum Reporting Level (MRL) --Maximum Concentration of Detections --
99th Percentile Concentration of Detections --Median Concentration of Detections --Total Number of PWSs 60,414
Number of GW PWSs 56,072Number of SW PWSs 4,342
Total Population 45,414,590Population of GW PWSs 36,224,336Population of SW PWSs 9,190,254
Number Percentage National Extrapolation2
PWSs (GW & SW) with Detections (> MRL) 0 0.00% 0PWSs (GW & SW) > 1/2 HRL 0 0.00% 0PWSs (GW & SW) > HRL 0 0.00% 0
Population Served by PWSs with Detections 0 0.00% 0Population Served by PWSs > 1/2 HRL 0 0.00% 0Population Served by PWSs > HRL 0 0.00% 0
< MRL
2,760,570
< MRL
< MRL
1,939,815820,755
797590207
90 µg/L
2 µg/L
0.00%
< MRL
Frequency Factors
Occurrence by System
Occurrence by Population Served
UCMR Data - Small Systems
3,251
1. Total PWS and population numbers are from EPA September 2004 Drinking Water Baseline Handbook, 4th edition. 2. National extrapolations are generated separately for each population-served size stratum and then added to yield the national estimate of GW PWSs with detections (and population served) and SW PWSs with detections (and population served). For intermediate calculations at the level of individual strata, see EPA=s UCMR 1 Occurrence Report, entitled A The Analysis of Occurrence Data from the First Unregulated Contaminant Monitoring Regulation (UCMR 1) in Support of Regulatory Determinations for the Second Drinking Water Contaminant Candidate List.@ Abbreviations: PWS = Public Water Systems; GW = Ground Water; SW = Surface Water; N/A = Not Applicable; Total Number of Samples = the total number of samples on record for the contaminant; 99th Percentile Concentration = the concentration in the 99th percentile sample (out of either all samples or just samples with detections); Median Concentration of Detections = the concentration in the median sample (out of samples with detections); Total Number of PWSs = the total number of PWSs for which sampling results are available; Total Population Served = the total population served by PWSs for which sampling results are available; PWSs with detections, PWSs > 2 HRL, or PWSs > HRL = PWSs with at least one sampling result greater than or equal to the MRL, exceeding the 2 HRL benchmark, or exceeding the HRL benchmark, respectively; Population Served by PWSs with detections, by PWSs > 2 HRL, or by PWSs > HRL = population served by PWSs with at least one sampling result greater than or equal to the MRL, exceeding the 2 HRL benchmark, or exceeding the HRL benchmark, respectively. Notes: -Small systems are those that serve 10,000 persons or fewer. -Only results at or above the MRL were reported as detections. Concentrations below the MRL are considered non-detects.
10-20
EPA – OGWDW Regulatory Determinations Support Document for CCL 2 June 2008
Exhibit 10-8: Summary UCMR 1 Occurrence Statistics for Terbacil in Large Systems (Based on the Census of Large Systems)
Frequency Factors UCMR Data - Large Systems
Total Number of Samples 30,549Percent of Samples with Detections 0.00%
99th Percentile Concentration (all samples) < MRL
Health Reference Level (HRL) 90 µg/L
Minimum Reporting Level (MRL) 2 µg/L
Maximum Concentration of Detections < MRL
99th Percentile Concentration of Detections < MRL
Median Concentration of Detections < MRLTotal Number of PWSs
Number of GW PWSsNumber of SW PWSs
3,0761,3801,696
Total PopulationPopulation of GW PWSsPopulation of SW PWSs
223,491,90753,405,539
170,086,368Occurrence by System Number Percentage
PWSs (GW & SW) with Detections (> MRL) 0 0.00%PWSs (GW & SW) > 1/2 HRL 0 0.00%PWSs (GW & SW) > HRL 0 0.00%
Occurrence by Population ServedPopulation Served by PWSs with Detections 0 0.00%Population Served by PWSs > 1/2 HRL 0 0.00%Population Served by PWSs > HRL 0 0.00%
Abbreviations: PWS = Public Water Systems; GW = Ground Water; SW = Surface Water; N/A = Not Applicable; Total Number of Samples = the total number of samples on record for the contaminant; 99th Percentile Concentration = the concentration in the 99th percentile sample (out of either all samples or just samples with detections); Median Concentration of Detections = the concentration in the median sample (out of samples with detections); Total Number of PWSs = the total number of PWSs for which sampling results are available; Total Population Served = the total population served by PWSs for which sampling results are available; PWSs with detections, PWSs > 2 HRL, and PWSs > HRL = PWSs with at least one sampling result greater than or equal to the MRL, exceeding the 2 HRL benchmark, or exceeding the HRL benchmark; Population Served by PWSs with detections, by PWSs > 2 HRL, and by PWSs > HRL = population served by PWSs with at least one sampling result greater than or equal to the MRL, exceeding the 2 HRL benchmark, or exceeding the HRL benchmark. Notes: -Large systems are those that serve more than 10,000 persons. -Only results at or above the MRL were reported as detections. Concentrations below the MRL are considered non-detects.
Summary Analysis of Combined Large and Small System UCMR Data None of the 3,873 public water systems (PWSs) sampled (serving a population of 226
million) had detects for terbacil at the MRL of 2 µg/L. Hence, these data indicate that no occurrence and exposure is expected at levels greater than 45 µg/L (½ the HRL) and greater than 90 µg/L (the terbacil HRL).
10-21
EPA – OGWDW Regulatory Determinations Support Document for CCL 2 June 2008
Pesticides in Ground Water Database (PGWDB)
The Pesticides in Ground Water Database (PGWDB) is a compilation of data from ground water studies conducted by federal, State, and local governments, the pesticide industry, and other institutions between 1971 and 1991 (USEPA, 1992). Most of the data are from drinking water wells. Since PGWDB data come from multiple sources, they should be interpreted with caution. Results might be biased high, because areas with suspected contamination are likely to have been sampled more frequently than pristine areas. For more information on PGWDB, see Chapter 2.
According to the data compiled in the PGWDB, terbacil was detected in 6 (2.08 percent) of 288 wells sampled. The detections were found in 2 out of 6 States where terbacil was investigated. Terbacil was found in one ground water well in Oregon (at a concentration of 8.9 µg/L) and five ground water wells in West Virginia (with concentrations ranging from 0.3 to1.2 µg/L). All detections were well below the HRL of 90 µg/L (USEPA, 1992).
National Pesticide Survey (NPS)
EPA collected samples from approximately 1,300 CWS wells and rural drinking water wells between 1988 and 1990 for the National Pesticide Survey (NPS). The survey was designed to provide a statistically reliable estimate of pesticide occurrence in the nation=s drinking water wells. For details about NPS, see Chapter 2.
With a minimum reporting limit of 1.7 µg/L, terbacil was not detected in the survey (USEPA, 1990). 10.4 Technology Assessment 10.4.1 Analytical Methods
EPA evaluated the availability of analytical methods for all of the unregulated contaminants considered for UCMR 1 in 1999 (64 FR 50556). Sources for these methods included publications by EPA and by voluntary consensus standard organizations such as the American Society for Testing and Materials (ASTM), the Association of Analytical Communities (AOAC), and the American Public Health Association (APHA).
Terbacil is a UCMR List 1 contaminant that can be detected in drinking water using EPA Methods 507 and 525.2. These methods were approved for the monitoring of terbacil in 1999 (64 FR 50556). EPA Method 507 relies on liquid-liquid extraction (LLE) of the method analytes, followed by gas chromatography with a nitrogen-phosphorus detector (GC/NPD), while EPA Method 525.2 relies on liquid-solid extraction (LSE) and capillary column gas chromatography with mass spectrometry (GC/MS). A full description of both EPA Methods can be found in EPA=s Methods for the Determination of Organic Compounds in Drinking Water, Supplement 3 (USEPA, 1995a). Additional methods approved for terbacil include ASTM Method D5475-93 (ASTM, 1996; 1998) and AOAC International 991.07 (AOAC, 1998).
10-22

EPA – OGWDW Regulatory Determinations Support Document for CCL 2 June 2008
The method detection limit (MDL) and the average recovery for each analytical method that can be used for the analysis of terbacil in water are included in the method descriptions below.1
EPA Method 507
In EPA Method 507 (Revision 2.1), “Determination of Nitrogen and Phosphorus-Containing Pesticides in Water by Gas Chromatography with a Nitrogen-Phosphorus Detector,”approximately 1 liter of sample is extracted with methylene chloride by shaking in a separatory funnel. The methylene chloride extract is separated, dried, and concentrated during a solvent exchange to methyl tertiary butyl ether (MTBE). Chromatographic conditions are set to allow for separation and measurement of the analytes in the extract by capillary column GC/NPD (USEPA, 1995b).
The MDL for terbacil is reported as 0.56 µg/L, and the average recovery is reported to range from 86 to 102 percent depending on the method option used (USEPA, 1995b).
EPA Method 525.2
In EPA Method 525.2 (Revision 2.0), “Determination of Organic Compounds in Drinking Water by Liquid-Solid Extraction and Capillary Column Gas Chromatography/Mass Spectrometry,” analytes are extracted by LSE: a water sample is passed through a disk or cartridge containing a solid matrix with a chemically bonded C18 organic phase. The organic compounds are eluted from the LSE disk or cartridge with small amounts of ethyl acetate and methylene chloride. The analytes are then concentrated by evaporation of some of the solvent. The concentrated sample extract is analyzed by injecting an aliquot onto a capillary gas chromatography (GC) column. Compounds eluting from the GC column are characterized by comparing their measured mass spectra and retention times to reference mass spectra and retention times (USEPA, 1995c).
The MDL for terbacil is reported to range from 0.22 to 2.1 µg/L, and the average recovery is reported to range from 97 to 129 percent, depending on the method option used (USEPA, 1995c).
1 The Method Detection Limit (MDL) is a statistical estimate of the minimum concentration of a substance that can be measured and reported with 99 percent confidence that the analyte concentration is greater than zero, i.e., greater than the background signal. The calculation of the MDL is based upon the precision of a series of replicate measurements of the analyte at low concentrations. The MDL incorporates estimates of the accuracy of the determination. The MDL is not a concentration that can typically be measured by the method on a routine basis. Detection limits may vary between analysts and laboratories under various laboratory conditions. The average recovery is the fraction or percent concentration of a target analyte determined relative to the true or expected concentration from a sample containing a known amount of the target analyte. (This can result in apparent recovery values greater than 100 percent.)
10-23

EPA – OGWDW Regulatory Determinations Support Document for CCL 2 June 2008
10.4.2 Treatment Technologies
Treatment technology status does not influence the determination of whether or not a contaminant should be regulated. However, treatment technologies must be readily available before a contaminant can be regulated with a national primary drinking water regulation (NPDWR). There is no evidence that terbacil is substantially removed by conventional treatments, such as coagulation/flocculation, sedimentation, and inert media filtration. Reverse osmosis is effective in removing many synthetic organic chemicals, but no specific data are available for terbacil removal. Currently, the most viable known treatment technology is activated carbon.
Granular activated carbon (GAC) treatment removes contaminants via the physical and chemical process of sorption: the contaminants attach to the carbon surface as water passes through the carbon bed. Activated carbon has a large sorption capacity for many water impurities, including synthetic organic chemicals, taste- and odor-causing compounds, and some species of mercury.
Adsorption capacity is typically represented by the Freundlich isotherm constant, with higher Freundlich (K) values indicating greater sorption potential. Activated carbon is considered to be cost-effective for removing a particular contaminant if the Freundlich (K) value of the contaminant is above 200 µg/g (L/µg)1/n (Speth et al., 2001). Speth et al. (2001) report that the Freundlich (K) value for terbacil is 69,300 µg/g (L/µg)1/n, which indicates that GAC is a promising treatment option. 10.5 Regulatory Determination The Agency has made a determination not to regulate terbacil with an NPDWR. Because terbacil does not appear to occur at health levels of concern in PWSs, the Agency believes that an NPDWR does not present a meaningful opportunity for health risk reduction. While terbacil has been found in ambient waters at the levels less than the HRL of 90 μg/L (as well as ½ the HRL), it was not found in the UCMR 1 survey of public water supplies. The Agency’s regulatory determination for this contaminant is presented formally in the Federal Register. 10.6 References Ahrens, W. 1994. Herbicide Handbook of the Weed Science Society of America. 7th Edition.
Champaign, IL: Weed Science Society of America.. (As cited in HSDB, 2004.) American Society for Testing and Materials (ASTM). 1996. Annual Book of ASTM Standards.
Volume 11.02. West Conshohocken, PA: American Society for Testing and Materials. ASTM. 1998. Annual Book of ASTM Standards. Volume 11.02. West Conshohocken, PA:
American Society for Testing and Materials.
10-24
EPA – OGWDW Regulatory Determinations Support Document for CCL 2 June 2008
Association of Official Analytical Chemist (AOAC) International. 1998. Official Methods of Analysis of AOAC International. 16th ed. 4th Revision. Volume I. Baltimore, MD: AOAC International.
Atkins, R., D. Perdue, and A. Kesterson. 1992a. Aerobic Soil Metabolism of [carbon 14]-
Terbacil. Lab Project Number: AMR 1689-90: 1403: 449. Unpublished study. (As cited in USEPA, 1998.)
Atkins, R., D. Perdue, and A. Kesterson. 1992b. Anaerobic Soil Metabolism of [carbon 14]
Terbacil. Lab Project Number: AMR1688-90: 1392: 450. Unpublished study. (As cited in USEPA, 1998.)
Atkins, R., D. Perdue, and A. Kesterson. 1992c. Aged Soil Column Leaching of [carbon 14]
Terbacil. Lab Project Number: AMR 2154-91: 1396: 597 Unpublished study. (As cited in USEPA, 1998.)
Barefoot, A. 1986. Photolysis of Terbacil on Soil. Document No. AMR-521-86. Unpublished
study. (As cited in USEPA, 1998.) Budavari, S. (ed.). 1996. The Merck Index - An Encyclopedia of Chemicals, Drugs, and
Biologicals. Whitehouse Station, NJ: Merck & Co., Inc. (As cited in HSDB, 2004.) Cortina, T. 1984. In vivo Bone Marrow Chromosome Study in Rats: H#14,673. Final Report:
Project No. 201-695. Unpublished study. (As cited in USEPA, 1998.) DuPont Agricultural Products (DuPont). 1995. Submission of Environmental Data in Support
of the Terbacil Registration Standard. Transmittal of 1 Study. MRID 43585500. (As cited in USEPA, 1998.)
Extoxnet. 1994. “Extension Toxicology Network Pesticide Information Profiles–Terbacil.”
Available on the Internet at: http://pmep.cce.cornell.edu/profiles/Extoxnet/pyrethrins-ziram/terbacil-ext.html. Accessed March 10, 2006.
Hansch, C., A.J. Leo, and D. Hoekman. 1995. Exploring QSAR B Hydrophobic, Electronic, and
Steric Constants. Washington, DC: American Chemical Society. (As cited in HSDB, 2004.)
Haskell Laboratories. 1965a. 14-day Rat Feeding Study. Unpublished study. (As cited in
USEPA, 1998.) Haskell Laboratories. 1965b. 3-week Rabbit Dermal Toxicity Study. Unpublished study. (As
cited in USEPA, 1998.) Haskell Laboratories. 1965c. Rat 90-day feeding study in Rats. Unpublished study. (As cited
in USEPA, 1998.)
10-25
EPA – OGWDW Regulatory Determinations Support Document for CCL 2 June 2008
Haskell Laboratories. 1980. Rat Oral Teratology with Terbacil. Unpublished study. (As cited in USEPA, 1998.)
Haskell Laboratories. 1984. CHO (HGPRT) Gene Mutation Assay with Terbacil. Unpublished
study. (As cited in USEPA, 1998.) Hazardous Substances Data Bank (HSDB). 2004. Search for Terbacil. Available on the
Internet through TOXNET, sponsored by the National Institute of Health=s National Library of Medicine. Available on the Internet at: http://toxnet.nlm.nih.gov/cgi-bin/sis/htmlgen?HSDB. Accessed November 1, 2004. Last updated May 4, 2001.
Henry, J. 1986. Skin Sensitization Test of Terbacil (IND-732-53) in Guinea Pigs for EPA
Pesticide Registration. Revised. Report No. 600-85: MR No. 4581-277. (As cited in USEPA, 1998.)
Hood, D. 1966. 15-exposure Skin Absorption Studies with 3-tert-Butyl-5-chloro-6-methyluracil.
Report No. 33-66. (As cited in USEPA, 1998.) Kolpin, D.W. and J.D. Martin. 2003. “Pesticides in Ground Water: Summary Statistics;
Preliminary Results from Cycle I of the National Water Quality Assessment Program (NAWQA), 1992-2001.” Available on the Internet at: http://ca.water.usgs.gov/pnsp/pestgw/Pest-GW_2001_Text.html. Accessed August 24, 2004.
Malek, D. 1993. Combined Chronic Toxicity/Oncogenicity Study with DPX-D732-66 (Terbacil)
Two Year Feeding Study in Rats. Lab Project Number: 9027-001: 453-93: 18260. Unpublished study. (As cited in USEPA, 1998.)
Martin, J.D., C.G. Crawford, and S.J. Larson. 2003. “Pesticides in Streams: Summary Statistics;
Preliminary Results from Cycle I of the National Water Quality Assessment Program (NAWQA), 1992-2001.” Available on the Internet at: http://ca.water.usgs.gov/pnsp/pestsw/Pest-SW_2001_Text.html. Accessed August 24, 2004.
National Center for Food and Agricultural Policy (NCFAP). 2004. National Pesticide Use
Database. Available on the Internet at: http://www.ncfap.org/database/default.htm. Rhodes, R.C. 1975. Biodegradation Studies with 2-14C-Terbacil in Water and Soil.
Unpublished study. (As cited in USEPA, 1998.) Solomon, H. 1984. Embryo-Fetal Toxicity and Teratogenicity Study of Terbacil by Gavage in
the Rabbit. Unpublished study. (As cited in USEPA 1998.) Speth, T.F., M.L. Magnuson, C.A. Kelty, and C.J. Parrett. 2001. Treatment Studies of CCL
Contaminants. In: Proceedings, AWWA Water Quality Technology Conference November 11-15, Nashville, TN.
10-26

EPA – OGWDW Regulatory Determinations Support Document for CCL 2 June 2008
Thelin, G.P. and L.P. Gianessi. 2000. Method for Estimating Pesticide Use for County Areas of
the Conterminous United States. U.S. Geological Survey Open-File Report 00-250. 62 pp. Available on the Internet at: http://ca.water.usgs.gov/pnsp/rep/ofr00250/ofr00250.pdf. Accessed August 30, 2004.
Tomlin, C.D.S. (ed.). 1997. The Pesticide Manual - World Compendium 11th Edition. Surrey,
England: British Crop Protection Council. (As cited in HSDB, 2004.) United States Environmental Protection Agency (USEPA). 1990. National Pesticide Survey:
Survey Analytes. EPA 570-9-90-NPS2. Available on the Internet at: http://nepis.epa.gov/pubtitleOSWER.htm. [Search for document number 570990NPS2.]
USEPA. 1992. Pesticides in Ground Water Database: A Compilation of Monitoring Studies,
1971-1991. National Summary. Office of Prevention, Pesticides and Toxic Substances. EPA 734-12-92-001. Available on the Internet at: http://nepis.epa.gov/pubtitleOPPTS.htm. [Search for document number 7341292001.]
USEPA. 1995a. Methods for the Determination of Organic Compounds in Drinking Water,
Supplement 3. EPA 600-R-95-131. USEPA. 1995b. Method 507 - Determination of Nitrogen and Phosphorus-Containing
Pesticides in Water by Gas Chromatography with a Nitrogen-Phosphorus Detector. Revision 2.1. In: Methods for the Determination of Organic Compounds in Drinking Water, Supplement 3. EPA 600-R-95-131.
USEPA. 1995c. Method 525.2 - Determination of Organic Compounds in Drinking Water by
Liquid-Solid Extraction and Capillary Column Gas Chromatography/Mass Spectrometry. Revision 2.0. In: Methods for the Determination of Organic Compounds in Drinking Water, Supplement 3. EPA 600-R-95-131.
USEPA. 1998. Reregistration Eligibility Decision (RED)--Terbacil. Office of Prevention,
Pesticides and Toxic Substances. EPA 738-R-97-011. January. Available on the Internet at: http://www.epa.gov/oppsrrd1/REDs/0039red.pdf.
USEPA. 2006. TRI Explorer: Trends. Search for terbacil. Available on the Internet at:
http://www.epa.gov/triexplorer/trends.htm. Accessed February 8, 2006. Last updated June 8, 2005.
USEPA. 2008. The Analysis of Occurrence Data from the First Unregulated Contaminant
Monitoring Regulation (UCMR 1) in Support of Regulatory Determinations for the Second Drinking Water Contaminant Candidate List. EPA 815-R-08-013. June.
United States Geological Survey (USGS). 2004. 1997 Pesticide Use Maps. Available on the
Internet at: http://ca.water.usgs.gov/pnsp/pesticide_use_maps_1997/. Accessed August 20, 2004.
10-27
EPA – OGWDW Regulatory Determinations Support Document for CCL 2 June 2008
10-28
Wazeter, F.X., R.H. Buller, and R.G. Geil. 1964. Ninety-day Feeding Study in the Rat: IRDC No. 125-004. Unpublished study. (As cited in USEPA, 1998.)
Wazeter, F.X., R.H. Buller, and R.G. Geil. 1967a. Two-Year Feeding Study in the Dog: IRDC
No. 125-011. Unpublished study. (As cited in USEPA, 1998.) Wazeter, F.X., R.H. Buller, and R.G. Geil. 1967b. Three-Generation Reproduction Study in the
Rat: IRDC No. 125-012. Unpublished study. (As cited in USEPA, 1998.)