chapter 10: noise in analog modulation a. bruce carlson
TRANSCRIPT

Communication Systems, 5e
Chapter 10: Noise in Analog Modulation
A. Bruce CarlsonPaul B. Crilly
© 2010 The McGraw-Hill Companies
Chapter 10: Noise in Analog Modulation
• Bandpass Noise• Linear CW Modulation With Noise• Exponential CW Modulation With Noise• Comparison Of CW Modulation Systems• Phase-locked Loop Noise Performance• Analog Pulse Modulation With Noise
© 2010 The McGraw-Hill Companies

3
Copyright © The McGraw-Hill Companies, Inc. Permission required for reproduction or display.
Figure 10.2-1
Model of receiver for SNR
• Select the noise model that best fits the receiver and demodulator operations– Quadrature (good for mixing)– Magnitude-phase (good for envelope detection)
4
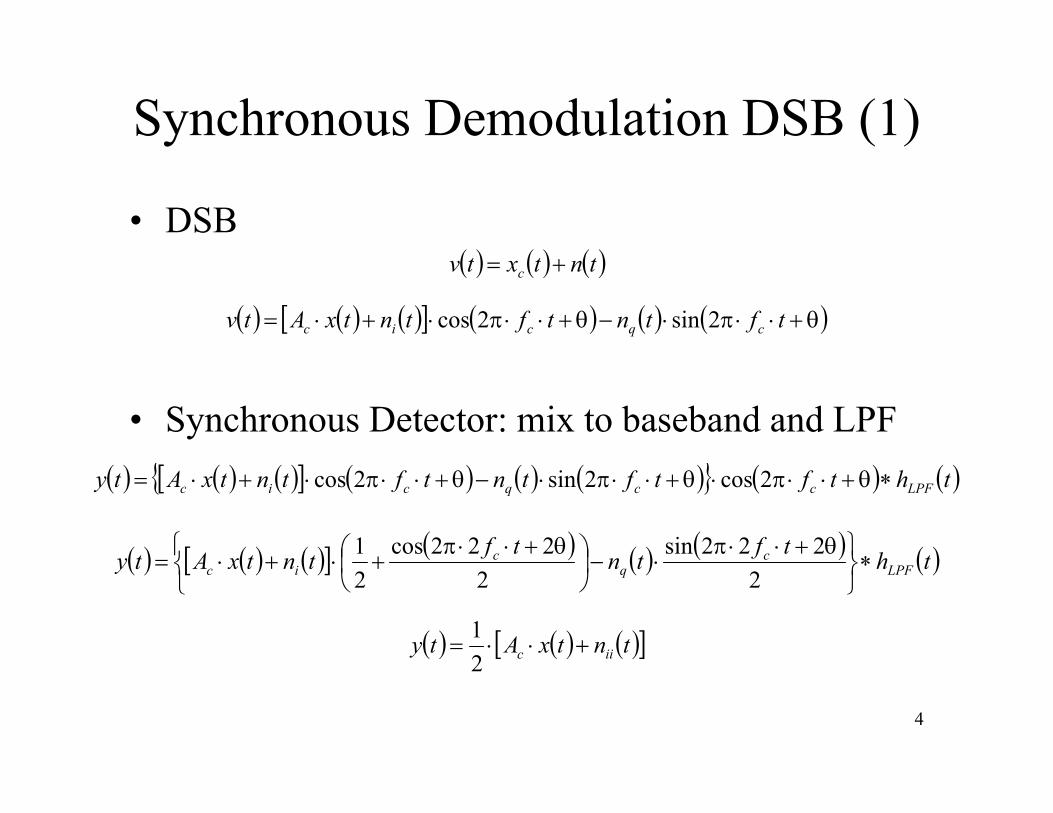
Synchronous Demodulation DSB (1)
• DSB
• Synchronous Detector: mix to baseband and LPF
tftntftntxAtv cqcic 2sin2cos
thtftftntftntxAty LPFccqcic 2cos2sin2cos
thtftntftntxAty LPFc
qc
ic
2
222sin2
222cos21
tntxAty iic 21
tntxtv c

5
Synchronous Demodulation DSB (2)
• DSB Pre-D SNR (RF BPF bandwidth BT=2W)
22
21 tntxAEtyE iic
22 tntxEtvE c
TRc BNStnEtxEtvE 0222
21
2 000
2
Pr T
R
TT
R
T
xc
De BW
WNS
BW
BNS
BNSA
NS
• DSB Post-D SNR (BB LPF bandwidth BLPF=W)
LPFRLPFxc BNSBNSAtyE 0022 22
412
41
WNS
BNSA
NS R
LPF
xc
DPost 00
2
2
2
2xc
RSASwhere
WNSAwhere xc
0
2
2
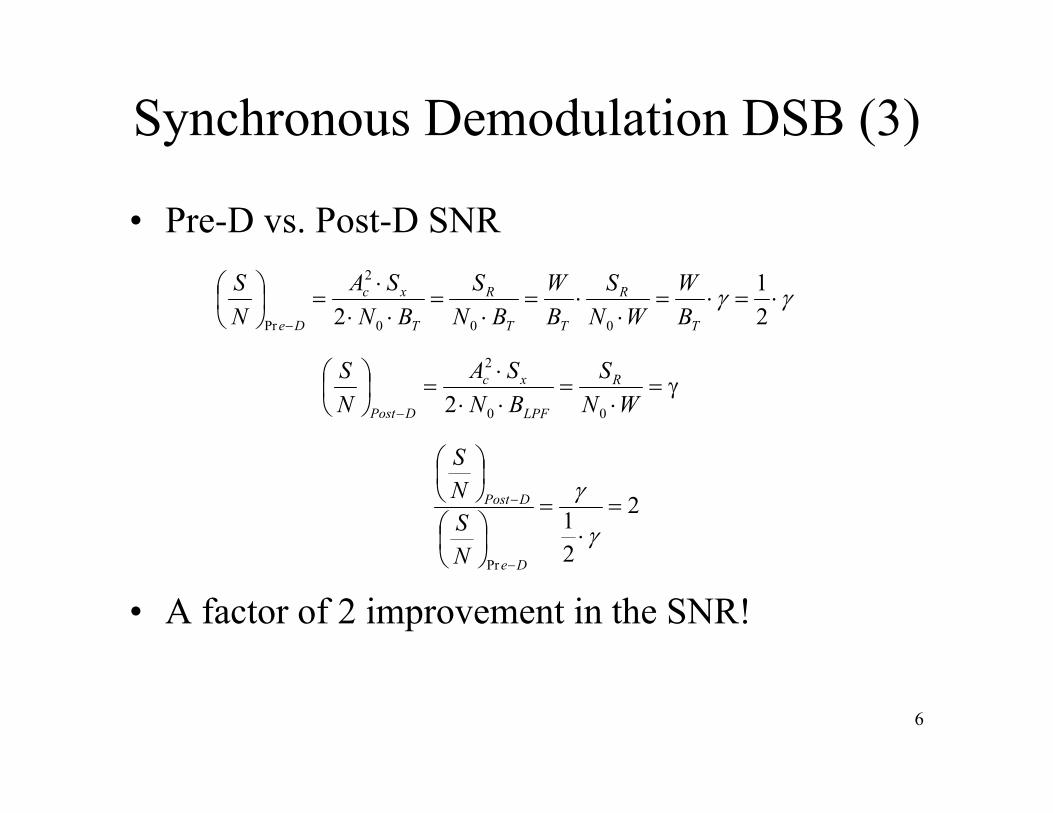
Synchronous Demodulation DSB (3)
• Pre-D vs. Post-D SNR
6
21
2 000
2
Pr T
R
TT
R
T
xc
De BW
WNS
BW
BNS
BNSA
NS
WNS
BNSA
NS R
LPF
xc
DPost 00
2
2
2
21
Pr
De
DPost
NSNS
• A factor of 2 improvement in the SNR!

MATLAB DSB Complex Downconversion
• Complex mixing, filtering and LPF
7
tftntftntxAtv cqcic 2sin2cos
thjtfjjtf
tftntftntxAty
LPFcc
cqcicComplex
2sin2cos
2sin2cos
th
tftntftnj
tftntxAjtftntxAty LPF
cq
cq
cic
cic
Complex
2222sin
2222cos
21
2222sin
2222cos
21
tntxAtyty iicComplex 21Re
tnjtntxAty qqiicComplex 21
WNWNS
NS X
DeComplex
00Pr WNS
NS X
DPost
0
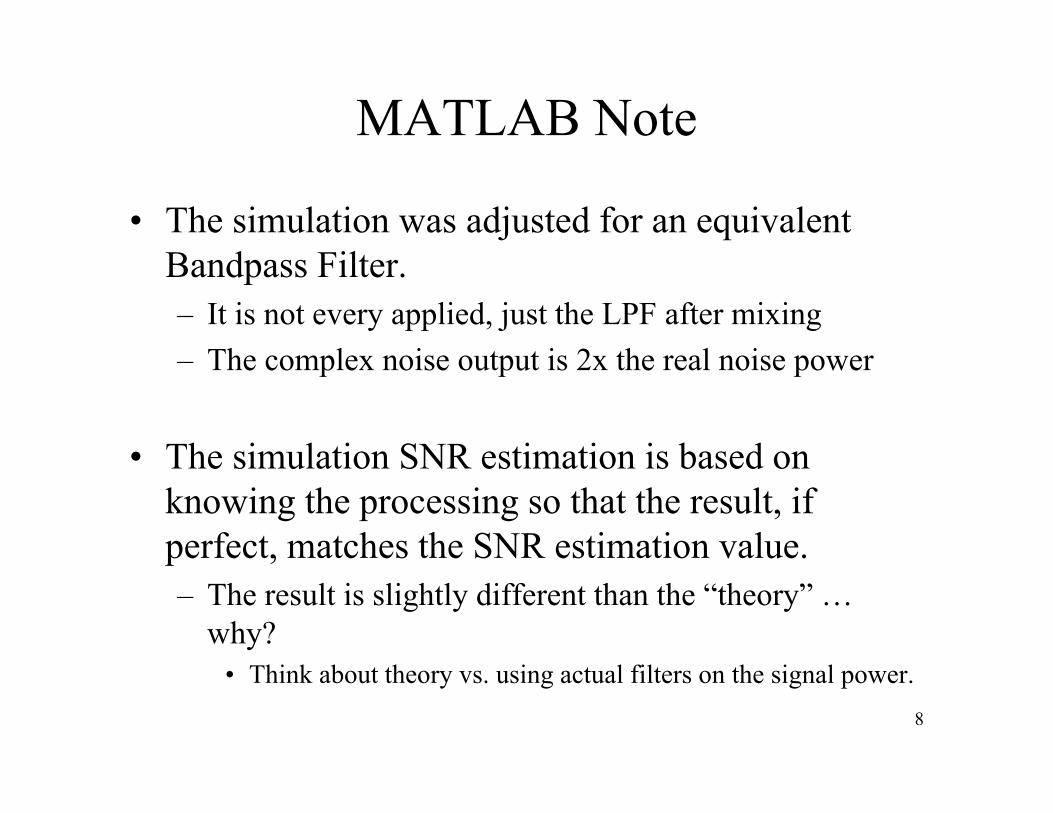
MATLAB Note
• The simulation was adjusted for an equivalent Bandpass Filter.– It is not every applied, just the LPF after mixing– The complex noise output is 2x the real noise power
• The simulation SNR estimation is based on knowing the processing so that the result, if perfect, matches the SNR estimation value.– The result is slightly different than the “theory” …
why?• Think about theory vs. using actual filters on the signal power.
8

9
Synchronous Demodulation AM (1)
• AM
• Synchronous Detector: mix to baseband, DC block and and LPF
tftntftntxAtv cqcic 2sin2cos1
thtftftntftntxAty ccqcic 2cos2sin2cos1
thtftntftntxAty cqq
ciic
2
222sin2
222cos211
tntxAty iic 21
tntxtv c
10
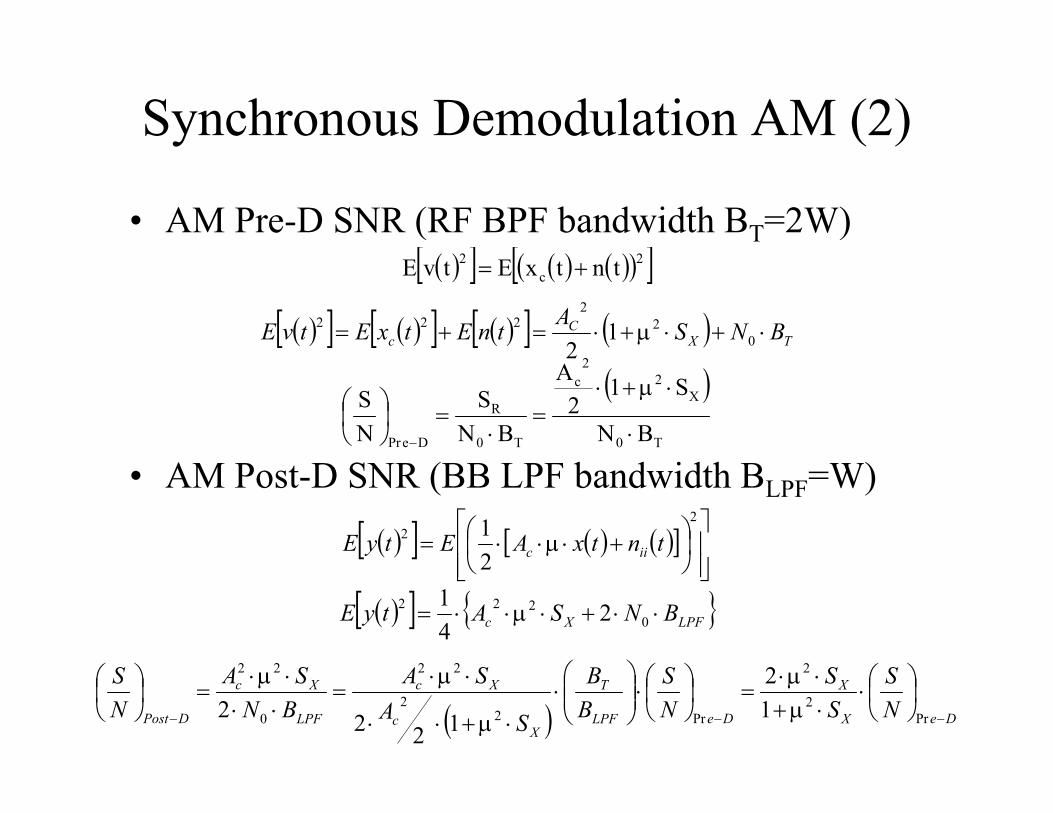
Synchronous Demodulation AM (2)
• AM Pre-D SNR (RF BPF bandwidth BT=2W) 2
c2 tntxEtvE
TXC
c BNSAtnEtxEtvE 02
2222 1
2
T0
X2
2c
T0
R
DePr BN
S12
A
BNS
NS
• AM Post-D SNR (BB LPF bandwidth BLPF=W)
22
21 tntxAEtyE iic
LPFXc BNSAtyE 0222 2
41
DeX
X
DeLPF
T
Xc
Xc
LPF
Xc
DPost NS
SS
NS
BB
SASA
BNSA
NS
Pr2
2
Pr22
22
0
22
12
1222

Synchronous Demodulation AM (3)
• Pre-D vs. Post-D SNR ( definition change)
11
• A change of the SNR!
24
1
0
22
Pr
WNSA
NS Xc
De
X
X
XX
Xc
DPost SS
SS
WNSA
NS
2
2
22
0
22
112
DeX
X
DPost NS
SS
NS
Pr2
2
21
WN
SANS Xc
De
0
22
Pr 212
12
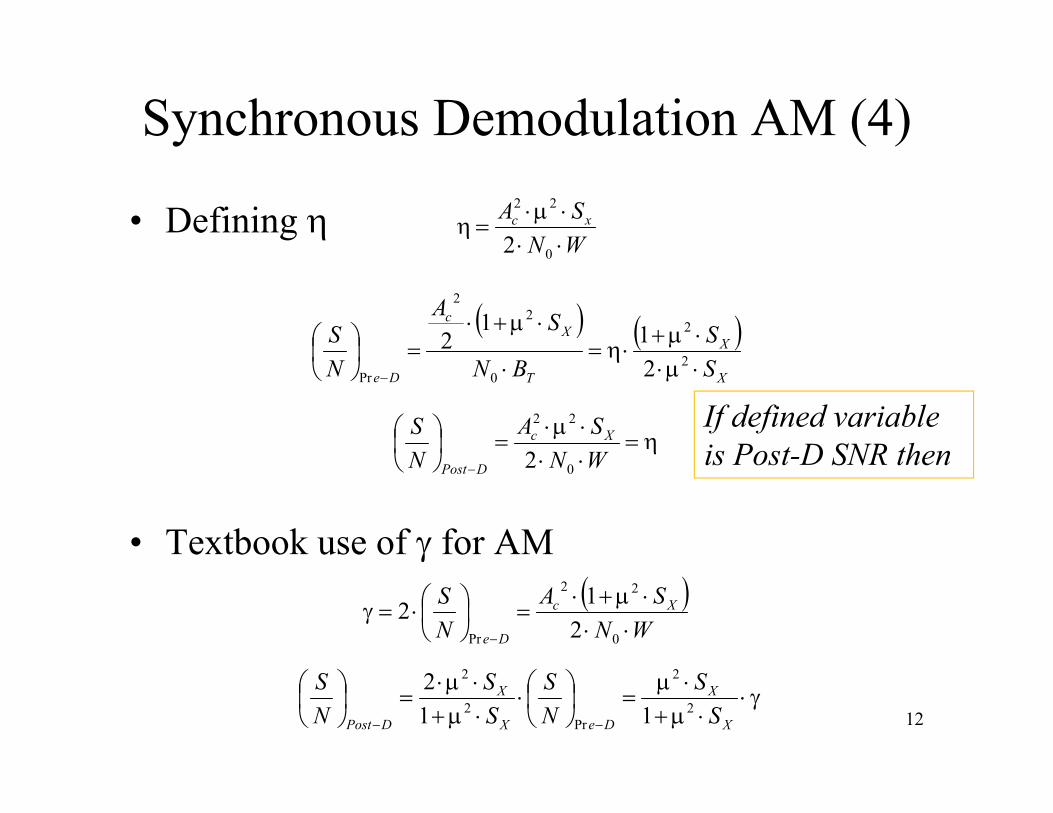
Synchronous Demodulation AM (4)
• Defining
• Textbook use of for AM
WNSA xc
0
22
2
X
X
T
Xc
De SS
BN
SA
NS
2
2
0
22
Pr 211
2
WNSA
NS Xc
DPost 0
22
2
X
X
DeX
X
DPost SS
NS
SS
NS
2
2
Pr2
2
112
WN
SANS Xc
De
0
22
Pr 212
If defined variable is Post-D SNR then
13
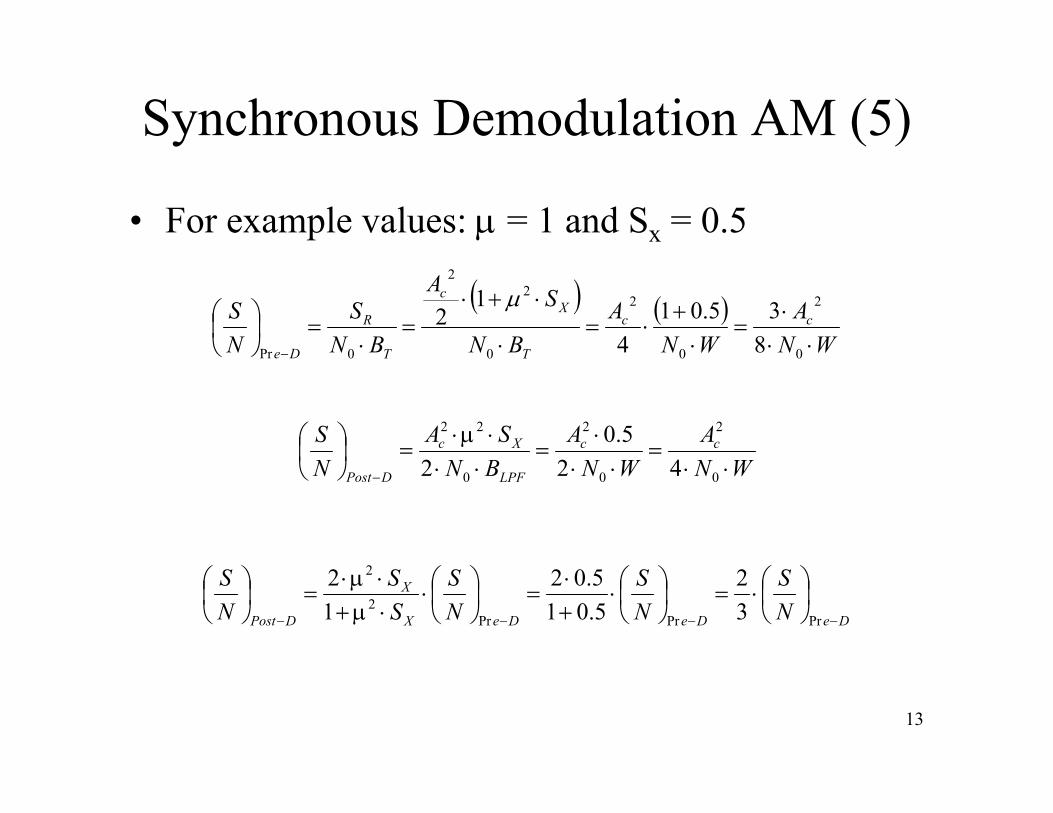
Synchronous Demodulation AM (5)
• For example values: = 1 and Sx = 0.5
WN
AWN
ABN
SA
BNS
NS cc
T
Xc
T
R
De
0
2
0
2
0
22
0Pr 835.01
4
12
WNA
WNA
BNSA
NS cc
LPF
Xc
DPost
0
2
0
2
0
22
425.0
2
DeDeDeX
X
DPost NS
NS
NS
SS
NS
PrPrPr2
2
32
5.015.02
12

14
AM vs DSB Demod Comparison
WNSA
BNSA
NS xc
T
xc
De
0
2
0
2
Pr 42
WNSA
NS xc
DPost
0
2
2 WNSA
NS Xc
DPost
0
22
2
WN
SANS Xc
De
0
22
Pr 41
DeX
X
DPost NS
SS
NS
Pr2
2
12
DSB AM
DeDPost NS
NS
Pr
2
DPost
xcDSB N
SWN
SA
0
2
2
De
XcAM N
SWN
SA
Pr0
22
22
1

15
AM Conclusions
• 67% or more of the Pre-D signal power comes from the carrier (therefore CNR).– There is only 33% of the “signal” SNR for AM as
compared to DSB
• The Post-D SNRs for DSB and AM can be made the same.
• If the signal powers (SX) are identical, AM is transmitting 3 or more time the power of DSB to achieve the same output, Post-D SNR.
16
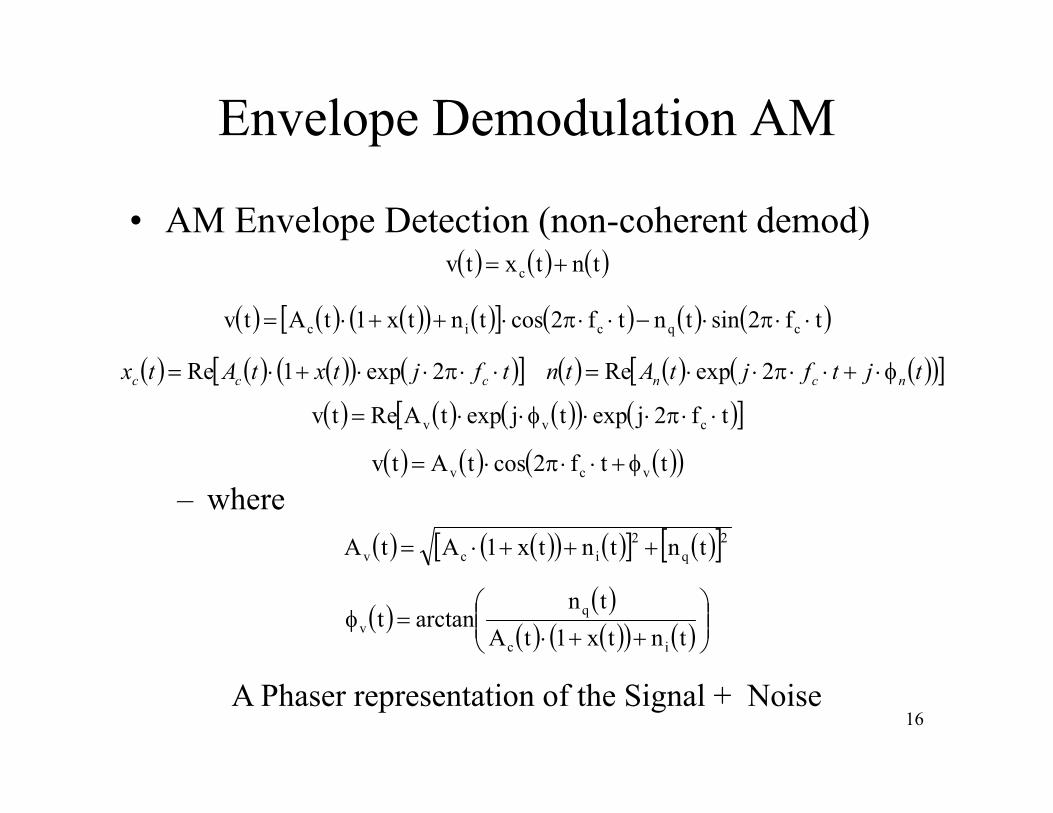
Envelope Demodulation AM
• AM Envelope Detection (non-coherent demod)
– where
tf2sintntf2costntx1tAtv cqcic
tntxtv c
ttf2costAtv vcv
2q2
icv tntntx1AtA
tntx1tA
tnarctant
ic
qv
A Phaser representation of the Signal + Noise
tf2jexptjexptARetv cvv
tfjtxtAtx ccc 2exp1Re tjtfjtAtn ncn 2expRe
17
Envelope Demodulation AM
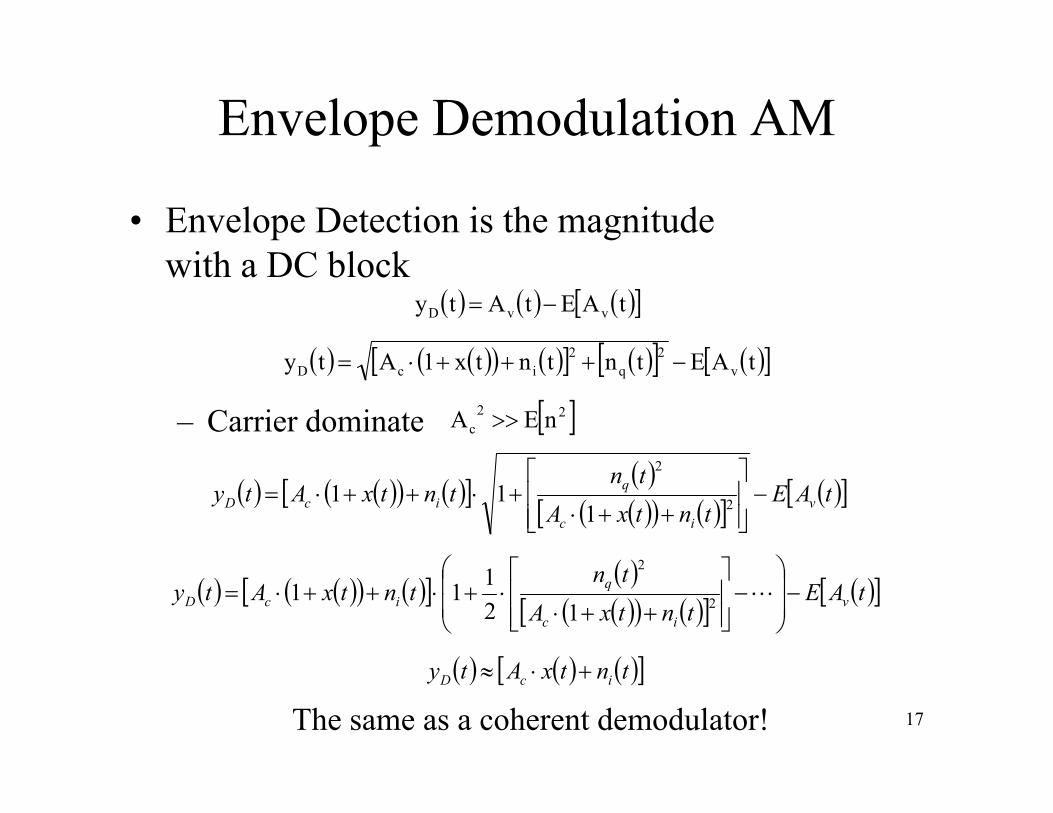
• Envelope Detection is the magnitude with a DC block
– Carrier dominate
tAEtAty vvD
The same as a coherent demodulator!
tAEtntntx1Aty v2
q2
icD
tAEtntxA
tntntxAty v
ic
qicD
2
2
111
22c nEA
tntxAty icD
tAEtntxA
tntntxAty v
ic
qicD
2
2
12111

18
Envelope Detector Threshold Effect
• The demodulator required the assumption
• If the condition is not met, the modulation process degrades into signal modulated noise which is not intelligible.– Rule of thumb: Pre-D SNR > 8-10 dB
– For “normal” signal (not DSSS) you need to have the signal above the noise floor … 8 dB is a useful starting point.
22c nEA
19
Copyright © The McGraw-Hill Companies, Inc. Permission required for reproduction or display.
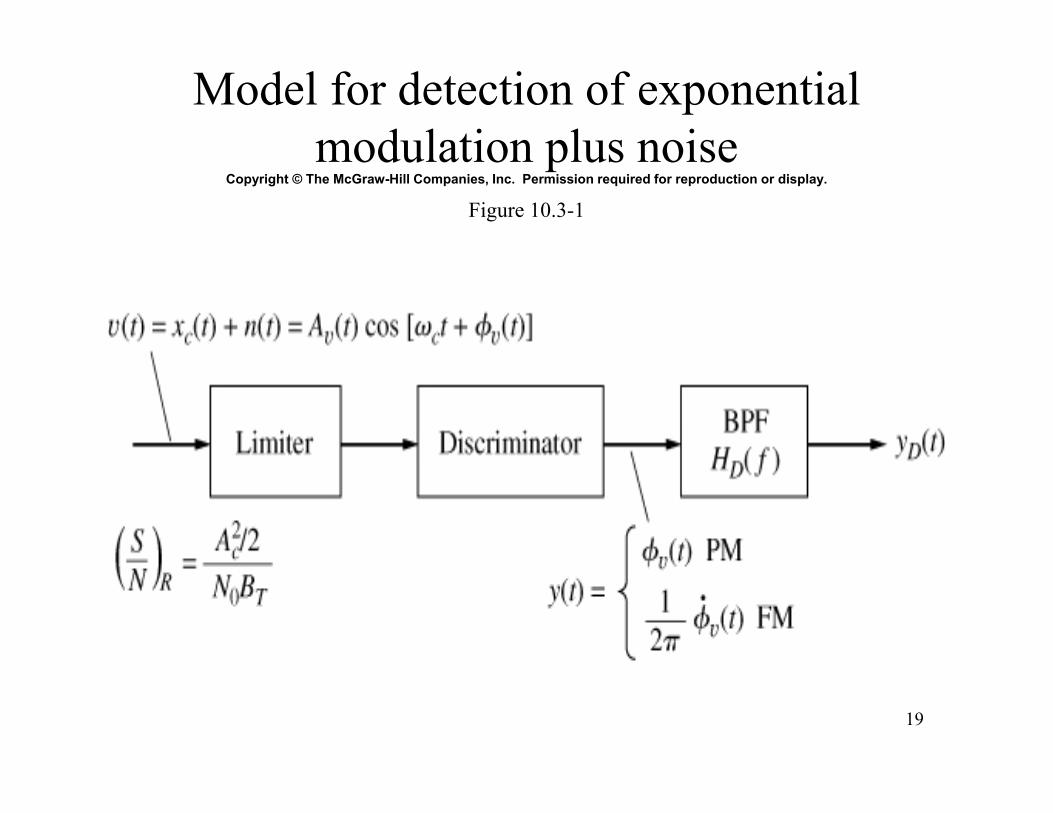
Figure 10.3-1
Model for detection of exponential modulation plus noise
20
Demodulation of FM/PM
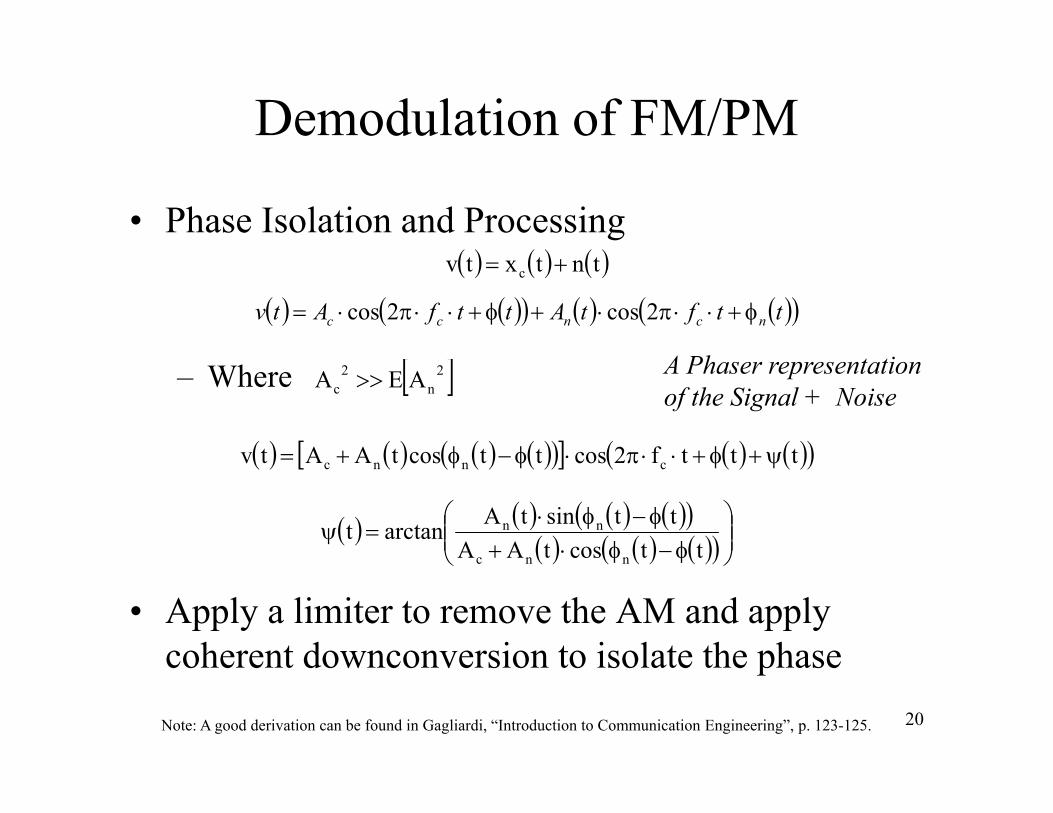
• Phase Isolation and Processing
– Where
• Apply a limiter to remove the AM and apply coherent downconversion to isolate the phase
ttftAttfAtv ncncc 2cos2cos
tntxtv c
ttcostAAttsintAarctant
nnc
nn
A Phaser representation of the Signal + Noise
2n
2c AEA
tttf2costtcostAAtv cnnc
Note: A good derivation can be found in Gagliardi, “Introduction to Communication Engineering”, p. 123-125.
21
Demodulation of FM/PM
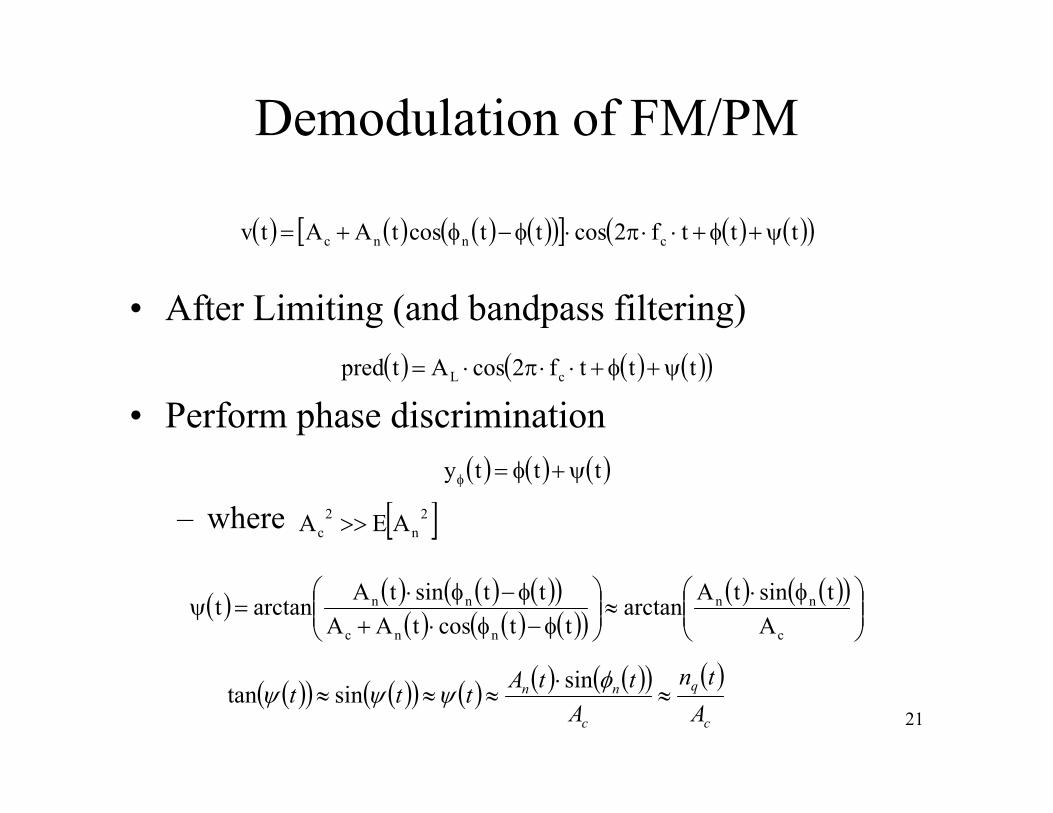
• After Limiting (and bandpass filtering)
• Perform phase discrimination
– where
tttf2costtcostAAtv cnnc
tttf2cosAtpred cL
ttty
c
nn
nnc
nn
AtsintAarctan
ttcostAAttsintAarctant
2n
2c AEA
c
q
c
nn
Atn
AttAttt
sinsintan

22
Demodulation of FM/PM
• After Extracting the Phase
• The noise PSD, when filtered by BW=B becomes
– PM post-detection noise is rectangular
• Apply appropriate filters for PM or FM– PM: include a post detection low pass filter (BW=W)– FM: a derivative and low pass filter
R
q
c
nn
Stn
tA
ttAtty
2
sin
R
q
c
nnn S
tnA
ttAty
2
sin
Bfrect
AN
Bfrect
S2NfS 2
c
0
R
0yn

23
PM Post-D SNR
• PM Phase output
• Post-D SNR (BW=W)
• RF Input SNR
ttxty nPM
xPMR
xPMRxPM
R
xPM
PostD
SWN
SSWN
SS
SWNS
NS 2
0
2
0
2
0
2
22
TT0
R
eDPr BW
BNS
NS
WNSwhere R
0
eD
TxPM
PostD NS
WBS
NS
Pr
2

24
FM: Differentiation and Filter
• FM Phase output
• Noise PSD, when filtered by BW=B becomes
– Notice that the power is 0 at DC and the power spectrum increases as the square of the frequency
tdttx2ty nFM
thdt
tdtxthdt
tdy nFM
21
21
Bfrect
SNf
Bfrect
SNffS
RRyn 222
12 0202
2
t
ttxtty n
FM
2
25
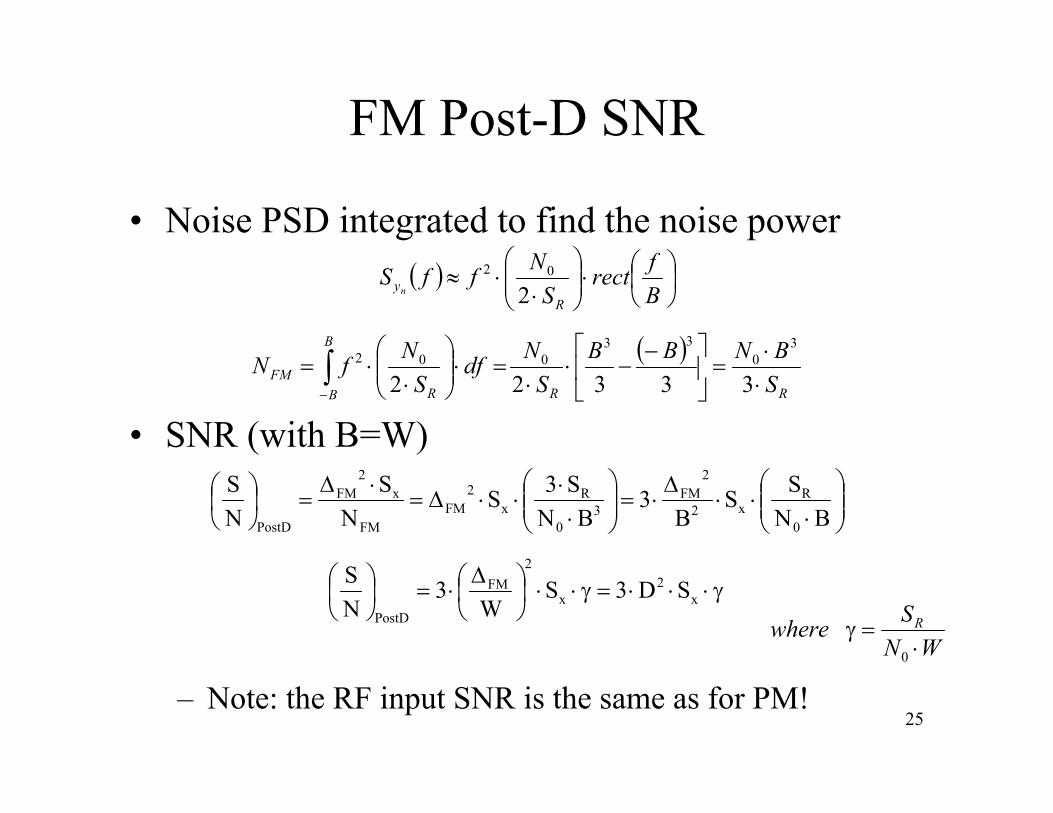
FM Post-D SNR
• Noise PSD integrated to find the noise power
• SNR (with B=W)
– Note: the RF input SNR is the same as for PM!
Bfrect
SNffS
Ryn 2
02
BNSS
B3
BNS3S
NS
NS
0
Rx2
2FM
30
Rx
2FM
FM
x2
FM
PostD
RR
B
B RFM S
BNBBS
NdfS
NfN
33322
30
33002
x2
x
2FM
PostD
SD3SW
3NS
WNSwhere R
0

26
SNR Improvement Using PM & FM
• RF Input SNR
TT0
R
eDPr BW
BNS
NS
WNSwhere R
0
• PM Post-D SNR • FM Post-D SNR
x2
x
2FM
PostD
SD3SW
3NS
PreD
Tx
PostD NS
WBSD
NS
23
xPMPostD
SNS 2
eD
TxPM
PostD NS
WBS
NS
Pr
2

27
Summarizing Derivations (1)• The post-detection (demodulation) noise spectral densities
in PM and FM have out-of-band components that call for post-detection filtering– Clean up demod and limit noise with a LPF of bandwidth B=W
– The PM noise spectrum is flat, like linear modulation except for the out-of-band components.
– The FM noise spectrum increases parabolically, f2, so higher baseband signal frequencies suffer more noise contamination than lower frequencies.
Bfrect
SNffS
Ryn 2
02
Bfrect
AN
Bfrect
S2NfS 2
c
0
R
0yn
28
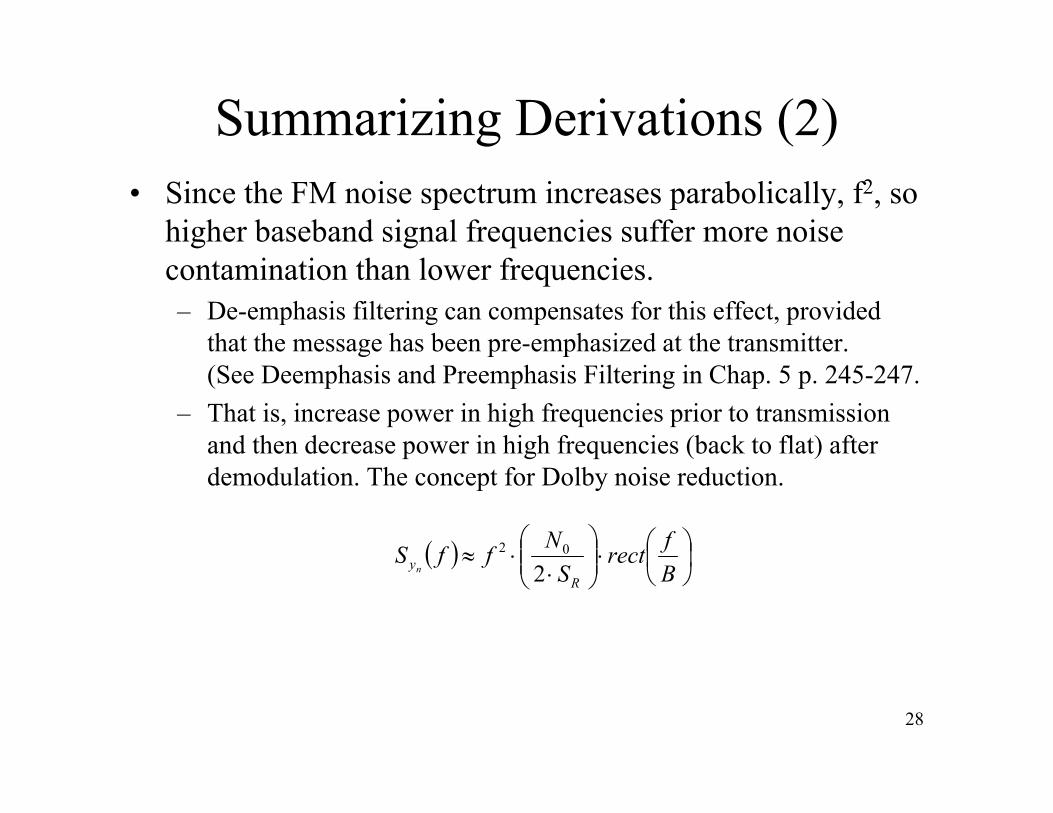
Summarizing Derivations (2)• Since the FM noise spectrum increases parabolically, f2, so
higher baseband signal frequencies suffer more noise contamination than lower frequencies. – De-emphasis filtering can compensates for this effect, provided
that the message has been pre-emphasized at the transmitter.(See Deemphasis and Preemphasis Filtering in Chap. 5 p. 245-247.
– That is, increase power in high frequencies prior to transmission and then decrease power in high frequencies (back to flat) after demodulation. The concept for Dolby noise reduction.
Bfrect
SNffS
Ryn 2
02
29
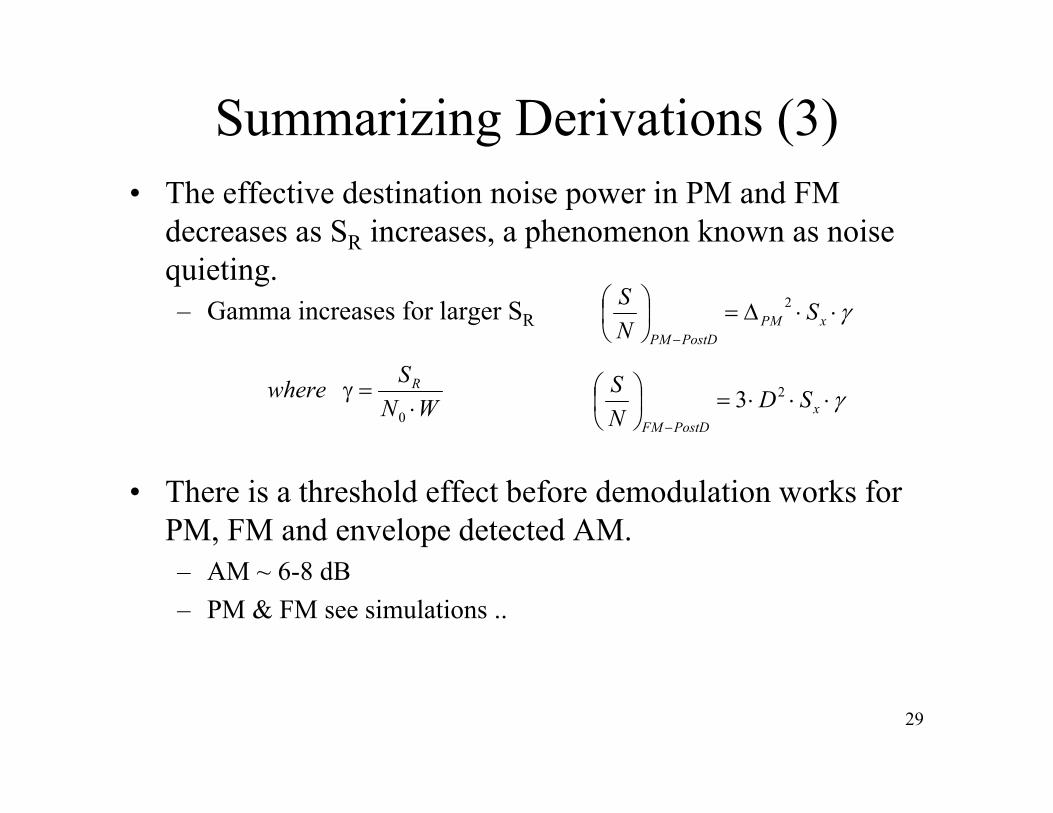
Summarizing Derivations (3)• The effective destination noise power in PM and FM
decreases as SR increases, a phenomenon known as noise quieting.– Gamma increases for larger SR
• There is a threshold effect before demodulation works for PM, FM and envelope detected AM.– AM ~ 6-8 dB– PM & FM see simulations ..
WNSwhere R
0
x
PostDFM
SDNS 23
xPM
PostDPM
SNS 2
30
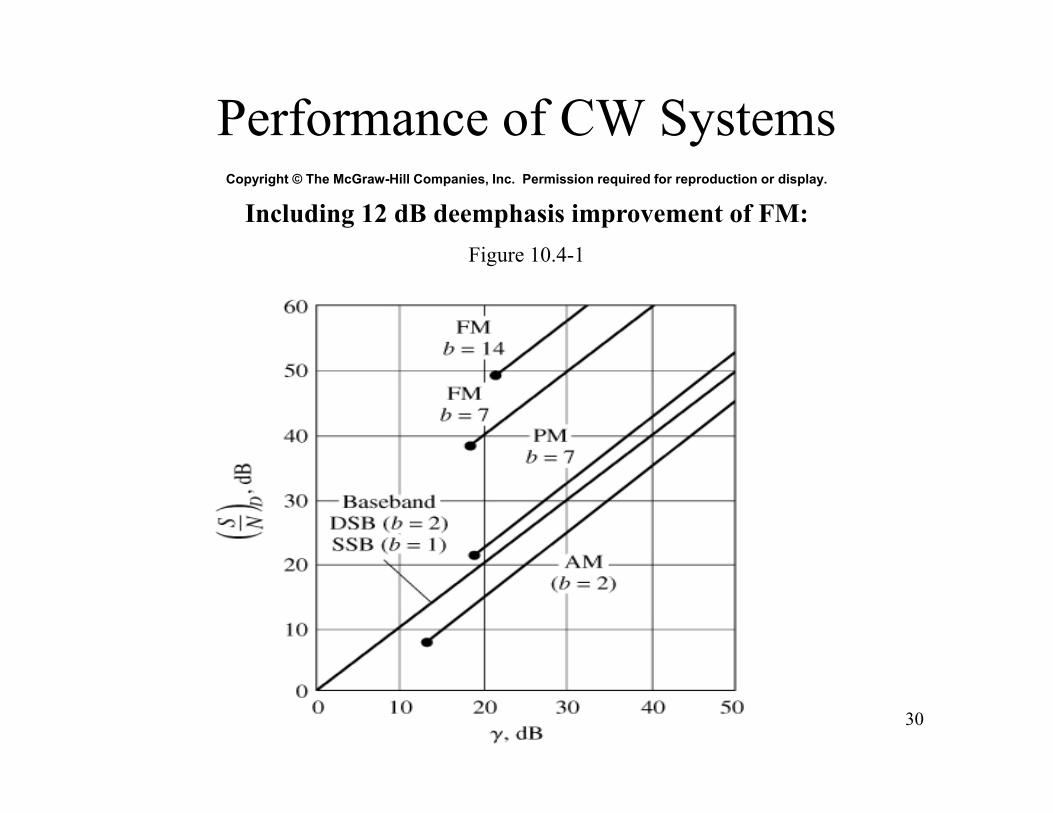
Copyright © The McGraw-Hill Companies, Inc. Permission required for reproduction or display.
Including 12 dB deemphasis improvement of FM: Figure 10.4-1
Performance of CW Systems
31
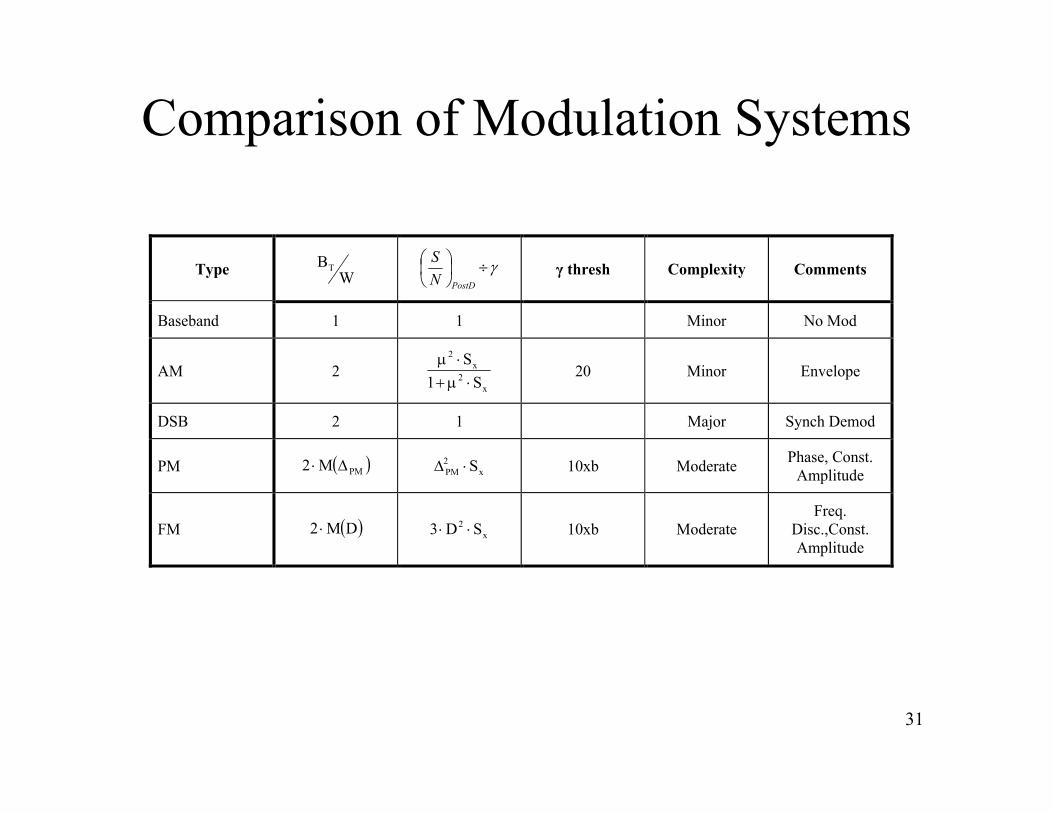
Comparison of Modulation Systems
Type WBT
PostDNS γ thresh Complexity Comments
Baseband 1 1 Minor No Mod
AM 2 x
2x
2
S1S
20 Minor Envelope
DSB 2 1 Major Synch Demod
PM PMM2 x2PM S 10xb Moderate Phase, Const.
Amplitude
FM DM2 x2 SD3 10xb Moderate
Freq. Disc.,Const. Amplitude

MATLAB Simulations: AM, FM, PM and FM (D=5)
32
0 5 10 15 20 25 30 35 40 45-10
0
10
20
30
40
50
60
70SNR Simulation for AM, PM, and FM D=5
Pre-D SNR (dB)
Pos
t-D S
NR
(dB
)
AM simAMDSB simDSBPM simPMFM5 simFM5
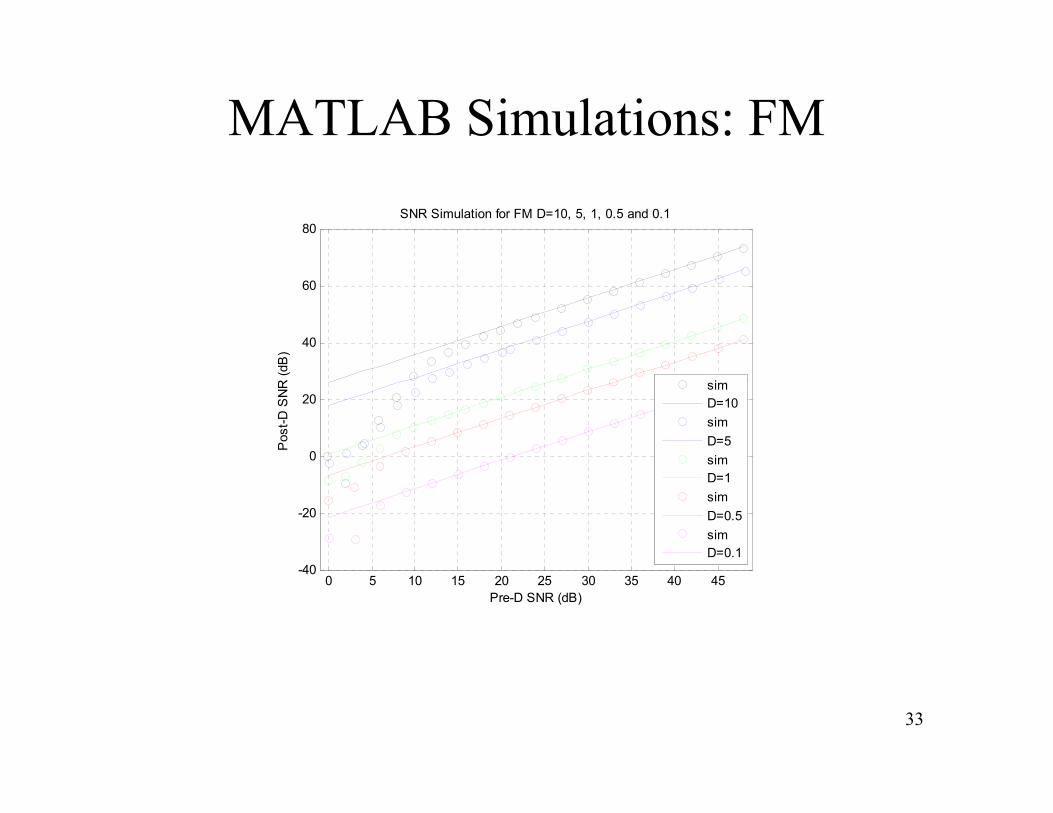
MATLAB Simulations: FM
33
0 5 10 15 20 25 30 35 40 45-40
-20
0
20
40
60
80SNR Simulation for FM D=10, 5, 1, 0.5 and 0.1
Pre-D SNR (dB)
Pos
t-D S
NR
(dB
)
simD=10simD=5simD=1simD=0.5simD=0.1