chapter 10 growth
DESCRIPTION
Biology : GrowthTRANSCRIPT
:
CHAPTER 10.0
GROWTH
(3 hrs)

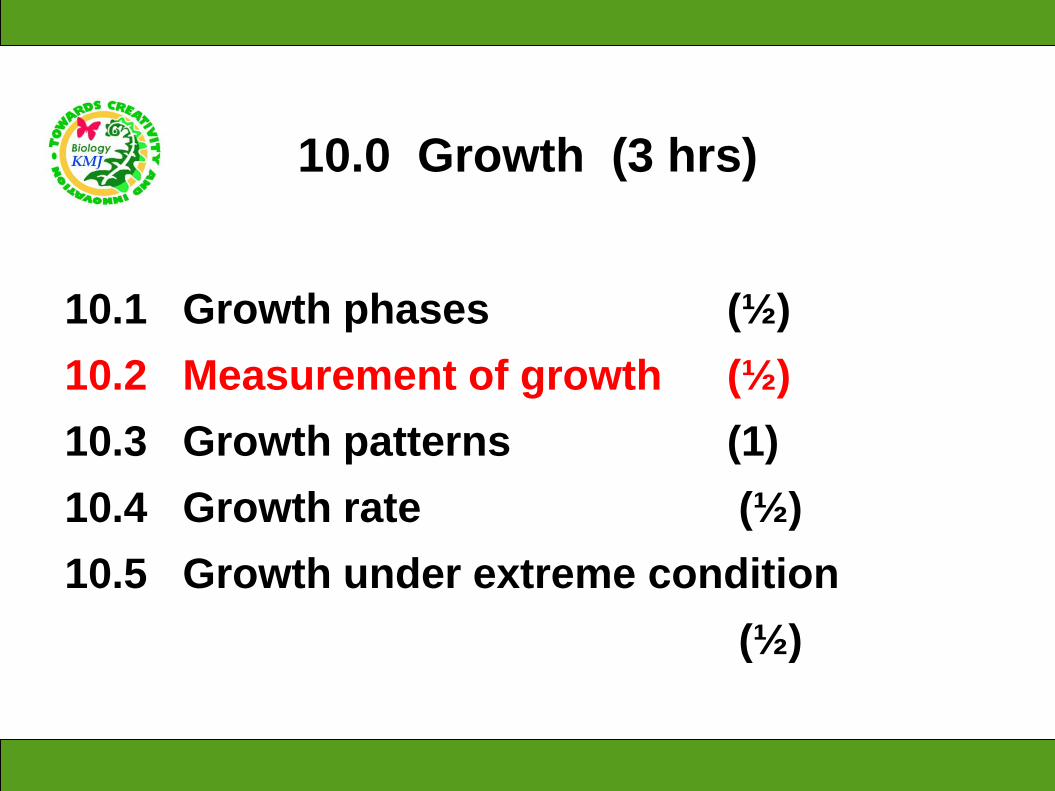
10.0 Growth (3 hrs)
10.1 Growth phases (½)
10.2 Measurement of growth (½)
10.3 Growth patterns (1½)
10.4 Growth rate (½)
Learning outcomes
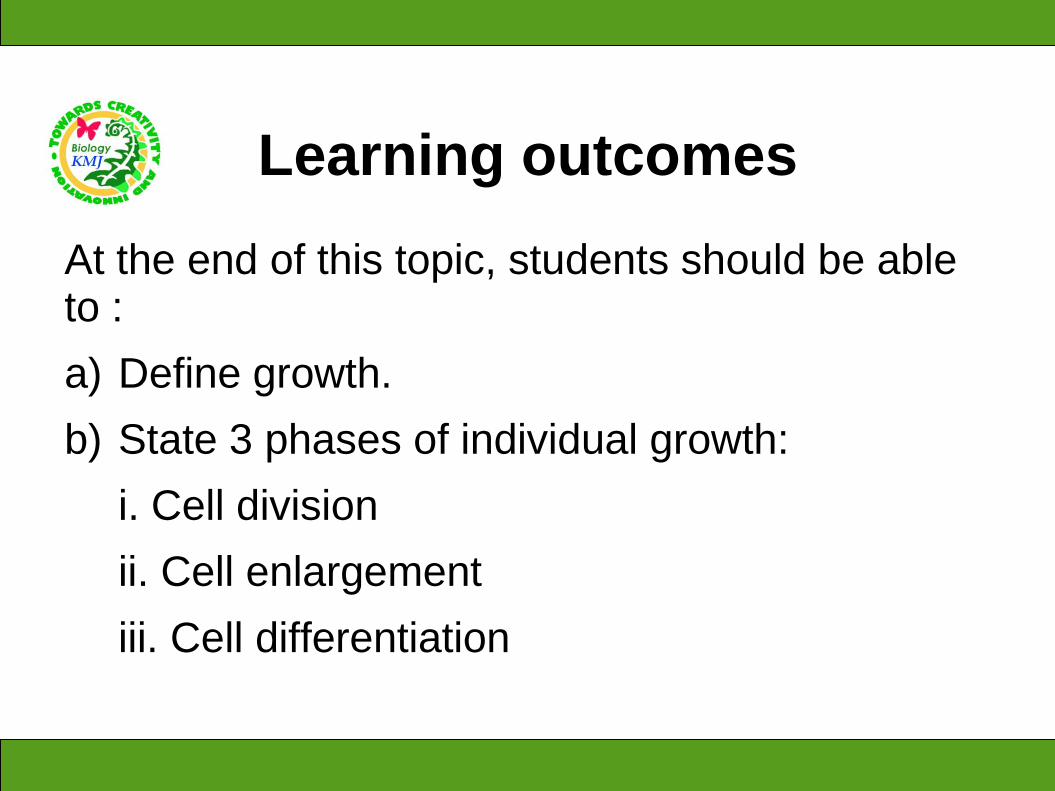
At the end of this topic, students should be able to :
a) Define growth.
b) State 3 phases of individual growth:
i. Cell division
ii. Cell enlargement
iii. Cell differentiation
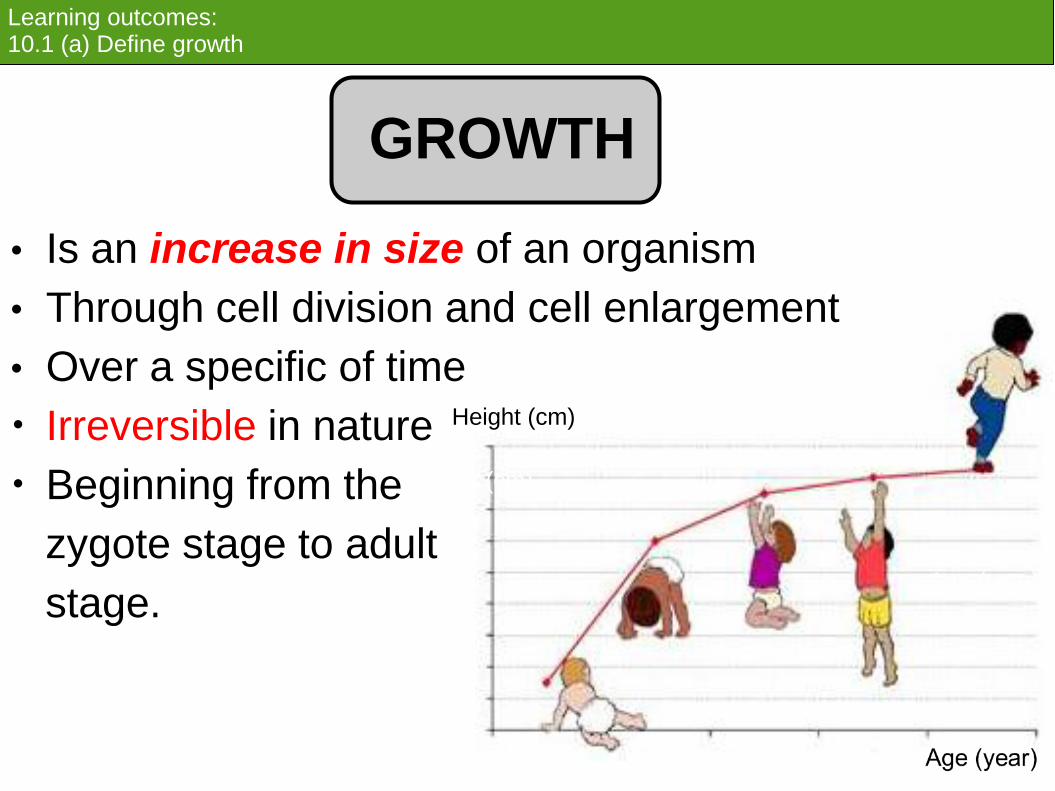
Learning outcomes: 10.1 (a) Define growth
• Is an increase in size of an organism
• Through cell division and cell enlargement
• Over a specific of time
• Irreversible in nature
• Beginning from the
zygote stage to adult
stage.
Height (cm)
Age (year)
Height (cm)
GROWTH

Learning outcomes: 10.1 (a) Define growth
• Growth parameters include :
- biomass
- length
- width
- height
- volume
- cell number
Height (cm)
Age (year)
Height (cm)

Learning outcomes: 10.1 (b) State 3 phases of individual growth:
3 phases of individual growth :
i) cell division
ii) cell enlargement
iii) cell differentiation
Height (cm)
Age (year)

1. Cell division
o Cell divides from new
cell by mitosis
o At root tips/shoot tips
o Daughter cells have
dense protoplasm
o Daughter cells have
same number of
chromosomes/genetic
constitution with the
parent cells
Learning outcomes: 10.1 (b) State 3 phases of individual growth:
Individual Growth Phases
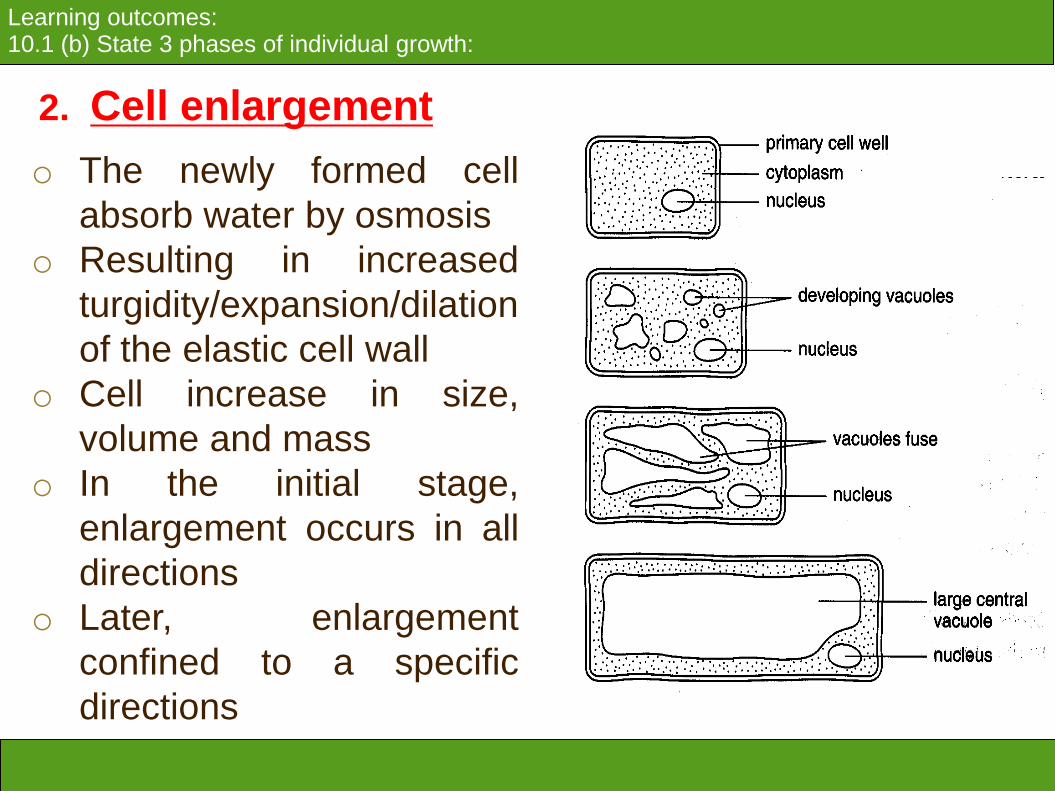
2. Cell enlargement
o The newly formed cell
absorb water by osmosis
o Resulting in increased
turgidity/expansion/dilation
of the elastic cell wall
o Cell increase in size,
volume and mass
o In the initial stage,
enlargement occurs in all
directions
o Later, enlargement
confined to a specific
directions
Learning outcomes: 10.1 (b) State 3 phases of individual growth:
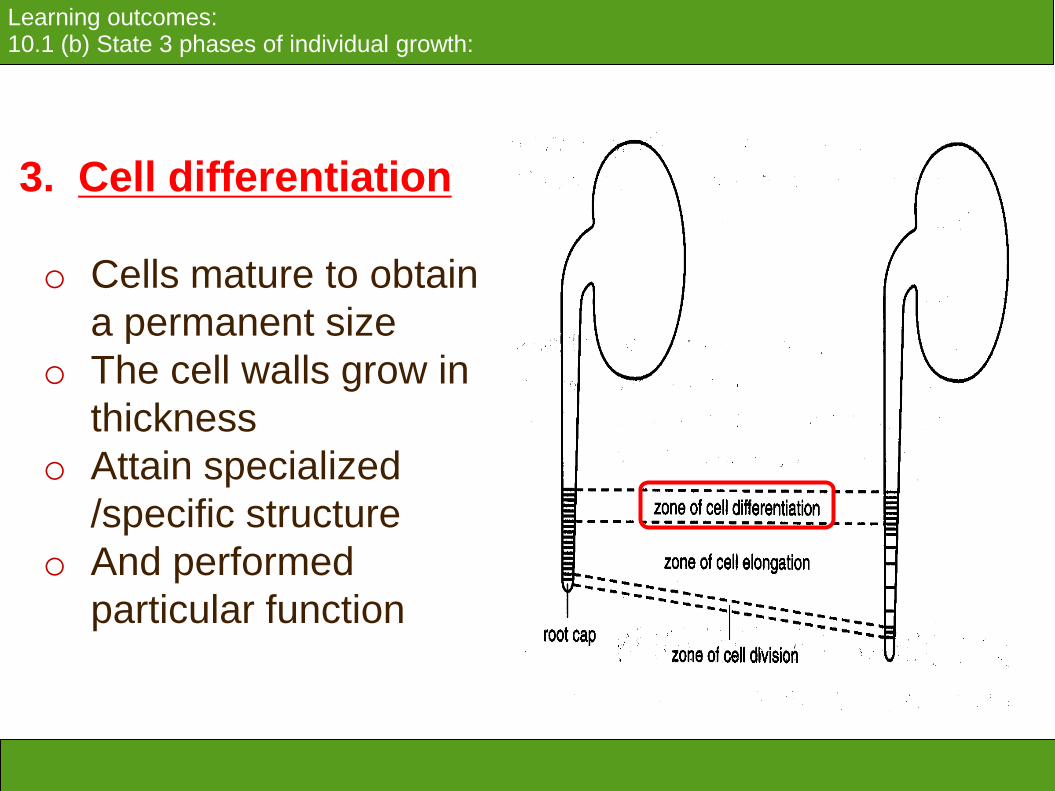
3. Cell differentiation
o Cells mature to obtain
a permanent size
o The cell walls grow in
thickness
o Attain specialized
/specific structure
o And performed
particular function
Learning outcomes: 10.1 (b) State 3 phases of individual growth:
Learning outcomes: 10.1 (b) State 3 phases of individual growth:
10.0 Growth (3 hrs)
10.1 Growth phases (½)
10.2 Measurement of growth (½)
10.3 Growth patterns (1)
10.4 Growth rate (½)
10.5 Growth under extreme condition
(½)

Learning outcomes
At the end of this topic, students should be able to :
Explain how growth is measured.

• Growth can be measured by using a certain parameter over a period of time.
• Parameter chosen must be appropriate to the organism whose growth is to be measured.
• Eg: height, appropriate for human but not trees (can’t measure growth of root)
Measurements of Growth
Learning outcomes: 10.2 Explain how growth is measured.

Learning outcomes: 10.2 Explain how growth is measured.
Measurements of Growth
Measurements of Growth
Size Biomass
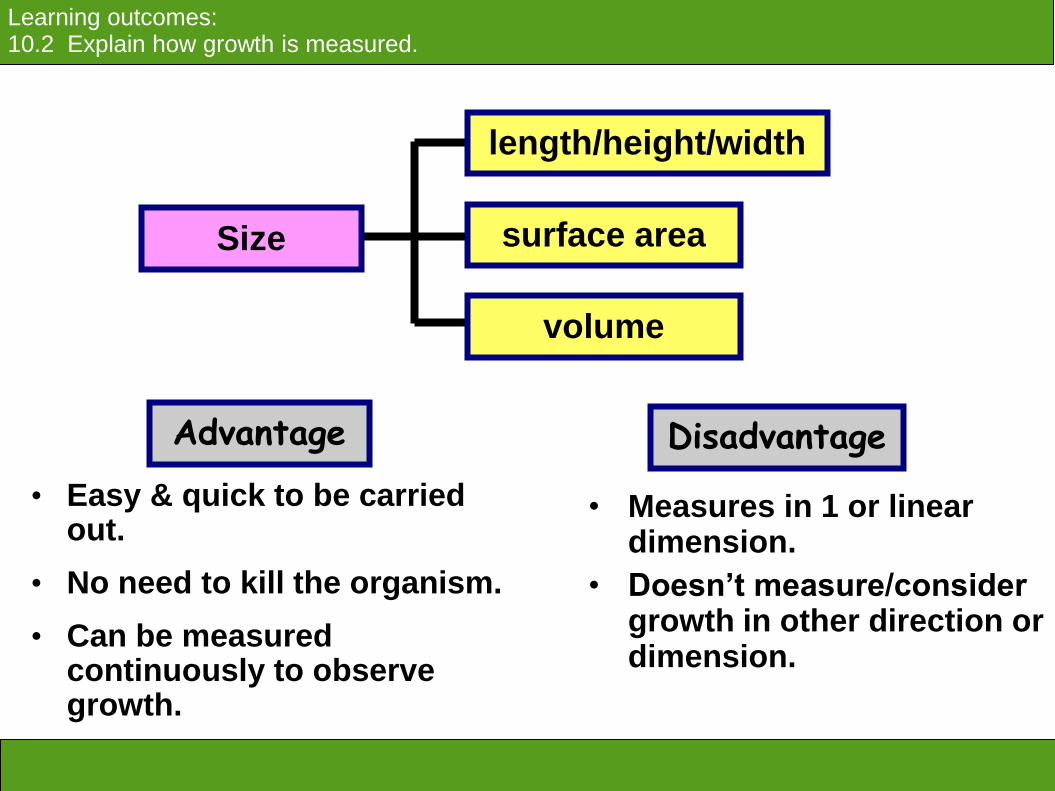
• Easy & quick to be carried out.
• No need to kill the organism.
• Can be measured continuously to observe growth.
Size
length/height/width
surface area
volume
• Measures in 1 or linear dimension.
• Doesn’t measure/consider growth in other direction or dimension.
Advantage Disadvantage
Learning outcomes: 10.2 Explain how growth is measured.

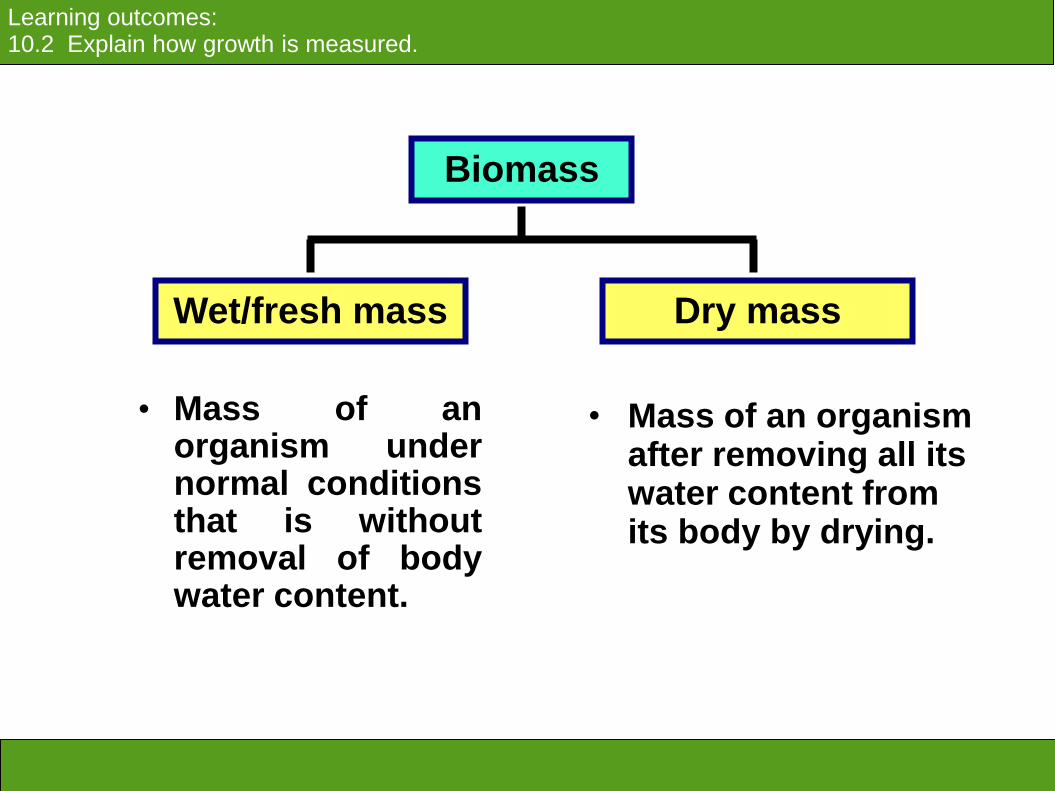
• Mass of an organism under normal conditions that is without removal of body water content.
Biomass
Wet/fresh mass Dry mass
• Mass of an organism after removing all its water content from its body by drying.
Learning outcomes: 10.2 Explain how growth is measured.

• Easy to measure, requires little preparation of the sample.
• Doesn’t cause injury to an organism.
• Can be used to monitor growth of an organism over a period of time.
Wet/fresh mass
• Doesn’t measure true growth because it may give inconsistent readings.
• Influenced & fluctuations in water content of the body.
Advantage Disadvantage
Learning outcomes: 10.2 Explain how growth is measured.

• Accurate measurement of the amount of organic matter present.
Dry mass
• (Many) organisms are killed.
• Growth of the same specimen can’t be measured continuously.
• Need a large number of genetically identical specimen grown under similar condition to measure growth to obtain a representative reflection of growth.
• Can’t be used to monitor growth of an organism over a period of time.
• Time consuming.
Advantage Disadvantage
Learning outcomes: 10.2 Explain how growth is measured.
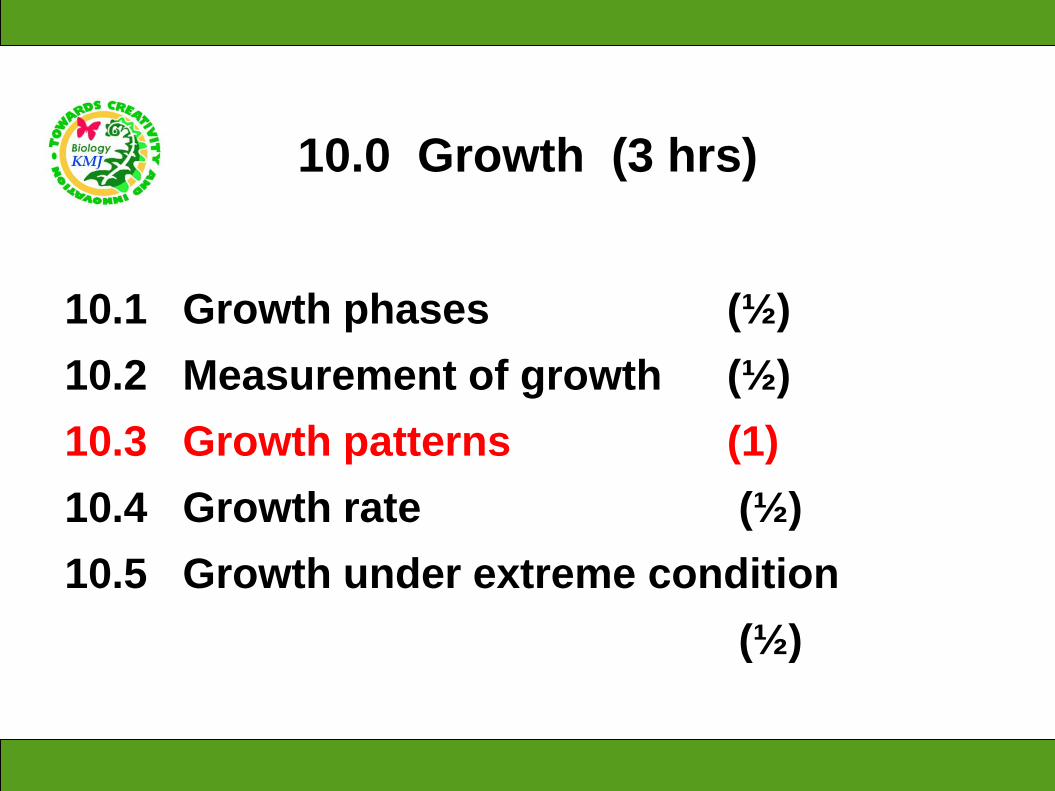
10.0 Growth (3 hrs)
10.1 Growth phases (½)
10.2 Measurement of growth (½)
10.3 Growth patterns (1)
10.4 Growth rate (½)
10.5 Growth under extreme condition
(½)

Learning outcomes
a) Explain sigmoid growth curve (organism and population).
b) Explain human growth curve.
c) Explain limited growth curve (annual plants) and unlimited growth curve (perennial plants).
d) Explain isometric growth (fish) and allometric growth (human organs).
e) Explain intermittent growth curve (arthropods).
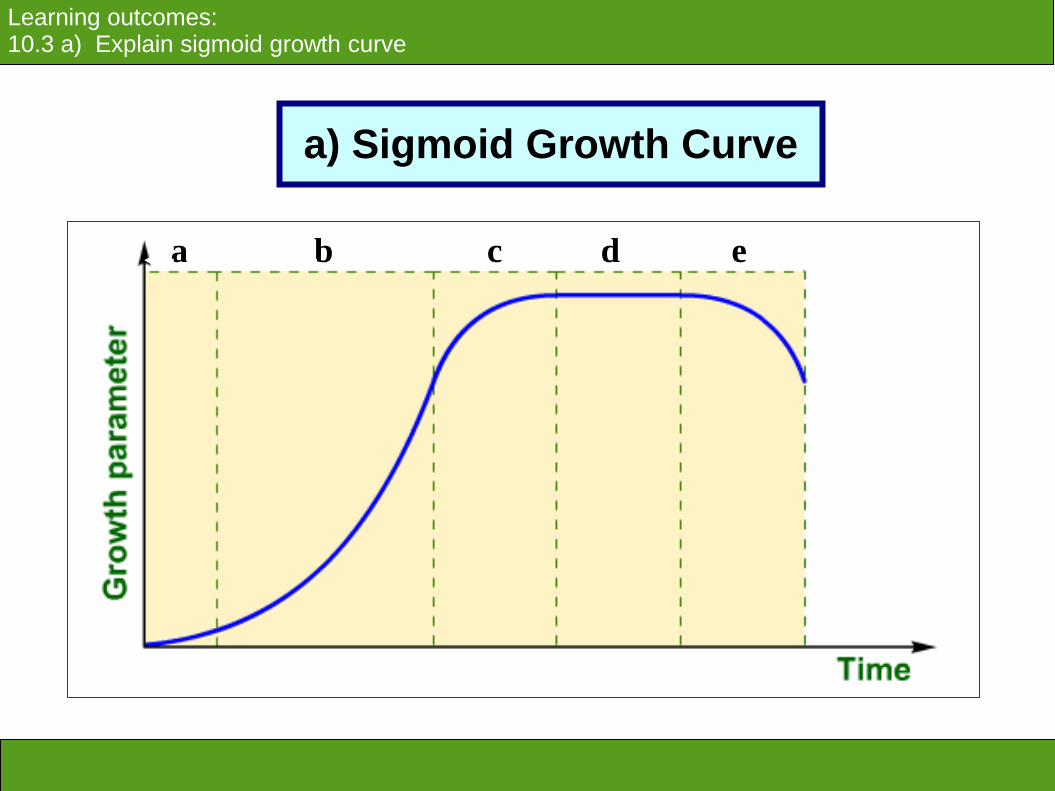
a) Sigmoid Growth Curve
b e a c d
Learning outcomes: 10.3 a) Explain sigmoid growth curve
Learning outcomes: 10.3 a) Explain sigmoid growth curve
a) Sigmoid Growth Curve
Learning outcomes: 10.3 a) Explain sigmoid growth curve
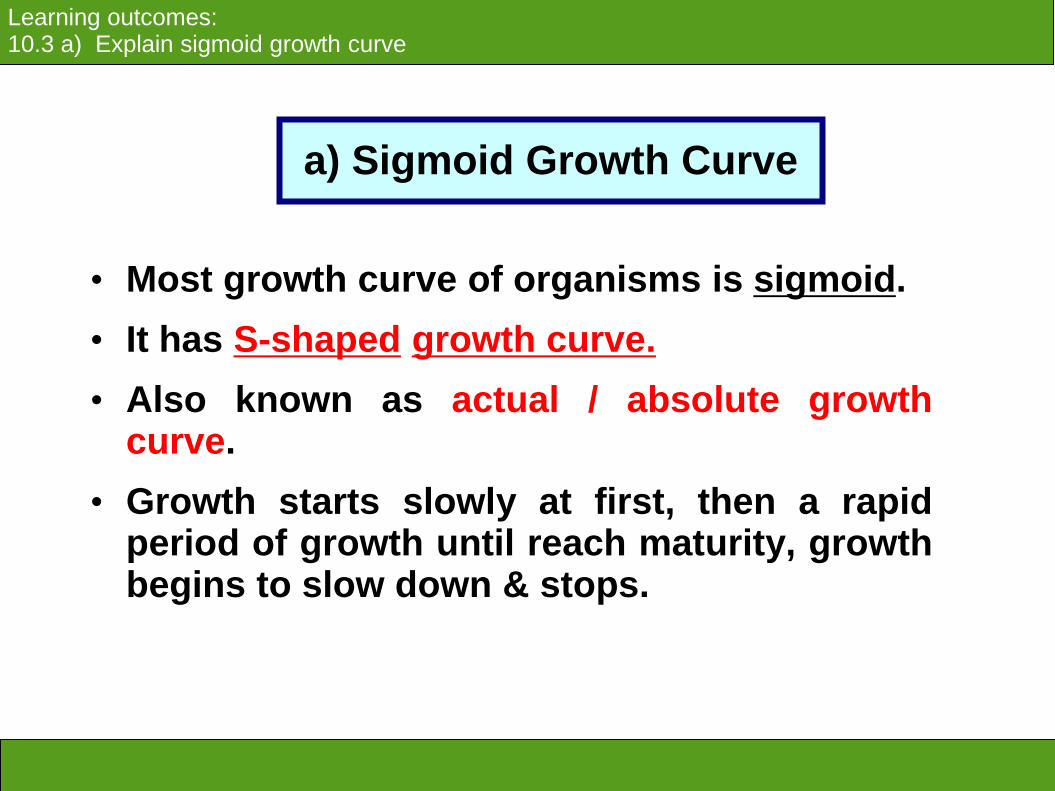
• Most growth curve of organisms is sigmoid.
• It has S-shaped growth curve.
• Also known as actual / absolute growth curve.
• Growth starts slowly at first, then a rapid period of growth until reach maturity, growth begins to slow down & stops.
a) Sigmoid Growth Curve

Learning outcomes: 10.3 a) Explain sigmoid growth curve
Can be plotted when absolute parameter (eg: height or mass) against time.
A growth curve is obtained which has S-shaped or sigmoid curve.
a) Sigmoid Growth Curve

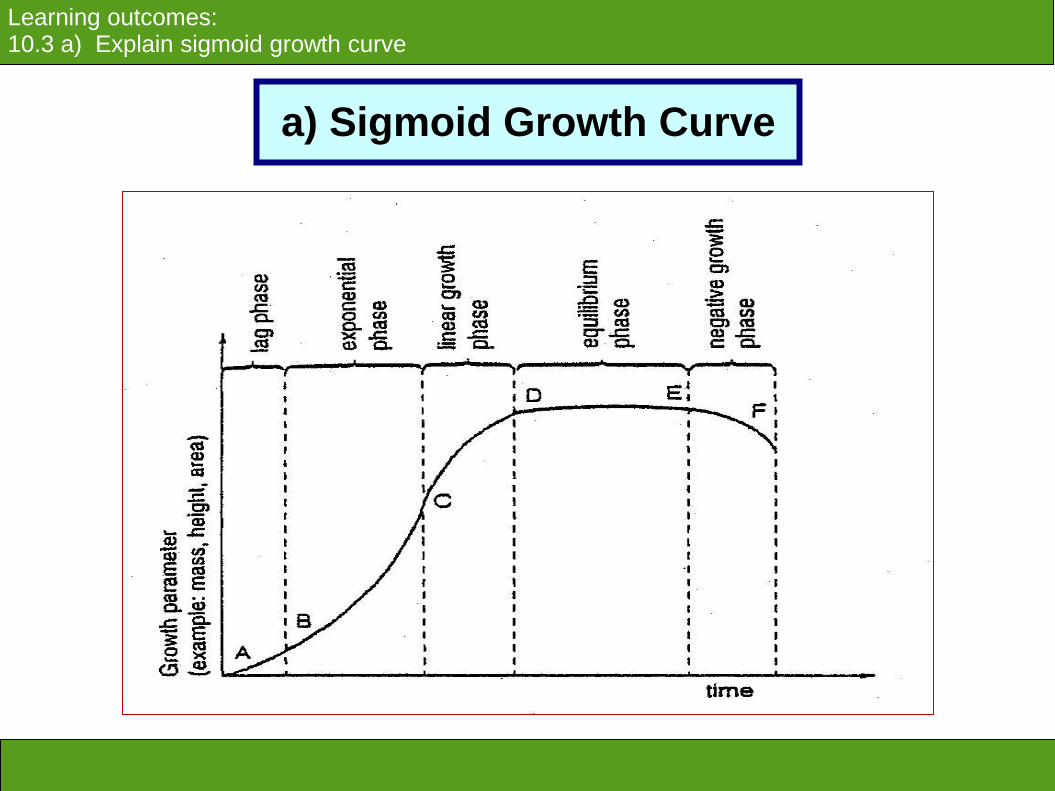
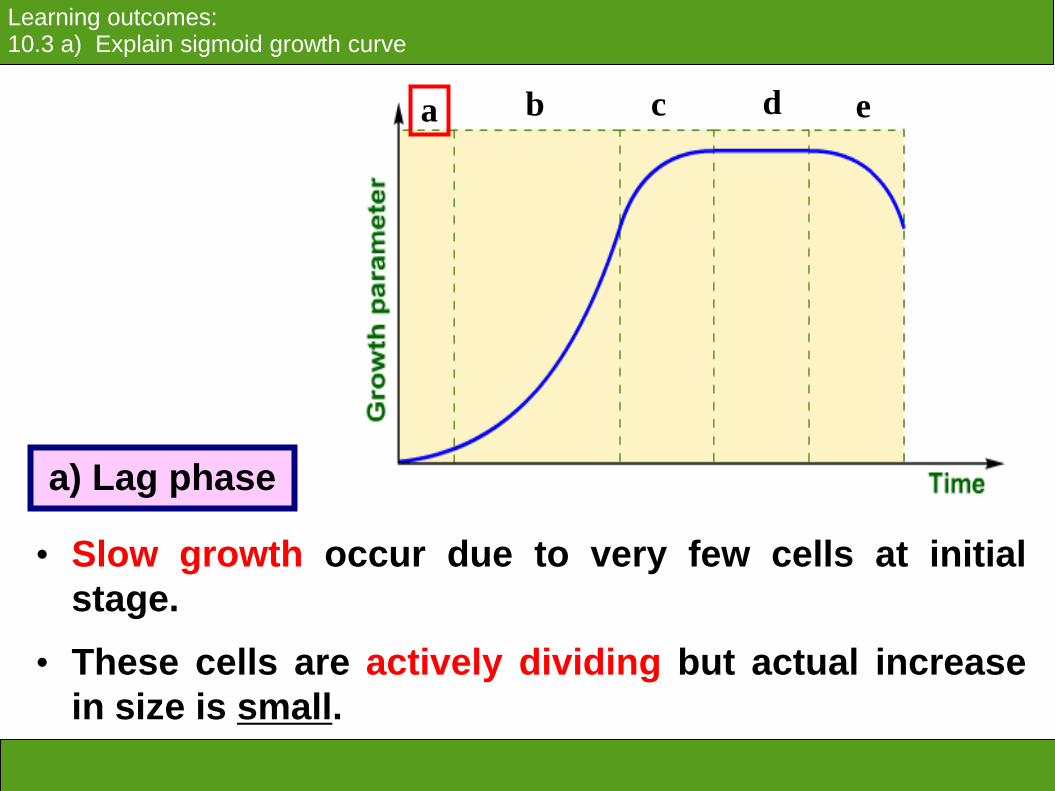
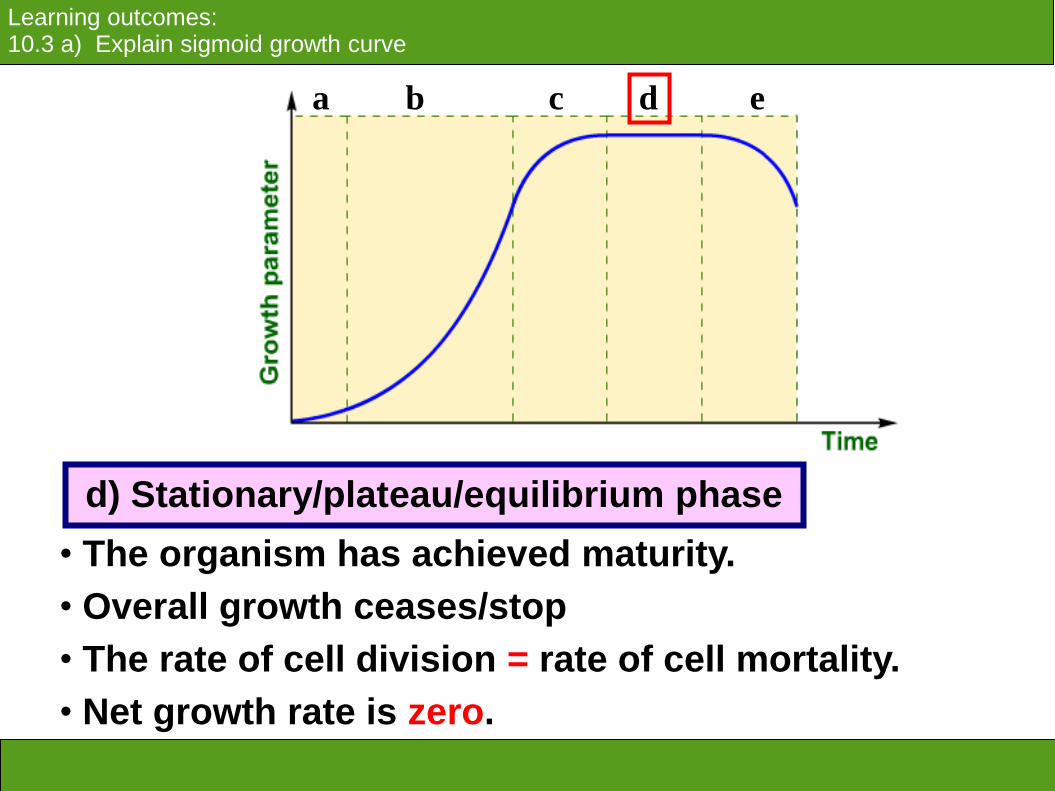
• Sigmoid curve is divided into 5 parts :
1. Lag phase
2. Log phase
3. Decelerating phase / linear growth
4. Stationary / plateau phase
5. Senescense
Learning outcomes: 10.3 a) Explain sigmoid growth curve
a) Sigmoid Growth Curve
b e a c d
Learning outcomes: 10.3 a) Explain sigmoid growth curve
a) Lag phase
• Slow growth occur due to very few cells at initial
stage.
• These cells are actively dividing but actual increase
in size is small.
b e a c d
Learning outcomes: 10.3 a) Explain sigmoid growth curve
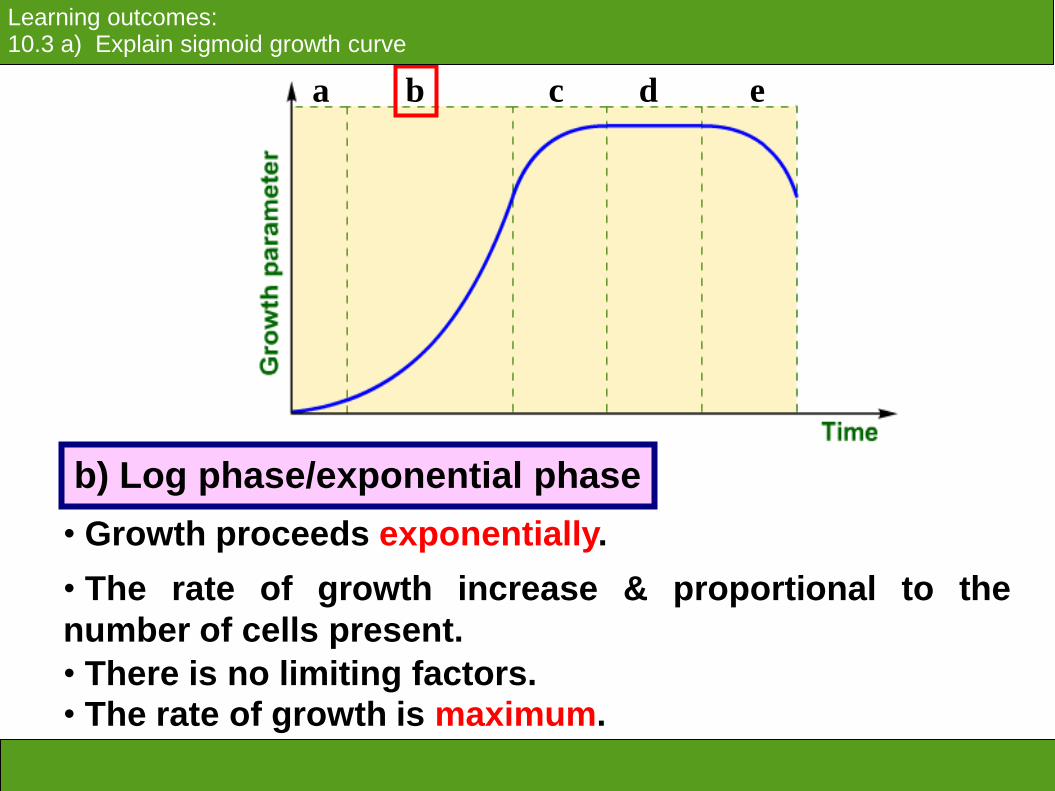
b) Log phase/exponential phase
• Growth proceeds exponentially.
• The rate of growth increase & proportional to the
number of cells present.
• There is no limiting factors.
• The rate of growth is maximum.
b e a c d
Learning outcomes: 10.3 a) Explain sigmoid growth curve
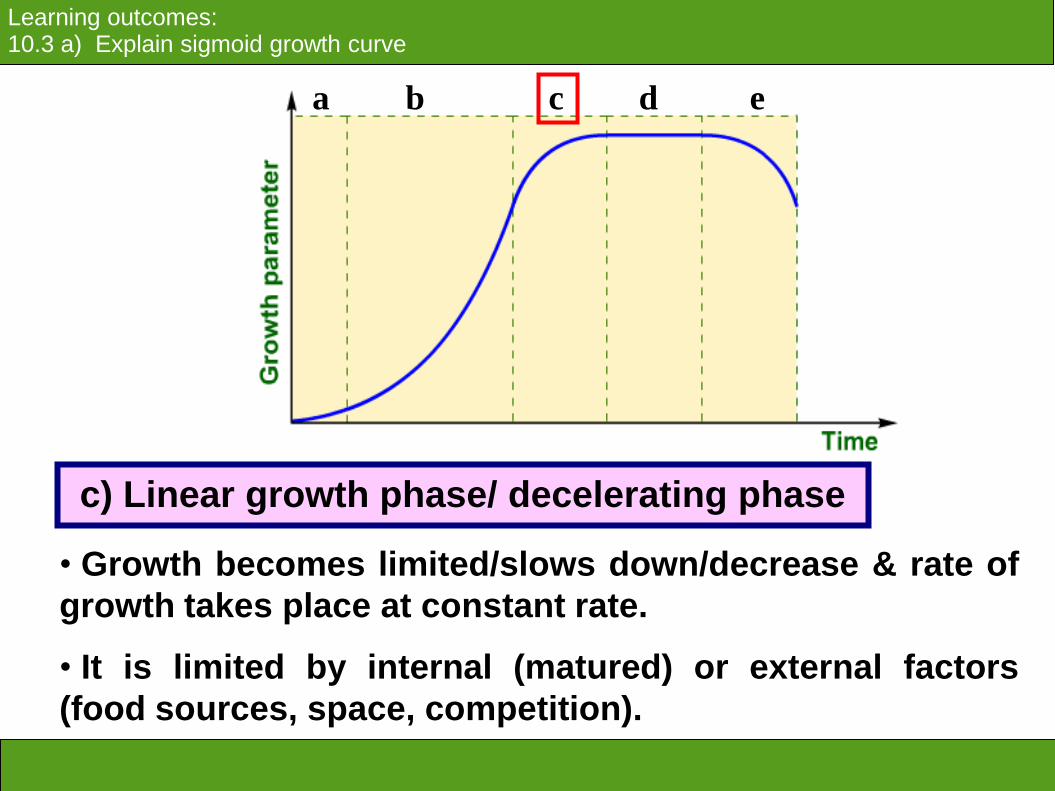
c) Linear growth phase/ decelerating phase
• Growth becomes limited/slows down/decrease & rate of
growth takes place at constant rate.
• It is limited by internal (matured) or external factors
(food sources, space, competition).
b e a c d
Learning outcomes: 10.3 a) Explain sigmoid growth curve
d) Stationary/plateau/equilibrium phase
• The organism has achieved maturity.
• Overall growth ceases/stop
• The rate of cell division = rate of cell mortality.
• Net growth rate is zero.

b e a c d
Learning outcomes: 10.3 a) Explain sigmoid growth curve
• When replacement of cells is slower than the death of cells, the curve slopes downward and senescence sets in.
e) Senescense

b) Human Growth Curve
Learning outcomes: 10.3 b) Explain human growth curve.
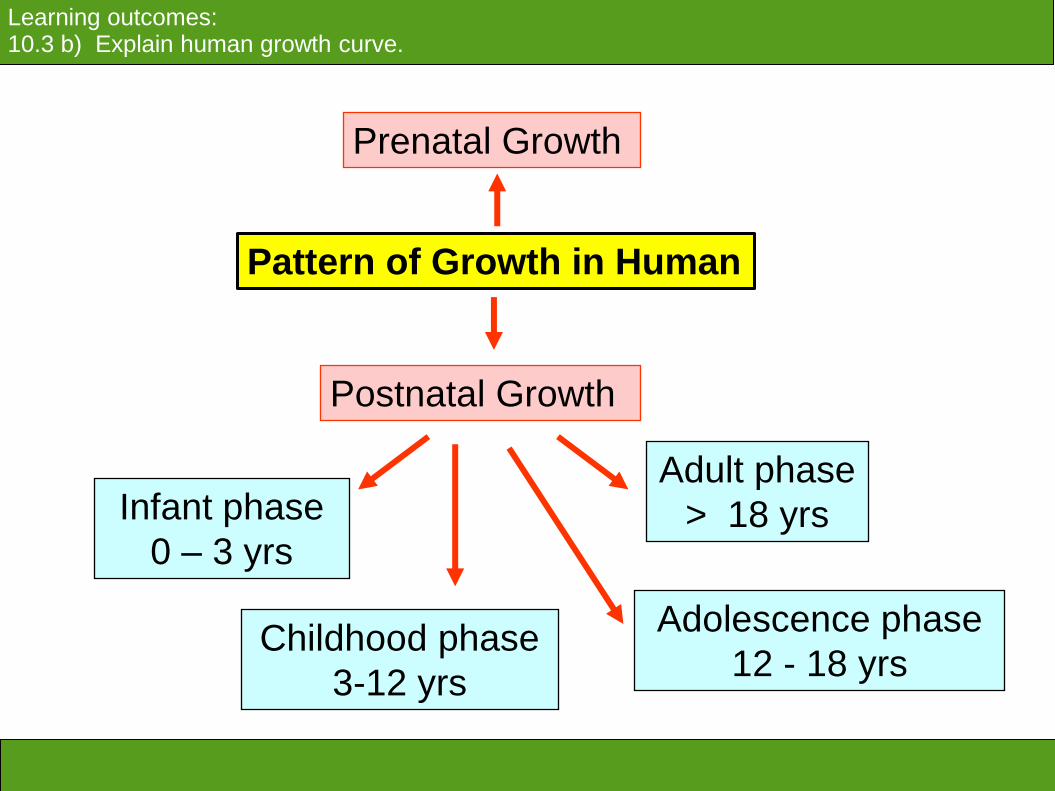
Pattern of Growth in Human
Prenatal Growth
Postnatal Growth
Infant phase
0 – 3 yrs
Childhood phase
3-12 yrs
Adolescence phase
12 - 18 yrs
Adult phase
> 18 yrs
Learning outcomes: 10.3 b) Explain human growth curve.
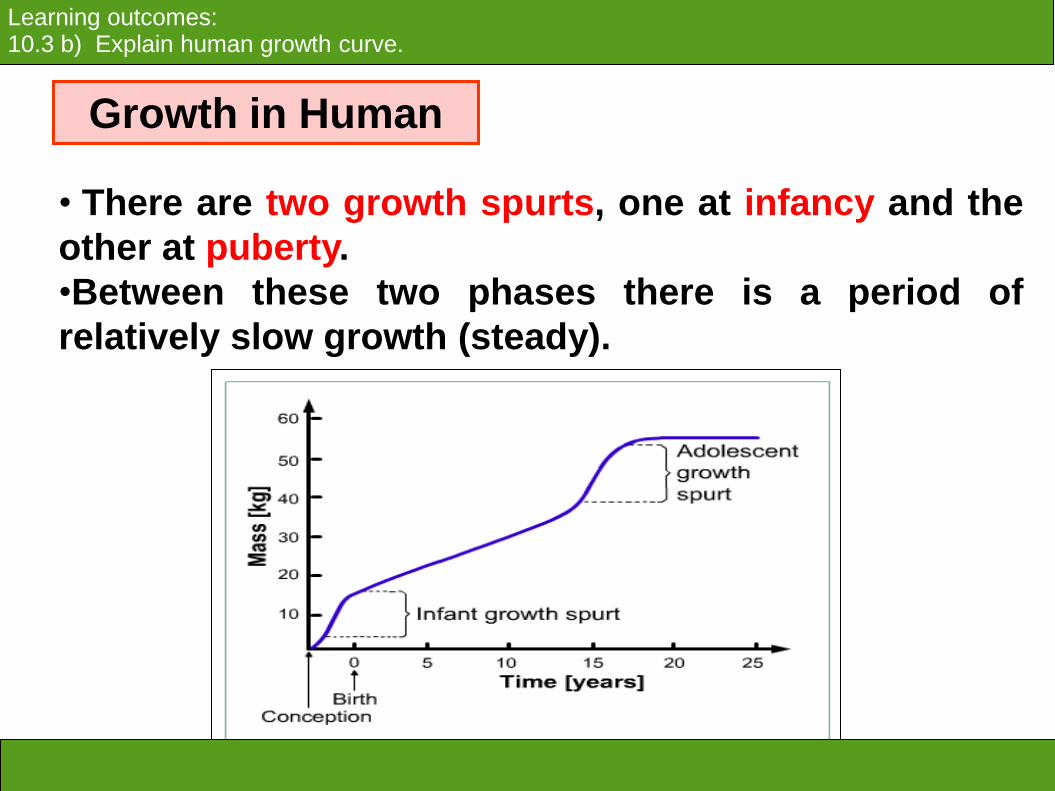
• There are two growth spurts, one at infancy and the
other at puberty.
•Between these two phases there is a period of
relatively slow growth (steady).
Learning outcomes: 10.3 b) Explain human growth curve.
Growth in Human

• When adulthood is reached, the growth process
stops.
• Human growth curves appear as two sigmoid
curves joined together.
Learning outcomes: 10.3 b) Explain human growth curve.
Growth in Human

.
4 phases :
a) Infant phase :
Growth rate is very
rapid irrespective of
whether the baby is
male or female.
Learning outcomes: 10.3 b) Explain human growth curve.
Human Growth Curve

b) Childhood phase :
Growth rate is
slower. Growth
rate in male is
slightly higher
than to female.
Learning outcomes: 10.3 b) Explain human growth curve.
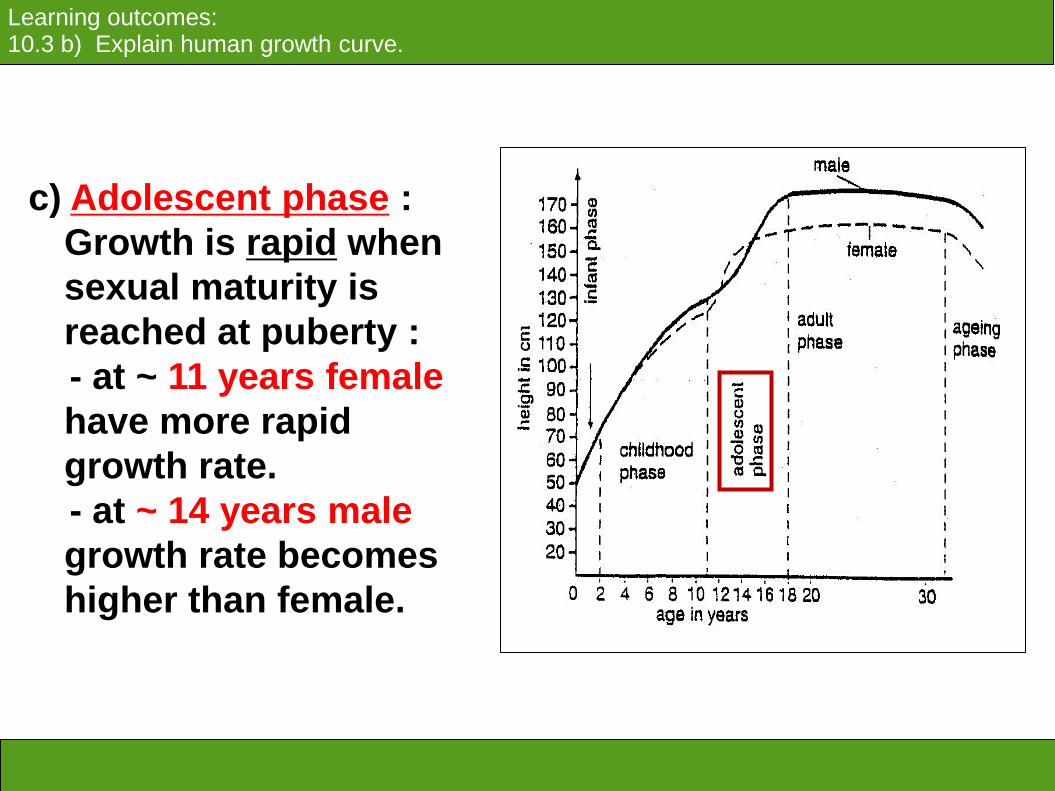
c) Adolescent phase :
Growth is rapid when
sexual maturity is
reached at puberty :
- at ~ 11 years female
have more rapid
growth rate.
- at ~ 14 years male
growth rate becomes
higher than female.
Learning outcomes: 10.3 b) Explain human growth curve.
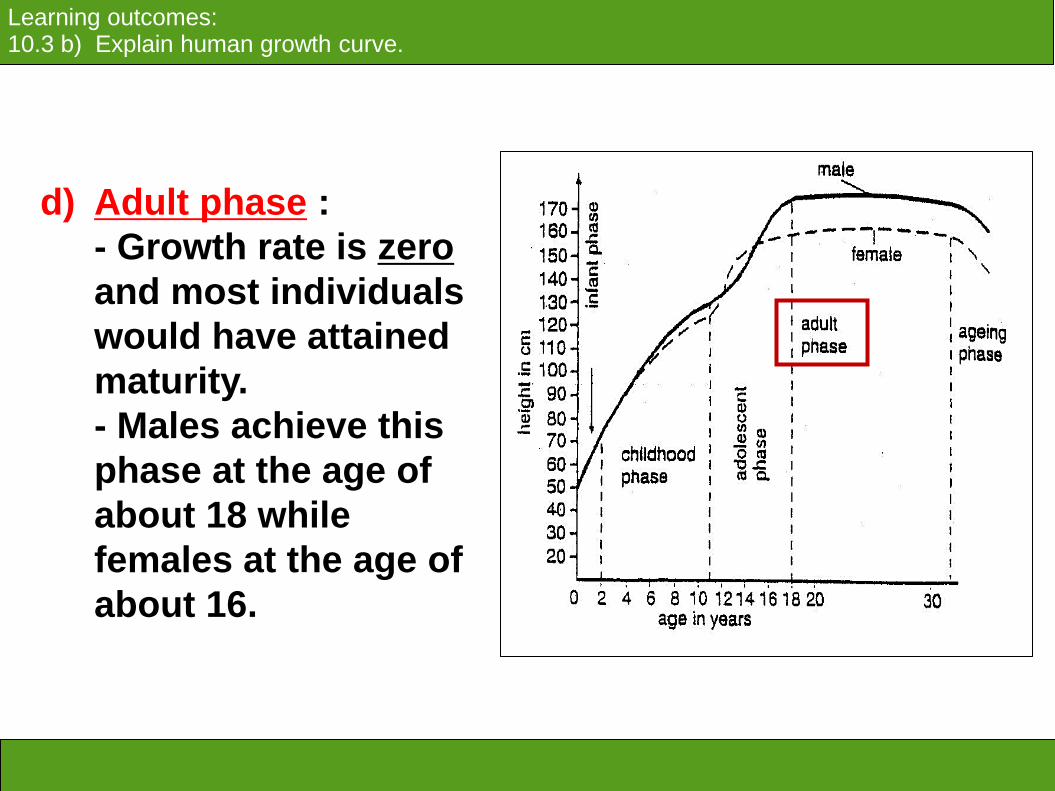
d) Adult phase :
- Growth rate is zero
and most individuals
would have attained
maturity.
- Males achieve this
phase at the age of
about 18 while
females at the age of
about 16.
Learning outcomes: 10.3 b) Explain human growth curve.
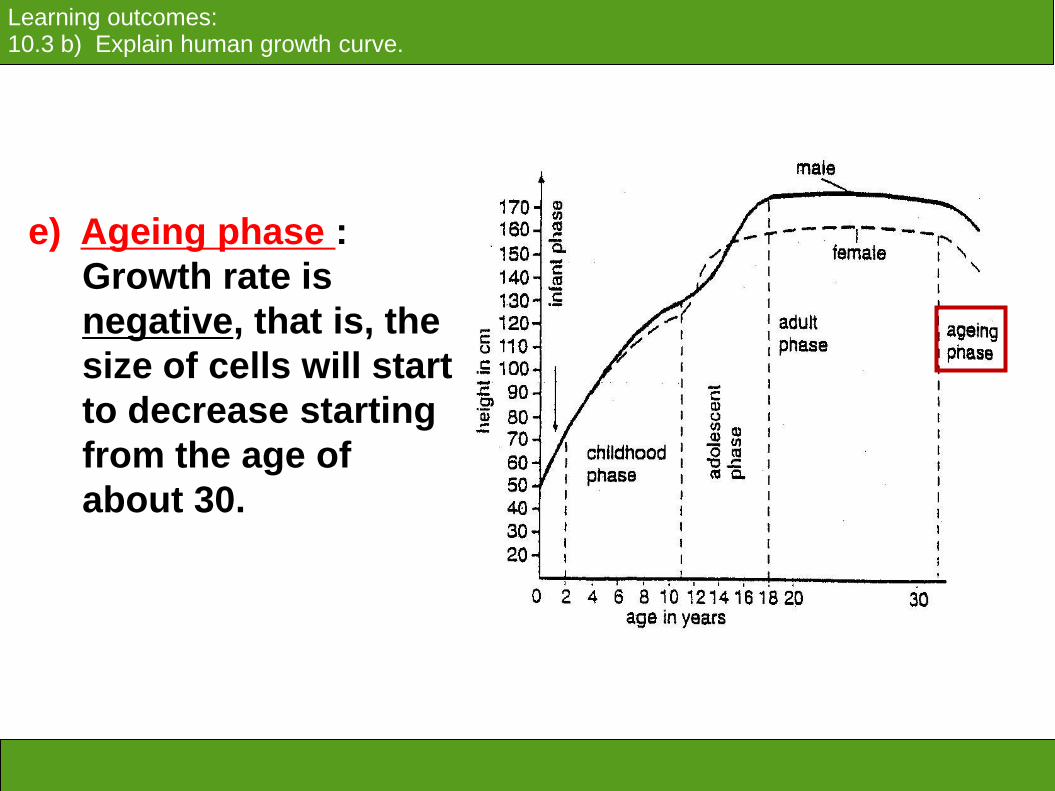
e) Ageing phase :
Growth rate is
negative, that is, the
size of cells will start
to decrease starting
from the age of
about 30.
Learning outcomes: 10.3 b) Explain human growth curve.

c) Limited & Unlimited Growth Curve
Learning outcomes: 10.3 c) Explain limited growth curve and unlimited growth curve.
Limited Growth Curve Unlimited Growth Curve

Learning outcomes: 10.3 c) Explain limited growth curve and unlimited growth curve.
Limited Growth Curve
• Definite/determinate growth •The growth does not continue throughout life/until death •Organism shows limited growth, up to certain size. • Growth is stopped / declined when a maximum size is achieved. • Eg : annual crops, pea, mammals.

Learning outcomes: 10.3 c) Explain limited growth curve and unlimited growth curve.
Limited Growth Curve
• A slight decrease in dry mass in the initial stage of germination. • Food reserve is used for respiration to provide energy.
Consist of 3 stages (annual plant) :
Stage I
1
Learning outcomes: 10.3 c) Explain limited growth curve and unlimited growth curve.
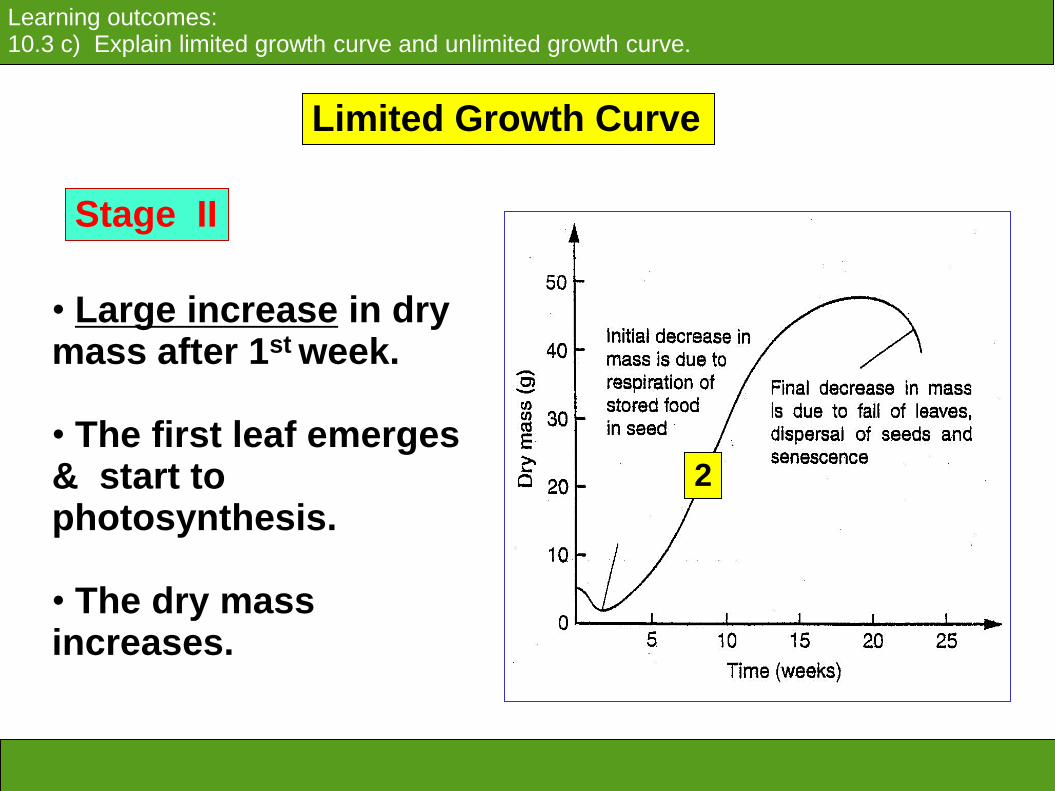
Limited Growth Curve
Stage II
2
• Large increase in dry mass after 1st week. • The first leaf emerges & start to photosynthesis. • The dry mass increases.
Learning outcomes: 10.3 c) Explain limited growth curve and unlimited growth curve.
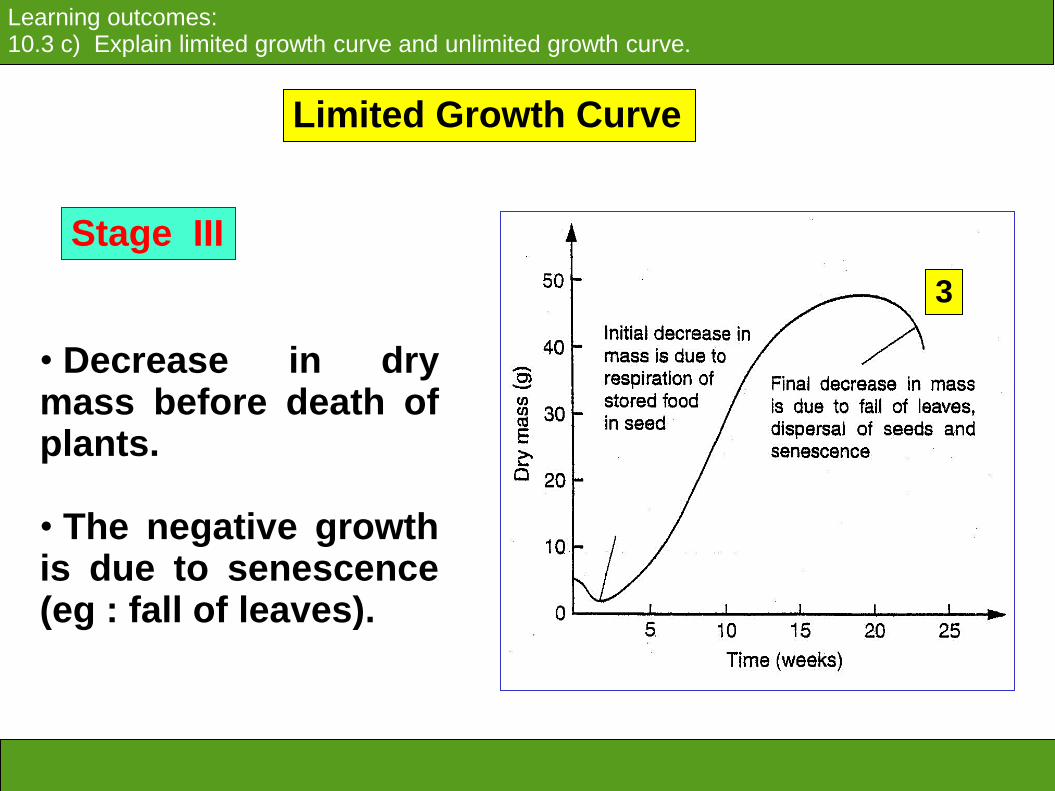
Limited Growth Curve
Stage III
3
• Decrease in dry mass before death of plants. • The negative growth is due to senescence (eg : fall of leaves).

Unlimited Growth Curve
Learning outcomes: 10.3 c) Explain limited growth curve and unlimited growth curve.
• Growth pattern consists of cumulative series of sigmoid curves. • Each sigmoid curve represents 1 year’s growth. • Each sigmoid curve can be divided into 4 parts. • Each part corresponding to a season. • Eg : woody perennials plants.
• Also known as indefinite / indeterminate growth. • Organisms grow continuously throughout its life/until death
Unlimited Growth Curve
Learning outcomes: 10.3 c) Explain limited growth curve and unlimited growth curve.
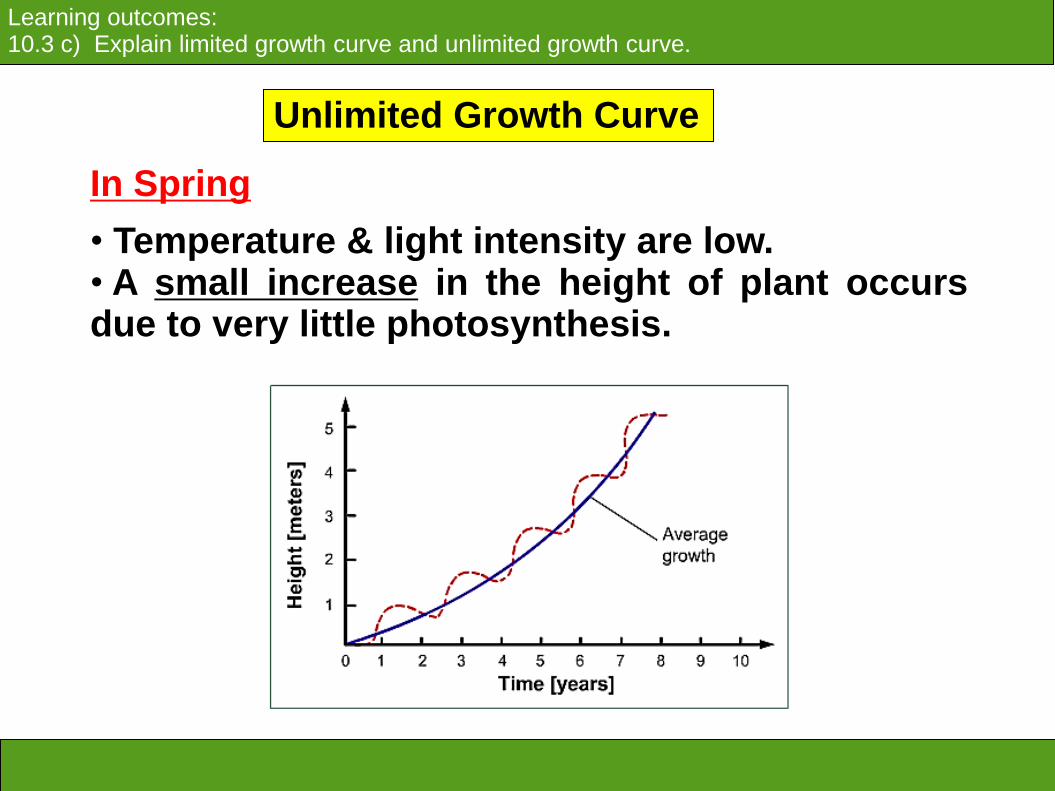
In Spring
• Temperature & light intensity are low. • A small increase in the height of plant occurs due to very little photosynthesis.

Unlimited Growth Curve
Learning outcomes: 10.3 c) Explain limited growth curve and unlimited growth curve.
In Summer
• As the temperature & light intensity increase, the rate of photosynthesis increase. • Results in a large increase in the height of plants.

Unlimited Growth Curve
Learning outcomes: 10.3 c) Explain limited growth curve and unlimited growth curve.
In Autumn
• Temperature & light intensity are lower than in summer.
• Less photosynthesis occur.
• Small increase in the height of the plants.
Unlimited Growth Curve
Learning outcomes: 10.3 c) Explain limited growth curve and unlimited growth curve.
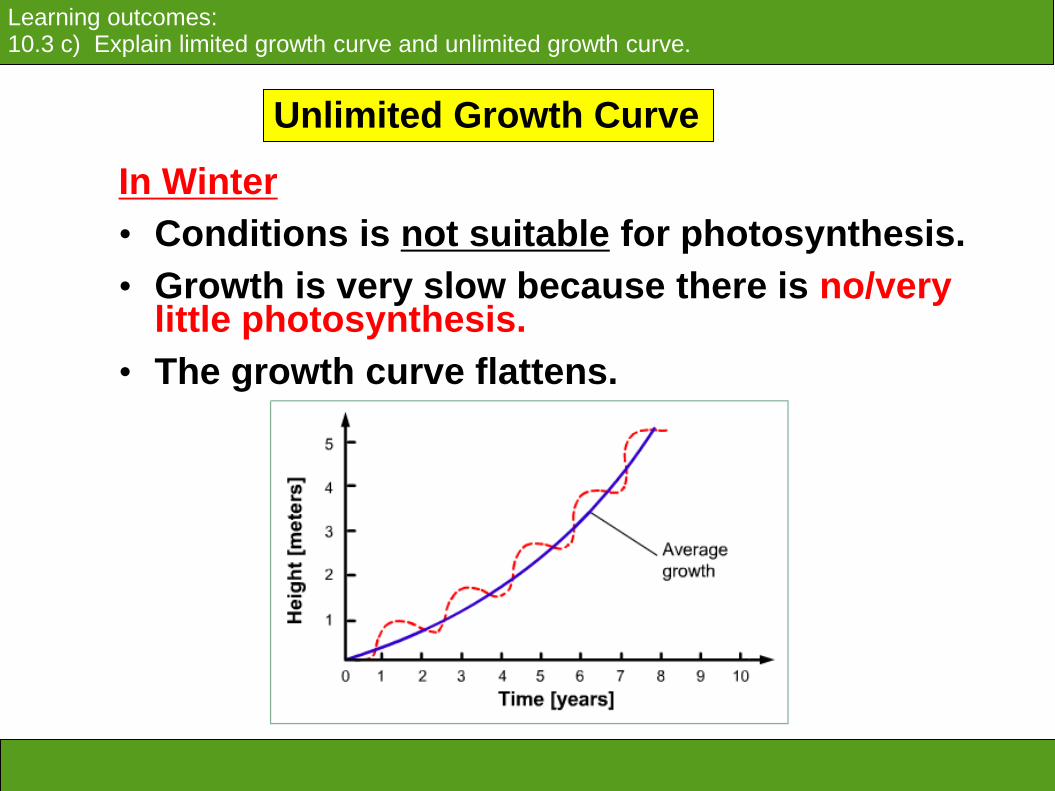
In Winter
• Conditions is not suitable for photosynthesis.
• Growth is very slow because there is no/very little photosynthesis.
• The growth curve flattens.

Unlimited Growth Curve
Learning outcomes: 10.3 c) Explain limited growth curve and unlimited growth curve.
• In the following spring, the entire process is repeated.
• Perennial plants grow continuously, the graphs never flatten.
• Every season, the size & weight keep increasing.
• Except it is restricted by environmental factors.
• Such as the presence of parasites, natural predators, outbreak of diseases which will kill the organism.
d) Isometric and Allometric Growth
Learning outcomes: 10.3 d) Explain isometric growth and allometric growth.
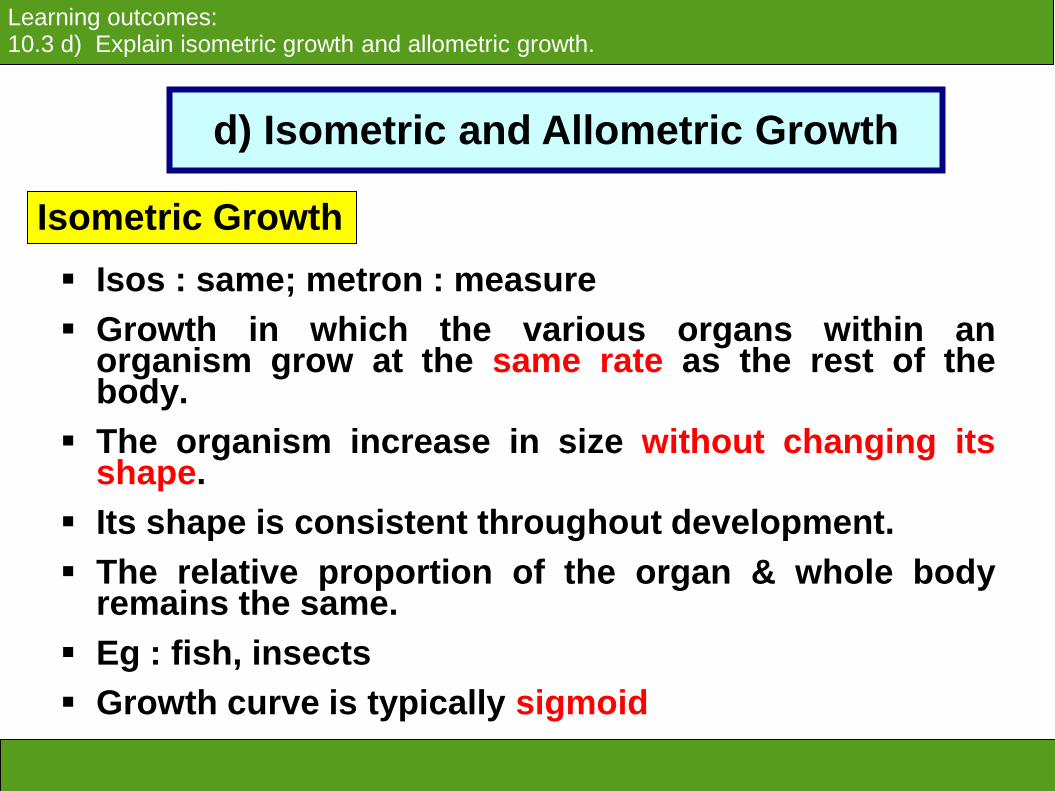
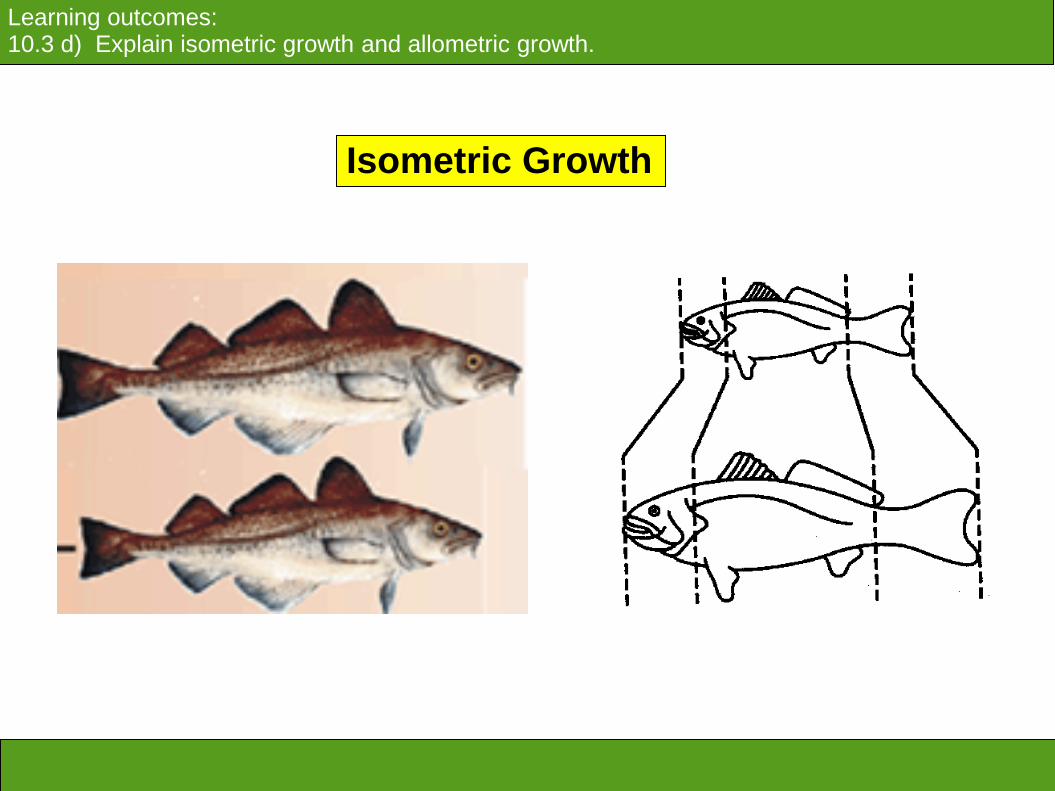
Isos : same; metron : measure
Growth in which the various organs within an organism grow at the same rate as the rest of the body.
The organism increase in size without changing its shape.
Its shape is consistent throughout development.
The relative proportion of the organ & whole body remains the same.
Eg : fish, insects
Growth curve is typically sigmoid
Isometric Growth
Learning outcomes: 10.3 d) Explain isometric growth and allometric growth.
Isometric Growth
d) Isometric and Allometric Growth
Learning outcomes: 10.3 d) Explain isometric growth and allometric growth.
Allometric Growth
Allos : other
Growth in which the various organs/parts within an organism grow at different rate.
As the size of organism increase, the shape changes.
Occurs in animals & human.
In most animals, the last organ to develop & differentiate are reproductive organ.

Learning outcomes: 10.3 d) Explain isometric growth and allometric growth.
Allometric Growth

Learning outcomes: 10.3 d) Explain isometric growth and allometric growth.
Allometric Growth
In human, head, lymphoid tissue & reproductive organs grow at very different rate.
Head grows rapidly in the first 5 years after birth.
After that, it doesn’t
grow much.
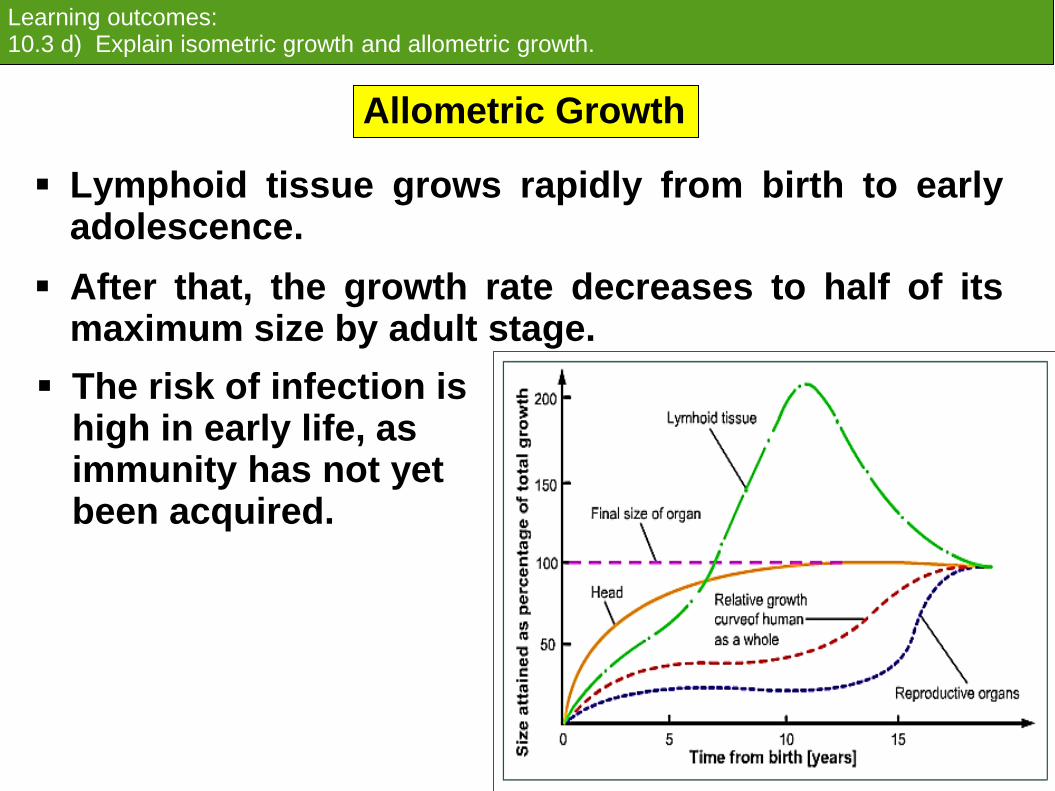
Lymphoid tissue grows rapidly from birth to early adolescence.
After that, the growth rate decreases to half of its maximum size by adult stage.
Learning outcomes: 10.3 d) Explain isometric growth and allometric growth.
Allometric Growth
The risk of infection is high in early life, as immunity has not yet been acquired.
Learning outcomes: 10.3 d) Explain isometric growth and allometric growth.
Allometric Growth
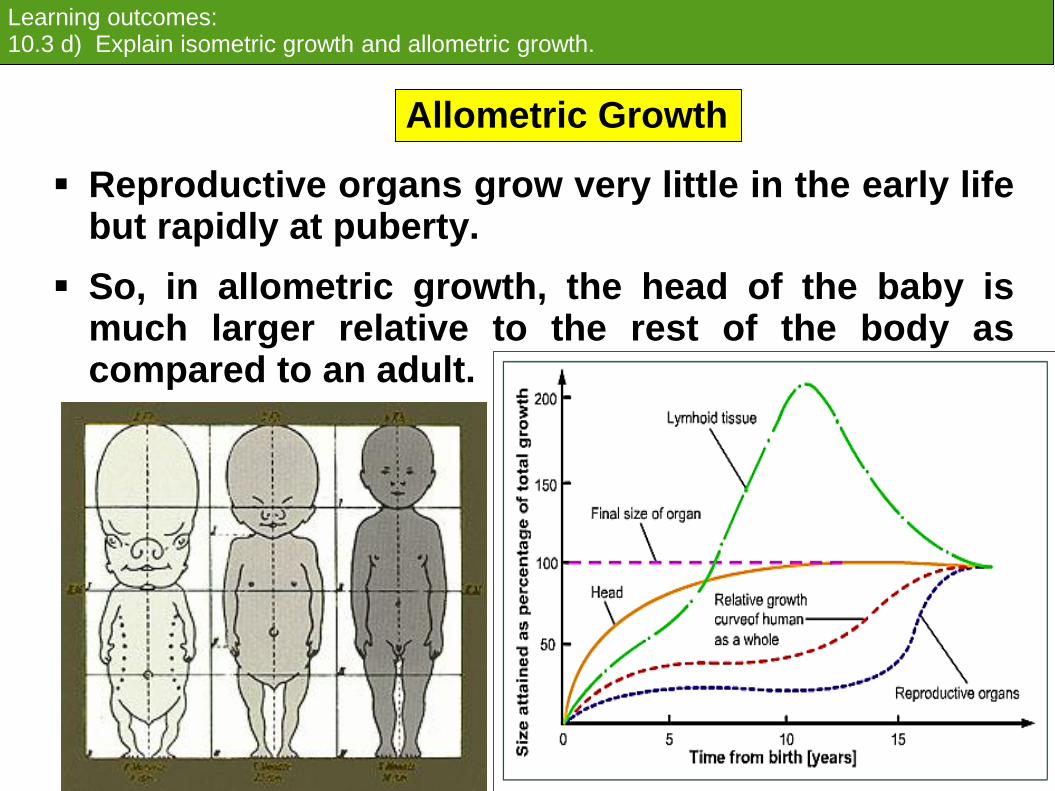
Reproductive organs grow very little in the early life but rapidly at puberty.
So, in allometric growth, the head of the baby is much larger relative to the rest of the body as compared to an adult.

e) Intermittent Growth Curve
Learning outcomes: 10.3 e) Explain intermittent growth curve.
Also known as discontinuous growth.
Occurs in arthropods (crustaceans & insects).
Growth curve show a step-like pattern.
Due to the presence of inelastic exoskeleton which must be shed (via a process called moulting / ecdysis) before growth can occur.
Before new exoskeleton hardened, arthropods take in air / water to expand the soft exoskeleton as much as possible.
Causes a sudden increase in length (spurts).

0
5.0
4.0
3.0
2.0
1.0
Time (days)
10 20 30 40 50
Len
gth
(cm
)
5th instar
4th instar
3rd
2nd 1st
Adult
Ecdysis
e) Intermittent Growth Curve

e) Intermittent Growth Curve
Learning outcomes: 10.3 e) Explain intermittent growth curve.
After the exoskleleton becomes hardened, arthropods decrease to its original size.
Leaving some space within the new exoskeleton for growth to occur.
A stage between 2
sequential ecdysis is
called instar.

Increase in length during ecdysis is due to uptake of water or air.
Which is not consider actual growth.
Actual growth occurs at flat horizontal lines (instar), even though there is no increase in length.
If growth curve is plotted using dry mass, a normal sigmoid curve is obtained (shows true growth which is continuous).
e) Intermittent Growth Curve
Learning outcomes: 10.3 e) Explain intermittent growth curve.

150
125
100
75
50
25
Time (days)
10 20 30 40 50
Mass (
mg
)
0
e) Intermittent Growth Curve.

10.0 Growth (3 hrs)
10.1 Growth phases (½)
10.2 Measurement of growth (½)
10.3 Growth patterns (1)
10.4 Growth rate (½)

Learning outcomes
At the end of this topic, students should be able to :
a) Describe absolute growth curve.
b) Describe absolute growth rate curve.

a) Absolute Growth Curve
Learning outcomes: 10.4 a) Describe absolute growth curve.
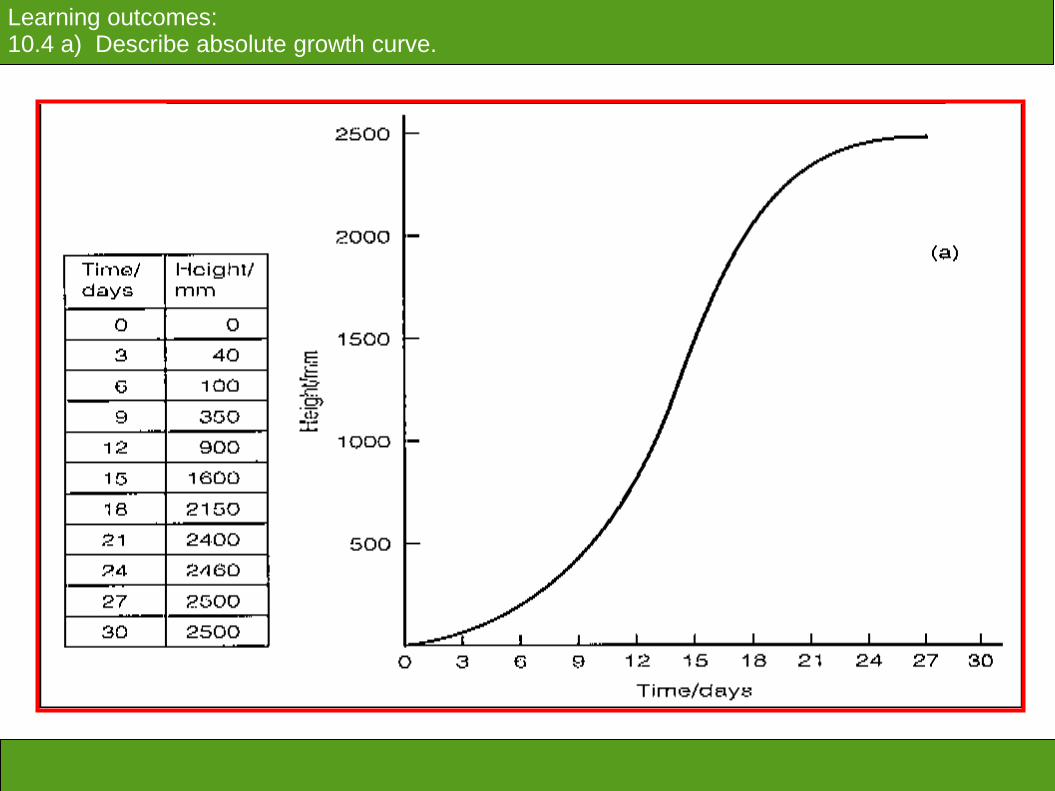
When a parameter is measured at intervals over a period of time (throughout the growth of an organism).
Absolute / actual growth curve can be plotted.
It is the cumulative increase in size over a period of time.
It shows the overall growth pattern of an organism.
Usually absolute growth curve is S-shaped, sigmoid curve.
a) Absolute Growth Curve.
Learning outcomes: 10.4 a) Describe absolute growth curve.

a) Absolute Growth Rate Curve
Learning outcomes: 10.4 b) Describe absolute growth rate curve.
When an increase in size is measured over a series of equal time intervals
Plotting these increments against time produces an absolute growth rate curve
Usually bell-shaped
Absolute growth rate curve increases up to a maximum, then it decreases

a) Absolute Growth Rate Curve
Learning outcomes: 10.4 b) Describe absolute growth rate curve.

Reference
• Campbell N.A & Reece, J.B., Biology, 6th ed. (2002), Pearson Education, Inc.
• Solomon E.P & Berg, L.R, Biology, 7th ed. (2005) Thomson Learning, Inc.
• Mader, S.S Biology, 8th ed. (2004) McGraw-Hill Companies, Inc.