chapter 10: for more information - 3d cad design software · 2011-07-15 · gate to gate – a very...
TRANSCRIPT
Guide to Sustainable Design 90
© Dassault Systèmes SolidWorks Corp. All rights reserved.
Chapter 10: For More Information
Appendix A – Reference materials
Sustainability & Sustainable Business
Berkshire Encyclopedia of Sustainability, Vol. 1-10, Berkshire Publishing Group (2009-2011) www.EnvironmentalLeader.com www.GreenBiz.com www.SustainableLifeMedia.com
Sustainable Living
www.TreeHugger.com www.inhabitat.com www.grist.com
The Hannover Principles
Sections of this guide detail specific environmentally responsible design strategies. The “Hannover Principles” are a good place to start.36 They are, in summary:
1. Insist on rights of humanity and nature to co-exist. 2. Recognize interdependence between the elements of human design and the natural world. 3. Respect relationships between the human values and matter. 4. Accept responsibility for the consequences of design decisions. 5. Create safe objects of long-term value. 6. Eliminate the concept of waste. 7. Rely on natural energy flows. 8. Understand the limitations of design. 9. Seek constant improvement by the sharing of knowledge.
For more information, see http://www.mcdonough.com/principles.pdf.
36 Developed in 1992 by William McDonough and Michael Braungart for the Expo 2000 World’s Fair, Hannover, Germany.

Guide to Sustainable Design 91
© Dassault Systèmes SolidWorks Corp. All rights reserved.
Appendix B – A deeper look at the LCA process
The specific process of Life Cycle Assessment (LCA) has a standardized set of steps and outputs in the form of environmental impact measures.37 It is defined as “an objective process to evaluate the environmental burdens associated with a product, process, or activity by identifying energy and materials used and wastes released to the environment, and to evaluate and implement opportunities to affect environmental improvements.”38 The standardized LCA process has four major steps:
5. Goal and Scope Definition – What are we trying to learn? 6. Life Cycle Inventory (LCI) – What’s embedded in the product? 7. Life Cycle Impact Assessment (LCIA) – What effects does it have? 8. Data Interpretation – What does it all mean?
Goal & Scope Definition
As with other assessments, it is important to clarify the purpose and extent of the LCA. A Goal & Scope document will consider to the following questions.
1. What are we trying to understand? LCAs are designed to address such questions as:
37 LCAs are part of the ISO 14000 (environmental management) standards, and are specifically addressed by ISO 14040:2006 and 14044:2006. 38 Society of Environmental Toxicology and Chemistry (SETAC), 1990

Guide to Sustainable Design 92
© Dassault Systèmes SolidWorks Corp. All rights reserved.
What activities in the product’s lifecycle contribute most to its overall environmental impact?
What are the environmental consequences of changing a step in its production? What are the environmental consequences of changing the materials in the product? What are the environmental consequences of using recycled rather than virgin material
for the product? What is the environmentally-preferable choice among products A, B or C? How does this product compare to its previous version?
LCAs usually do not address such things as social impacts or financial considerations so must be used in conjunction with other decision support tools.
2. What is the functional unit?
In order to compare two product systems, it is necessary to choose a measure of the function of the systems that is consistent between the two. For instance, for a coffee maker it might be cups brewed, for laundry detergent it could be washing cycles, for paint it could be surface protection over time.
3. What environmental impacts should we consider? A great deal of attention has been given to greenhouse gas emissions, with some organizations focusing mainly on their resulting carbon footprint, although this is just a subset of all of the possible environmental impacts that can be assessed. It is up to the organization to decide what factors are important to them.
4. What are we comparing?
LCAs are only useful when used to compare options. A given product can be compared to previous versions, competitive offers, alternative design options, industry benchmarks, target impact levels, etc.
5. What is our system boundary? Product life cycles intersect a great many processes, some more directly linked to the product itself than others. An assessment cannot cover everything so system boundaries clarify what it will include. The following figure shows a possible system boundary chart for a styrofoam cup.

Guide to Sustainable Design 93
© Dassault Systèmes SolidWorks Corp. All rights reserved.
Source: Design + Environment, Lewis & Gertsakis
Some of the standard product life cycle scopes include:
Cradle to grave – Usually denotes all phases from raw materials through disposal Cradle to cradle – Like cradle to grave except that it tracks where the product’s
elements go after end of use, with special attention to recycling and reuse Cradle to gate – Includes all phases up until it leaves production (the factory gate),
bound for the customer, since this is the end of most manufacturer’s ability to directly influence impact
Gate to gate – A very narrow LCA, just focused on only one particular phase of the production process
6. What assumptions should we make?
Whether it’s product usage behavior, availability of raw materials, manufacturing capacity, or any number of variables affecting a product’s actual life cycle, LCAs require assumptions. They are unavoidable so the key is to identify and document them.
7. What are the data requirements and level of detail? Data on actual product life cycles is more accurate, but much more expensive, labor intensive, and time consuming to collect than data from tables based on generalized information. The right balance depends on how the results will be used, as well as on data source access.
Guide to Sustainable Design 94
© Dassault Systèmes SolidWorks Corp. All rights reserved.
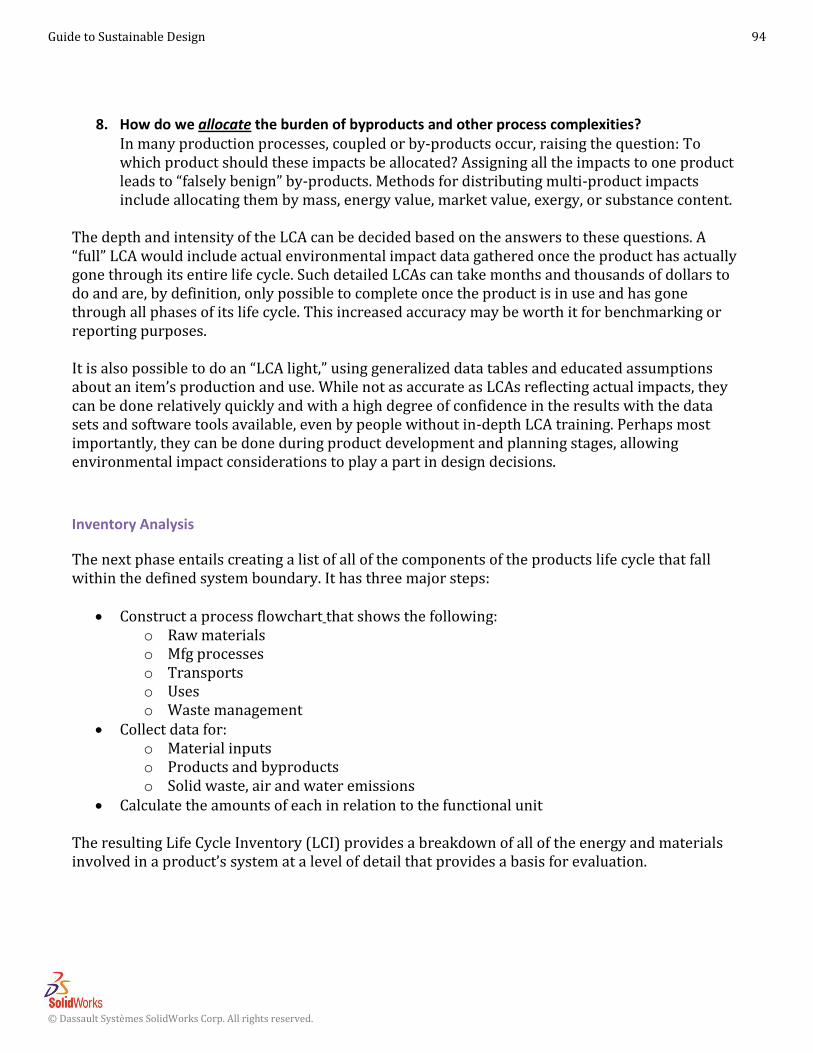
8. How do we allocate the burden of byproducts and other process complexities?
In many production processes, coupled or by-products occur, raising the question: To which product should these impacts be allocated? Assigning all the impacts to one product leads to “falsely benign” by-products. Methods for distributing multi-product impacts include allocating them by mass, energy value, market value, exergy, or substance content.
The depth and intensity of the LCA can be decided based on the answers to these questions. A “full” LCA would include actual environmental impact data gathered once the product has actually gone through its entire life cycle. Such detailed LCAs can take months and thousands of dollars to do and are, by definition, only possible to complete once the product is in use and has gone through all phases of its life cycle. This increased accuracy may be worth it for benchmarking or reporting purposes. It is also possible to do an “LCA light,” using generalized data tables and educated assumptions about an item’s production and use. While not as accurate as LCAs reflecting actual impacts, they can be done relatively quickly and with a high degree of confidence in the results with the data sets and software tools available, even by people without in-depth LCA training. Perhaps most importantly, they can be done during product development and planning stages, allowing environmental impact considerations to play a part in design decisions.
Inventory Analysis
The next phase entails creating a list of all of the components of the products life cycle that fall within the defined system boundary. It has three major steps:
Construct a process flowchart that shows the following: o Raw materials o Mfg processes o Transports o Uses o Waste management
Collect data for: o Material inputs o Products and byproducts o Solid waste, air and water emissions
Calculate the amounts of each in relation to the functional unit The resulting Life Cycle Inventory (LCI) provides a breakdown of all of the energy and materials involved in a product’s system at a level of detail that provides a basis for evaluation.

Guide to Sustainable Design 95
© Dassault Systèmes SolidWorks Corp. All rights reserved.
Impact Assessment
Once a detailed LCI is created, environmental impacts can be ascribed to its parts, and if desired to the whole system. There are four steps to the Life Cycle Impact Assessment (LCIA) process, the first two of which are considered mandatory, while the last two are optional.39
1. Classification Classification involves assigning specific environmental impacts to each component of the LCI. It is here where decisions made during the scope and goal phase about what environmental impact categories are of interest come into play. The figure below shows one well-known set of classifications, called midpoint categories, and how they map to domains of damage they cause.40
Commonly Used Life Cycle Impact Categories
41
Impact Category Scale Examples of LCI Data
(i.e. classification)
Common Possible
Characterization
Factor
Description of
Characterization
Factor
Global Warming Global Carbon Dioxide (CO2)
Nitrogen Dioxide (NO2)
Methane (CH4)
Chlorofluorocarbons
(CFCs)
Hydrochlorofluorocarbons
Global Warming
Potential
Converts LCI data to
carbon dioxide (CO2)
equivalents Note:
global warming
potentials can be 50,
100, or 500 year
39 As dictated by the ISO 14044 standard 40 “IMPACT 2002+” LCIA methodology / Dr. Olivia Jolliet, Univ. of Michigan http://www.sph.umich.edu/riskcenter/jolliet/impact2002+.htm 41 “Life Cycle Assessment: Principles and Practice,” Scientific Applications International Corporation, EPA/600/R-06/060 (May 2006), pg. 49.

Guide to Sustainable Design 96
© Dassault Systèmes SolidWorks Corp. All rights reserved.
(HCFCs) Methyl Bromide
(CH3Br)
potentials.
Stratospheric Ozone
Depletion
Global Chlorofluorocarbons
(CFCs)
Hydrochlorofluorocarbons
(HCFCs) Halons Methyl
Bromide (CH3Br)
Ozone Depleting
Potential
Converts LCI data to
trichlorofluoromethane
(CFC-11) equivalents.
Acidification Regional Local Sulfur Oxides (SOx)
Nitrogen Oxides (NOx)
Hydrochloric Acid (HCL)
Hydroflouric Acid (HF)
Ammonia (NH4)
Acidification
Potential
Converts LCI data to
hydrogen (H+) ion
equivalents.
Eutrophication Local Phosphate (PO4) Nitrogen
Oxide (NO) Nitrogen
Dioxide (NO2) Nitrates
Ammonia (NH4)
Eutrophication
Potential
Converts LCI data to
phosphate (PO4)
equivalents.
Photochemical Smog Local Non-methane
hydrocarbon (NMHC)
Photochemical
Oxident Creation
Potential
Converts LCI data to
ethane (C2H6)
equivalents.
Terrestrial Toxicity Local Toxic chemicals with a
reported lethal
concentration to rodents
LC50 Converts LC50 data to
equivalents; uses
multi- media
modeling, exposure
pathways.
Aquatic Toxicity Local Toxic chemicals with a
reported lethal
concentration to fish
LC50 Converts LC50 data to
equivalents; uses
multi- media
modeling, exposure
pathways.
Human Health Global Regional
Local
Total releases to air,
water, and soil.
LC50 Converts LC50 data to
equivalents; uses
multi- media
modeling, exposure
pathways.
Resource Depletion Global Regional
Local
Quantity of minerals used
Quantity of fossil fuels
used
Resource Depletion
Potential
Converts LCI data to a
ratio of quantity of
resource used versus
quantity of resource
left in reserve.
Land Use Global Regional
Local
Quantity disposed of in a
landfill or other land
modifications
Land Availability Converts mass of solid
waste into volume
using an estimated
density.
Water Use Regional Local Water used or consumed Water Shortage
Potential
Converts LCI data to a
ratio of quantity of
water used versus
quantity of resource
left in reserve.
2. Characterization Once the impact categories have been identified, conversion factors – generally known as characterization or equivalency factors – use formulas to convert the LCI results into directly comparable impact indicators. This allows different types of plastics and metals to be compared as to their impacts on Global Warming, for instance. The table above gives some commonly used characterization factors for each impact category.

Guide to Sustainable Design 97
© Dassault Systèmes SolidWorks Corp. All rights reserved.
There are well over a dozen categorization and characterization methods.42 Each maps materials to impacts based on scientific research, with many materials having impacts in multiple categories. Classification is usually facilitated by software that can take the component inputs and calculate allocated impacts based on either actual data gathered or standardized data tables. While there are pros and cons to each classification tool, some have been adopted more broadly than others.
3. Normalization (optional) Some practitioners choose to normalize the impact assessment by scaling the data by a reference factor, such as the region’s per capita environmental burden. This helps to clarify the relative impact of a substance in a given context. For instance, if global warming contributions are already high in the context in which the product is being assessed, a reference factor would normalize whatever the product’s global warming contributions are in order to clarify its relative impacts.
4. Weighting (optional) This process entails combining all of the indicators together, each with its own weighting, to create a single “score” that reflects a certain prioritization of the importance of each type of impact. Weighting is more of a political than scientific process since giving, say, global warming’s score more weight than acidification’s is a values-based decision. Stakeholders may differ significantly on their views about the importance of impacts, as shown in the chart below.43
42 For a good overview of many of the major methods, see Appendix B: LCA and LCI Software Tools in “Life Cycle Assessment: Principles and Practice,” Scientific Applications International Corporation, EPA/600/R-06/060 (May 2006), pp. 74-77. 43 Source: NIST, Tom Gioria?
Weights by Stakeholder Grouping
0
5
10
15
20
25
30
35
40
45
50
Ozo
ne D
epletio
n
Acidific
ation
Indo
or A
ir Qua
lity
Smog
For
mat
ion
Non
canc
erou
s Effe
cts
Land
Use
Eutro
phicat
ion
Ecologica
l Tox
icity
Can
cero
us E
ffects
Wat
er In
take
Crit
eria A
ir Pol
luta
nts
Fossil F
uel D
epletio
n
Globa
l War
ming
Perc
en
t
Producers
Users
LCA Experts

Guide to Sustainable Design 98
© Dassault Systèmes SolidWorks Corp. All rights reserved.
Many practitioners choose to leave the impact scores broken out into categories, with no weighting at all. Although this approach creates a more complicated report, it enables impact comparisons between products on a more granular level. Weighted “single score” LCAs have the advantage of generating one, easy-to-communicate impact number, often expressed as “millipoints.” However, even within the community that supports this approach there are two schools of thought. Some believe that there should be a standard weighting, while others feel that companies should be free to weight impacts as they see fit. One of the advantages of a standard weighting, as is used in the Okala approach among others, is that products can be compared to each other more easily since the single impact scores are only meaningful if compared among products with the same weighting. A second benefit is that companies can’t “game” the assessment to make their products look better than they are by emphasizing the areas in which the product does well and decreasing the effect of categories in which the product has problems. The advantage of variable weighting approaches is that they can be customized to fit an organizations goals and values. For instance, if an organization is making global warming a priority, it may want to weight that category much more heavily as it is assessing the impacts of its products. As long as the weighting remains constant within its own LCAs, the disproportionate weight it gives to this category is fine. There are some sustainability accounting and reporting standards that focus almost exclusively on greenhouse gas emissions, making it useful for organizations using them to put almost all of the weight on that subset of impact factors.44
44 Carbon footprint standards such as PAS 2050 and the GHG Protocol fit this description.

Guide to Sustainable Design 99
© Dassault Systèmes SolidWorks Corp. All rights reserved.
Interpretation
Although listed fourth, life cycle interpretation actually occurs throughout the whole LCA. It involves the ongoing process of clarifying, quantifying, checking, and evaluating the information used by, and resulting from, the life cycle inventory (LCI) and impact assessment (LCIA) phases. The standard covering LCAs, ISO 14044, gives two main objectives:
Analyze results, reach conclusions, explain limitations, and provide recommendations based on the findings of the preceding phases of the LCA, and to report the results of the life cycle interpretation in a transparent manner.
Provide a readily understandable, complete, and consistent presentation of the results of an LCA study, in accordance with the goal and scope of the study.
To achieve these objectives, the ISO standard states that interpretation should cover at least three major elements.
Identification of the significant issues based on the LCI and LCIA. Which life cycle phases or components stand out as major contributors to overall impact? What are the anomalies?
Evaluation which considers completeness, sensitivity, and consistency checks. Is all the information needed for interpretation present in the LCI and LCIA? How reliable is the information related to any identified significant issues? How much do changes in such factors influence the overall results? Are all of the assumptions, data, characterization

Guide to Sustainable Design 100
© Dassault Systèmes SolidWorks Corp. All rights reserved.
factors, etc. that were used in the assessment consistent internally and with the overall goal and scope of the LCA?
Conclusions, recommendations, and reporting. As discussed in later sections of this guide, a great deal of an LCA’s value depends on how its results are communicated to people involved in making relevant decisions, whether other designers, engineers, management, marketers, or other parts of the supply chain.
It is very important to note that no matter how carefully assembled, analyzed, assessed, and measured, LCAs are never the “real” answer. They require interpretation, which is turn requires transparency and judgment. The data sources, assumptions, and all other relevant information needs to be transparent to decision makers so that they can understand the full context of the results of the life cycle inventory assessment. Deciding among design options is not as easy as just comparing LCIA numbers, whether single- or multi-factor, weighted or not. LCIA results can be a source of insights, but do not stand alone in guiding product development choices. Engineers will need to take them in the context of the other attributes they are trying to optimize, including cost, manufacturability, performance, and so on. In addition, there are myriad other factors guiding product development decisions not covered by LCAs, including social impacts and acceptance, pricing, political agendas, and regulations.

Guide to Sustainable Design 101
© Dassault Systèmes SolidWorks Corp. All rights reserved.
Appendix C – LCA Tools and Methods
Commonly used LCA Tools
A 2006 survey of 65 LCA practitioners45 reported that:
58%* used GaBi (PE International) 31%* used SimaPro (PRé Consultants) 11%* used TEAM (Ecobilan) Other tools cited:
BEES (NIST) Umberto (ifu Hamburg) ECO-IT (PRé Consultants) Excel-based spreadsheets Math package (e.g. MATLAB, Mathematica)
Impact Assessment Methodologies
Impact assessment methodologies are the systematic calculations that are used to get from an LCI (life cycle inventory) flow, such as carbon dioxide or sulfur dioxide, to the environmental impact that it causes. The results of these calculations typically measure either midpoint or endpoint effects (endpoint effects are sometimes called damage effects). For example, the following chart shows how some midpoint effects map to their respective endpoint effects46:
45 Cooper, J.S.; Fava, J. (2006), "Life Cycle Assessment Practitioner Survey: Summary of Results", Journal of Industrial Ecology * percentages include overlap due to usage of multiple tools 46 “IMPACT 2002+” LCIA methodology / Dr. Olivia Jolliet, Univ. of Michigan: http://www.sph.umich.edu/riskcenter/jolliet/impact2002+.htm

Guide to Sustainable Design 102
© Dassault Systèmes SolidWorks Corp. All rights reserved.
While the endpoint or damage effects are the ones we really care about, these can be difficult to measure directly. For example, how many degrees of global average temperature increase are caused by one firm’s activities? It’s very hard to measure such a fractional effect, so we tend to measure the midpoint effect of greenhouse gas emissions, which lead to global average temperature increases. Most impact assessment methodologies use midpoint measurements. There are several impact assessment methodologies that are commonly used in the LCIA steps of an LCA, which include classification and characterization, and optionally normalization and/or weighting. Some of these impact assessment methodologies are described below.47 CML (“CML 1996”, “CML 2001”) The CML methodology, developed by the Institute of Environmental Sciences at the University of Leiden in the Netherlands, is the most widely-used and often considered the most complete methodology. It uses primarily European data to derive its impact factors. It groups the LCI results into midpoint categories, according to themes; these themes are common mechanisms (e.g. climate change) or groupings (e.g. ecotoxicity). There is a “CML 1996” and a “CML 2001” method. Its results can be viewed as a spreadsheet that presents characterization factors for more than 1700 flows (2001). The CML impact assessment methodology is the one we have chosen to calculate the results for SolidWorks Sustainability. For more information, see:
47 Information for this section was taken from “Life Cycle Impact Assessment (LCIA) Methods” from the GaBi LCIA documentation, which can be found at http://documentation.gabi-software.com/1_LCIA.html.

Guide to Sustainable Design 103
© Dassault Systèmes SolidWorks Corp. All rights reserved.
Institute of Environmental Sciences, Leiden University, The Netherlands: Handbook on impact categories "CML 1996", http://www.leidenuniv.nl/cml/ssp/projects/lca2/index.html
Institute of Environmental Sciences, Leiden University, The Netherlands: Handbook on impact categories "CML 2001 ", http://www.leidenuniv.nl/cml/ssp/projects/lca2/index.html
Institute of Environmental Sciences, Leiden University, The Netherlands: "Life Cycle Assessment, An operational guide to the ISO standards, Volume 1, 2 and 3", http://www.leidenuniv.nl/interfac/cml/ssp/projects/lca2/lca2
Eco-Indicator (“95”, “99”) Like the CML methodology, the Eco-Indicator method includes classification (“categories of effect”) and characterization steps, grouping the LCI results into midpoint categories. These impact data are then weighted according to a social evaluation process. For example, the Eco-Indicator 95 method specifies that 1 death per 1,000,000 inhabitants is equal to 5% surface loss of an intact ecosystem. This weighting is performed in order to compare different types of environmental effects directly together; the results can then be presented as a single score, the so-called Eco-Indicator score. Impact factors for Eco-Indicator 99 are collected and published in a spreadsheet by the Institute of Environmental Sciences, Leiden University, The Netherlands, and are furnished by PRé Consultants, makers of the Sima Pro LCA software package. The data are then normalized, or divided by a common reference value, to facilitate communication. In the case of Eco-Indicator 95, the data are normalized after classification using the annual European contributions per inhabitant for the impact category. In Eco-Indicator 99, the data are normalized based on published information furnished by PRé Consultants48. Because Eco-Indicator is a single-score LCA methodology, we do not include it as an option in SolidWorks Sustainability. TRACI The “Tool for the Reduction and Assessment of Chemical and Other Environmental Impacts”, or TRACI, is an impact assessment methodology developed by the US Environmental Protection Agency. As with the other impact assessment methodologies, TRACI is primarily a midpoint approach. It differs from the CML methodology in that the data comes primarily from North American sources. However, the TRACI methodology is not as comprehensive or complete as the CML method. For this reason, we have programmed SolidWorks Sustainability to perform the calculations using TRACI as well as CML, but haven’t enabled the TRACI results as an option. The following is a handy chart that demonstrates the difference between single-score and multiple-indicator impact assessment methodologies. 48 More information can be found at http://www.pre.nl/eco-indicator99/.

Guide to Sustainable Design 104
© Dassault Systèmes SolidWorks Corp. All rights reserved.
For example, Eco-Indicator 95 looks like this: