chapter 1 - university of illinoismste.illinois.edu/users/avilesga/edgardo/dissertation... · web...
TRANSCRIPT

CHAPTER 1
INTRODUCTION
This chapter presents first an overview of the topics pertinent to this study. The
first section describes the role that multiple representations have played in the teaching
and learning of mathematics. The second section includes the importance that the study
of functions has in mathematics curricula. The last section discusses how technology
has been used in order to enhance and promote a better understanding of mathematics.
The statement of the problem, the purpose of the study and the research questions
complete this chapter.
Multiple Representations
One of the most important issues that arises in mathematics education scenarios is
the fact that ways need to be found to promote understanding in mathematics (Hiebert
and Carpenter, 1992). In order to fulfill this goal, teachers, administrators, curriculum
designers and researchers have suggested and implemented different ideas, based on
mathematical learning theories. As cited in Porzio (1994) and based on research done by
Hiebert and Carpenter, Kaput (1989a) and Skemp (1987), “an emerging theoretical view
on mathematical learning that has been growing in significance is that multiple
representations of concepts can be utilized to help students develop deeper, more flexible
understanding” (p. 3).
The role and use of multiple representations have been constituted as an emerging
research and extensive discussion area during the last years in the mathematics education
community. Most recently, the National Council of Teachers of Mathematics (NCTM,
1

2000), facing a new millennium, has included the uses of representations as one of the
new standards in mathematics teaching and learning. The representation standard states:
Instructional programs from prekindergarten through grade 12 should enable all students to create and use representations to organize, record, and communicate mathematical ideas; select, apply, and translate among mathematical representations to solve problems; and to use representations to model and interpret physical, social, and mathematical phenomena. (p. 67)
This educational guide, illustrated by this standard in its three aspects, confirms the
important and transcendental role and the urgent need of using representations in teaching
mathematics at all levels, grades K through 16.
It has been extensively discussed that mathematics, by its own nature, is one of
the academic subjects where multiple representations are currently used (De Jong, et al.,
1998). Mathematics as a “collection of languages” (Kaput, 1989a, p. 167) and
characterized, the majority of the time by the presence of symbols and abstractions, is one
of the fields where representations could be used widely due to their capabilities to
enhance “understanding and for communicating information” (Greeno and Hall, 1997, p.
362). Due to this extensive use of symbols, abstractions, rules, definitions, it is also
known that students in mathematics are confronting real troubles trying to understand,
internalize, apply, and communicate important concepts in their mathematics school
levels. Because of this, it is right and necessary to think about the ways that
mathematical ideas are being currently represented, due to the understanding of these
concepts and the use of the ideas depend on how these representations are being used
(NCTM, 2000).
2

Dufour-Janvier, Bednarz, and Belanger (1987) have classified the term
representation in two major categories: internal representations and external
representations. Each of them possesses a considerable amount of sub-themes exposed to
more and deeper research linked with other fields. According to them, the first category
deals with “more particularly mental images corresponding to internal formulations we
construct of reality”. The second area deals with “all external symbolic organizations”
(p. 109), illustrated frequently in the forms of symbols, schema, and diagrams. Özgün-
Koca (1998) states “multiple representations are defined as external mathematical
embodiments of ideas and concepts to provide the same information in more than one
form” (p. 1). On the other hand, NCTM (2000) affirms that the “term representation
refers both to process and to product –in other words, to the act of capturing a
mathematical concept or relationship in some form and to the form itself” (p. 67). This
research project, in order to fulfill its objectives, proposes to limit the term representation
to its external category.
The capabilities of using these representations in mathematics teaching and
learning have also been discussed and illustrated by the literature. Özgün-Koca (1998)
suggested that the use of multiple representations in mathematics could provoke an
appropriate and healthy environment for students to abstract and understand major
mathematical concepts. Moreover, Dufour-Janvier and colleagues (1987) expressed their
motives for using external representations in mathematics. They argued that first,
representations are an inherent part of mathematics; second, representations are multiple
concretizations of a concept; third, representations are used locally to mitigate certain
3

difficulties; and last, the representations are intended to make mathematics more
attractive and interesting (p. 110-111). Porzio (1994) calls “obvious” all of the benefits
that the use of multiple representations can give to mathematical teaching and learning (p.
47). In addition, as cited in the same study, Kaput (1992) says that the use of more than
one representation or notation system help to illustrate a better picture of a mathematical
concept or idea. “Complex ideas are seldom adequately represented using a single
notation system. The ability to link different representations helps reveal the different
facets of a complex idea explicitly and dynamically” (p. 542). In summary, mathematics
at all levels needs the use of representations in order to communicate appropriately ideas,
and more importantly, to transmit, meaning, sense and understanding.
Other studies have supported the use of representations in mathematics in order to
enhance concept understanding. Hiebert and Carpenter (1992) state that the process of
the learning of mathematics with understanding “extends beyond the boundaries of
mathematics education” (p. 65). They define understanding as the way certain
information can be represented and structured. Moreover, they affirm that “mathematics
is understood if its mental representation is part of a network of representations” (p. 67).
Kaput (1989a), as well as, Keller and Hirsch (1998) found that the use of multiple
representations provide diverse concretizations of a concept, carefully emphasize and
suppress aspects of complex concepts, and promote the cognitive linking of
representations. Furthermore, Moschkovich, Schoenfeld and Arcavi (1993) explored in
their research the fact that there are multiple ways to solve a given problem and that
solving a problem calls for making connections across representations and for employing
4

both the process and object perspectives (p. 94). In this way, NCTM (2000) states,
“representations should be treated as essential elements in supporting students’
understanding of mathematical concepts and relationships; in communicating
mathematical approaches, arguments, and understandings to one’s self and to others; in
recognizing connections among related mathematical concepts; and in applying
mathematics to realistic problem situations through modeling” (p. 67). In summary, it
has been showed that the use of multiple representations is a useful tool to promote better
understanding of key concepts in the mathematics curricula.
Functions
Functions have a key place in the mathematics curriculum, at all levels of
schooling; particularly in secondary and college levels where they get their maximum
expressions and representations. The concept of function has been usually introduced
early in algebra courses, starting in the majority of the cases with the linear form. As a
result, NCTM (2000) has placed the concept of function as one of the cornerstones of
mathematics curricula: algebra. The algebra standard states that students from
prekindergarten through twelfth grade should understand patterns, relations, and
functions (p. 37). Thorpe (1989) proposed the use of functions “as the centerpiece of
algebra instruction” (Gningue, 2000, p. 28). The literature in mathematics education
possesses a vast amount of research concerning functions and their teaching and learning.
Dubinsky and Harel (1992), and Cooney and Wilson (1993) have agreed to say that
functions should be located at the center of the mathematics curricula. Lastly, Selden and
5

Selden (1992) point out that functions play a central and unifying role in mathematics
(Poppe, 1993, p. 2).
By their nature, functions are one of the best examples in which to use multiple
representations in the teaching and learning process. Researchers have agreed that
functions can be represented in the following forms: algebraic or formulas, tables, and
graphs (Brenner, et al., 1997; Greeno & Hall, 1997; Iannone, 1975; Janvier, et al., 1993;
Mevarech & Kramarsky, 1997; and others). “These forms of representation – such as
diagrams, graphical displays, and symbolic expressions – have long been part of school
mathematics” (NCTM, 2000, p. 67). In the same document, NCTM continues saying that
one of the major goals of algebra is that students should “understand the relationships
among tables, graphs, and symbols and to judge the advantages and disadvantages of
each way of representing relationships for particular purposes” (p. 38). Furthermore,
Leinhardt and colleagues (1990) and Moschkovich, et al. (1993) affirm that using
multiple representations to teach functions, that is, numeric, graphic, and symbolic, will
enhance a broad understanding of functions. In summary, the use of representations in
mathematics consists of a rich and varied group of alternatives that students can use,
whenever they want, in order to promote a better achievement of a particular topic.
Technology
Technology in all of its manifestations plays an important and primary role in
introducing and supporting multiple representations in mathematics. It has served to
engage students in a harmonious process of teaching and learning mathematics. Through
the use of technology, multiple representations can be introduced more powerfully as
6

well as, in an interactive and attractive way (Confrey, et al., 1991). Fey (1989) proposed
the use of calculators and computers to introduce algebraic concepts like functions.
Porzio (1994) assures that “instructional practices that involve the use of multiple
representations are not employed simply because technology now makes multiple
representations more readily accessible, but because of the potential benefits associated
with their use” (p. 4). Fey (1989), Goldenberg (1987), and Kaput (1992) have agreed that
due to the advancements and advantages of technology, the chance to provide students
better access to the use of representations have considerably increased. In summary, the
appropriate use of technology, represented in this case by graphing calculators,
computers, software packages, like spreadsheets, without doubts, brings an invaluable
direction to the acquisition and understanding of mathematical concepts, such functions,
at the same time, emphasizing the varied representations that functions have (Schwarz,
Dreyfus, and Bruckheimer, 1990; Browning, 1991; and Hart, 1991).
Following calls for reform according to Keller & Hirsch (1998), current
precalculus and calculus reform projects are attempting to incorporate numeric, graphic,
and symbolic representations into the curriculum. The Calculus Consortium at Harvard
(2001), a group of recognized scholars established in the late 1980’s, started a revolution
in the teaching and learning of mathematics, particularly in calculus courses at the college
level. One of the guiding principles of this consortium is based on the ‘Rule of Four’
where mathematics topics are introduced geometrically, numerically, analytically, and
verbally (Hart, 1991; Hughes-Hallet, 1991; Megginson, 1995 & Porzio, 1994).
7

During the past decade, with the purpose to “consider the needs of all
undergraduates attending all types of United States two- and four-year colleges and
universities”, the National Science Foundation (NSF) issued the report Shaping the
Future on new expectations for undergraduate education in science, mathematics,
engineering, and technology (George, et al. 1996, p. ii). The goal of this report was that:
All students have access to supportive, excellent undergraduate education in science, mathematics, engineering, and technology, and all students learns these subjects by direct experience with the methods and processes of inquiry. (p. ii)
As part of this report, the NSF emphasized the importance of the effective use of
technology to enhance learning (p. iv) recommending to institutions of higher education
its incorporation into the curriculum of science, mathematics, engineering, and
technology.
Statement of the Problem
The proposition that mathematics teaching and learning, at all levels of education,
is divorced from major curricular trends is still alive. In many mathematics education
scenarios, both processes are going in opposite directions, disregarding the calls and
movements for reform. It is also true that antique methods and strategies that are strictly
traditional instruction. In many instances they are based on the idea that teachers are the
authority and transmitters of knowledge. And those students are but passive recipients
predominates in our classrooms. Therefore, the mathematics curriculum continues to be
strictly limited, in the majority of the cases, to the prescribed textbook, when available.
The problem solving process is limited to the use of paper and pencil, without the
initiatives to experiment with innovative changes such the use of technology like
8

calculators and computers. Moreover, the textbooks currently used in some mathematics
classrooms are not offering to students the use of multiple representations of
transcendental concepts, like functions (Rodríguez-Ahumada, et al., 1997; Angel, 2000).
In these traditional settings, teachers and students are experiencing functions without an
appropriate emphasis on multiple representations, and moreover, the linking process that
should exist between them is missing (Kaput, 1989a).
Greeno and Hall (1997) state that “under the pressure to cover the prescribed
curriculum, teachers often feel that there is not enough time to teach students what
representations are for and why the forms are useful and effective” (p. 362). Hart (1991)
affirms that students who use multiple representations along with technology can acquire
richer concept images than those who do not have the same experience (p. 45). In
addition, Hart has shown that students exposed to the use of technology and
representations “had better conceptual understanding than those students not having this
exposure” (p. 46).
In summary, the literature on representations in mathematical teaching and
learning has shown that the appropriate use of multiple representations, supported by
technology, seems to be helpful in promoting understanding and the acquisition of a
broader achievement of important mathematics concepts, like functions.
Purpose of the Study
Functions are very important in the mathematics curriculum. The use of multiple
representations of functions, strongly supported by technology, has not reached all
corners of mathematics education. In many courses the uses of calculators and computers
9

have been nonexistent. In other cases, where some kind of technology is implicitly
allowed, it has been classified as optional.
The main purpose of this study is to develop computer-based algebra lessons
using spreadsheets about linear functions and their related topics where multiple
representations can be emphasized in order to determine if these learning activities can
help college students achieve a broad understanding of linear functions.
In order to fulfill this purpose, an experiment was carried out in which a portion
of subject matter dealing with linear functions was developed using multiple
representations as basis for instruction. A control group was also used, wherein the same
subject matter was taught. Figure 1 below shows how spreadsheets supporting multiple
representations were handled in this study.
10

Figure 1. Multiple representations of a linear function using spreadsheets.
Research Questions
This study investigates the following research questions:
1. How did the students in the two groups, experimental and control, compare in the prior achievement and attitudes, and their experiences with technology?
2. What relationships appear to exist between attitudes and achievement in the learning of linear functions activities?
3. At which level and in what ways, can the use of multiple representations be supported by spreadsheets learning activities to better promote understanding of linear functions in students at college level algebra?
4. How well does the medium of a powerful spreadsheet like Excel, lend itself to promoting instruction through multiple representations?
The next chapter consists of a review of the research literature pertinent to this
study. It will include a review about the uses of multiple representations in mathematics,
learning theories dealing with multiple representations, technology and multiple
representations, and functions and their representations.
11

CHAPTER 2
LITERATURE REVIEW
This research was designed to create computer-based algebra lessons using
spreadsheets about linear functions with emphasis on multiple representations and to
investigate possible effects of instructional uses of multiple representations on students’
outcomes (attitudes and achievement). This chapter reviews literature relevant to this
study and presents a theoretical framework for the research.
The chapter is divided into four main sections. The first section presents research
concerning the use of multiple representations in mathematics. It will briefly discuss
research studies dealing with the following topics: (a) need to use representations in
12

mathematics education, as well as, some of their strengths and weaknesses; (b)
definitions and classifications of representations; (c) students’ preferences for using
representations; (d) connections among representations; and (e) interpretation of
representations. The second section describes related learning theories that support the
use of multiple representations. The third section discusses the role of technology and the
use of representations in mathematics. The fourth section of this chapter contains
research studies supporting the teaching of functions using representations.
Multiple Representations in Mathematics Teaching and Learning
Needs to Use Multiple Representations in Mathematics
The uses of multiple representations have been strongly connected with the
complex process of learning in mathematics, and more particularly, with the seeking of
the students’ better understanding of important mathematical concepts. Research done by
Hiebert and Carpenter, (1992); Kaput, (1989a); and Skemp, (1987) illustrates that
multiple representations of concepts can be utilized as a help for students in order to
develop deeper, and more flexible understandings (Porzio, 1994). As cited in Gningue
(2000, p. 43), Kaput (1989a) “thinks that students learn through several modes of
representations”. Dufour-Janvier, Bednarz, and Belanger (1987) have described
important elements about the uses of representations in mathematics. Dufour-Janvier and
colleagues argue that representations are inherent in mathematics; they are multiple
concretizations of a concept; they could be used to mitigate certain difficulties; and they
are intended to make mathematics more attractive and interesting (pp.110-111). Keller
and Hirsch (1998) describe some potential benefits [italics added] related to the use of
13

representations. Among these benefits are: (a) provide multiple concretizations of a
concept, (b) selective emphasis and de-emphasis different aspects of complex concepts,
and (c) facilitate cognitive linking of representations (p. 1). Kaput (1992) points out that
the use of multiple representations or notations could be helpful at the time of present a
clear and better picture of a concept or idea.
Complex ideas are seldom adequately represented using a single notation system… Each notation system reveals more clearly than its companion some aspect of the idea while hiding some other aspects. The ability to link different representations helps reveal the different facets of a complex idea explicitly and dynamically. (p. 542)
De Jong, et al. (1998) argue that in today’s educational processes, students have been
“confronted with information from different sources (computer programs, books, the
teacher, reality, the classroom, peers, etc.) and in many different representations that they
have to evaluate, make a selection from, and integrate them into their personal knowledge
construction process” (p. 9). About this particular, Poppe (1993) says that the wide uses
of mapping diagrams, graphs, and tables, provide a visual representation of the
relationships between quantities.
The uses of representations in mathematics have not been a really new trend in
educational practices. Porzio (1994) indicates that mathematics educators have made
efforts for the last years, in order to use more than one representation to introduce
mathematical concepts to students. Janvier, Girardon, and Morand (1993) point out that
educators and researchers have emphasized, through the years, the roles of different
forms of representation illustrated as: graphs, tables, diagrams, charts and figures.
Current reform efforts in various curriculum projects dealing with calculus instruction at
14

college level, demonstrate that multiple representations have played a particular role in
these processes. As cited in Hart (1991, p. 2), “this emphasis on multiple representations
fits the picture of calculus reform in which Tucker (1987, p. 16) sees ‘a vista of a more
conceptual, intuitive, numerical, pictorial calculus’ as the calculus of tomorrow”.
De Jong, et al. (1998) stated that there are three goals that multiple representations
serve. First, multiple representations are recommended to use due to the information that
students learn has varied characteristics. Second, multiple representations are good
resources to induce in the students a particular quality in their knowledge. De Jong and
colleagues say, “both approaches lead to a concurrent presentation of multiple
representations” (p. 39). And third, it is an assumption that the use of representations in
sequence is beneficial for learning. This last goal illustrates the transitional presentation
of representation. Furthermore, these researchers have identified four factors that
mediate the effects of using representations.
The type of test used is partly responsible for the effects… The type of domain in the learning environment may also be of influence… The type of learner using the environment also influences the effectiveness, and finally, the type of support present in the environment also plays a role. Most environments simply assume that the co-presence of more than one representation will prompt the learner to integrate the information. (p. 39)
In addition, De Jong, et al. (1998) identified three reasons (explicitly or
implicitly) about the uses of representations. The first reason deals with what to do with
the tuning of the domain information and the representation. The second concerns the
idea that the use of multiple representations will promote a flexible knowledge. And
lastly, the specific order that representations are introduced into learning will facilitate it.
15

The first reason for using multiple representations is that specific information can be conveyed in a specific representation, and that for a complete set of learning material, containing a variety of information, a combination of several representations is therefore necessary. The main issue here is that of adequacy, which concerns the expressional possibilities of a representation. A second aspect that can be involved here is efficiency, which concerns the expressional power of a representation. Within one level of adequacy, e.g., graphical representations, some may still be more efficient than others. The second reason for using more than one representation is that expertise is quite often seen as the possession and coordinated use of multiple representations of the same domain. In this theory expertise is viewed as being able to understand the domain knowledge from multiple perspectives… The third reason for using more than one representation is based on the assumption that a specified sequence of learning material is beneficial for the learning process. (pp. 32-33)
Greeno and Hall (1997) call tools [italics added] the forms of representations in
mathematics. They argue that students can learn to use them “as resources in thinking and
communicating” (p. 362). Porzio (1994) citing the research of Dufour-Janvier and
colleagues (1987) says that it is desired that “students can perceive representations as
mathematical tools for solving problems and helping students in the ‘construction’ of a
concept by viewing common properties and differences between representations of the
concept. The research work group headed by Dufour-Janvier has explored three
important categories concerning representations and have raised a group of questions
dealing with each one of these categories: (a) how these tools have been used in
mathematics instruction; (b) how are the expected outcomes achieved in the current
teaching of mathematics; and (c) how should be the representations to be useful in
mathematics.
Dufour-Janvier, et al. (1987) have realized that mathematics teaching, together
with all the elements including in its curricula have submitted students, of all ages and
16

school levels, to a wide variety of representations. At this point, these researchers
propose the following questions:
What are the motives for using external representations in mathematics teaching? What are the expected outcomes that justify such a wide variety of representations? Are these outcomes achieved in current teaching of mathematics? To what extent is it possible that such representations are inaccessible to students and even detrimental? Can the teaching of mathematics be organized in such a way that learning is articulated with the representations children develop themselves? (p. 109)
These recognized scholars have, also looked at the outcomes of the uses of
representations in the learning of mathematics. Dufour-Janvier and colleagues (1987)
present some expectation concerning the uses of representations. They expect first, that
in particular mathematics problem situations, students could be able to reject one
representation in order to choose another one, knowing the reasons because they are
doing this selection. Second, it is expected that students could pass from one
representation to another, knowing the possibilities, limits and effectiveness of each one.
Third, students should be able to select the appropriate representation taking into
consideration the task. Finally, through the use of multiple representations, students will
be able to “grasp the common properties of these diverse materials and will succeed in
constructing the concept” (p. 111).
Another group of questions that Janvier and colleagues (1987) focused in their
research were the following:
1. Does the students “select” a representation? Among several representations presented to them, do they know which one to retain, which is the most appropriate to accomplish the task?
2. Do the students see the same task in each of the representations given?
17

3. Are the students convinced that regardless of the particular representation they use as an aid to solve a problem they will necessarily arrive at the same result?
4. How do students develop the attitude of having recourse to representations in case they encounter difficulties? (p. 114)
The literature, supported by the extensive research done by Janvier, et al. (1987)
has raised these questions, summarized above, and many others regarding the usefulness
of representations in mathematics. The base of their concern and many of their inquiries
is in the fact that current teaching practices using representations are not fulfilling their
objectives and moreover, their contribution to the learning process is almost null.
“Certain representations lead more to difficulties rather than functioning as aids to
learning” (p. 116).
Greeno and Hall (1997) explored the argument about how representational forms
should be made and used in innovative classroom settings. First, they affirm that
representations are constructed for specific purposes in order to attempt to solve problems
and communicate with others about it. Second, students frequently develop
representations with the purpose of observing patterns and performing mathematical
procedures, keeping in mind the fact that different forms provide different supports.
Lastly, students frequently use multiple representations in order to solve a problem.
Some of the representations used by students are constructed by themselves and they
could differ considerably from the representations taught in the curriculum.
Some Weaknesses of Using Representations in Mathematics
Lines of research studies describe some weaknesses or disadvantages of the uses
of representations in mathematics teaching and learning. Poppe (1993) exploring the
effects of differing technological approaches to calculus on students’ use and
18

understanding of multiple representations when solving problems, found that although
students realized that tables, graphs, and mapping diagrams were helpful, they did not use
them in order to solve unfamiliar mathematical problems unless suggested to do so.
Dufour-Janvier and colleagues (1987) investigating the accessibility of representations
concluded that the use of representations is sometimes abstract to students, and this could
provoke a lack of meaning to them. Also, they affirm that the inappropriate context use
of representations, as well as the prematurely of their use, resulting in negative
consequences to students. “The use of such nonaccessible representations encourages a
play on symbols, puts the emphasis on the syntactical manipulations of symbols without
reference to the meaning. The signified is absent! Mathematics is reduced to a formal
language” (p. 11).
Van Someren, et al. (1998) conducting research in multiple representations in
teaching, affirm that the use of combined representations in mathematics “creates new
problems for the learner” (p. 4). They go beyond by saying that multiple representations
are not a good thing per se [italics added]. These researchers claim that when
information is presented to students in varied forms, it is particularly important to also
teach the relations or connections between representations since, if students are left alone
to construct them themselves, it will be difficult. Finally, Van Someren and colleagues
call for a need for a closer analysis between their semantic relations and performance
characteristics, in order to appropriately use multiple representations in problem solving.
Definitions of Representations
19

Until this point, the research has showed the need to use representations in
mathematics teaching and learning. It is important to look at how the literature has
defined representations. There are few researchers who have attempted to define
representations in mathematics. The only clear definition comes from the work done by
Özgün-Koca (1998) who stated that “multiple representations are defined as external
mathematical embodiments of ideas and concepts to provide the same information in
more than form” (p. 1). Another definitions could not be found.
Classification of Representations
Nevertheless, the literature does show some research studies concerning the
classification of representations. Porzio (1994, p. 3), citing the work done by Dufour-
Janvier and colleagues (1987), classifies representations as external and internal.
Internal representations concern most particularly mental images corresponding to internal formulations we construct of reality (we are here in the domain of the signified). External representations refer to all external symbolic organizations (symbol, schema, diagrams, etc.) that have as their objective to represent externally a certain mathematical ‘reality’. (p. 109)
Lesh, Post, and Behr (1987) have said that external representations are the way by which
mathematical ideas could be communicated and they are presented as physical objects,
pictures, spoken language, or written symbols.
The research group headed by Janvier (1993), a recognized scholar in this field,
expanded the idea of classification of representations.
External representations act as stimuli on the senses and include charts, tables, graphs, diagrams, models, computer graphics, and formal symbol systems. They are often regarded as embodiments of ideas or concepts. The nature of internal representations is more illusive, because they cannot be directly observed. (p. 81)
20
They affirm that important concepts in a representation theory are “to mean” or “to
signify” (p. 81). In this way, Janvier and colleagues state that external representation,
which they call signifier, and internal representation, called signified, should be linked.
Cuoco (2001) affirms that:
External representations are the representations we can easily communicate to other people; they are the marks on the paper, the drawings, the geometry sketches, and the equations. Internal representations are the images we create in our minds for mathematical objects and processes – these are much harder to describe. (p. x)
Goldin and Shteingold (2001) expand the discussion on the types of
representation arguing that:
External systems of representation range from the conventional symbol systems of mathematics (such as base-ten numeration, formal algebraic notation, the real number line, or Cartesian coordinate representation) to structured learning environments (for example, those involving concrete manipulative materials or computer-based micro worlds). Internal systems, in contrast, include students’ personal symbolization constructs and assignments of meaning to mathematical notations, as well as their natural language, their visual imagery and spatial representation, their problem-solving strategies and heuristics, and (very important) their affect in relation to mathematics. (p. 2)
Janvier and colleagues (1993) emphasizing the classification of representations
introduced the term “iconic”. They say that external representations could be iconic since
“they can more or less suggest in their arrangement or configuration the internal
representation to which they relate” (p. 82). These researchers consider the term
“symbolic” as equivalent to the word “noniconic”. They explain that the symbolism of
an external representation depends primarily on the arbitrary arrangement or the selection
of elements, which constitute it. When any other feature has not helped the interpretation
21

process, it refers to as noniconic representations. Janvier, et al. affirms that the majority
of mathematics representations could be classified as noniconic.
The psychologist Jerome Bruner, using some guidelines investigated by Piaget,
has been considered as one of the first researchers who implicitly classified
representations. Bruner (1964) proposed three modes of representation: (a) enactive, (b)
iconic, and (c) symbolic. Using the modes of representation introduced by Bruner,
Mason (1987a) he has presented the idea that teaching schemes are a spiral movement.
As they pass through the spiral, students will go from using manipulable external
representations to gain a meaning of internal representations to symbolic representations.
Mason proposes that one aim should be to help students to construct internal
representations strongly related to external representations where they feel confident.
As discussed by Janvier, et al. (1993) another line of research regarding
classification of representations comes from the studies done by Bertin (1967) who used
three categories. The first one maps, which includes the representation that keeps a fair
degree of similarity with the special properties of the objects they represent. The second,
which shows the nature of the relations between variables, is called diagrams. Familiar
mathematical concepts such as data charts, graphs, belong to this category. Lastly,
networks refer to when representations of this class show the relationships between
events, factors, or individuals (pp. 82-83).
Janvier and colleagues (1993) have realized that the existence of many
representations in mathematics is a cause of confusion on students. Trying to relate
internal and external representations in mathematics, they propose two important terms in
22

their discussion: homonymy and synonymy [italics added]. The first phenomenon in
mathematics is found when one representation has two different meanings. That is, from
an external representation there are two different internal representations. The second
term refers to when one mental object is denoted in many representations: from two
different external representations there is one internal representation. According to their
findings, homonymy, as well as synonymy cannot be avoided in mathematics. “They
belong to it per se” (p. 88).
Students’ Preferences for Representations
It is frequently observed that students in the classroom show certain preferences
for one particular external representation. The literature contains important research
studies concerning preferences exhibited by students in order to select a representation.
Hart (1991), who developed extensive research concerning representations, explored their
management. She studied students’ preferred representations and how they vary the
choice of representation depending on the problem. Hart found that there are factors that
influence students’ choice of representation. Her findings are summarized in the
following points:
1. Students confident in their symbolic manipulation skills tend to use alternate representations only when unsuccessful at finding an answer symbolically.
2. Students make a choice of representations depending on the complexity of the symbolic information provided.
3. Some students do not use a certain representation because they do not recognize that it’s a viable choice.
4. Students lack confidence in using certain representations.
23

5. Students who do not have access to a graphing calculator do not typically choose to use the graphical representation.
Hart’s findings indicate that the representation used by students to solve problems is
strongly influenced by their previous experiences.
Research by Yerushalmy (1997) revealed, “normally, symbolic (formula or
equation) representation is the more convenient representation for modeling situations
with two independent variables. However, the priorities for students who have not yet
learned to manipulate symbols but have experienced modeling through various other
representations could be different” (p. 432).
Keller and Hirsch (1998) identified two types of research on students’ preferences
for representation. The first line of research deals particularly with the attempt to
determine students’ preferences by the representation used to perform tasks. LaLomia,
Coovert and Salas (1988) conducted research regarding which of two types of
representation – tables and graphs – students used most often to solve tasks. Their
findings show that students preferred tables when they had to locate particular numbers.
On the other hand, students only slightly used graphs with interpolation and forecasting
tasks. The second line of research dealing with preferences in representations concerns
learning theories or cognitive styles. About this second line of research on
representations’ preferences, Turner and Wheatley (1980) explored the preferences of
students in an elementary calculus course emphasizing two representations: graphical and
linguistic. They found that students exhibited strong preferences for each form.
Furthermore, there was a significant correlation between graphical representations and
the students’ spatial performance.
24

Keller and Hirsch (1998) identified several factors that influence the preference of
representations. These factors included: (a) the nature of students’ experiences with each
representation, (b) the students’ perceptions of the acceptability of using a representation,
and (c) the level of the task. Another theories concerning representations’ preferences
comes from the research done by Donnelly (1995), Dufour-Janvier, et al. (1987),
Eisenberg and Dreyfus (1991), Poppe (1993), Porzio (1994), and Vinner (1989). Özgün-
Koca (1998, p. 5) summarized the previous findings of research in reasons for students’
preferences for representations. These reasons were classified in two sections: internal
and external effects. In the first sections are: personal preferences, previous experience,
previous knowledge, beliefs about mathematics, and rote learning. Under external effects
there are: presentation of problem, problem itself, sequential mathematics curriculum,
dominance of algebraic representation in teaching, and technology and graphing utilities.
Connections Among Representations
An issue widely discussed in the consulted literature has been the connections
between representations. Other authors have referred to it as translations and linking
processes among representations.
Dufour-Janvier and colleagues (1987) realized that often students confront
problems to see the same task when different representations of the same problem are
given. Students think that there are equal numbers of problems as there are
representations. These researchers presented the following situation:
A child resolves a problem using a representation. We then show him to the same problem resolved by someone else using a different representation. When we deliberately show him the answer of this other child (the answer happens to be incorrect); a number of children are not at all disturbed and find this quite natural
25

because in their view the first problem was done one way and the second done in another way. (p. 114)
With this example it has been shown “that students do not see all of the representations
accompanying a single task as different ways for tackling the same situation” (Porzio,
1994, p. 45). The literature shows that students are able to work with different types of
representations. The troubles start when they try to relate similar information provided
by different representations. Lesh, Post, and Behr (1987) have stated that the connections
between representations are particularly important in order to solve problems.
Porzio (1994) conducted research exploring the students’ abilities to see or make
connections between graphical, numerical, and symbolic representations in the context of
problem situations, using three different approaches: (a) traditional approach, (b) graphic
calculator approach, and (c) Calculus & Mathematica software. He found that in the
traditional course where symbolic representations were emphasized, students belonging
to this group exhibited the most difficulty of all the students in recognizing connections
between different representations and different forms of the same non-symbolic
representation. In the group where graphics calculators were used and graphical and
symbolic representations were emphasized, students seemed to consider the main
emphasis to be on graphical representations. Finally, students who used the Calculus &
Mathematica software, where multiple representations which were illustrated in the
majority of the times as symbolic and graphic, were better than the other students at
recognizing connections between different representations and varied forms of the same
representation. Also, students often used graphical/symbolic and symbolic/numerical
representations. The research results from Porzio can be summarized as follow:
26

Students are able better able to see, or make, a connection between different representations when one or more of the representations is emphasized in the instructional approach that they experienced and [underlined by the author] when then instructional approaches includes having students solve problems specifically designed to explore or establish the connection(s) between the representations. (p. 443)
Kaput (1989a), one of the recognized researchers in the field has introduced the
concept of linked representations [italics added]. He describes the cognitive potential of
dynamic links between representations. Kaput said: “multiple, linked representations of
mathematical ideas likewise provide a form of redundancy, a redundancy that can be
exploited directly in a multiple, linked representation learning environment” (p. 179).
According to him, one of the advantages of using linked representations is that they
enable students to repress some aspects of complex ideas and give more attention to
others, supporting the varied ways of the learning and reasoning process.
Janvier and colleagues (1993) have introduced the term translation in the
discussion of representation in mathematics. They argue that the process of translation
from one representation to another is possible as the result of the synonymy phenomenon
presented earlier. These researchers think that in order to teach the translations skills
efficiently it is necessary that students view the translations from both directions.
Janvier, et al. suggests, for example, that opposite translations, that is “graph formula”
and “formula graph” should be tackled in pairs (p. 98).
Hiebert and Carpenter (1992) have conducted extensive research dealing with
teaching and learning mathematics with understanding. They have devoted some
sections in their research to connections between representations. They argued that
connections between external representations of mathematical concepts could be
27

constructed by the student “between different representations forms of the same
mathematical idea or between related ideas within the same representation form” (p. 66).
Hiebert and Carpenter said that the connections between different representations are
possible if they are based on the relationships of similarity (“these are alike in the
following ways”) and in the relationships of difference (“these are different in the
following ways”) (p. 66). The particular connections between representations can be
constructed, according to these researchers, looking carefully at how they are the same
and how they are different. Finally, Hiebert and Carpenter affirm that the process of
connections between representations plays a particular role in learning mathematics with
understanding.
Representations and Understanding
Understanding and meaning are two key terms in mathematics teaching and
learning. They have been reinforced in the current reform movements. On this topic,
Goldin and Shteingold (2001) affirm “conceptual understanding consists in the power
and flexibility of the internal representations, including the richness of the relationships
among different kinds of representation” (p. 8). Janvier et al. (1993) mentions that in any
discussion about theories of representation, two terms are transcendental: “to mean” and
“to signify” [italics added] (p. 81).
Porzio (1994) points out that the theoretical framework that support the use of
multiple representations in mathematics comes from the research done by Hiebert and
Carpenter (1992). These researchers affirm that understanding can be described in terms
of internal knowledge structures. They define understanding in mathematics as follows:
28

A mathematical idea or procedure or fact is understood if it is part of an internal network. More specifically, the mathematics is understood if its mental representation is part of a network of representations. The degree of understanding is determined by the number and strength of the connections. A mathematical idea, or procedure, or fact is understood thoroughly if it is linked to existing networks with stronger and numerous connections. (Hiebert and Carpenter, 1992, p. 67)
Based on this definition of understanding, Porzio says that one of the principal goals of
mathematics teaching and learning is to provide tools and opportunities to students in
order that they can develop large and well-connected internal networks of
representations.
Goldin and Shteingold (2001) remark that:
A mathematical representation cannot be understood in isolation. A specific formula or equation, a concrete arrangement of base-ten blocks, or a particular graph in Cartesian coordinates makes sense only as part of a wider system [italics added by the author] within which meanings and conventions have been established. The representational systems important to mathematics and its learning have structure, so that different representations within a system are richly related to one another. (p. 2)
Kaput (1989b) describes as epistemological sources of mathematical meaning the
connections that could be possible between representations. He identifies the following
factors as the epistemological sources of mathematical meaning:
1. transformations within and operations on a particular representation system;
2. translations across mathematical representation systems;
3. translations between non-mathematically described situations and mathematical representation systems; and
4. consolidation and reification of actions, procedures, or webs of related concepts into phenomenological objects that can then serve as the bases of new actions, procedures, and concepts at a higher level of organization. (p. 106)
29

Porzio (1994) points out that the first three sources of mathematical meaning identified
by Kaput correspond to the many kinds of connections that can be made between distinct
forms of the same type of representation and between different kinds of representations.
Interpretation of Representations
The final topic concerning multiple representations deals with the interpretation of
these representations in mathematics. This topic is one of the most widely discussed. As
cited in the work by Janvier and colleagues (1993, p. 81), Von Glasersfeld (1987, p. 216)
affirms: “A representation does not represent by itself – it needs interpreting; to be
interpreted, it needs an interpreter”. Greeno and Hall (1997) mention that in order to
interpret representations, students should be involved in a learning environment where
complex practices of communication and reasoning are emphasized.
The literature agrees in finding that graphs, tables, pictures, and diagrams, among
others, do not constitute a representation by themselves. Greeno and Hall (1997) citing
the research done decades ago by Charles Sanders Peirce (1955) said, “for a notation to
function as representation, someone has to interpret it and thereby give it meaning” (p.
366). Peirce identified three factors involved in representation: (a) something that is
represented, the referent; (b) the referring expression that represents the referent; and (c)
the interpretation that links the referring expression to the referent. Following Peirce’s
principle, Greeno and Hall say that notations such as tables, equations, and graphs are
considered as potential representations. They become representations per se when
someone gives them meaning by interpreting them.
30

Greeno and Hall consider equations, Cartesian graphs, and tables as standard
forms of representations and they have frequently shared conventions of interpretation.
These researchers indicate that the process of learning these conventions are important
for students in order to encounter, construct and communicate their ideas.
Standard instructional practices in mathematics provide students with opportunities to learn the conventions of interpretation of standard representational forms at an operational level. Teachers explain how to construct and interpret tables, graphs, and equations, and students are asked to construct representations of given information in these forms and to interpret representations that they are given. In these activities students can learn to follow the standards conventions of interpretation for the forms, and with this learning the forms function as representations for the students. (p. 366)
According to these researchers, a practice like this one is now promoting the recognition
of interpretation as an essential part of representations in mathematics. These activities
serve to give students the opportunity to learn how to follow standard conventions of
interpretation, and moreover, how to understand how representations work.
Learning Theories Supporting Multiple Representations in Mathematics
As stated earlier, the use of multiple representations in mathematics is strongly
linked to the learning of important mathematics concepts. This section will describe
some research of theorists and their contributions to this field.
One of the most recognized researchers in this field is Zoltan P. Dienes. His
extensive work in theories of learning has impacted mathematics teaching and many of
his ideas are still been applied today in educational settings (English and Halford, 1995).
As cited in Gningue (2000, p. 59), “Dienes (1971) believes that abstraction results from
the passage of concrete manipulations of objects to representational mapping of such
31

manipulations and then to formalizing such representations into rule structures”. Based
on this belief, Dienes elaborated his four general principles for teaching concepts.
The two first Dienes’ principles are the Dynamic Principle and the Constructivity
Principle. He thinks that the best way to teach a new concept is through the formulation
of a particular situation where students are lead to constructive, rather than analytical
thinking and understanding (Gningue, 2000). The third principle is the Mathematical
Variability Principle. It states “concepts involving variables should be learned by
experiences involving variables should be learned by experiences involving the largest
possible number of variables” (Dienes, 1971, p. 31). Lastly, the Perceptual Variability
Principle or Multiple Embodiment Principle “demands a richness of concrete experiences
with the same conceptual structure, so that children may glean the essentially abstract
mathematical idea, which must be learned. To allow as much scope as possible for
individual variations in concept-formation, as well as to induce children to gather the
mathematical essence of abstraction, the same conceptual structure should be presented in
the form of as many perceptual equivalents as possible” (pp. 30-31).
This principle suggests that the learning of a mathematical concept reaches its
maximum expression when students are exposed to a concept using a variety of physical
materials or embodiments [italics added]. Resnick and Ford (1981) said: “multiple
embodiments are viewed as facilitating the sorting and classifying process that constitutes
the abstraction of a concept. Seeing a principle operating similarly even when different
materials are used seems to help children discover what is and is not relevant to the
concept” (p. 121). These researchers point out that the students’ familiarity with the
32

various mathematical materials is an assumption of presenting concepts using multiple
embodiments. Resnick and Ford argue that if this familiarity process does not occur first,
the use of embodiments will be “counterproductive” (p. 121) since students should learn
the materials and a new mathematical principle at the same time. According to Dienes,
as cited in Resnick and Ford’s research, multiple embodiments should look different from
each other in order that children can observe the structure from many different
perspectives and construct a vast amount of mental images about each concept. The use
of these embodiments should allow manipulation of all variables related with the concept
under study.
Dienes (1973) clarified his four principles by pointing out six stages of teaching
and learning mathematical concepts. Similar to the intellectual developmental stages
introduced by Piaget, Dienes affirmed that the learning of mathematical concepts occur
through sequential stages. These stages are: (a) free play, (b) games, (c) searching for
communalities, (d) representation, (e) symbolization, and (f) formalization. As
mentioned in Gningue (2000), the first three stages are described as components of the
first Dienes’ principle. The second phase of the learning cycle promoted by Dienes
constitutes the transition process from manipulative materials to abstract representations.
These representations are illustrated initially as pictorial models and graphs, and finally
as mathematical symbols. The beginning of this second phase is the fourth or
representation stage.
The child needs to develop, or to receive from teacher, a single representation of the concept that embodies all the common elements found in each example. This could be a diagrammatic representation of the concept, a verbal representation, or an inclusive example. Students need a representation in order to sort out the
33

common elements present in all examples of the concept. A representation of the concept will be usually more abstract than the examples will bring students closer to understanding the abstract mathematical structure underlying the concept. (Gningue, 2000, p. 64)
The fifth stage described by Dienes is where the students describe the representation of
the concept verbally and using mathematical symbols. Dienes suggests that the teacher
should supervise the use and construction of symbols. Students can use their own
symbols, but they should be aligned with those included in the textbook.
Janvier and colleagues (1993) affirm that students do not always appreciate and
accept that two or more external representations belong to the same concept. Rather,
students have exhibited the preference to work mainly “on a one-to-one correspondence
basis” (p. 91). Janvier et al. mention that opponents of Dienes’ principles state that
adding more embodiments to concept instruction is not a guarantee that students will get
a better and more meaningful internal representation of the concept.
Constructivism has had an enormous impact on current education learning
theories, and mathematics instruction is no exception. De Jong and colleagues (1998)
said “modern education learners are encouraged to construct their own knowledge,
instead of copying it from an authority, be it a book or a teacher” (p. 9). Hart (1991)
mentions “constructivist theory suggests that knowledge is actively constructed out of
one’s experiences” (p. 4). Noddings (1990) explains that constructivism has basically
two main characteristics: (a) a cognitive position, and (b) a methodological perspective.
This review will focus on the first characteristic of constructivism. She affirms: “as a
cognitive position, constructivism holds that all knowledge is constructed and that the
34

instruments of construction include cognitive structures that are either innate or are
themselves products of developmental construction” (p. 7).
Noddings (1990) in her extensive work in the field, has summarized in the
following points the current constructivists views:
1. All knowledge is constructed. Mathematical knowledge is constructed, at least in part, through a process of reflective abstraction.
2. There exist cognitive structures that are activated in the processes of construction.
3. Cognitive structures are under continual development. Purposive activity induces transformation of existing structures.
4. Acknowledgement of constructivism as a cognitive position leads to the adoption of methodological constructivism.
a. Methodological constructivism in research develops methods of study consonant with the assumption of cognitive constructivism.
b. Pedagogical constructivism suggests methods of teaching consonant with cognitive constructivism. (p. 10)
Technology and Multiple Representations
Technology has the potential to completely change current trends in teaching and
learning of mathematics. Researchers as De Jong and colleagues (1998) have agreed
with the need for technology in mathematics scenarios. They said: “Technology plays a
major role in implementing these new trends in education” (p. 9). As cited in Gningue
(2000), Fey (1989) proposed the use of a vast amount of technological resources, such as
calculators, computers, and computer software to teach concepts in algebra. According
to him, “the most obvious implication of computer tool software is the opportunity to
rebalance the relationship among skill, understanding, and problem-solving objectives in
35

algebra” (p. 204-205). Findings from research studies conducted by Orton (1983a,
1983b) and Tall (1985) indicate that the use of technology is advantageous in order to
promote conceptual understanding.
One of the main advantages to the uses of technology in mathematics education
is, without a doubt, the capability to present information in multiple representations.
Mathematical concepts can be introduced through the use of tables, graphs, equations,
and other representations. Keller and Hirsch (1998) affirm that the incorporation of
multiple representations supported by technology is an important topic in mathematics
curricula. Important lines of research conducted by recognized scholars such as Fey
(1989), Goldenberg (1987), Kaput (1992), and Porzio (1994) indicate that the access to
multiple representations of mathematical concepts has increased with the advancements
of technology.
Use of technology in the classrooms appears to affect student learning in a positive way. Those students using technology to access multiple representations may have “richer” concept images than those who do not have the same experience… Technology can provide a means for presenting concepts via multiple representations and for students to work within multiple representations. A review of the literature indicated there may be some positive effects from the use of technology, capable of graphing and/or symbolic manipulation, in the classroom. (Hart, 1991, pp. 45-46)
Several mathematics reform projects have been developed nationwide in order to
promote teaching mathematical concepts using multiple representations supported by
technology. One of them is the Harvard Calculus Project, also called “Rule of Three”,
which emphasizes the use of three representations: graphical, numerical, and symbolic
(Hart, 1991; Porzio, 1994). Hughes-Hallet (1991) indicated:
36

[The philosophy of the project] is based on the belief that in order to understand an idea, students need to see it from several points of view, and to build web connections between the different viewpoints. I believe that in calculus most of the ideas should be presented in three ways: graphically and numerically, as well as in the traditional algebraic way. Technology is invaluable here. (p. 33)
Porzio (1994) points out that there are differences between students participating in
curriculum projects, specifically in calculus (Tucker, 1990), where they are using
computers, calculators and representations where graphics and symbols are also
emphasized, students using the Calculus & Mathematica software where technology is
used intensively, and students from traditional approaches. Nevertheless, he states that
there is little evidence of the effectiveness of these technological approaches.
Fey (1989) affirms that the use of numerical, graphic and symbol manipulation is
a powerful technique for mathematics teaching and learning. He identified several ways
in which computer-based representations of mathematical ideas are unique tools for
problem solving. These are:
1. Computer representations of mathematical ideas and procedures can be made dynamic in ways that no text or chalkboard diagram can.
2. The computer makes it possible to offer individual students a work environment with representations that are flexible, but at the same time constrained to give corrective feedback to each individual user whenever appropriate.
3. While some multiple embodiment computer programs might be viewed as poor simulations of more appropriate tactile activity, it has been suggested that this electronic representation plays a role in helping move students from concrete thinking about an idea or procedure to an ultimately more powerful abstract symbolic form.
4. The versatility of computer graphics has made it possible to give entirely new kinds of representations for mathematics.
37

5. The machine accuracy of computer generated numerical, graphic, and symbolic representations makes those computer representations available as powerful new tools for solving problems. (p. 255)
Functions and their Representations
The concept of function is one of the key topics in mathematics. It dominates the
mathematical panorama and is present in a vast part of the instructional activities
developed at secondary and college levels. Thorpe (1989) proposes the study and the use
of functions as “the centerpiece of algebra instruction because functions are at the very
heart of calculus” (p. 11). Selden and Selden (1992) coincide with Thorpe, when they
say that functions play a central and unifying role in mathematics. As cited in Hart
(1991, p. 10), Vinner and Dreyfus (1989) introduced the Dirichlet-Bourbaki definition of
what a functions is. It says: “a function is a correspondence between two nonempty sets
that assigns to every element in the first set (the domain) exactly one element in the
second set (the codomain)” (p. 357). This definition has been kept and taught in the
majority of the mathematics curricula (Lloyd and Wilson, 1998).
Further, the concept of function has the capability of being taught using different
representations. The literature illustrates functions in several ways, such as mapping
diagrams, tables, graphs, and equations. All of these representations are primarily
intended to promote a better understanding of the concept. Research done by Sfard
(1987) indicates that in order to get a good concept of functions, students should develop
an operational before a structural concept. After this, students will benefit from the
38

introduction of functions using the different representations, such as mappings, tables,
and graphs (Poppe, 1993, p. 26).
According to Poppe (1993), tables, graphs, and mapping diagrams are
representations of functions that can be used to create mental structures.
The computational processes of creating tables, graphs, and mapping diagrams would afford the students an opportunity to develop an operational conception of function. The exploration of the function idea in a concrete context using tables, graphs, and mapping diagrams provides the students with a richer foundation for development of the variable concept. (p. 25)
Thomas (1975) examined the aspect of understanding of functions in students
from seventh and eighth grades, identifying five stages in the development of the concept
of function:
1. Finding images in mapping. Simple interpretations of arrow notation.
2. Identification of instances of mapping with finite domains.
3. Operational ability in finding images, pre-images, range, and domains where the mappings are given by some display of the set of ordered pairs.
4. Identification of noninstances of mappings with finite domains.
5. Composition of mappings and the translation from one representation of mapping to another. (Poppe, 1993, p. 21)
Markovits, Eylon, and Bruckheimer (1986) found that most students understood
that a function would have more than one representation. They stated that almost fifty
percent of their study population was able to identify two functions, one in algebraic form
and the other in graphical form, as being the same. In addition, several studies have been
done comparing the difference between the uses of two or more representations of
functions. Iannone (1975) compared tabular approach and mapping diagrams of
39

functions. Results show that the best way to represent the function concept is through the
use of mapping diagrams. Poppe (1993) conducted research in this specific area and
found that students were aware of the uses of tables, graphs, and mapping diagrams, and
tables were helpful in finding generalized patterns. On the other hand, students found
tables, graphs, and mapping diagrams helpful. In conclusion, the use of tables, graphs,
and mapping diagrams aided instruction. Students had the opportunity to see the same
information in different ways.
Results from Markovits et al. (1986) also show that difficulties arose when
students managed more than one representation of functions at the same time. They
pointed out, for example, that students changed domain and codomain of some functions.
Goldenberg (1988) affirms that confusion may occur trying to relate information
provided by two different representations. He suggests an appropriate transfer process
between the representations. Hart (1991) introduced the term compartmentalization
[italics added] when students do not relate several representations for the same function.
A lack of connections between two representations –graphical and algebraic– was found
in research conducted by Dreyfus and Eisenberg (1988). Ferrini-Mundy and Graham
(1991) found similar results when students managed algebraic and graphical contexts as
separate worlds. Recognizing troubles shown by students trying to relate representations
of the same function, Poppe (1993) affirmed that: “students needed more opportunity
working with the different representations” (p. 98).
Summary
40

The previous sections have described research studies and current trends on the
uses of multiple representations in mathematics teaching and learning. Preferences,
connections, among others, were also discussed. Theories of learning that support the use
of representations in mathematics were introduced and discussed. Further, research
studies dealing with how the available technologies have been used to promote
understanding through representations in mathematics were included in this chapter.
Finally, the importance of functions in the curricula and a view of their representations
were discussed.
The next chapter will present the methodology of this research project, including
participants, settings, and instruments used to obtain data. The procedures followed in
the instructional activities will also be described, as well as the statistical tests used to
answer the questions of this investigation.
41

CHAPTER 3
METHODOLOGY
The focus of this chapter is the design of the study, which consisted of two parts.
The first was to create instructional materials based on the use of spreadsheets supporting
multiple representations of linear functions. The second was to devise an experiment to
explore possible effects on student outcomes of using technology-based multiple
representations. This chapter discusses the setting of the study and the subjects involved.
It describes the instruments used and the data collection and analysis procedures. A
schedule of activities is also provided.
Setting of the Study
This study took place at Ponce Campus of the Inter American University of
Puerto Rico (IAU) during the fall semester of 2000. IAU is the largest private university
in Puerto Rico with nine campuses around the Island. The Ponce Campus is a four-year
college supporting undergraduate careers in education, business, computer, natural and
social sciences. Admission requirements include the College Entrance Examination
42

Board (CEEB), administered at their schools. These standardized tests are equivalent to
the SAT or ACT required at colleges and universities in the continental United States. Its
maximum score is 800 points in each of the following areas: mathematics, reasoning,
English, and Spanish languages. Students who score 500 or more points on this test are
placed in their first mathematics course, a mathematics-reasoning course. Students with
scores below 500, are placed in a basic skills mathematics course.
Among the college institutions of the area, the Ponce Campus of IAU has become
one of the leaders in the use of technology. The Internet is widely used in diverse
modalities, supporting distance learning courses and academic programs. The
technological facilities of the Campus include a large number of computers located
strategically in over five open laboratories, and at a Center of Information Access.
The Course Under Study
The mathematics course under study in this research was Mathematics Reasoning
(MRSG 1010), within the Department of Science and Technology. The course meets
three class hours per week and is offered every semester in several sections at various
times. MRSG 1010 is a core course and is part of the general education program of the
university. Since the course has a variety of instructors, a faculty member of a committee
coordinates the course and its activities so that there is a similarity between sections. The
course coordinator prepares a syllabus (See Appendix A), which the instructors can
review and modify it, without changing the course content.
Mathematics Reasoning is a prerequisite to successive courses in the field of
mathematics and science. Students whose have to take additional advanced courses in
43

mathematics, such as precalculus and calculus, should pass it with a minimum grade of C
(2.0 points in a 4.0 scale). Students registered in this course can have diverse
mathematical backgrounds and levels of understanding, due to mathematics achievement
location policy established by the university at the time of admission. Each instructor can
choose the use of technology in this course. Several instructors have required a
calculator as a course requirement.
Participants
Fifty-two college students registered in two sections of MRSG 1010 participated
in this study. As the result of random assignment, the morning section was selected as
the control group with twenty-three students, and the afternoon section was selected as
the experimental group, with twenty-nine students. Both sections met two times per
week, one hour and a half per day. The researcher was the instructor of both groups and
all the instruction was given in Spanish. The department chairman assigned the two
sections to the instructor based on availability.
Forty students were freshmen during the semester of the study. The remaining
students were sophomores or students transferred from other colleges. The majors of the
majority of the participants were computer science (19%), biology and related fields
(19%), and business (25%). For forty-eight students, it was their first time taking the
course; four students were repeating the course due to low grades or withdrawals during
previous attempts. Seventy-three (73%) percent of the participants came from public
schools, and the remaining came from private institutions or other colleges, all within
Puerto Rico.
44

Table 1
Frequencies and Percentages of Student’s Prior Grades in Mathematics
Control Group (N = 23)
Experimental Group (N = 29)
A B C D A B C D
522%
730%
939%
29%
414%
931%
1552%
13%
Note. A = 4.0; B = 3.0; C = 2.0, D = 1.0.
Students’ previous grades in mathematics, are summarized in Table 1 above. As
is noted in chapter four, even though the sample means for achievement favor the control
group, this difference was found to be not significant (p > .05).
Previous experiences of participants with the use of some kind of technology in
previous mathematics courses were also explored. Table 2 reports the frequencies and
percentages of students in, both the control and the experimental group. These data
represent the students’ responses (always, frequently, or occasionally) in terms of the use
of technology in their previous mathematics course. It is noticed that more than twice as
many students (proportionally) in the control group reported experiences with calculators.
Table 2
Frequencies and Percentages of Students’ Prior Experiences with Technology
Type of technology Control Group Experimental GroupN = 23 N = 29
Calculators (scientific or graphic) 17(74%)
11(38%)
Electronic mail 1(4%)
1(3%)
45

Internet 1(4%)
2(7%)
Spreadsheets 1(4%)
1(3%)
Other softwares (word processors, etc.) 3(13%)
4(14%)
Treatment Description
The length of treatment for both groups was approximately four consecutive
weeks of instruction at the beginning of the fall semester, 2000. The treatment for both
groups consisted of two parts. First, the administration of a pre and post achievement test
in linear functions, an attitudes scale toward mathematics and a profile. Second, were the
instructional activities developed in the course content for each group. The pre- and post-
administration of the test and the scale took almost one week; one or two class meetings
at the beginning and another one week at the end of the study.
The treatment for the control group was based on a traditional approach. This
approach primarily used lectures given by the instructor. The instruction paralleled the
topics included in the course syllabus and the only resource used was the textbook and
handouts prepared by the instructor. No calculators or computers were permitted to be
used by the control group. The students in this group, did however explore websites
related to the course content. All class meetings were held in an ordinary classroom.
The experimental group received a treatment aligned with the content topics using
spreadsheets emphasizing multiple representations as a tool to teach linear functions.
Topics included in the lessons were parallel to the course syllabus. A computer
laboratory with spreadsheet access was used for all class meetings for this experimental
46

group. Due to the class size in some class meetings, students at times, had to share
computers. No more than two students per computer were allowed. In all class meetings,
the instructor used a computer projector in order to model the topics and activities
introduced.
The Teaching Experiment
The mathematics topics covered in the instructional activities for both groups
were the following: (a) Cartesian coordinate system; (b) definition and graphic
representation of the linear equation, with sub-topics in linear equations with two
variables, solutions of linear equations with two variables, and graphs of linear equations;
(c) intercepts, slope and the equation of the straight line, with sub-topics on the slope as a
rate of change, relationship between the graph and the equation of the straight line. The
duration of each theme was approximately one week. Due to the nature of the
mathematical content included in each of the activities, some took more than a single day
to be completed.
The Teaching Experiment with the Control Group
As stated earlier, a traditional approach was the focus of the control group. The
strategies and/or resources used during the instructional activities were limited to
instructor lectures, textbook, handouts, some transparencies, and a Cartesian chalkboard.
Following is a description of the instructional activities developed day-by-day with the
control group, including the mathematical content topics, and the proposed objectives for
each lesson. No emphasis was made with the control group in how students moved from
multiple representations.
47

Preliminaries for the Day One of Instruction, Week 1
In this class meeting, students received an orientation on the uses and capabilities
of the search engines available through the Internet. The purpose of this activity was to
encourage students to seek at least five different web sites on the content topics included
in the syllabus. These web sites were organized by topics in order to create a database for
future reference.
Day One of Instruction, Week 2
The main topic introduced on this class was the Cartesian coordinate system. The
objectives of this lesson were to represent points from plane in a Cartesian coordinate
system and to locate ordered pairs in a Cartesian plane. Among the activities, students
recognized the two dimensions of a coordinate (x, y) and reviewed the concept of
quadrants.
Day Two of Instruction, Week 2
During this class, the topic taught was the definition and graphic representation of
the linear equation. Sub-topics included were linear equations with two variables and
solutions of linear equations with two variables. The objectives of the class were the
following: (a) to identify a linear equation with two variables, (b) to determine if a given
ordered pair is a solution for a linear equation with two variables, and (c) to determine if
a given point belongs to the graph of linear equation with two variables. At this point,
the form y = mx + b of the linear equation was introduced, where m is the slope of the
line and b is the y intercept.
Day Three of Instruction, Week 3
48

The topic presented was the graph of linear equations. The main technique used
was graph construction through a table of values. Students explored the selection of
arbitrary values to assign to the x variable, the evaluation of these values in the equation,
and the finding of the corresponding y value with different types of linear equations.
After this, they plotted and graphed the points in the Cartesian plane.
Day Four of Instruction, Week 3
At this point of the treatment, the main topics emphasized in the instructional
lesson were the intercepts, slope and the equation of the straight line. The focus of the
activities was to determine and to describe the intercepts as well as the slope of a straight
line. Students explored the line graphs with different slopes: positive, negative, zero and
indefinite. Also, students worked with intercepts on both axes and identified the forms of
an intercept: (x, 0) for the x-axes and (0, y) for the y-axes.
Day Five of Instruction, Week 4
The topic of this class was the slope of the rate of change and the relationship
between the graph and the equation of the line. In this lesson the formal definition of
slope was introduced: , and students calculated the slope given two points on
the graph. The objective of this activity was intended to interpret the slope as a rate of
change and to determine the equation of a straight line given its slope and intercept. In
addition, the formula for the general equation of the line was also
used.
The Teaching Experiment with the Experimental Group
49

The spreadsheets and multiple representation approach were applied to the
experimental group. This section will describe the instructional activities developed day
by day with the experimental group using spreadsheets. It will also include, the
mathematical content covered. The objectives of the instructional activities remained the
same as the control group. For each day of instruction, activity worksheets were
distributed to students and they got printouts of their spreadsheet work. Multiple
representations of linear functions were introduced during the class sessions one at a time
first, according to the course syllabus. Connections between representations were
established when students moved from one representation to the following one (Dufour-
Janvier, et al., 1987).
Preliminaries to the Day One of Instruction, Week 1
This class session was intended to demonstrate the capabilities of spreadsheets.
The purpose of this activity was centered in that students get expertise and knowledge
about the capabilities of the spreadsheets. The spreadsheet activity emphasized the use of
cells, management of basic data and evaluation of simple expressions. This activity took
one class period of instruction. The figure below shows an example of spreadsheets.
50

Figure 2. Spreadsheet screen showing the use of cells and evaluation of algebraic expressions.
Day One of Instruction, Week 2
The topic taught was the system of Cartesian coordinates. The spreadsheet
activity included the formation of the two components of an ordered pair using cells and
columns. Students plotted points on the Cartesian plane and identified the differences
when the points were moved from one quadrant to another. Finally, students offered a
verbal description of how the application might be applied to another field.
51

Figure 3. Spreadsheet activity about Cartesian plane and ordered pairs.
Day Two of Instruction, Week 2
The main topic discussed here was the definition and the graphic representation of
linear equations. The spreadsheet activity concerned the construction of tables of values.
Students determined the corresponding values using the software capabilities. The
participants realized the effects that may have the use of different values to construct the
table. Students connected the idea of the x and y values summarized in the tabular form
with the Cartesian coordinates located in the plane.
52

Figure 4. Spreadsheet activity dealing with table of values and linear graphs.
Day Three of Instruction, Week 3
The content topic covered in this activity was the graph of linear equations. The
spreadsheet was used here to construct different tables of values and then to construct the
corresponding graphs. Students observed the differences on the graphs when they
assumed different values. The following figure gives an example of a spreadsheet in this
activity. It was emphasized in this session about the increasing tendency observed in the
table of values and the position of the graph in the plane.
53

Figure 5. Spreadsheet use to teach tables of values of two linear equations and their graphs.
Day Four of Instruction, Week 3
The topic during this class was the slope and equation of the straight line. The
spreadsheet activity emphasized the concept of slope and linear graphs. Students
calculated the slope of a given linear equation and observed the differences in the graph
when values of m were changed; the effects of changing the values of m in the equation
y = mx + b. It was emphasized the four cases of slope: positive, negative, zero, and
undefined. Students described short stories about each possible slope in linear equations.
The instructor accentuated in this class the relationship between representations and how
these representations refer to the same concept.
54

Figure 6. Spreadsheet screen comparing two linear graphs with different slopes.
Day Five of Instruction, Week 4
This final class, the concept studied was the slope as a rate of change. The
spreadsheet activity focused on car prices and how them changed from year to year.
Students constructed the data table, indicating the year and the cost of a Mercedes, and
then found the value of change. Using the software capabilities, they constructed the
graph. This lesson about rate of change was designed by Burrill and Hopfensperger
(1998, p. 8) and permission was granted for its use. This class served to apply the
concept of linear functions and multiple representations to real life situations.
55

Figure 7. Learning activity supported with spreadsheets about slope as a rate of change.
Research Instruments
In this section, there is a description of the instruments used to collect the data for
the study. The research instruments were translated into Spanish by the researcher.
Students Profiles
In order to collect descriptive data about participants, a profile was administered
at the very beginning of the process. This profile was designed to determine student
information in the following areas: (a) current or proposed major; (b) year of study at the
time they were taking the course; (c) previous mathematics courses passed, where this
last course was taken and the grade earned; (d) first-time taking the course or repeat; and
(e) previous experience with technology. Sections of the profile were previously used in
56

a mathematics education research project conducted at the University of Illinois at
Urbana-Champaign and permission to use them was granted by the main investigator.
Scale of Attitudes Toward Mathematics
A scale was used for the purpose of measuring students’ attitudes toward
mathematics. This same scale was used in the research project mentioned above with
permission for its use. It was administered to the both groups at the beginning and at the
end of the study. The instrument has twenty-four items, but five items were used to
explore attitudes or feelings toward mathematics (Items 10, 14, 16, 17, 23). The first
three items of the scale were used to explore attitudes toward technology itself and its
uses. For the first two items of the scale (1 and 2), the categories used included: never,
almost never, seldom, frequently, and almost always. In the remaining items, the
categories were: strongly disagree, disagree, neutral, agree, and strongly agree. Numbers
from 1 to 5 were assigned to each of these categories, where number 5 indicated a
positive attitude. In some cases, due to negative wording of an item, the scoring was
reversed.
Achievement Test in Linear Equations
An achievement test in linear equations was given to explore students’ mastery of
this topic of mathematics. It was administered to both groups as pre-test and post-test.
The instrument consisted of twenty-five items where the different representations of a
linear equation were included. Some items on the test came from the Test of Graphing in
Science (TOGS) (McKenzie & Padilla, 1986) and the achievement tests samples from the
Second International Mathematics Study (SIMS) (International Association for the
57

Evaluation of Educational Achievement, 1995). Permission to use was granted. The
items included in the test were grouped in the following theme areas discussed in class
instruction: Cartesian coordinates, linear equations and their graphs, and slope. The test
included multiple choice items as well as open questions.
In the experimental group, the pre-test was answered without the use of spreadsheets. In
the post-test administration, it was permitted.
Three regular instructors (Instructor A, Instructor B, and Instructor C) of MRSG
1010 at Ponce campus of IAU evaluated the achievement test in linear functions used in
this study. They considered as appropriate the relationship between the number of items
included in the test and the content topics taught in the course. Nevertheless, Instructor A
observed that the numbers of items by content area are too many. He said:
The emphasis on linear equation in the course under study is not extensive. The focus of the course is mainly the algebraic aspect. A large number of applications are not emphasized throughout the course.
All instructors classified some of the items as easy and difficult for the students, based in
their experience teaching the course frequently. Table 3 reports their comments about the
test items.
Table 3
Classification of Achievement Test Items Based on the Instructors’ Responses
Instructors Easy Items Difficult Items
Instructor A 1, 2, 3, 4, 5, 8, 9, 10, 11,12, 23, 24, 25
6, 7, 13, 14, 15, 16, 17,18, 19, 20, 21, 22
Instructor B 1, 2, 3, 5, 8, 9, 10, 12, 14,20, 23, 24, 25
4, 6, 7, 11, 13, 15, 16, 17,18, 19, 21, 22
58

(table continues)Table 3 (continued)
Instructors Easy Items Difficult Items
Instructor C 1, 2, 3, 5, 9, 12, 15, 16, 17,18, 19, 20, 22
4, 6, 7, 8, 10, 11, 13, 1421, 23, 24, 25
Statistical Analysis
This section of the chapter describes the statistical analyses done in the study in
order to answer the research questions. The SPSS statistical software system was used
for all analyses in this project. These questions suggested the following analyses:
1. A paired samples t-test and an independent samples t-test on the achievement in linear equations test responses of the control and experimental groups comparing their performance in the pre and post examinations and the effectiveness of the treatment. Using factor analysis, clusters of mathematical topics were identified in order to determine student performance in particular areas of instruction. Two clusters on the achievement test in linear functions were found. First, on content topics: Cartesian coordinates system, graphs, and slope. Second, on the different representations of linear functions: graphical, verbal, tabular, and symbolic.
2. An independent samples t-test was used to compare prior group (control and experimental) achievement in mathematics.
3. A paired samples t-test and an independent samples t-test on the attitudes toward mathematics responses of the control and experimental groups comparing their performance in the pre and post examinations. The following items clusters were used in the analysis: opinion toward mathematics, use of technology, utility of mathematics, and study skills in mathematics.
4. Two way analysis of variance (ANOVA) was used to determine the significance between effects (control-experimental groups and pre-post administrations) and achievement gain in content topics and multiple representations of linear functions.
Summary
59

This chapter has included the discussion of the methodology and the procedures
followed in this research study. The instructional activities used with control and
experimental groups were discussed and samples about how spreadsheets were handled
were also included. The research instruments that served to collect the data from this
study were described. Finally, the statistical analyses conducted in order to answer the
research questions were discussed.
The next chapter will include the results of this research. It will discuss how
participants from control and experimental groups performed in achievement on linear
equations with and without the use of spreadsheets and their changes in attitudes toward
mathematics.
60
CHAPTER 4
RESULTS
The goal of this study was to create mathematics lessons based on the use of
spreadsheets emphasizing multiple representations of linear functions. It also aimed to
explore possible effects of instructional uses of multiple representations on students’
outcomes (attitudes and achievement).
This chapter presents the findings of this study. The results are described in the
following sections: Prior achievement in mathematics based on grades; Attitudes toward
mathematics; and Achievement in mathematics (linear functions).
Prior Achievement in Mathematics Based on Grades
These data were obtained through the students’ profiles administered to the
control and experimental groups at the beginning of the study. In order to compare the
performance in mathematics between the groups under study, an independent samples t-
Test was carried out. Table 4 reports the results.
Table 4
Prior Mathematics of Control and Experimental Groups
Variable Group M* N SD t df P
Prior Achievement Control 2.65 23 0.93 0.42 50 0.68(Based on
61

Reported Grades) Experimental 2.55 29 0.78Note. *Higher mean, better prior achievement in mathematics.
Although a comparison of sample means on prior achievement reveals a slight
difference in favor of the control group, the resulting t statistic is not significant (p > .05).
Hence, it may be concluded that at the beginning of the project, the experimental and the
control groups were comparable in prior mathematics achievement, based on reported
grades.
Attitudes Toward Mathematics
The attitudes toward mathematics that control and experimental groups exhibited
at the beginning and end of the study were also explored. The items were divided into
the two clusters: students’ opinion or feelings about mathematics (5 items) and attitudes
toward technology (1 item) and its use (2 items). For these items, the following four
statistical comparisons among the groups were made: pre-control vs. pre-experimental;
post-control vs. post-experimental; pre-post control; and pre-post experimental.
Students’ Opinions Toward Mathematics
Table 5 and Table 6 show the results of the first and second comparison described
above, respectively.
Table 5
Pre-Control and Pre-Experimental Groups’ Attitudes Toward Mathematics
Variable Group M* N SD t df P
Attitudes Toward Control 17.35 23 2.87 1.06 50 .293Mathematics
Experimental 16.28 29 4.10Note. * Higher mean, positive attitudes toward mathematics.
62

In Table 5, a t-test reveals that the difference between the groups in attitudes
toward mathematics was not significant (p > .05) at the beginning of the study.
The second comparison on attitudes toward mathematics carried out in this study
was the post-control vs. post-experimental. Table 6 reports the results of this analysis.
Table 6
Post-Control and Post-Experimental Groups’ Attitudes Toward Mathematics
Variable Group M* N SD t df P
Attitudes Toward Control 16.70 23 3.23 .006 50 .995Mathematics
Experimental 16.69 29 3.73Note. * Higher mean, positive attitudes toward mathematics.
The comparison on attitudes toward mathematics between control and
experimental groups at the end of the study indicates no significant difference (p > .05).
In order to compare means between pre and post administration of the attitudes
scale toward mathematics in control and experimental groups, the statistic analysis
carried out was a paired samples t-test. Tables 7 and 8 summarize the results of the
comparison between pre and post administration of the attitudes scale toward
mathematics in the control and experimental groups, respectively.
Table 7
Pre and Post Attitudes Toward Mathematics: Control Group
Variable Group M* N SD t df P
Attitudes Toward Pre-Control 17.35 23 2.87 .95 22 .353Mathematics
Post-Control 16.70 23 3.23
63

Note. * Higher mean, positive attitudes toward mathematics.
A t statistic reveals that this difference is not significant (p > .05)
Table 8 below reports the comparison between pre and post administration on
attitudes toward mathematics in the experimental group.
Table 8
Pre and Post Attitudes Toward Mathematics: Experimental Group
Variable Group M* N SD t df P
Attitudes Toward Pre-Experimental 16.28 29 4.10 -.652 28 .520Mathematics
Post-Experimental 16.69 29 3.73Note. * Higher mean, positive attitudes toward mathematics.
Similarly, for these comparisons, no significant difference (p > .05) was found
between the groups in attitudes toward mathematics.
The following table summarizes the distribution of frequencies and percentages
on students’ responses on the five items dealing with attitudes or feelings toward
mathematics
Table 9
Distribution of Frequencies and Percentages on Students’ Responses on the Five Items Dealing with Attitudes Toward Mathematics
Item Group* N SD** D** N** A** SA**
10. It scares me to have to take mathematics
Pre-C
Post-C
23
23
2(8.7)
5
9(39.1)
7
11(47.8)
9
1(4.3)
1
0(0.0)
1
64

Pre-E
Post-E
29
29
(21.7)
7(24.1)
4(13.8)
(30.4)
4(13.8)
9(31.0)
(39.1)
9(31.0)
14(48.2)
(4.3)
7(24.1)
1(3.4)
(4.3)
2(6.9)
1(3.4)
14. I am looking forward to taking more mathematics.
Pre-C 23 0(0.0)
4(17.4)
12(52.2)
6(26.1)
1(4.3)
(table continues)Table 9 (continued)
Item Group* N SD** D** N** A** SA**
14. I am looking forward to taking more mathematics.
Post-C
Pre-E
Post-E
23
29
29
2(8.7)
3(10.3)
2(6.9)
4(17.4)
3(10.3)
5(17.2)
8(34.8)
14(48.3)
10(34.5)
9(39.1)
7(24.1)
11(37.9)
0(0.0)
2(6.9)
1(3.4)
16. No matter how hard I try, I still do not do well in mathematics.
Pre-C
Post-C
Pre-E
Post-E
23
23
29
29
9(39.1)
5(21.7)
7(24.1)
2(6.9)
8(34.8)
9(39.1)
10(34.5)
11(37.9)
3(13.0)
6(26.1)
5(17.2)
12(41.4)
2(8.7)
3(13.0)
6(20.7)
2(6.9)
1(4.3)
0(0.0)
1(3.4)
2(6.9)
17. Mathematics is harder for me than for most persons.
Pre-C
Post-C
Pre-E
23
23
29
5(21.7)
4(17.4)
3
11(47.8)
7(30.4)
9
5(21.7)
8(34.8)
8
1(4.3)
4(17.4)
5
1(4.3)
0(0.0)
4
65
Post-E 29
(10.3)
3(10.3)
(31.0)
8(27.6)
(27.6)
12(41.4)
(17.2)
5(17.2)
(13.8)
1(3.4)
23. If I had my choice, this would be my last mathematics course.
Pre-C
Post-C
23
23
4(17.4)
2(8.7)
8(34.8)
7(30.4)
5(21.7)
4(17.4)
5(21.7)
8(34.8)
1(4.3)
2(8.7)
(table continues)
Table 9 (continued)
Item Group* N SD** D** N** A** SA**
23. If I had my choice, this would be my last mathematics course.
Pre-E
Post-E
29
29
3(10.3)
5(17.2)
11(37.9)
8(27.6)
9(31.0)
5(17.2)
2(6.9)
6(20.7)
4(13.8)
5(17.2)
Note. *Groups: Pre-C = Pre-Control, Post-C = Post-Control, Pre-E = Pre-Experimental, Post-E = Post-Experimental. **SD = Strongly disagree, D = Disagree, N = Neutral, A = Agree, SA = Strongly Agree.
Students’ Attitudes Toward Uses of Technology
It was also important to this study to explore the differences between groups in
the different areas into which the attitudes scale items were divided: use of technology (2
items) and attitudes toward technology (1 item). Table 10 reports the frequencies and the
percentages on students’ responses on scale items 1 and 2 dealing with use of technology,
particularly in the use of calculators in their last two years of high school.
Table 10
Distribution of Frequencies and Percentages on Students’ Responses on Scale Items 1 and 2 Dealing with Technology
Item Group* N N** AN** S** F** AA**
66

In the mathematics classes I took in the last two years of high school, I used a calculator to perform routine calculations.
Pre-C
Pre-E
23
29
4(17.4)
7(24.1)
6(26.1)
6(20.7)
7(30.4)
12(41.4)
4(17.4)
2(6.9)
2(8.7)
2(6.9)
In the mathematics classes I took in the last two years of high school, I used a graphing calculator to graph functions.
Pre-C
Pre-E
23
29
13(56.5)
23(79.3)
4(17.4)
2(6.9)
3(13.0)
2(6.9)
1(4.3)
2(6.9)
2(8.7)
0(0.0)
Note. *Groups: Pre-C = Pre-Control, Post-C = Post-Control, Pre-E = Pre-Experimental, Post-E = Post-Experimental.**N = Never, AN = Almost Never, S = Seldom, F = Frequently, AA = Almost Always.
Table 11 contains the descriptive data about the two items of the attitudes scale
dealing with uses of technology. It compares the students’ reported use of technology in
the control and experimental groups.
Table 11
Students’ Use of Calculators: Summary Statistics
Statistic Groups Item 1 Item 2
NMMdnSDR*Q**
Pre-Control 232.743.001.214.002.00
231.911.001.314.002.00
NMMdnSDR*Q**
Pre-Experimental 292.523.001.154.001.50
291.411.000.913.000.00
Note. *Range = higher score – lowest score; **Interquartile range.
Table 12 reports the t-test comparison between the control and experimental
groups on the two items of the scale dealing with uses of technology.
67

Table 12
Pre-Control and Pre-Experimental Groups’ Uses of Technology
Variable Group M* N SD t df P
Uses of Pre-Control 4.65 23 2.17 1.37 50 .176Technology
Pre-Experimental 3.93 29 1.62Note. * Higher mean, positive attitudes toward mathematics.
Table 12 reveals that differences in reported usage of calculators in high school
were not significant (p > .05).
Students’ Attitudes Toward Technology
The item number 3 from the scale explored the students’ attitudes toward
technology. Table 13 presents the distribution of frequencies and percentages on
students’ responses on item 3 from the attitudes scale toward mathematics dealing with
technology.
Table 13
Distribution of Frequencies and Percentages on Students’ Responses on Scale Item 3 Dealing with Technology
Item Group* N SD** D** N** A** SA**
In order for me to learn mathematics, using a calculator or computer is helpful.
Pre-C
Post-C
Pre-E
Post-E
23
23
29
29
0(0.00)
2(8.7)
3(10.3)
1(3.4)
2(8.7)
1(4.3)
3(10.3)
0(0.0)
10(43.5
)
10(43.5
)
13(44.8
)
8(34.8)
3(13.0)
3(10.3)
13(44.8)
3(13.0)
7(30.4)
7(24.1)
7(24.1)
68

8(27.6
)Note. *Groups: Pre-C = Pre-Control, Post-C = Post-Control, Pre-E = Pre-Experimental, Post-E = Post-Experimental. **SD = Strongly Disagree, D = Disagree, N = Neutral, A = Agree, SA = Strongly Agree.
However, since there is only one item in this category, there are questions as to
the reliability of this measure. Therefore, box plots were used to describe graphically
student performance on this item dealing with attitudes toward technology. It can be
noted that the median responses on this item remained at 3.0 for the control group, but
rose from 3.0 to 4.0 for the experimental group.
Figure 8 presents box plots showing the distribution of scores for the control
group (pre and post) and for the experimental group (pre and post) on the item of the
scale dealing with technology. It compares the changes in attitudes in both groups.
groups
pre_control
post_control
pre_experimental
post_experimental
S03
6543210
92
715051
Figure 8. Box plots showing distribution of student attitudes toward technology.
69

Summary
This section of the chapter presented the findings on attitudes toward
mathematics, divided into two major areas explored in this study: opinion or feelings
toward mathematics, technology and its uses. The statistical analysis revealed no
significant differences (p > .05) on the attitudes measures between the control group and
the experimental group. In the experimental group, it appears, the distribution of scores
(using box plots and tables above) that the attitudes exhibited toward the use of
technology increased somewhat and the end of the treatment. It suggests that students in
the experimental group felt more confident in the use of computers as an invaluable tool
in their mathematics class.
Achievement in Mathematics
Achievement in mathematics, particularly on linear functions, was also studied.
In order to obtain these data, a test with twenty-five items was administered to both
groups at the beginning and end of the study. The items of this test were divided in two
different clusters. Cluster A includes the items dealing with content topics taught during
the treatment: Cartesian coordinates (5 items), graphs (7 items), and slope (13 items).
Cluster B includes the items of the test dealing with multiple representations of the linear
functions: symbolic (3 items), graphical (10 items), tabular (3 items), and verbal (9 items)
representations. The following four statistical comparisons between the groups were
made: pre-control vs. pre-experimental; post-control vs. post-experimental; pre-post
control; and pre-post experimental. In order to examine possible interactions effects
between occasions (pre and post tests) and conditions (control vs. experimental groups),
70

two-way analysis of variance (ANOVA) was also carried out. Only significant
interactions are reported. Tables 14 and 15 show the results of the first and second
comparisons, respectively.
Table 14
Pre-Control and Pre-Experimental Groups’ Mathematics Achievement (Linear Functions)
Variable Group M* N SD t df P
Achievement in Control 8.70 23 3.40 4.42 50 .000Mathematics(Linear functions) Experimental 4.31 29 3.67Note. *Higher mean, better achievement.
Table 14 suggests a higher achievement in mathematics in favor of the control
group at the beginning of the study. The difference between means of the control and
experimental groups was about 4 points. That is, the mean of the control group is almost
twice the mean of the experimental group. The resulting t statistic reveals that this
difference in achievement in linear functions between groups was significant (p < .05).
The second comparison on achievement in mathematics carried out in this study
was the post-control vs. post-experimental. Table 15 reports the results of this analysis.
Table 15
Post-Control and Post-Experimental Groups’ Mathematics Achievement (Linear Functions)
Variable Group M* N SD t df P
Achievement in Control 9.70 23 5.03 -.17 50 .864Mathematics(Linear functions) Experimental 9.93 29 4.78Note. *Higher mean, better achievement.
71

Interestingly, the comparison on achievement between the control and the
experimental groups at the end of the study was not significant (p > .05).
Tables 16 and 17 summarize the results of the comparison between pre-post
administration of the test in the control and experimental groups, respectively.
Table 16
Pre and Post Mathematics Achievement (Linear Functions): Control Group
Variable Group M* N SD t df P
Achievement in Pre-Control 8.70 23 3.40 -1.16 22 .258Mathematics(Linear functions) Post-Control 9.70 23 5.03Note. Higher mean, better achievement.
The t-test shows that the difference in the means of the achievement in
mathematics on the control group was not significant (p > .05)
Table 17
Pre and Post Mathematics Achievement (Linear Functions): Experimental Group
Variable Group M* N SD t df P
Achievement in Pre-Experimental 4.31 29 3.67 -6.70 28 .000Mathematics(Linear functions) Post-Experimental 9.93 29 4.78Note. *Higher mean, better achievement.
Table 17 above, reports the comparison between pre and post administration on
achievement in mathematics in the experimental group.
It is observed in this analysis that in the post-test in achievement in mathematics,
particularly in linear functions, the mean of the experimental group had a dramatic
increase. According to the t statistic, this difference in almost 6 points is significant (p
72

< .05). In contrast to the control group, where achievement in mathematics increased
slightly, the experimental group showed a considerable improvement in achievement in
linear functions.
This trend in the data (apparent dramatically different changes in means for the
control and experimental groups from the pre to the post test) was ‘unpacked’ in later
analyses using two-way ANOVA (See Appendix F). The first sub-investigation deals
with the clusters of items on the achievement test by content areas (Cluster A). The
second sub-investigation deals with multiple representations of linear functions (Cluster
B). The analyses carried out through the independent samples t-test and the paired
samples t-test to both clusters revealed that there were significant differences (p < .05) in
some areas. Also, using ANOVA, it was found that there were significant interactions (p
< .05) between occasions and conditions for certain of the clusters. The following
sections include a discussion of these areas.
Cluster A: Content Topics
Slope
Slope constitutes another important concept in the study of linear functions. The
same four comparisons between groups, described above, were carried out in this section
of cluster A. Significant difference (p < .05) was found in only two comparisons: pre-
control vs. pre-experimental and pre-post experimental. Tables 18 and 19 show the
results of these analyses.
Table 18
Pre-Control and Pre-Experimental Groups’ Achievement in Linear Functions (Slope)
73

Variable Group M* N SD t df P
Achievement in Pre-Control 5.00 23 2.30 3.79 50 .000Mathematics(Slope) Pre-Experimental 2.43 29 2.50Note. *Higher mean, better achievement.
It is observed that at the beginning of the study, the control group exhibited a
better achievement on slope. The considerable difference on means between groups was
about 2.55 points. The resulting t statistic indicates that this difference was significant
(p < .05).
Table 19 reports the findings on the pre-post comparison in the experimental
group.
Table 19
Pre and Post Experimental Group’s Achievement in Linear Functions (Slope)
Variable Group M* N SD t df P
Achievement in Pre-Experimental 2.45 29 2.50 -4.65 28 .000Mathematics(Slope) Post-Experimental 4.83 29 3.31Note. *Higher mean, better achievement.
This result suggests that experimental group had an improvement in achievement
in mathematics, particularly in the concept of slope. The t statistic indicates that this
difference between pre-post administrations was significant (p < .05). Although this
same comparison in the control group was not statistically significant, there was a
reduction on means between pre and post. That is, the mean declined from 5.00 at the
beginning of the study to 4.61 at the end of the treatment, a difference about .39 points.
74

Meanwhile, in the reported comparison on the experimental group, the difference
between means reached approximately 2.38 points.
Table 20 reports the results of the ANOVA analysis carried out in achievement in
mathematics, particularly in the topic of slope, across the control-experimental groups
and the pre-post administrations.
Table 20
Two Way ANOVA on Achievement in Linear Functions: Slope
Source SS df MS F PPre-Post 25.35 1 25.35 3.17 .078
Control-Experimental 34.90 1 34.90 4.36 .039
Interaction 49.23 1 49.23 6.15 .015
It is observed in Table 20 a significant effects (p < .05) in the control vs.
experimental groups and in the interaction between factors. These data confirm the
significant (p < .05) gain in achievement in slope that the experimental group had and the
slight reduction in achievement that control group exhibited at the end of the study. A
graph of the interaction between factors showing achievement gain on slope appears in
Figure 9.
75

Figure 9. Significant (p < .05) interaction in achievement in linear functions: Occasion X Conditions (Content area: Slope).
Item 20:
Three hours after starting, car A is how many kilometers ahead of car B?
Figure 10. Sample test item dealing with slope.
Figure 10 above shows a sample item from the achievement test on linear
functions dealing with slope.
Cartesian Coordinates
The differences between means on both groups on Cartesian coordinates and
related fields, a key content topic when linear functions are taught, were explored. Table
21 reports the data in the comparison between pre-control vs. pre-experimental on items
dealing with this topic.
76

Table 21
Pre-Control and Pre-Experimental Groups’ Achievement in Linear Functions (Cartesian Coordinates)
Variable Group M* N SD t df P
Achievement in Pre-Control 1.91 23 1.28 2.15 50 .036Mathematics(Cartesian Coordinates)
Pre-Experimental 1.17 29 1.20
Note. *Higher mean, better achievement.
Table 21 reports a difference of means, of .74 points in favor to the control groups
on the topic of Cartesian coordinates at the beginning of the treatment. The resulting t
statistic points out that this difference was significant (p < .05). It may be concluded that
before the treatment, control group exhibited a better performance in Cartesian
coordinates and related topics such as: Cartesian plane, quadrants, and axes intercepts.
Another comparison carried out in this cluster was between pre and post
administration in the control group. Table 22 summarizes the output found of this statistic
test.
Table 22
Pre and Post Control Group’s Achievement in Linear Functions (Cartesian Coordinates)
Variable Group M* N SD t df P
Achievement in Pre-Control 1.91 23 1.28 -4.97 22 .000Mathematics(Cartesian Coordinates)
Post-Control 3.22 23 1.31
Note. *Higher mean, better achievement.
77

It is observed in Table 22 an increase on the means of the control group from the
pre-test to the post-test. The difference between administrations was about 1.30 points.
The resulting t statistic indicates that this difference was significant (p < .05).
In the same way, a similar comparison was carried out on the experimental group.
Table 23 reports the results.
Table 23
Pre and Post Experimental Group’s Achievement in Linear Functions (Cartesian Coordinates)
Variable Group M* N SD t df P
Achievement in Pre-Experimental 1.17 29 1.20 -8.29 28 .000Mathematics(Cartesian Coordinates)
Post-Experimental 3.41 29 1.24
Note. *Higher mean, better achievement.
This comparison shows an increase in the means on achievement in linear
functions between administrations in the experimental group. The difference between
means was approximately 2.24 points. The resulting t statistic reveals that this difference
is also significant (p < .05).
Although, in these two previous comparisons, a significant difference (p < .05)
between means was found in pre-test and post-test in both groups, it is also observed that
the higher difference between means corresponds to the experimental group. It may be
concluded that in both groups there was an improvement in linear functions, particularly
in the topic of Cartesian coordinates, but in the experimental group, this improvement
was higher.
78
Figure 11 below shows sample items from the achievement test of linear functions
dealing with Cartesian coordinates.
Item 1:
The coordinates of point C are: _________
Item 2:
In what quadrant is located point A? _________
Figure 11. Sample test items dealing with Cartesian coordinates.
Graphs
The topic corresponding to graphs constitutes another important area in the
teaching and learning of linear functions. In this section of cluster A, the same statistical
comparisons between groups were carried out. This analysis indicated a significant
difference in only two comparisons was found. Tables 24 and 25 report the results on the
pre-control vs. pre-experimental and pre-post experimental comparisons, respectively.
Table 24
Pre-Control and Pre-Experimental Groups’ Achievement in Linear Functions (Graphs)
Variable Group M* N SD t df P
Achievement in Pre-Control 1.78 23 1.31 3.51 50 .001Mathematics(Graphs) Pre-Experimental .69 29 .93Note. *Higher mean, better achievement.
79

This comparison suggests a better achievement in graphs in favor of the control
group at the beginning of the study. The resulting t statistic reveals that this difference
was significant (p < .05).
Table 25
Pre and Post Experimental Group’s Achievement in Linear Functions (Graphs)
Variable Group M* N SD t df P
Achievement in Pre-Experimental .69 29 .93 -3.04 28 .005Mathematics(Graphs) Post-Experimental 1.69 29 1.47Note. *Higher mean, better achievement.
The paired samples t-test between pre and post experimental was the other
comparison where significant difference of means was found. Table 25 above, reports
the results of this test.
This comparison illustrates an improvement in achievement in graphs in the
experimental group from the pre-test to the post-test. The t-statistic indicates that this
difference of means was significant (p < .05). These data suggest that at the end of the
treatment, students in the experimental group performed better on the topic of linear
graphs. The difference between means for the control group was not significant (p > .05).
Figure 12 below presents a sample item from the achievement test dealing with
the topic of graphs.
80

Item 14:
The graph shows the distance traveled by a tractor during a period of four hours. How fast is the tractor moving?
Figure 12. Sample test item dealing with graphs.
Cluster B: Multiple Representations of Linear Functions
Achievement on linear functions was explored through their four common
representations: symbolic, graphical, tabular, and verbal forms. These four comparisons
between groups were carried out in each one of these representations through
independent samples t-tests, paired-samples t-tests, and ANOVA. It is important to
remember that, as part of the treatment of the study, multiple representations were
strongly emphasized in the experimental group. In the control group, representations
were just mentioned.
Symbolic Representation
The equation, classified as formula or symbolic representation, is one of the most
widely used representations in mathematics. In this category, a statistically significant
(p < .05) difference between achievement means was found only in the comparison pre-
post in the experimental group. Table 26 reports these results.
Table 26
81

Pre and Post Experimental Group’s Achievement in Linear Functions (Symbolic Representation)
Variable Group M* N SD t df P
Achievement in Pre-Experimental .21 29 .41 -2.78 28 .010Mathematics(Symbolic Representation)
Post-Experimental .66 29 .90
Note. *Higher mean, better achievement.
Table 26 suggests an improvement in achievement of linear function through the
symbolic representation. The difference between means calculated was .45 points. The t
statistic indicates that this difference was significant (p < .05). The experimental group
exhibited a gain in achievement in linear functions through the use of symbolic
representations while the control group did not. Interaction was not significant (p > .05).
Figure 13 presents a sample item from the achievement test on linear functions
dealing with symbolic representation.
The table below compares the height from which a ball is dropped (d) and the height to which it bounces (b)
d 50 80 100 150b 25 40 50 75
Item 7:
Which equation describes this relationship?
Figure 13. Sample test item dealing with symbolic representation.
Graphical Representation
Graphics constitute the representation used more often in many textbooks. Today
technology, particularly computers and calculators, has been incorporated into the
82

curriculum to reinforce this representation. The achievement in linear functions through
the use of this representation was explored in this study. Table 27 includes the results of
the statistical tests carried out on this representation.
Table 27
Pre-Control and Pre-Experimental Groups’ Achievement in Linear Functions (Graphical Representation)
Variable Group M* N SD t df P
Achievement in Pre-Control 3.13 23 1.79 3.17 50 .003Mathematics(Graphical Representation)
Pre-Experimental 1.69 29 1.49
Note. *Higher mean, better achievement.
Table 27 indicates a better achievement of linear functions through graphic
representation in favor of the control group at the beginning of the study. The difference
between means was 1.44 points. The resulting t statistic indicates that this difference was
significant (p < .05).
Table 28
Pre and Post Control Group’s Achievement in Linear Functions (Graphical Representation)
Variable Group M* N SD t df P
Achievement in Pre-Control 3.13 23 1.79 -3.70 22 .001Mathematics (Graphical Representation)
Post-Control 4.52 23 1.90
Note. *Higher mean, better achievement.
Table 28 above shows the results on the comparison between pre-post in the
control group on the items dealing with graphical representation of linear functions.
83

This change reveals an improvement in achievement in linear functions through
graphical representation in the control group. This difference was 1.39 points and the
resulting t statistic indicates that it was significant (p < .05). It is important to point out
that since this representation is the most shown in the textbook used in the study (Angel,
2000), and although the control group did not receive as intensive a treatment of
representations as did the experimental group, the results show that there was an
improvement in this area.
Table 29
Pre and Post Experimental Group’s Achievement in Linear Functions (Graphical Representation)
Variable Group M* N SD t df P
Achievement in Pre-Experimental 1.69 29 1.49 -7.28 28 .000Mathematics(Graphical Representation)
Post-Experimental 4.69 29 1.79
Note. *Higher mean, better achievement.
Table 29 above reports the results on achievement through graphical
representation in the pre-post administration in the experimental group.
These data indicate a considerable improvement in achievement in linear
functions through graphical representation in the experimental group. The difference
between means was 3.00 points, and the t statistic indicates that it was significant (p
< .05). Although in this same comparison with the control group, there was also an
improvement in achievement, the difference between means reported in this data shows
that in the experimental group the difference was greater than in the control.
84
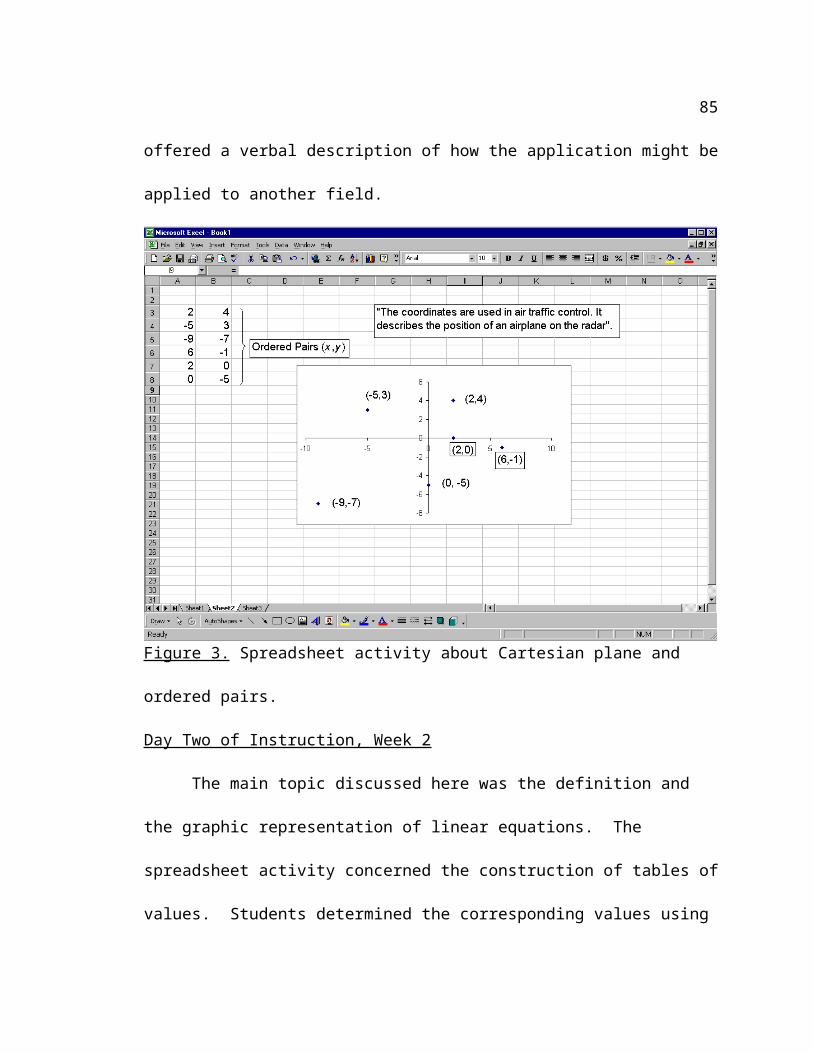
Table 30 reports the results of a two-way ANOVA between the pre and post
administration of the achievement test and the control and experimental groups.
Table 30
Two Way ANOVA on Achievement in Linear Functions: Graphical Representation
Source SS df MS F PPre-Post 123.67 1 123.67 40.85 .000
Control-Experimental 10.39 1 10.39 3.43 .067
Interaction 16.60 1 16.60 5.48 .021
Table 30 suggests significant effects (p < .05) in the pre-post administration of the
test. Also, significant effects (p < .05) are observed in the interaction between the pre-
control examinations and the control and experimental groups. That is, even though both
groups improved, there is a difference in the rate of improvement in the experimental
group.
Figure 14. Significant (p < .05) interaction in achievement in linear functions: Occasions X Conditions (Graphical representation).
Figure 14 above shows the graph of the interactions of these two factors and the
achievement gain in graphical representations of linear functions.
85

Figure 15 presents a sample item from the achievement test on linear functions
dealing with graphical representation.
Item 23:
Lisa jogs 2 miles everyday. One day after running, she measures her pulse every two minutes. These are her results. Her pulse rate was 140 beats per minute 2 minutes after running. It was 115 beats per minute after 4 minutes. It was 105 beats per minute after 6 minutes. It was 90 beats per minute after 8 minutes. It was 75 beats per minute after 10 minutes. Which of these graphs best shows her results?
Figure 15. Sample test item dealing with graphical representation.
Tabular Representation
Data summarized in tables is another form to represent linear trends. The
statistical analysis carried out in this section, reveals that significant difference on means
was found in the following comparisons: pre-control vs. pre-experimental, and pre-post
experimental. Tables 31 and 32 summarize the results of these two comparisons,
respectively.
Table 31
86

Pre-Control and Pre-Experimental Groups’ Achievement in Linear Functions (Tabular Representation)
Variable Group M* N SD t df P
Achievement in Pre-Control 1.09 23 .95 3.17 50 .003Mathematics(Tabular Representation)
Pre-Experimental .41 29 .57
Note. *Higher mean, better achievement.
These results suggest a better achievement in linear function through tabular
representation in favor of the control group. The t statistic indicates that the difference
between means was significant (p < .05)
Table 32
Pre and Post Experimental Group’s Achievement in Linear Functions (Tabular Representation)
Variable Group M* N SD t df P
Achievement in Pre-Experimental .41 29 .57 -3.62 28 .001Mathematics(Tabular Representation)
Post-Experimental 1.07 29 .88
Note. *Higher mean, better achievement.
Table 32 shows an improvement in achievement in linear equations through
tabular representation in the experimental group. The difference on means of .66 points
was significant according to the t statistic (p < .05). For the control group, the difference
in means was not significant (p > .05). Interaction was not significant (p > .05).
Figure 16 shows a sample item from the achievement test dealing with tabular
representation of linear functions.
Item 24:
John left his flashlight burn for 14 straight hours. He measured the amount of light
87

given off (in lumens) at various times. He collected this data. Which graph best shows his results?
Time(hours)
Light given off(lumens)
0 9.52 8.53 8.55 6.08 4.214 0.6
Figure 16. Sample test item dealing with tabular representation.
Verbal Representation
Verbal representations (such as telling a story) are not often found in college level
mathematics textbooks (Angel, 2000). The achievement of linear functions through
88

verbal representation was explored in this study. The same statistical comparisons were
made in this section and the following resulted in significant difference between means:
pre-control vs. pre-experimental, and pre-post experimental. Table 33 and 34 reports the
findings of these two comparisons, respectively.
Table 33
Pre-Control and Pre-Experimental Groups’ Achievement in Linear Functions (Verbal Representation)
Variable Group M* N SD t df P
Achievement in Pre-Control 4.09 23 1.65 3.74 50 .000Mathematics(Verbal Representation)
Pre-Experimental 2.00 29 2.24
Note. *Higher mean, better achievement.
These results reveal a better achievement in linear functions through verbal
representations in favor of the control group. The difference on means of 2.09 was
significant (p < .05).
Table 34
Pre and Post Experimental Group’s Achievement in Linear Functions (Verbal Representation)
Variable Group M* N SD t df P
Achievement in Pre-Experimental 2.00 29 2.24 -3.34 28 .002Mathematics(Verbal Representation)
Post-Experimental 3.52 29 2.61
Note. *Higher mean, better achievement.
89

Table 34 indicates that at the end of the study there was a gain in achievement in
linear functions through verbal representation in the experimental group. The difference
on means was 1.52 points and the t statistic reveals that it was significant (p < .05).
Table 35 reports the output from the two way ANOVA carried out in the
achievement in linear functions, particularly verbal representations between the pre and
post examination of the test, and between the control and experimental groups.
Table 35
Two Way ANOVA on Achievement in Linear Functions: Verbal Representation
Source SS df MS F PPre-Post 6.92 1 6.92 1.31 .255
Control-Experimental 30.44 1 30.44 5.76 .018
Interaction 25.54 1 25.54 4.83 .030
Table 35 suggests significant effects (p < .05) in the control and experimental
groups and also, in the interaction between the factors examined.
Figure 17. Significant (p < .05) interaction in achievement in linear functions: Occasions X Conditions (Verbal representation).
90

Figure 18 shows a sample item from the achievement test on linear functions
dealing with verbal representations. For this item, it was required that students tell a
story about the situation described.
Item 21:
Which slope is bigger? The slope of Car A or Car B? Why? Explain your response in two or more sentences.
Figure 18. Sample test item dealing with verbal representation.
Summary
The previous sections of this chapter have presented the results on achievement in
mathematics, particularly in linear functions. This important variable was explored from
two perspectives: content topics discussed in the course under study, and multiple
representations of the linear function.
The treatment given to both groups had certain effects on the achievement in
linear functions. The statistical analyses reports that, in general, the experimental group
performed higher than the control group, although not significant (p > .05), once the
study concluded.
91

This trend was also observed in the two clusters where the achievement test was
divided. In the cluster dealing with the content topics, especially in graphs and slope, the
control group performed significantly higher (p < .05) than the experimental group at the
beginning of the study. Interestingly, the experimental group improved significantly (p <
.05) in these areas at the end of the treatment. In the topic of Cartesian coordinates, the
control group also performed significantly higher (p < .05) than the experimental group at
the beginning of the teaching experiment. Both groups got significant (p < .05)
improvements in achievement in this area once the study concluded. No significant (p
> .05) differences were found between groups at the end of the experiment.
Possible interaction effects, that is, differences in gain scores between the control
and the experimental groups were explored using ANOVA at the clusters. The two-way
ANOVA reported that significant interactions (p < .05) were found between factors:
occasion (pre and post examinations) and conditions (control and experimental groups)
only in the content topic dealing with slope.
In the cluster dealing with multiple representations of the linear functions, the
trend under discussion was also observed. At the beginning of the study, the control
group showed significant (p < .05) higher achievement than the experimental group in the
following representations: graphical, tabular, and verbal. At the end of the study, the
experimental group got a significant (p < .05) improvement in achievement in linear
functions through the symbolic, tabular, and verbal representations. In the graphical
representation of linear functions, both groups improved significantly (p < .05) at the end
of the experiment.
92

From the ANOVA analysis made also in this cluster, significant interactions (p <
.05) between factors were found in graphical and verbal representations.
The next chapter will include the discussion and conclusions of this study. The
research questions formulated in chapter one will be answered based on the results of this
research and recommendations will be made.
93

CHAPTER 5
DISCUSSION AND CONCLUSIONS
This chapter presents the answers to the four research questions proposed for this
study in chapter one, based on the analyses carried out in chapter four. Conclusions,
limitations of the study and recommendations follow in order to complete this chapter.
Discussion
The following research questions were investigated in this study:
1. How did the students in the two groups, experimental and control, compare in their prior achievement and attitudes, and their experiences with technology?
2. What relationships appear to exist between attitudes and achievement in the learning of linear functions activities?
3. At which level and in what ways, can the use of multiple representations be supported by spreadsheets learning activities promote to better promote understanding of linear functions in students at college level algebra?
4. How well does the medium of a powerful spreadsheet like Excel, lend itself to promoting instruction through multiple representations?
The following sections will answer each one of these questions separately.
Answering the First Research Question
1. How did the students in the two groups, experimental and control, compare in the prior achievement and attitudes, and their experiences with technology?
Prior achievement on mathematics based on grades reported by students from
both groups was examined. The students’ achievement in mathematics is represented by
grades referred to a general knowledge in this field, not necessarily in the topic of linear
functions. It is important to point out here that students in both groups had completely
94

different prior experiences, as well as, performances in mathematics. This was attributed
to the fact of receiving the course from different schools programs (public and private).
The research question was formulated, as the first one, since the prior achievement in
mathematics was the only variable that students exhibited before treatment for the study
started.
The results dealing with this variable, reported on chapter four revealed no
significant difference (p > .05) between the control and experimental groups on prior
achievement in mathematics. Based on these findings, prior achievement in mathematics
based on grades seemed not to be determinant factor in helping student attain a broad
understanding about linear functions. These results show that a good prior achievement
in mathematics did not necessarily imply a better achievement in linear functions.
Different mathematics topics were taught in a college level algebra course. In this study,
linear functions were strongly emphasized. According to the results, a good performance
in prior mathematics classes did not guarantee a good performance in linear functions.
In terms of technology use in prior mathematics courses, the students’ profiles
revealed that the use of computers, calculators, spreadsheets, Internet, among other tools,
were almost nonexistent. Further, the profiles indicated that for the majority of the
students in the study, it was their first experience using technology, particularly,
spreadsheets, in their mathematics courses. The findings indicate that in the experimental
group, previous mathematics achievement , particularly those supported by technology
were not a decisive factor in promoting better understanding in linear functions using
spreadsheets and multiple representations.
95

Answering the Second Research Question
2. What relationships appear to exist between attitudes and achievement in the learning of linear functions activities?
Attitudes toward mathematics were explored in this study by collecting data
through a scale that was administered in the beginning and at the end of the treatment, for
control and experimental groups. The results on this variable, summarized on the
previous chapter, indicate that no significant (p > .05) was found on the comparisons
made.
The items of the attitudes scale toward mathematics were organized in two
clusters: attitudes toward technology and its uses, and opinion or feelings toward
mathematics as a subject. In terms of technology uses in mathematics and by inspecting
students’ responses on items 1 and 2 of the attitudes scale, the experimental group had
not significant (p > .05) more positive experiences than the control group with the use of
calculators to perform routine calculations in their mathematics courses prior the study.
In terms of the attitudes toward technology, the control group exhibited a very slight (1
point of difference) positive attitude at the beginning of the study, according to the
inspection on item 3 of the scale. Once the treatment concluded, the experimental group
seemed to have a gain in positive attitudes toward technology. These results agreed with
the treatments that each group received, as described on chapter three.
The treatment received by the experimental group as part of the study was based
on intensive use of spreadsheets while emphasizing multiple representations of linear
96

functions. The improvement in attitudes toward mathematics from this group is
noticeable. It could be inferred that the traditional approach, based strictly in the use of
textbook and not technology allowed to enhance learning, did not promote an
improvement in the attitudes of the control group at the end of the study.
These results on attitudes toward mathematics agreed with the findings on
achievement discussed in a previous section of this chapter. Based on this information, it
would be sensible to conclude in this study, that attitudes toward mathematics seemed to
have limited effects on mathematical achievement.
Answering the Third Research Question
3. At which level and in what ways, can the use of multiple representations be supported by the spreadsheets learning activities to better promote understanding of linear functions in students at college level algebra?
Since the capabilities of spreadsheets to illustrate the multiple representations
(symbolic, graphical, tabular, and verbal) of a linear function, this technology was
intensively used in this study, particularly with the experimental group, to teach the
mathematics concepts in a college level algebra course. The use of spreadsheets allowed
students to work with multiple representations of linear functions. As Kaput (1992)
affirms, linking one representation with the others together in the same computer screen
was essential to understanding the advantages of technology in learning. This capability
also provided student with the understanding of how all the representations referred to the
same concept (Keller and Hirsch, 1998). Through the use of spreadsheets on the
mathematics lessons, students interacted with all representations and they examined all
97

the effects caused on representations when the x variable from a linear functions assumed
different values.
Mathematics achievement, specifically on linear functions, was one of the
variables explored in this study. This variable was measured through an achievement
test, emphasizing multiple representations administered at the beginning and at the end of
the treatment. The results, reported on chapter four, indicate that at the beginning of the
study, the control group exhibited a significant (p < .05) higher achievement than the
experimental group. It is assumed that the experimental group’s intensive use of
spreadsheets and multiple representations in the mathematical lessons through the
treatment reflected a significant (p < .05) improvement in achievement at the end of the
study.
Moreover, in order to explore students’ performance on achievement in specific
content topics related to linear functions, the research instrument on achievement was
divided in a cluster dealing with these topics. A significant (p < .05) higher achievement
was observed in favor of the control group in all of these areas at the beginning of the
study. Once the treatment concluded, no significant (p > .05) was found between groups.
It was observed in the experimental group a significant gain (p < .05) in achievement in
mathematics in the areas of graphs and slope. Both groups exhibited significant (p < .05)
improvements in the content of Cartesian coordinates once the teaching experiment
concluded. Interestingly, the two-way ANOVA reported significant (p < .05) interactions
between effects (pre-post administrations and groups) in the topic of slope.
98

In terms of the representations of the linear function, the results revealed that in
three of these representations (symbolic, tabular, and verbal) significant differences
(p < .05) were found at the end of the study in the experimental group. That is, students
in the experimental group performed higher at the end of this study in achievement on
linear functions through symbolic, tabular, and verbal representations. In terms of the
graphical representations, both groups exhibited a significant improvement (p < .05) on
achievement at the post administration of the test. The analysis of variance (ANOVA)
carried out between effects (groups and administrations of the test) reported significant
interactions (p < .05) in graphical and verbal representations.
The results of this study on achievement in mathematics, through the emphasis
placed on multiple representations supported by the use of spreadsheets, suggest that the
approach presented served to promote a better understanding of linear functions on
students in a college algebra course. It was observed that students, who used multiple
representations and spreadsheets as part of their mathematics course, performed higher in
achievement in mathematics (linear functions) at the end of the study that did the students
in the control group. The data from this study suggest that the multiple representations
approach supported by technology was more successful in promote achievement gain
than the traditional approach. The findings of this research are supported by previous
research in the field of representations done by Porzio (1994). His studies revealed that
the emphasis placed in multiple representations and technology was more adequate to
promote understanding and connections between representations.
Answering the Fourth Research Question
99

4. How well does the medium of a powerful spreadsheets like Excel, lend itself to promoting instruction through multiple representations?
Spreadsheets were selected as the technology medium to be used in this research
project because their capabilities to promote and show the multiple representations of the
linear functions. The software provided an engaging environment in where students
explored all the representations separately first, and then, all together in the same
worksheet. The linking process between representations strongly recommended by
Kaput (1992), Keller and Hirsch (1998), and Dufour-Janvier, et al. (1987) was
particularly shown on the spreadsheets.
Mathematical lessons based on spreadsheets developed in this study, allowed
students in the experimental group to explore the effects of different values on the
representations. This technology fulfilled the objectives set for this study and supported
the instructional activities. Not only multiple representations were supported by the use
of spreadsheets, the mathematical concepts (Cartesian coordinates, graphs, and slope)
taught during the course, were introduced through this technology. Recognized scholars
such as Fey (1989), Goldenberg (1987), Kaput (1992), and Porzio (1994) have noticed
that technology has contributed to increase the access of multiple representations of
mathematical concepts.
In terms of promoting instruction, the results on achievement for this study
showed that the spreadsheets approach using multiple representations was more adequate
than the traditional approach. Furthermore, this approach based on spreadsheets seemed
to serve to enhance higher attitudes toward mathematics and technology.
Comparing the Two Approaches Used in this Study: The Multiple Representations and The Traditional
100

The purpose of this section is to present how the same mathematical concept was
taught using two different approaches. The multiple representations, supported with
spreadsheets approach used with the experimental group and the traditional used with the
control group. The topic discussed in this class was Cartesian coordinates.
Multiple Representation Approach
In the class dealing with Cartesian coordinates, students in the experimental group
used a worksheet. In the first part of this activity, six different coordinates were given
and students had to fill in the corresponding blanks the location of each one of these
points. In the second part of the activity, students offered their own coordinates, different
from the presented in part one, and satisfying certain given locations. Then, using
spreadsheets they were asked to locate the coordinates and explore the effects of points
locations when the values of x and y in (x, y) changed. To end the activity, students were
encouraged to get printouts in order to show their work. Finally, they find an equation
related to these coordinates and told a story about the application of Cartesian coordinates
in their fields of study. Figures 19, 20, and 21 show the first and the last parts of this
activity done by Student 22. The answers to the questions on the worksheet appear in
italic font and printouts from spreadsheets appear in the following set of figures.
101

Locate in the Cartesian plane the following coordinates. Also, determine the quadrant where the points are located.
A (2, 4) First Quadrant
B (-5, 3) Second Quadrant
C (-9, -7) Third Quadrant
D (6, -1) Fourth Quadrant
E (0, 2) Positive y-axis
F (-5, 0) Negative x-axis
Figure 19. Worksheet sample Cartesian coordinates.
Figure 20. Spreadsheet sample on Cartesian coordinates.
Give an example about an equation that can relate one of the coordinates stated above.
The equation y = is satisfied by the point (2,4). Because if you substitute
102

the values on the equation: 4 = you get a true statement: 4 = 4.
Tell a story about the applications that Cartesian coordinates may have in daily situations or another fields:
I think that in medicine they serve to imagine two cut points in a surgery. Also, to make a map of the head where it is divided in sections. Finally, coordinates may be used to measure distances between different bones of the body.
Figure 21. Sample worksheet on Cartesian coordinates.
Traditional Approach
This approach was based on instructor lectures. The only resource used in this
lesson was the course textbook. Figures 22 and 23 show samples of a student’s notes
from the control group. All notes are in Spanish.
Figure 22. Sample of student’s notes on Cartesian plane.
103

Figure 23. Sample of student’s notes on Cartesian coordinates.
Lessons Learned by the Researcher
Mathematics Reasoning (MRSG 1010) is a college mathematics core course,
intended primarily for freshmen students, where technology has been slightly used
104

throughout the semesters that it has been taught. Although this course has been reviewed
in multiple times in terms of its objectives and how they have been fulfilled or not, the
use of more technology has been limited and unfortunately, out of the realm of
discussion. Nevertheless, regular instructors have supported mainly the use of calculators
as a supplement to instruction. The researcher was convinced that another kind of
technology (beyond calculators) could be used in this course to enhance achievement in
mathematics. Therefore, the main challenge for the investigator of this research was to
incorporate the intensive use of computers, particularly the use of spreadsheets to the
instructional activities dealing with linear functions of this course.
The incorporation of this technology did not constitute an easy activity in this
project. In the beginning of the study, the students exhibited surprise and sometimes lack
of belief about how through the use of spreadsheets they could learn the same
mathematical content knowledge as did the traditional students. Furthermore, the
researcher had to deal with the lack of expertise on students in the use of spreadsheets.
As stated earlier, this experience using technology represented to the majority of the
students their first time using computers in a mathematics course. In order to correct this
deficiency, the instructor of this study spent some class periods teaching the basic
features of spreadsheets and how they can be used in mathematics.
In this research project, the investigator dealt mainly with two important aspects:
(a) the mathematics topics included in the course syllabus taught during the length of the
study, and (b) students attitudes dealing particularly with the concern if spreadsheets will
work or not in order to learn linear functions and related themes. The first aspect was
105

fulfilled when the instructional topics were taught parallel with the traditional group and
in accordance with the syllabus. With the purpose to fulfill the second aspect, the
investigator had to motivate, encourage and over all, show and introduce each content
topic, in each class session using spreadsheets. In this way, students realized, once the
treatment concluded, that this technology constituted a really invaluable tool to learn
mathematics.
Some Comments from Students
This section presents some sample of comments from students in the experimental
group about their experiences using spreadsheets to learn linear functions in mathematics.
These data was collected through a weekly electronic journal that students sent to the
instructor of the course. The electronic journal contained two questions: a) What is the
big idea that you learned in the class? and b) What topic was difficult or unclear for you?.
Comments included on journals. During the first week of instruction, here are
some comments from students.
Student 27 said:
The most important thing was how do the graphs in Excel.
Student 25 said:
The most important idea in this class was how work with the computer and learn something new with the computer.
Student 22 said:
In my opinion, the most important thing in our class discussion was the explanation of the spreadsheets as tool for the course.
106

During the second week of instruction, here are some additional comments from
students in the experimental group.
Student 22 said:
The most important idea for me was the different representations of the linear equation and how works with them based in paper and pencil and using spreadsheets.
Student 13 said:
The Cartesian plane has been explained perfectly. Although I realize that I found it a little difficult to understand. It is not that it was not well explained, but I am not skillful with computers.
Student 26 said:
The class with the computer becomes more easy for me that the class just explaining on the board.
Other colleagues who were teaching the course during the semester that the study
took place, or who had taught the course before, expressed interest in knowing how
students were performing in the lessons activities based on spreadsheets. For the
majority of the regular instructors of MRSG 1010, the use of spreadsheets and multiple
representations to teach linear functions constituted something new and innovative.
As a result of the intensive use of technology in a college level mathematics
course, the researcher’s approach to teaching changed rather dramatically and was
reinforced in terms of promoting technology use to enhance achievement in mathematics.
As the report Shaping the Future from the National Science Foundation (George, et al.,
1996) affirms, technology should be available to all students, and they need the
opportunity to work with it, and get expertise using it as a tool of their learning. It is
107

reasonable to interpret here that technology in mathematics is intended to first; to provide
an environment to promote understanding and achievement, to get help, offer
alternatives, and sometimes solutions to certain problems.
This report discusses some barriers found in educational settings. The ineffective
use of instructional technology is one of them, pertinent to this study. This problem
consists in “a specific lack of knowledge about the hardware and technology that has
been spreading into increasing use, and to which many students are already attracted” (p.
44). Discussing on this issue, the report cited the Director of the Science and Technology
Resource Center at the Prince Georges County Community College. She said:
I see the following as serious problems… the challenge of teaching faculty and students how to access, utilize, and incorporate the vast amounts of information available in print and electronically, and learning how to utilize technology in making education more attractive to students who might otherwise lack motivation or interest in science, mathematics, engineering, and technology courses. (p. 44)
These problems identified in the report were also found in this research experience. The
first situation was discussed at the beginning of this section.
Technology has been erroneously used if it promotes misconceptions, confusion,
and unclear solutions. It is important to point out here, that certain students who
participated in this study developed an excessive dependency to the calculators or
computers use to perform simple mathematics computations and they were unable to
perform them without these technological equipments. This represents an example about
the inappropriate use and promotion of technology, where it is believed that computers
and calculators are magic boxes to solve all the problems in mathematics. As cited in the
NSF report, Noam (1995), said: “Technology would augment, not substitute” (p. 32).
108

Conclusions
This study through the design of mathematics lessons on linear functions,
examined first, three major variables: prior achievement in mathematics (based in
reported grades), achievement in mathematics, and attitudes toward mathematics.
Second, it was compared two teaching approaches: the multiple representation supported
by technology (spreadsheets) and the traditional.
Based on the analyses of the data provided by the various instruments, this
researcher draws the following conclusions regarding the variables of concern.
With respect to the prior achievement in mathematics based on reported grades, it
is concluded that this variable did not play a significant role in determining how much
mathematics was learned in the two groups, experimental and control.
Regarding students attitudes toward mathematics, it is concluded that if positive
and higher attitudes are observed, they are a possible factor to enhance achievement in
mathematics. Students in the experimental group had somewhat positive more attitudes
toward mathematics and performed higher in achievement.
In regard to the achievement in mathematics, this researcher concludes that
mathematics lessons emphasizing multiple representations supported by the use of
spreadsheets constitute an appropriate teaching approach to promote a broad achievement
on linear functions. Students taught with the multiple representations approach achieved
higher on linear functions than students taught with the traditional approach.
109

Finally, regarding the comparison of the two teaching approaches, it was found in
this study that the approach based on multiple representations and spreadsheets is more
effective than the traditional, in promoting and enhancing achievement in linear functions
as well as more positive attitudes toward mathematics.
Limitations of the Study
The following section presents the limitations of this study. The short period of
time (just four weeks of instruction) devoted to the teaching experiment, instead the
whole academic semester, was the first limitation of this research project. Other findings
could be expected if more time was added to the treatment.
The numbers of topics taught during this study was other limitation of this project.
Content topics strongly related with linear functions were only emphasized throughout
the study. Future studies could explore the use of representations with other content
topics discussed in a college level algebra course.
The researcher was the instructor of the two groups of this study: control and
experimental. Additional research in this field can determine the effects, and other
results of using more than one teacher in similar conditions.
The “Hawthorne effect” constituted the another limitation of the study. The
changes observed at the end of the experiment on attitudes and achievement in linear
functions between control and experimental groups could be as a result of other factors
involved during the length of the treatment, rather than the emphasis placed on multiple
representations of linear functions and the intensive use of spreadsheets. Examples of
these factors could be: teacher style, class environment, and students’ interests.
110

Recommendations
The results of this study suggest the following recommendations. Some of these
recommendations agree with the included in the NSF report Shaping the Future (George,
et. al, 1996).
To the university and administrators:
1. To re-focus the mission of the General Education Program, particularly the section dealing with reasoning skills, where MRSG 1010 is part, taking into consideration students’ needs and interests.
2. To review this mathematics core course establishing an appropriate description in accordance to technological advances.
To the department:
3. To provide an attractive curriculum in undergraduate mathematics that students can feel that mathematics is useful in their fields of specialization.
4. To encourage faculty to use in the teaching of this course other technological tools, such as, spreadsheets.
5. To provide and promote curricular innovations in the teaching of this course.
6. To encourage faculty members to do research in all mathematics courses and the publication of their findings.
To the mathematics faculty:
7. To believe that all students can learn mathematics in different ways and to create and harmonious and attractive environment that can engage students in their learning.
111

8. To suggest a curricular review, specifying the mathematical topics that should be taught in MRSG 1010. To recommend what content should receive more emphasis and what should receive less.
9. To believe that technology has changed the education in mathematics and the use of it should not be omitted.
10. To promote and encourage the use of technology (such as spreadsheets) in all mathematics courses, not only used as supplement of instruction.
11. To explore the use of other teaching approaches, such as multiple representations. Using this approach, each representation of the same concept is taught and emphasized letting students effectively manage these representations.
112

REFERENCES
Adams, D. D., & Shrum, J. W. (1988, April). The effects of microcomputer-based laboratory exercises on the acquisition of line graph construction and interpretation skills by high school biology students. Paper presented at the Annual Meeting of the National Association for Research in Science Teaching, Lake of the Ozarks, MO.
Adams, T. L. (1997). Addressing students’ difficulties with the concept of function: Applying graphing calculators and a model of conceptual change. Focus on Learning Problems in Mathematics, 19, (2), 43-57.
Adda, J. (1982). Difficulties with mathematical symbolism: Synonymy and homonymy. Visible language, 16, (3), 205-214.
Angel, A. R. (2000). Intermediate algebra for College Students. Fifth Edition. Upper Saddle River, NJ: Prentice Hall.
Artigue, M. (1992). Functions from an algebraic and graphic point of view: Cognitive difficulties and teaching practices. In G. Harel & E. Dubinsky (Eds.), The concept of function: Aspects of epistemology and pedagogy: MAA Notes Vol. 25 (pp. 109-132). Washington, DC: Mathematical Association of America.
Beckmann, C. E. (1988). Effect of computer graphics use on student understanding of calculus concepts (Doctoral dissertation, Western Michigan University). Dissertation Abstracts International, 50, 1974B.
Berg, C. A., & Phillips, D. G. (1994). An investigation of the relationship between logical thinking structures and the ability to construct and interpret line graphs. Journal of Research in Science Teaching, 31, (4), 323-344.
Bertin, J. (1967). Sémiologie graphique: les diagrammes, les réseaux, les cartes [Graphic semiology: diagrams, networks, cards]. Paris: Mouton.
Bezuidenhout, J. (1998). First-year university students’ understanding of rate of change. International Journal of Mathematical Education in Science & Technology, 29, (3), 389-399.
113
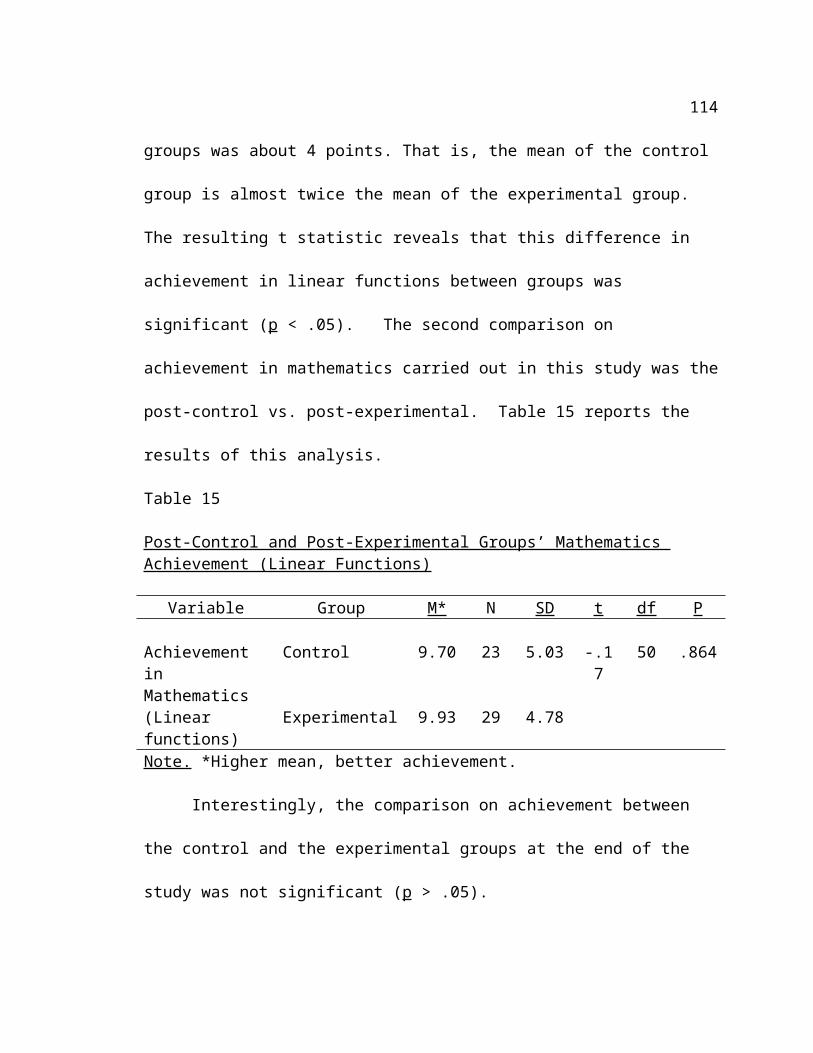
Borba, M. C., & Confrey, J. (1996). A student’s construction of transformation of functions in a multiple representational environment. Educational Studies in Mathematics, 31, (3), 319-397.
Bosch, W. W., & Strickland, J. (1998). Systems of linear equations on a spreadsheet. Mathematics & Computer Education, 32, (1), 11-16.
Bowen, G. M., & Roth, W. M. (1998). Lecturing graphing: What features of lectures contribute to student difficulties in learning to interpret graphs? Research in Science Education, 28, (1), 77-90.
Breidenbach, D., Dubinsky, E., Hawks, J., & Nichols, D. (1992). Development of the process conception of function. Educational Studies in Mathematics, 23, (3), 247-285.
Brenner, M. E., et al. (1995, October). The role of multiple representations in learning algebra. Paper presented at the Annual Conference of the North American Chapter of the International Study Group for the Psychology of Mathematics Education, Columbus, OH.
Brenner, M. E., et al. (1997). Learning by understanding: The role of multiple representations in learning algebra. American Educational Research Journal, 34, (4), 663-689.
Browning, C. A. (1991). Level of graphical understanding: Comparisons between high school and college precalculus students. In F. Demana & B. K. Waits (Eds.), Proceedings of the Second Annual Conference on Technology in Collegiate Mathematics (pp. 129-132). Reading, MA: Addison-Wesley Publishing Company.
Bruner, J. S. (1964). The course of cognitive growth. American Psychologist, 19, 1-15.
Bruner, J. S. (1966). Toward a theory of instruction. New York: WW Norton & Company, Inc.
Burrill, G. F., & Hopfensperger, P. (1998). Exploring linear relations: Data-driven mathematics. Dale Seymour Publications.
Calculus Consortium at Harvard. (2001). About the Calculus Consortium based at Harvard University [On-line]. Available: http://www.wiley.com/college/cch/aboutconsortium.html.
Caldwell, F. (1997, October). Bring functions and graphs to the life with the CBL. A presentation at the 1997 Carolinas Mathematics Conference, Charlotte, NC.
114

Carlson, M. P. (1997). Obstacles for college algebra students in understanding functions: What do high-performing students really know? Amatyc Review, 19, (1), 48-59.
Confrey, J., et al. (1991). The use of contextual problems and multi-representational software to teach the concept of functions. Final Report Project. Ithaca, NY: Cornell University.
Cooney, T. J., & Wilson, M. R. (1993). Teachers’ thinking about functions: Historical and research perspectives. In T. A. Romberg, E. Fennema, T. P. Carpenter (Eds.), Integrating research on the graphical representation of functions (pp. 131-158). Hillsdale, NJ: Lawrence Erlbaum Associates Publishers.
Crocker, D. A. (1991). A qualitative study of interactions, concept development and problem solving in a calculus class immersed in the computer algebra system MathematicaTM (Doctoral dissertation, The Ohio State University). Dissertation Abstracts International, 52, 2448A.
Cuoco, A. A. (Ed.) (2001). The roles of representation in school mathematics. Reston, VA: National Council of Teachers of Mathematics.
De Jong, T., et al. (1998). Acquiring knowledge in science and mathematics: The use of multiple representations in technology-based learning environments. In N. Bennett, E. DeCorte, S. Vosniadou, & H. Mandl (Series Eds.) & M. W. Van Someren, P. Reimann, H. P. A. Boshuizen, & T. De Jong (Vol. Eds.), Learning with multiple representations (pp. 9-40). Oxford: Pergamon.
DiBiase, J., & Eisenberg, M. (1995, June). Mental imagery in the teaching of functions. Paper presented at the Annual National Educational Computing Conference, Baltimore, MD
Dienes, Z. P. (1963). An experimental study of mathematics. London: Hutchinson Educational LTD.
Dienes, Z. P. (1963). Building up mathematics. London: Hutchinson Educational LTD.
Dienes, Z. P. (1964). The power of mathematics. London, Hutchinson Educational LTD.
Dienes, Z. P. (1973). The six stages in the process of learning mathematics. NFER Publishing Company Ltd., Windsor, Berks.
Dienes, Z. P., & Golding, E. W. (1971). Approach to modern mathematics. New York: Herder & Herder.
115

Donnelly, I. R. (1995). Mathematics and technology: A case study of the teaching of functions using multiple representation software. Unpublished master’s thesis, University of Manitoba.
Douglas, R. G. (Ed.). (1986). Toward a lean and lively calculus: Report of the conference/workshop to develop curriculum and teaching methods for calculus at the college level [MAA Notes Number 6]. Washington, DC: Mathematical Association of America.
Dreyfus, T. (1991). Advanced mathematical thinking process. In D. Tall (Ed.), Advanced mathematical thinking (pp. 25-41). The Netherlands: Kluwer Academic Publishers.
Dreyfus, T., & Eisenberg, T. (1982). Intuitive functional concepts: A baseline study on intuitions. Journal for Research in Mathematics Education, 13, 360-380.
Dreyfus, T., & Eisenberg, T. (1988). On visualizing function transformations. Unpublished manuscript.
Dubinsky, E., & Harel, G. (1992). The nature of the process conception of function. In G. Harel & E. Dubinsky (Eds.), The concept of function: Aspects of epistemology and pedagogy: MAA Notes Vol. 25 (pp. 85-106). Washington, DC: Mathematical Association of America.
Dufour- Janvier, B., Bednarz, N., & Belanger, M. (1987). Pedagogical considerations concerning the problem of representation. In C. Janvier (Ed.), Problems of representation in the teaching and learning of mathematics (pp. 109-122). Hillsdale, NJ: Lawrence Erlbaum Associates Publishers.
Dugdale, S. (1986). Pathfinder: A microcomputer experience in interpreting graphs. Journal of Educational Technology Systems, 15, (3), 259-280.
Dugdale, S. (1993). Functions and graphs – Perspectives on student thinking. In T. A. Romberg, E. Fennema, & T. P. Carpenter (Eds.), Integrating research on the graphical representation of functions (pp. 101-130). Hillsdale, NJ: Lawrence Erlbaum Associates Publishers.
Eisenberg, T. (1991). Functions and associated learning difficulties. In D. Tall (Ed.), Advanced mathematical thinking (pp. 140-152). The Netherlands: Kluwer Academic Publishers.
116

Eisenberg, T., & Dreyfus, T. (1991). One the reluctance to visualize in mathematics. In W. Zimmerman & S. Cunningham (Eds.), Visualization in teaching and learning mathematics (pp. 25-37). Washington, DC: Mathematical Association of America.
English, L. D., & Halford, G. S. (1995). Mathematics education: Models and processes. Lawrence Erlbaum Associates. Mahwah, NJ.
Even, R. (1990). Subject matter knowledge for teaching and the case of functions. Educational Studies in Mathematics, 21, (6), 521-544.
Ferrini-Mundy, J., & Graham, K. (1991, January). Research in calculus learning: Understanding of limits, derivatives, and integrals. Paper presented at the Joint Mathematics Meetings, Special Session on Research in Undergraduate Mathematics Education, San Francisco, CA.
Fey, J. T. (1989). School algebra for the year 2000. In S. Wagner & C. Kieran (Eds.), Research issues in the learning and teaching of algebra. Reston, VA: National Council of Teachers of Mathematics.
Fey, J. T. (1989). Technology and mathematics education: A survey of recent developments and important problems. Educational Studies in Mathematics, 20, (3), 237-272.
Friedler, Y., & Mc Farlane, A. E. (1997). Data logging with portable computers: A study of the impact on graphing skills in secondary pupils. Journal of Computers in Mathematics & Science Teaching, 16, (4), 527-550.
Garofalo, J., & Durant, K. (1991). Applied functions and graphs: A necessary topic for developmental mathematics. Research & Teaching in Developmental Education, 8, (1), 51-55.
George, M. D., et al. (1996). Shaping the future: New expectations for undergraduate education in science, mathematics, engineering, and technology (National Science Foundation Rep. No. 96139. Washington, DC: National Science Foundation.
Gningue, S. M. (2000). The use of manipulatives in middle school algebra: An application of Dienes’ variability principles. Dissertation Abstracts International, 60(12), 4356A. (University Microfilms No. AAT 9956352).
Goldenberg, E. P. (1987). Believing is seeing: How preconceptions influence the perception of graphs. In J. Bergeron, N. Herscovits, & C. Kieran (Eds.), Proceedings of the Eleventh International Conference on the Psychology of Mathematics Education, 1, 197-203.
117

Goldenberg, E. P. (1988). Mathematics, metaphors, and human factors: Mathematical, technical, and pedagogical challenges in the educational use of graphical representation of function. Journal of Mathematical Behavior, 7, (2), 135-173.
Goldenberg, P., Lewis, P., & O’Keefe, J. (1992). Dynamic representation and the development of a process understanding of function. In G. Harel & E. Dubinsky (Eds.), The concept of function: Aspects of epistemology and pedagogy: MAA Notes Vol. 25 (pp. 235-260). Washington, DC: Mathematical Association of America.
Goldin, G. A. (1990). Epistemology, constructivism, and discovery learning in mathematics. In R. B. Davis, C. A. Maher, & N. Noddings (Eds.), Constructivist views on the teaching and learning mathematics (pp. 31-47). Reston, VA: National Council of Teachers of Mathematics.
Goldin, G., & Shteingold, N. (2001). Systems of representations and the development of mathematical concepts. In A. Cuoco (Ed.), The roles of representation in school mathematics (pp. 1-23). Reston, VA: National Council of Teachers of Mathematics.
Greeno, J. G., & Hall, R. P. (1997). Practicing representation: Learning with and about representational forms. Phi Delta Kappan, 78, (5), 361-367.
Hart, D. K. (1991). Building concept images: Supercalculators and students’ use of multiple representations in calculus. Dissertation Abstracts International, 52(12), 4254A. (University Microfilms No. AAI 9214776).
Hiebert, J., & Carpenter, T. P. (1992). Learning and teaching with understanding. In D. A. Grouws (Ed.), Handbook of research on mathematics teaching and learning (pp. 65-97). New York: Macmillan.
Hughes-Hallet, D. (1991). Where is the mathematics? Another look at calculus reform. In F. D. Demana, B. K. Waits, & J. Harvey (Eds.), Proceedings of the second annual conference on technology in collegiate mathematics (pp. 31-33). Reading, MA: Addison-Wesley.
Iannone, M. A. (1975). A study of two approaches to the learning of the function concept: The tabular approach and the mapping diagram approach. Dissertation Abstracts International, 36(07), 4383A.
International Association for the Evaluation of Educational Achievement. (1995). Second Study of Mathematics. Technical Report IV, Instrument Book.
Janvier, C. (1987a). Representation and understanding: The notion of function as an example. In C. Janvier (Ed.), Problems of representation in the teaching and learning of mathematics (pp. 67-71). Hillsdale, NJ: Lawrence Erlbaum Associates Publishers.
118
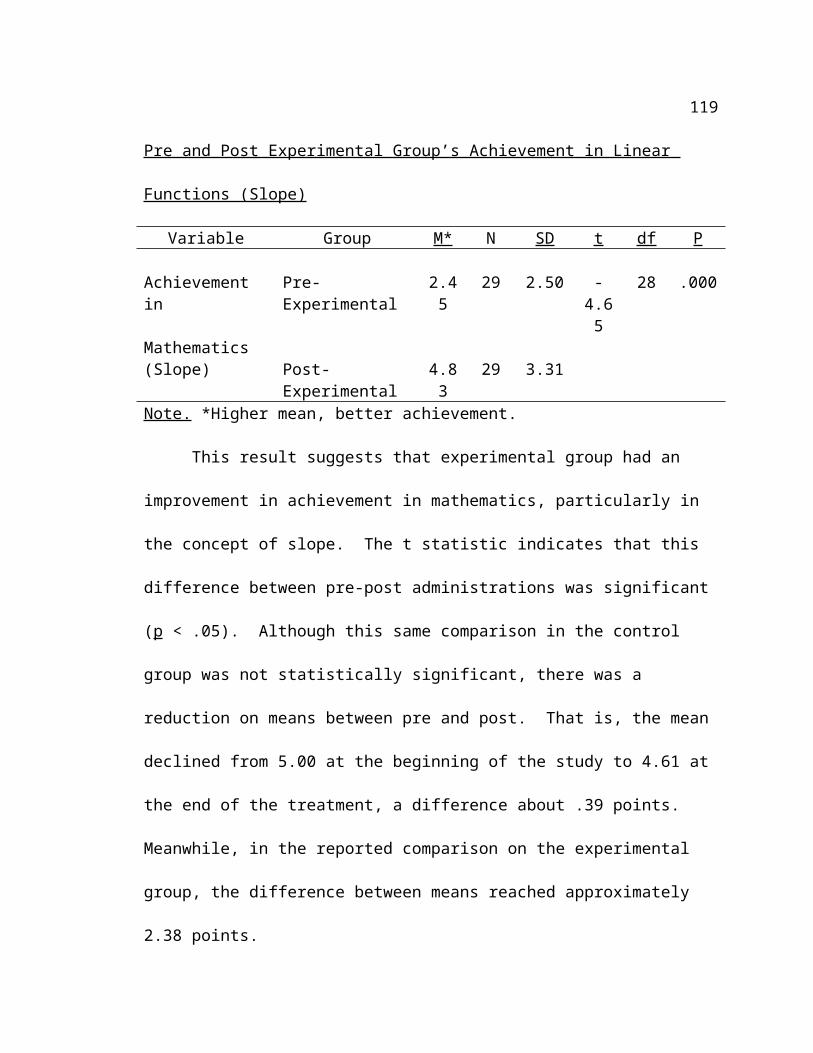
Janvier, C. (1987b). Conceptions and representations: The circle as an example. In C. Janvier (Ed.), Problems of representation in the teaching and learning of mathematics (pp. 147-158). Hillsdale, NJ: Lawrence Erlbaum Associates Publishers.
Janvier, C., Girardon, C., & Morand, J. C. (1993). Mathematics symbols and representations. In P. S. Wilson (Ed.), Research ideas for the classroom: High school mathematics (pp. 79-102). New York: Macmillan Publishing Company.
Johari, A. (1998). Effects of inductive multimedia programs including graphs on creation of linear function and variable conceptualization. Tucson, AZ: Arizona State University.
Kaput, J. J. (1985). Representation and problem solving: Methodological issues related to modeling. In E. A. Silver (Ed.), Teaching and learning mathematical problem solving: Multiple research perspectives (pp. 381-398). Hillsdale, NJ: Lawrence Erlbaum Associates.
Kaput, J. J. (1987). Representation systems and mathematics. In C. Janvier (Ed.), Problems of representation in the teaching and learning of mathematics (pp. 19-26). Hillsdale, NJ: Lawrence Erlbaum Associates Publishers.
Kaput, J. J. (1989a). Linking representations in the symbol systems of algebra. In S. Wagner & C. Kieran (Eds.), Research issues in the learning and teaching of algebra (pp. 167-194). Hillsdale, NJ: Lawrence Erlbaum Associates Publishers.
Kaput, J. J. (1989b). Information technologies and affect in mathematical experiences. In D. B. McLeod, & V. M. Adams (Eds.), Affect and mathematical problem solving (pp. 89-103). New York: Springer-Verlag.
Kaput, J. J. (1991). Notations and representations as mediators of constructive processes. In E. Von Glasersfeld (Ed.), Radical constructivism in mathematics education (pp. 53-74). The Netherlands: Kluwer Academic Publishers.
Kaput, J. J. (1992). Technology and mathematics education. In D. A. Grouws (Ed.), Handbook of research on mathematics teaching and learning (pp. 515-556). New York: Macmillan.
Keller, B. A., & Hirsch, C. R. (1998). Student preferences for representations of functions. International Journal of Mathematical Education in Science & Technology, 29, (1), 1-17.
Kieran, C. (1993). Functions, graphing, and technology: Integrating research on learning and instruction. In T. A. Romberg, E. Fennema, & T. P. Carpenter (Eds.), Integrating research on the graphical representation of functions (pp. 189-237). Hillsdale, NJ: Lawrence Erlbaum Associates Publishers.
119

LaLomia, M. J., Coovert, M. D., & Salas, E. (1988). Problem solving performance and display preference or information displays depicting numerical functions. (ERIC Document Reproduction Service No. ED 308862).
Lauten, A. D., et al. (1994). Student understanding of basic calculus concepts: Interaction with the graphics calculator. Journal of Mathematical Behavior, 13, (2), 225-237.
Lay, L. C. (1982). Mental images and arithmetical symbols. Visible Language, 16, (3), 259-274.
Leinhardt, G., et al. (1990). Functions, graphs, and graphing: Tasks, learning, and teaching. Review of Educational Research, 60, (1), 1-64.
Lesgold, A. (1988). Multiple representations and their implications for learning. In N. Bennett, E. DeCorte, S. Vosniadou, & H. Mandl (Series Eds.) & M. W. Van Someren, P. Reimann, H. P. A. Boshuizen, & T. De Jong (Vol. Eds.), Learning with multiple representations (pp. 307-319). Oxford: Pergamon.
Lesh, R. (1987). The evolution of problem representations in the presence of powerful conceptual amplifiers. In C. Janvier (Ed.), Problems of representation in the teaching and learning of mathematics (pp. 197-206). Hillsdale, NJ: Lawrence Erlbaum Associates Publishers.
Lesh, R., Post, T., & Behr, M. (1987). Representation and translations among representation in mathematics learning and problem solving. In C. Janvier (Ed.), Problems of representation in the teaching and learning of mathematics (pp. 33-40). Hillsdale, NJ: Lawrence Erlbaum Associates Publishers.
Lloyd, G. M. (1996). Change in teaching about functions: Content conceptions and curriculum reform. Virginia Polytechnic Institute and State University.
Lloyd, G. M., & Wilson, M. (1998). Supporting innovation: The impact of a teacher’s conceptions of functions on his implementation of a reform curriculum. Journal for Research in Mathematics Education, 29, (3), 248-274.
Lloyd, G., & Wilson, M. R. (1995, October). The role of teacher’s mathematical conceptions in his implementation of a reform-oriented functions unit. Paper presented at the Annual Meeting of the North American Chapter of the International Group for the Psychology of Mathematics Education, Columbus, OH.
Lovell, K. (1971). Some aspects of the growth of the concept of a function. In M. F. Rosskopf, & L. P. Steffe (Eds.), Piagetian cognitive-development research and mathematical education (pp. 12-33). Washington, DC: National Council of Teachers of Mathematics.
120

Malik, M. A. (1980). Historical and pedagogical aspects of the definition of function. International Journal of Mathematics Education in Science and Technology, 11, (4), 489-492.
Markovits, Z., Eylon, B., & Bruckheimer, M. (1986). Functions today and yesterday. For the Learning of Mathematics, 6, (2) 18-24.
Martínez-Cruz, A. M. (1995, October). Graph, equation and unique correspondence: Three models of students’ thinking about functions in a technology-enhanced precalculus class. Paper presented at the Annual Meeting of the North American Chapter of the International Group for the Psychology of Mathematics Education, Columbus, OH.
Mason, J. (1980). When is a symbol symbolic? For the learning of mathematics, 1, (2), 8-12.
Mason, J. H. (1987a). What do symbols represent? In C. Janvier (Ed.), Problems of representation in the teaching and learning of mathematics (pp. 73-81). Hillsdale, NJ: Lawrence Erlbaum Associates Publishers.
Mason, J. H. (1987b). Representing representing: Notes following the conference. In C. Janvier (Ed.), Problems of representation in the teaching and learning of mathematics (pp. 207-214). Hillsdale, NJ: Lawrence Erlbaum Associates Publishers.
McArthur, D., Burdorf, C., Ormseth, T., Robyn, A., & Stasz, C. (1988). Multiple representations of mathematical reasoning. A RAND Note: National Science Foundation.
McCoy, L. P., Baker, T. H., & Little, L. S. (1996). Using multiple representations to communicate: An algebra challenge. In P. C. Elliott (Ed.), Communication in mathematics, K-12 and beyond (pp. 40-44). Reston, VA: National Council of Teachers of Mathematics.
McFarlane, A. E., Friedler, Y., Warwick, P., & Chaplain, R. (1995). Developing an understanding of the meaning of line graphs in primary science investigations, using portable computers and data logging software. Journal of Computer in Mathematics and Science Teaching, 14, (4), 461-480.
McKenzie, D. L., & Padilla, M. J. (1986). The construction and validation of the Test of Graphing Skills in Science. Journal of Research in Science Technology, 23, (7), 571-580.
Megginson, R. (1995). Harvard-Calculus Overview [On-line]. Available: http://archives.math.utk.edu/projnext/advice/harvardCalculus.html.
121

Mevarech, Z. R. & Kramarsky, B. (1997). From verbal description to graphic representations: Stability and change in students’ alternative conceptions. Educational Studies in Mathematics, 32, (3), 229-263.
Monk, G. (1989, March). A framework for describing student understanding of functions. Paper presented at the Annual Meeting of the American Educational Research Association, San Francisco, CA.
Monk, G. S. (1994). Students’ understanding of functions in calculus courses. Humanistic Mathematics Network Journal, 9, 21-27.
Moschkovich, J. N. (1998). Resources for refining mathematical conceptions: Case studies in learning about linear functions. Journal of the Learning Sciences, 7, (2), 209-237.
Moschkovich, J., Schoenfeld, A. H., & Arcavi, A. (1993). Aspects of understanding: On multiple perspectives and representations of linear relations and connections among them. In T. A. Romberg, E. Fennema, &. T. P. Carpenter (Eds.), Integrating research on the graphical representation of functions (pp. 69-100). Hillsdale, NJ: Lawrence Erlbaum Associates Publishers.
National Council of Teachers of Mathematics. (2000). Principles and standards for school mathematics. Reston, VA: Author.
Noddings, N. (1990). Constructivism in mathematics education. In R. B. Davis, C. A. Maher, & N. Noddings (Eds.), Constructivist views on the teaching and learning of mathematics (pp. 7-18). Reston, VA: National Council of Teachers of Mathematics.
Norman, A. (1992). Teachers’ mathematical knowledge of the concept of function. In G. Harel & E. Dubinsky (Eds.), The concept of function: Aspects of epistemology and pedagogy: MAA Notes Vol. 25 (pp. 215-232). Washington, DC: Mathematical Association of America.
Norman, F. A. (1993). Integrating research on teachers’ knowledge of functions and their graphs. In T. A. Romberg, E. Fennema, & T. P. Carpenter (Eds.), Integrating research on the graphical representation of functions (pp. 159-187). Hillsdale, NJ: Lawrence Erlbaum Associates Publishers.
O’Callaghan, B. R. (1998). Computer-intensive algebra and students’ conceptual knowledge of functions. Journal for Research in Mathematics Education, 29, (1), 21-40.
Olsen, J. R. (1995, October). The effect of the use of number lines representations on student understanding of basic function concepts. Paper presented at the Annual Meeting of the North American Chapter of the International Group for the Psychology of Mathematics Education, Columbus, OH.
122

Orton, A. (1983a). Students’ understanding of integration. Educational Studies in Mathematics, 14, (1), 1-18.
Orton, A. (1983b). Students’ understanding of differentiation. Educational Studies in Mathematics, 14, (3), 235-250.
Özgün-Koca, S. A. (1998, October-November). Students’ use of representations in mathematics education. Poster presentation at the Annual Meeting of the North American Chapter of the International Group for the Psychology of Mathematics Education, Raleigh, NC.
Padilla, M. J., et al. (1986). An examination of the line graphing ability of students in grades seven through twelve. School Science and Mathematics, 86, (1), 20-26.
Phillip, R. A., Martin, W. O., & Richgels, G. W. (1993). Curricular implications of graphical representations of functions. In T. A. Romberg, E. Fennema, & T. P. Carpenter (Eds.), Integrating research on the graphical representation of functions (pp. 239-278). Hillsdale, NJ: Lawrence Erlbaum Associates Publishers.
Peirce, C. S. (1955). Logic as semiotic: The theory of signs. In J. Buchler (Ed.), Philosophical writings of Peirce (1893-1910) (pp. 98-119). New York: Dover.
Piez, C. M., & Voxman, M. H. (1997). Multiple Representations: Using Different Perspectives to Form a Clearer Picture. Mathematics Teacher, 90, (2), 164-166.
Pirie, S. E. B., & Martin, L. (1997). The equation, the whole equation, and nothing but the equation! One approach to the teaching of linear equations. Educational Studies in Mathematics, 34, (2), 159-181.
Poppe, P. E. (1993). Representations of function and the roles of the variable. Dissertation Abstracts International, 54(12), 4383A. (University Microfilms No. AAI 9409911).
Porzio, D. T. (1994). The effects of differing technological approaches to calculus on students’ use and understanding of multiple representations when solving problems. Dissertation Abstracts International, 55(10), 3128A. (University Microfilms No. AAI 9505274).
Rodríguez- Ahumada, J. G., et al. (1997). Razonamiento matemático, fundamentos y aplicaciones [Mathematics reasoning, fundaments and applications]. Mexico: International Thompson Editors.
Romberg, T. A., Carpenter, T. P., & Fennema, E. (1993). Toward a common research perspective. In T. A Romberg, E. Fennema, & T. P. Carpenter (Eds.), Integrating
123
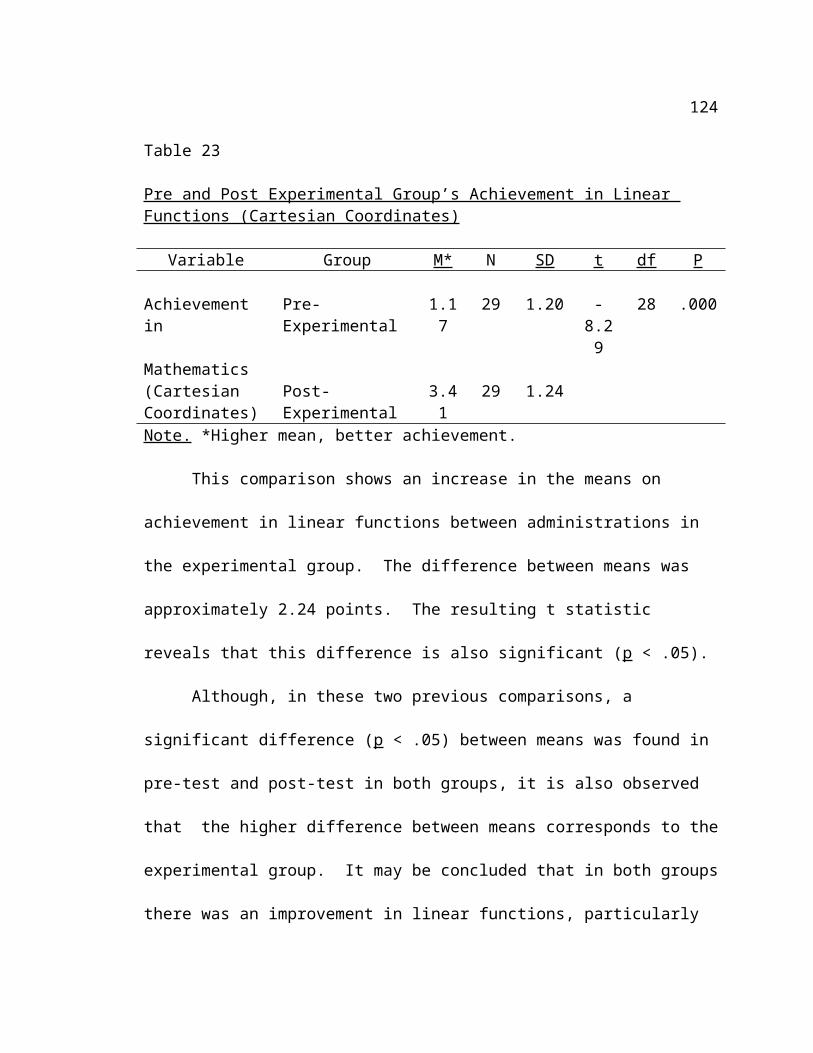
research on the graphical representation of functions (pp. 1-9). Hillsdale, NJ: Lawrence Erlbaum Associates Publishers.
Resnick, L. B., & Ford, W. W. (1981). The psychology of mathematics for instruction. Hillsdale, NJ: Lawrence Erlbaum Associates Publishers.
Schoenfeld, A. H. (1988). Uses of computers in mathematics instruction. In D. A. Smith, G. J. Porter, L. C. Leinbach, & R. H. Wenger (Eds.), Computers and mathematics: The use of computers in undergraduate instruction (pp. 1-11). Washington, DC: The Mathematical Association of America.
Schultz, J. E., & Waters, M. S. (2000). Why representations? Mathematics Teacher, 93, (6), 448-453.
Schwarz, B., Dreyfus, T., Bruckheimer, M. (1990). A model of the function concept in a three-fold representation. Computers and education, 14, 249-262.
Schwingendorf, K., Hawks, J., & Beineke, J. (1992). Horizontal and vertical growth of the students’ conception of function. In G. Harel & E. Dubinsky (Eds.), The concept of function: Aspects of epistemology and pedagogy: MAA Notes Vol. 25 (pp. 133-149). Washington, DC: Mathematical Association of America.
Selden, A., & Selden, J. (1992). Research perspectives on conception of function summary and overview. In G. Harel & E. Dubinsky (Eds.), The concept of function: aspects of epistemology and pedagogy: MAA Notes Vol. 25 (pp. 1-21). Washington, DC: Mathematical Association of America.
Sfard, A. (1987). Two conceptions of mathematical notions: Operational and structural. Proceedings of the Eleventh International Conference for Psychology of Mathematics Education (pp. 162-169). Montreal, Canada.
Sfard, A. (1991). On the dual nature of mathematical conceptions: Reflections on processes and objects as different sides of the same coin. Educational Studies in Mathematics, 22, (1), 1-36.
Sfard, A. (1992). Operational origins of mathematical objects and the quandary of reification: The case of function. In E. Dubinsky & G. Harel (Eds.), The concept of function: Aspects of epistemology and pedagogy (pp. 59-84). Washington, DC: Mathematical Association of America.
Shama, G., & Dreyfus, T. (1994). Visual, algebraic and mixed strategies in visually presented linear programming problems. Educational Studies in Mathematics, 26, (1), 45-70.
124

Shumway, R. J. (1988). Symbolic computer systems and the calculus. Amatyc Review, 11 (1, Part 2), 56-60.
Sierpinska, A. (1992). On understanding the notion of function. In G. Harel & E. Dubinsky (Eds.), The concept of function: Aspects of epistemology and pedagogy MAA Notes Vol. 25 (pp. 25-84). Washington, DC: Mathematical Association of America.
Skemp, R. R. (1982). Communicating mathematics: Surface structures and deep structures. Visible language, 16, (3), 281-288.
Skemp, R. R. (1987). The psychology of learning mathematics (Expanded American Edition). Hillsdale, NJ: Lawrence Erlbaum Associates Publishers.
Slavit, D. (1997). An alternate route to the reification of function. Educational Studies in Mathematics, 33, (3), 259-282.
Small, D., et al. (1986). Computer algebra systems in undergraduate instruction. College Mathematics Journal, 17, (5), 423-433.
Steen, L. A. (Ed.). (1987). Calculus for a new century: A pump, not a filter [MAA Notes No. 9]. Washington, DC: Mathematical Association of America.
Tabachneck-Schiff, H. J. M., & Simon, H. S. (1996). Alternative representations of instructional material. In D. Peterson (Ed.), Forms of representation (pp. 28-46). Great Britain: Intellects Books.
Tall, D. (1985). Understanding the calculus. Mathematics Teaching, 110, 48-53.
Tall, D., & Vinner, S. (1981). Concept image and concept definition in mathematics with particular reference to limits and continuity. Educational Studies in Mathematics, 12, 151-169.
Thomas, H. L. (1975). The concept of function. In M. F. Rosskopf (Ed.), Children’s mathematical concepts: Six Piagetian studies in mathematics education (145-172). NY: Teachers’ College Press.
Thompson, P. W. (1994). Students, functions, and the undergraduate curriculum. In E. Dubinsky, A. H. Schoenfeld, & J. Kaput (Eds.), Conference Board of the Mathematical Sciences Issues in Mathematics Education: Vol. 4. Research in collegiate mathematics education, I (pp. 21-44). Washington, DC: American Mathematical Society.
Thorpe, J. A. (1989). Algebra: what should we teach and how should we teach it? In S. Wagner, & C. Kieran (Eds.), Research issues in the learning and teaching of algebra (pp. 11-23). Reston, VA: National Council of Teachers of Mathematics.
125

Tucker, T. W. (1987). Calculus tomorrow. In L. A Steen (Ed.), Calculus for a new century: A pump not a filter (pp. 14-17). Washington, DC: Mathematical Association of America.
Tucker, T. W. (Ed.). (1990). Priming the calculus pump: Innovations and resources [MAA Notes 17]. Washington, DC: Mathematical Association of America.
Turner, K. V., & Wheatley, G. H. (1980). Mathematics learning styles of calculus students. Unpublished manuscript, Anderson College.
Van Someren, M. W., et al. (1998). Introduction. In N. Bennett, E. DeCorte, S. Vosniadou, & H. Mandl (Series Eds.) & M. W. Van Someren, P. Reimann, H. P. A. Boshuizen, & T. De Jong (Vol. Eds.), Learning with multiple representations (pp. 1-5). Oxford: Pergamon.
Vinner, S. (1983). Concept definition, concept image and the notion of function. International Journal of Mathematics Education in Science and Technology, 14, (3), 293-305.
Vinner, S. (1989). The avoidance of visual considerations in calculus students. Focus on Learning Problems in Mathematics, 11, (2), 149-156.
Vinner, S. (1992). The function concept as a prototype for problems in mathematics learning. In G. Harel & E. Dubinsky (Eds.), The concept of function: Aspects of epistemology and pedagogy: MAA Notes Vol. 25 (pp. 195-213). Washington, DC: Mathematical Association of America.
Vinner, S., & Dreyfus, T. (1989). Images and definitions for the concept of function. Journal for Research in Mathematics Education, 20, (4), 356-366.
Von Glasersfeld, E. (1987). Preliminaries to any theory of representation. In C. Janvier (Ed.), Problems of representation in the teaching and learning of mathematics (pp. 215-225). Hillsdale, NJ: Lawrence Erlbaum Associates Publishers.
Von Glasersfeld, E. (1990). An exposition of constructivism: Why some like it radical. In R. B. Davis, C. A. Maher, & N. Noddings (Eds.), Constructivist views on the teaching and learning of mathematics (pp. 19-29). Reston, VA: National Council of Teachers of Mathematics.
Von Glasersfeld, E. (1996). Aspects of radical constructivism and its educational recommendations. In L. Steffe, et al. (Eds.), Theories of mathematical learning (pp. 307-314). Hillsdale, NJ: Lawrence Erlbaum Associates Publishers.
126

Wenger, R. H. (1987). Cognitive science and algebra learning. In A. H. Schoenfeld (Ed.), Cognitive science and mathematics education (pp. 217-251). Hillsdale, NJ: Lawrence Erlbaum Associates Publishers.
Williams, C. G. (1998). Using concept maps to assess conceptual knowledge of function. Journal for Research in Mathematics Education, 29, (4), 414-421.
Yerushalmy, M. (1991). Student perceptions of aspects of algebraic functions using multiple representation software. Journal of Computer Assisted Learning, 7, (1), 42-57.
Yerushalmy, M. (1997). Designing representations: Reasoning about functions of two variables. Journal for Research in Mathematics Education, 28, (4), 431-466.
127

APPENDIX A
MRSG 1010 COURSE SYLLABUS
128

INTER AMERICAN UNIVERSITY OF PUERTO RICOPONCE CAMPUS
DEPARTMENT OF SCIENCE AND TECHNOLOGY
COURSE SYLLABUSFALL 2000
I. General Information about the Course:Name: Mathematical ReasoningCode: MRSG 1010Credit Hours: Three (3)Prerequisites: A score no lower than the level established by the University in
the mathematics achievement test of the College Entrance Examination Board or its equivalent. Students whom performance is lower than the level established by the University, should take first a mathematics basic skills course. MRSG 1010 is a core course.
II. Course Description:It is focused in the application of the mathematical reasoning to outline procedures in order to solve problems. Estimation use, interpretation of graphs, equation solving and statistics. The study of the first level equations with one and two variables, systems of linear equations and their graphs, finance mathematics, representation of numeric information through graphs, measures of central tendency. It is emphasized the use of the calculator as important tool to work.
III. General Objectives:1. To describe the terminology and the mathematics concepts introduced in
the course.2. To use the calculator in a correct and appropriate way.3. To organize, represent, and interpret numeric information through
equations, tables, and graphs.
129

4. To solve linear equations in one or two variables in the set of real numbers.
5. To apply strategies and mathematical techniques to solve problems of the daily life.
6. To appraise the utility of mathematics in sciences, business, technology and arts.
IV. Course Content:Chapter 1 Basic Concepts1.3 Properties of real numbers and operations1.4 Order of operations
Chapter 2 Equations and Inequalities2.1 Solution of linear equations2.2 Formulas2.3 Applications to algebra2.4 Additional application problems2.5 Solution of linear inequalities2.6 Solution of equations and inequalities with absolute values
First Exam
Chapter 3 Graphs and functions3.1 The system of the Cartesian coordinates, distance formula between points,
and mid point formula3.2 Graphs of linear equations3.3 Forms of the linear equations: slope-y axes intercept and point-slope.3.4 Relations and functions3.5 Linear functions and not linear
Chapter 4 Systems of linear equations and inequalities4.1 Solution of systems of linear equations4.2 Systems of linear equations of third order4.3 Applications to the systems of linear equations4.4 Solution of systems of linear equations through determinants and Cramer
Rule4.5 Solution of systems of linear equations through matrixes.
Second Exam
Chapter 5 Polynomials and polynomials functions5.1 Exponents and scientific notation5.2 More about exponents5.3 Addition, difference and multiplication of polynomials5.4 Division of polynomials
130
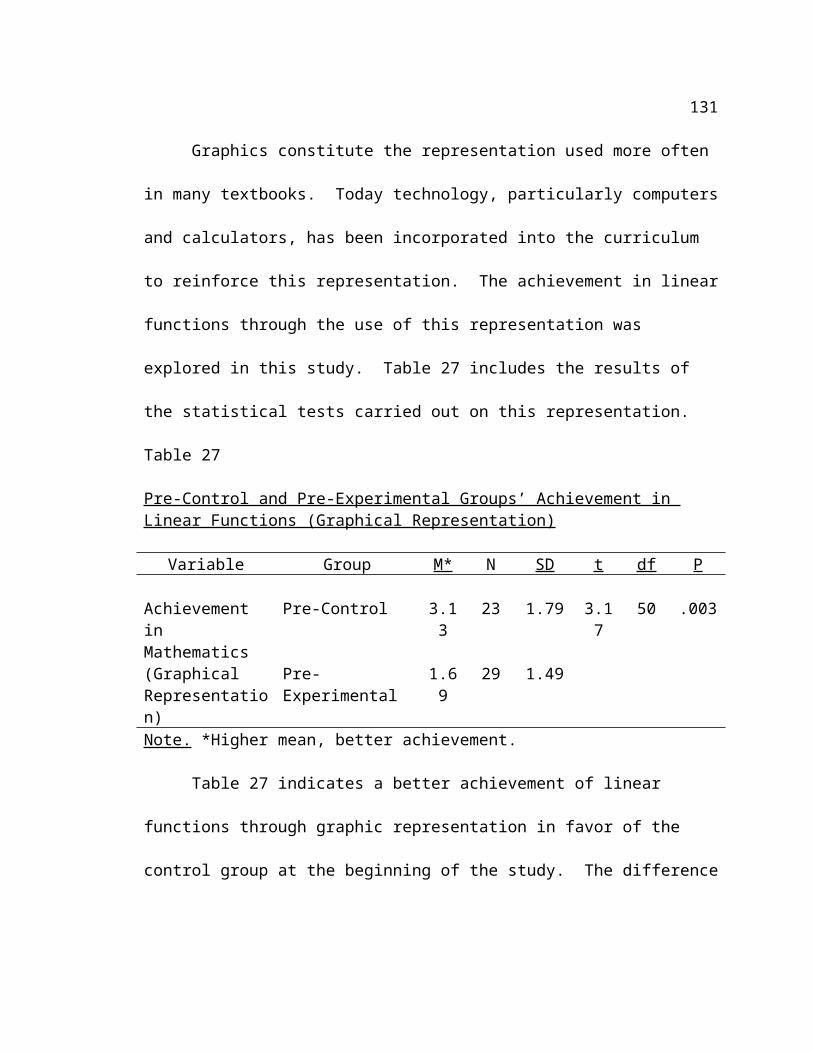
5.5 Polynomial functions
Chapter 6 Factorization6.1 Factorization by grouping6.2 Factorization of trinomials6.3 Formulas of special factorizations6.4 Solutions of equation through factorization
Third Exam
Problem solvingStrategies for problem solvingDefinition of statistics, population and sampleMeasures of central tendencyMeasures of dispersionFinance Mathematics
Fourth Exam
V. Evaluation Four exams……………………………………………………………………...400 Final exam………………………………………………………………………100 Special Assignments…………………………………………………………….100
Total Score………………………………………………………………………600
VI. Resources and materials
a. TextbookAngel, A. R. (2000). Álgebra Intermedia [Intermediate Algebra]. Fourth
Edition. Mexico: Prentice Hall Hispanoamericana, S.A.
b. Supplementary Book:Rodríguez-Ahumada, J. G., et al. (2000). Razonamiento Matemático,
Fundamentos y Aplicaciones [Mathematical Reasoning: Fundaments and Applications]. Second Edition. Mexico: International Thompson Editores, S.A.
c. EquipmentIt is strongly recommended that students bring daily to the classroom a
calculator (scientific or graphic) with statistical functions. It is suggested the TI-83 Plus from Texas Instruments.
131

APPENDIX B
STUDENT PROFILE FORM
132

STUDENT PROFILE FORM
Course Name: ___________________________________________________________
Course Number: ___________________________________________________________
Section Number: ___________________________________________________________
1. Identification Number: ______________________________
2. Please indicate your intended major:
_____ Computer Sciences/Mathematics
_____ Engineering (of any type)
_____ Natural or Physical Sciences (Biology, Chemistry, Physics, etc.)
_____ Education
_____ Commerce or Business related majors
_____ Humanities, Liberal Arts (English, History, etc.)
_____ Social Sciences (Psychology, Sociology, Social Work, etc.)
_____ Undecided
_____ Other. Please, specify: ______________________________
133

3. Please indicate the student status that best describes you:
_____ Freshman
_____ Sophomore, or Junior or Senior (circle one)
_____ Transfer student
_____ Other. Please, specify: ______________________________
4. Please indicate the enrollment status that best describes you:
_____ Full-time
_____ Part-time (more than one course)
_____ Single course-taker
5. For the current semester, when are your courses scheduled mainly:
_____ Daytime
_____ Evening
_____ Other
6. Please indicate how many full years of mathematics you took during grades 9-12:
_____ 1 year
_____ 2 years
_____ 3 years
_____ 4 years
7. Please provide the following information on the last mathematics course you have taken prior to this course:
How many years ago was that course taken?
_____ 0-1 year ago
134
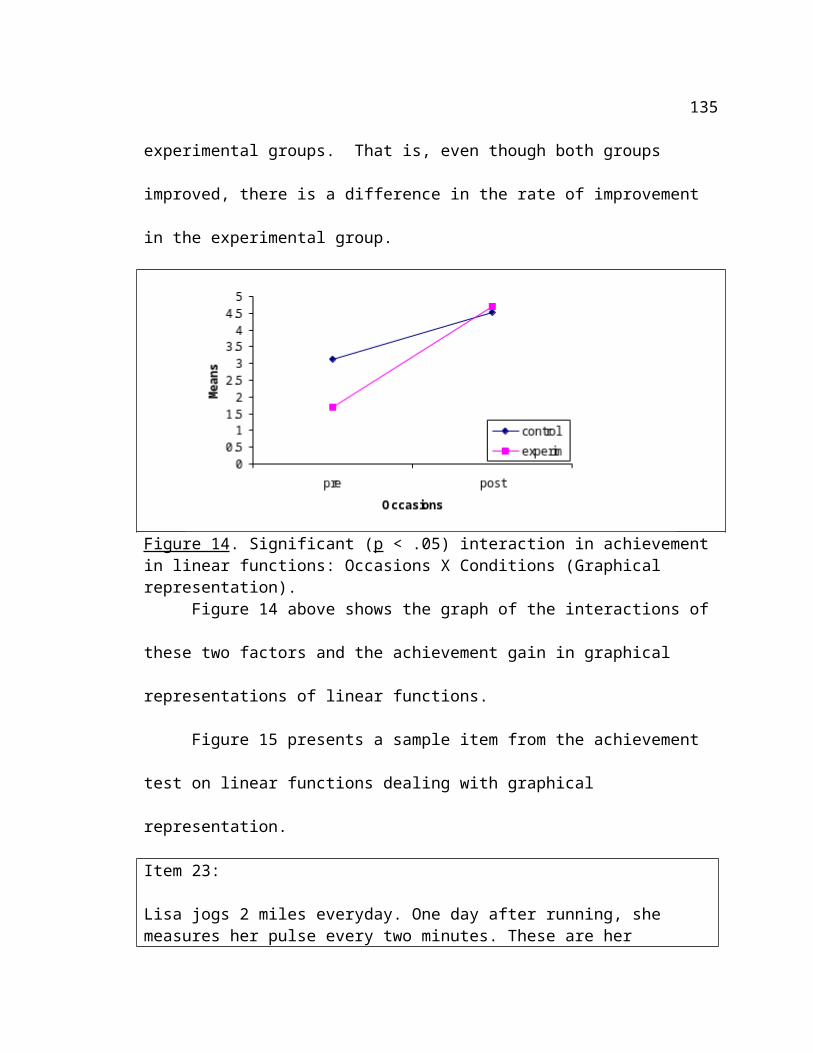
_____ 2-3 years ago
_____ 4-10 years ago
_____ More than 10 years ago
Where was that course taken?
_____ Public high school
_____ Private high school
_____ Community college
_____ Four-year college or university
_____ Other. Please, specify: _____________________________
Final letter grade in that course: _______________
8. Is this the first time you are taking this course?
__________ Yes __________ No
9. If you answered NO in question 8, please indicate why:
_____ Failed the course the first time.
_____ Dropped the course due to a failing grade.
_____ Dropped the course for other reasons.
_____ Did not fail the course, but I am repeating it for other reasons.
10. How many hours per week do you anticipate you will be working in a job during
this semester?
_____ 0-10 hours
_____ 11-20 hours
_____ 21-30 hours
135

_____ 31-39 hours
_____ Full-time (40 hours or more)
11. How often did you use the following types of technology in this course?
How often employed in this course?
Type of technology Notavailable
No atall
Occasionally,but not
frequentlyFrequently
Almostalways
a) Calculators: graphing, computational, etc.b) Email: one-on-one communication, online discussion groups, etc.c) Internet: World Wide Web, downloadable software, etc.d) Data Probes: Calculator-Based Laboratories (CBL’s) or Microcomputer-Based Laboratories (MBL’s), motion detectors and other sensorse) Computer Algebra Systems (CAS): Mathematica, etc.
f) Spreadsheets: Excelg) Other software packages: word processing, presentation graphics, etc.
136

APPENDIX CMATHEMATICS ATTITUDES SCALE
137

MATHEMATICS ATTITUDES SCALE
1. In the mathematics classes I took in the last two years of high school, I used a calculator to perform routine calculations (e.g., +, -, *, /, sin, log, exp, etc.):
Never Almost Never Seldom Frequently Almost Always
2. In the mathematics classes I took in the last two years of high school, I used a graphing calculator to graph functions:
Never Almost Never Seldom Frequently Almost Always
3. In order for me to learn mathematics, using a calculator or computer is helpful.
Strongly disagree
Disagree Neutral Agree Strongly agree
4. In order for me to learn mathematics, working with a partner is helpful:
Strongly disagree
Disagree Neutral Agree Strongly agree
5. In order for me to learn mathematics, lectures are helpful:
Strongly disagree
Disagree Neutral Agree Strongly agree
6. In order for me to learn mathematics, the textbook is helpful:
Strongly disagree
Disagree Neutral Agree Strongly agree
138

7. I prefer to do my mathematics homework alone:
Strongly disagree
Disagree Neutral Agree Strongly agree
8. I study for the majority of my math tests with other students:
Strongly disagree
Disagree Neutral Agree Strongly agree
9. I expect to use the mathematics that I will learn in this course in my future career:
Strongly disagree
Disagree Neutral Agree Strongly agree
10. It scares me to have to take mathematics:
Strongly disagree
Disagree Neutral Agree Strongly agree
11. It is important to know mathematics in order to get a good job:
Strongly disagree
Disagree Neutral Agree Strongly agree
12. Trial and error can often be used to solve a mathematics problem:
Strongly disagree
Disagree Neutral Agree Strongly agree
13. Learning mathematics involves mostly memorizing:
Strongly disagree
Disagree Neutral Agree Strongly agree
14. I am looking forward to taking more mathematics:
Strongly disagree
Disagree Neutral Agree Strongly agree
15. Mathematics is a good field for creative people:
139

Strongly disagree
Disagree Neutral Agree Strongly agree
16. No matter how hard I try, I still do not do well in mathematics:
Strongly disagree
Disagree Neutral Agree Strongly agree
17. Mathematics is harder for me than for most persons:
Strongly disagree
Disagree Neutral Agree Strongly agree
18. Mathematics is useful in solving everyday problems:
Strongly disagree
Disagree Neutral Agree Strongly agree
19. Most of mathematics has practical use on the job:
Strongly disagree
Disagree Neutral Agree Strongly agree
20. There is a little place for originality in solving mathematics problems:
Strongly disagree
Disagree Neutral Agree Strongly agree
21. Estimating is an important mathematics skill:
Strongly disagree
Disagree Neutral Agree Strongly agree
22. There are many different ways to solve most mathematics problems:
Strongly disagree
Disagree Neutral Agree Strongly agree
23. If I had my choice, this would be my last mathematics course:
Strongly disagree
Disagree Neutral Agree Strongly agree
24. New discoveries in mathematics are constantly made:
140

Strongly disagree
Disagree Neutral Agree Strongly agree
APPENDIX D
ACHIEVEMENT TEST (LINEAR FUNCTIONS)
141

ACHIEVEMENT TEST (LINEAR FUNCTIONS)
The purpose of this test is to explore your knowledge on linear equations and related concepts, in terms of their different representations: table, graph, algebraic and verbal. Show all your work, in the exercises that can require it.
Use the following figure to answer items 1 and 2.
1. The coordinates of point C are: __________
2. In what quadrant is point A located? __________
Refer to the following figure to answer items 3 and 4.
142

3. If point P is moved from a quadrant to other in the Cartesian plane and its new coordinate is by the form (-x, y), in what quadrant is point P now located?
4. If point P is now located in the x positive axis, then, what form has the coordinate of point P?
Refer to the illustration below to answer item 5.
5. The straight line joining the points (2, 3) and (2, 7) cuts the straight line joining the points (1, 4) and (6, 4) at the point:
A. (4, 2)B. (1, 4)C. (1, 3)D. (2, 3)E. (2, 4)
Refer to the information below to answer items 6 and 7:
143

The table below compares the height from which a ball is dropped (d) and the height to which it bounces (b).
d 50 80 100 150b 25 40 50 75
6. Do you think that the trend between d and b is linear? Why yes or no? Explain briefly your answer.
7. If so, state the equation that best describes the relationship between d and b.
Refer to the following table to answer item 8.
m -1 1 2 4n -1 3 5 9
8. The equation that better relate the variables m and n for the table shown above is:
A. n = mB. n = 3mC. n = -m2 + 1D. n = m2 + 1E. n = 2m + 1
9. In the Cartesian coordinate system, what is the equation of the straight line passing through the point (0, -5) and parallel to the straight line whose equation is y = 2x + 3?
A. x + 2y + 5 = 0B. 2x – y – 5 = 0C. 2x – 5y + 3 = 0D. 2x + y + 5 = 0
144

10. Which is the slope of these two linear equations?
11. Which is the relationship, if any, between the slopes of these two linear equations?
Refer to the following graph to answer item 12.
12. The equation of line l is y = 4x – 5. The equation of line m is y = 2x + 2. What is the solution of the simultaneous equations:
A. the coordinates of P1
B. the coordinates of P2
C. the coordinates of P3
D. the x value at P2 and the y value at P3
E. the y value at P2 and the x value at P3
13. What is the interpretation of the solution of these two linear equations? Explain.
145

Use the following graph to answer items 14-17.
14. The graph shows the distance traveled by a tractor during a period of four (4) hours. How fast is the tractor moving?
15. How far the tractor is in 1 hour?
16. In 3 hours?
17. In 10 hours?
15. 16. 17.
18. Suppose now that after the four (4) hours, the same tractor returns to its original starting point to stop working. Using as reference the graph showed above, draw a new graph describing this situation.
9
8
7
6
5
4
3
2
1
0 1 2 3 4 5 6 7 8 9
Use the following graph to answer item 19.
146

19. How much longer does it take for Car B to go 50 kilometers than it does for Car A to go to 50 kilometers?
Use the following graph to answer items 20 and 21.
20. Three hours after starting, Car A is how many kilometers ahead of Car B?
21. Which slope of the straight lines is bigger? The slope of the straight line of Car A or Car B? Explain briefly your answer.
147

Use the following information to answer item 22.
David plans to study how well sunflowers grow in different size pots. The graphs below show four possible outcomes of this experiment.
Which graph does the following statement best describe?
22. As the pot size increases, the plant height decreases. _______________________23. Lisa jogs 2 miles everyday. One day after running, she measures her pulse every
two minutes. These are the results. Her pulse rate was 140 beats per minute 2 minutes after running. It was 115 beats per minute after 4 minutes. It was 105 beats per minute after 6 minutes. It was 90 beats per minute after 8 minutes. It was 75 beats per minute after 10 minutes. Which of these graphs best shows her results?
148

24. Juan left his flashlight burn for 14 straight hours. He measured the amount of light given off (in lumens) at various times. He collected these data.
Time(hours)
Light Given Off(lumens)
0 9.52 8.53 8.5
149

5 6.08 4.214 0.6
Which graph best shows his results?
25. Lisa measured the height a ball bounced when it was dropped. When dropped 50 cm the ball bounced 40 cm. A 10 cm drop bounced 8 cm. A 30 cm drop bounced 24 cm. A 100 cm drop bounced 80 cm. A 70 cm drop bounced 56 cm. Which of the following graphs best describes these results?
150

APPENDIX E
SAMPLE ACTIVITY ON LINEAR EQUATIONS USING SPREADSHEETS
151

SPREADSHEET ACTIVITY: LINEAR GRAPHS AND SLOPE
Objectives:
152

Using the spreadsheets, students will identify the slope of the linear equation using its equation.
Students will examine the effects when the values of the slope and the y-intercept change.
Students will offer a verbal description on the interpretation and the uses that may have the linear equations and slope in other fields.
1. Consider the following linear equation: y = 3x – 5
Use spreadsheets and the suggested values to complete the table below,
A B
1 x y
2 -3
3 -2
4 -1
5 0
6 1
7 2
8 3
Then, construct the graph. Please, provide a printout of your work.
The value of the slope and the y intercept are:
Describe the inclination of the straight line:
In two or more sentences, briefly describe the relation that you can find between the inclination of the straight line and its slope.
2. Now, let examine what happens when the values of slope and y intercept change. In this case, let take a bigger values to the slope and y intercept. Consider for example the following equation:
153

y = 8x + 10
Using spreadsheets, complete the table below:
A B
1 x y
2 -3
3 -2
4 -1
5 0
6 1
7 2
8 3
Draw the graph of this new equation in the same Cartesian coordinates axes.
The value of the slope and the y intercept are:
Briefly describe what you can observe between these two graphics.
There is a common point between both graphs? If so, determine the coordinates of this point.
3. Let explore now, how if the linear graph when its slope is not a positive value. In this case, the slope could be negative or inclusive, zero.
Suggest one value for the slope and other for the y intercept:
154

y = x +
Using spreadsheets, construct your own table of values. The following table can help you. If you want, you can add some values.
A B
1 x y
2
3
4
5
6
7
8
The value of the slope and the y intercept are:
Using spreadsheets, construct the graph of your own linear equation, and answer the following questions:
What is your idea about what slope is?
Which is the biggest difference that you observed between the linear graph with positive slope and with negative slope? Explain.
Do you think that a slope could be bigger than other? How you can graphically show it? Use spreadsheets to justify your answer.
155

From your major or from a situation of the daily life, offer a description on tendencies that can be classified as linear. Explain your answer.
APPENDIX F
156

NO SIGNIFICANT INTERACTIONS ON TWO-WAY ANOVA ANALYSIS
157

NO SIGNIFICANT INTERACTIONS ON TWO-WAY ANOVA ANALYSIS
Table A
Two Way ANOVA on Achievement in Linear Functions: Cartesian Coordinates
Source SS df MS F PPre-Post 80.63 1 80.63 51.39 .000
Control-Experimental 1.90 1 1.90 1.21 .274
Interaction 5.63 1 5.63 3.59 .061
Table B
Two Way ANOVA on Achievement in Linear Functions: Graphs
Source SS df MS F PPre-Post 7.58 1 7.58 4.54 .036
Control-Experimental 10.39 1 10.39 6.23 .014
Interaction 5.35 1 5.35 3.20 .077
Table C
Two Way ANOVA on Achievement in Linear Functions: Symbolic Representation
Source SS df MS F PPre-Post 1.55 1 1.55 2.96 .089
Control-Experimental .001 1 .001 .02 .900
Interaction 1.05 1 1.05 2.00 .160
Table D
Two Way ANOVA on Achievement in Linear Functions: Tabular Representation
Source SS df MS F PPre-Post 3.13 1 3.13 4.52 .036
Control-Experimental 3.46 1 3.46 4.99 .028
158
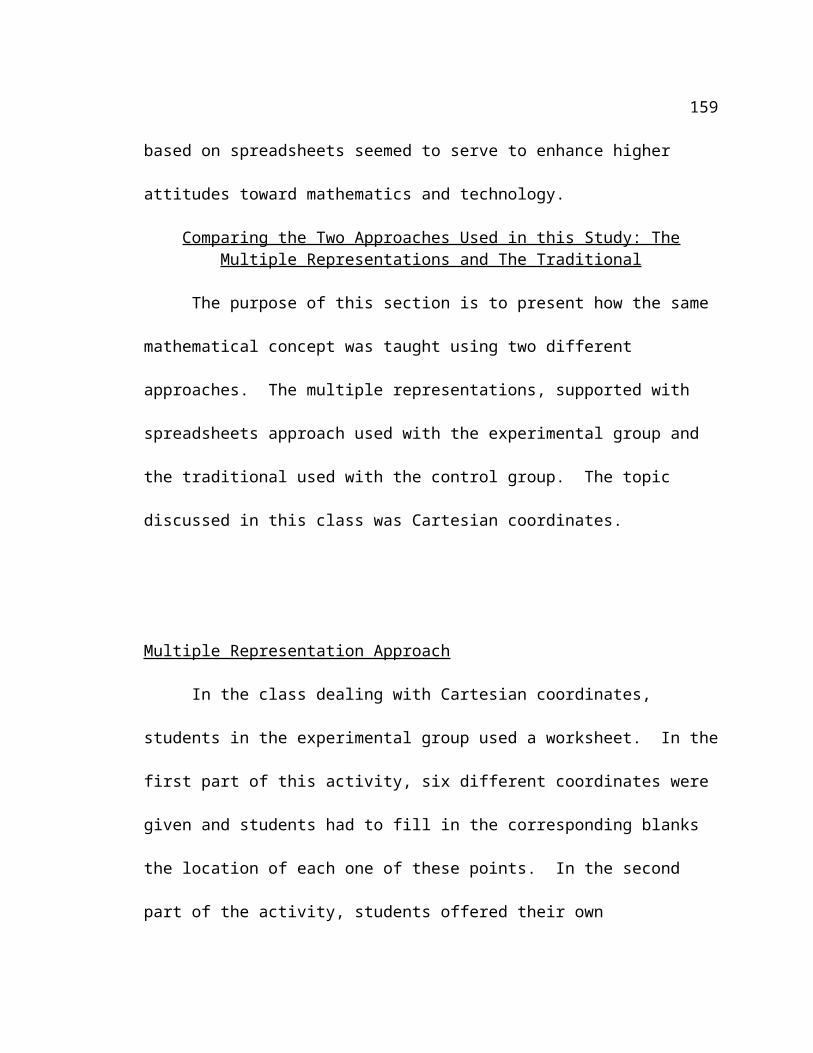
Interaction 2.40 1 2.40 3.46 .066VITA
Edgardo José Avilés-Garay was born on November 10, 1971 in Ponce, Puerto
Rico. He attended the Inter American University of Puerto Rico, receiving a Bachelor of
Science degree in Pure Mathematics, and a Bachelor of Arts degree in Secondary
Mathematics Teaching, both with the distinction of Magna Cum Laude in 1994. As
undergraduate student, he received the Barry M. Goldwater Scholarship for students in
science and mathematics majors in 1991. In his last year at Inter American University,
the Teachers Association of Puerto Rico awarded him the medal on excellence in pre-
service teaching. He has certification as teacher of mathematics from the Puerto Rico
Department of Education.
In 1996 he graduated from the Pontifical Catholic University of Puerto Rico with
a Master of Education degree, majoring in Curriculum and Teaching. He was admitted to
pursue his doctoral degree in Mathematics Education at the University of Illinois at
Urbana-Champaign on the fall semester of 1997.
He has taught mathematics and computers at middle and high school levels for
two years in private and public institutions. He started teaching algebra, precalculus and
calculus courses as lecturer of mathematics at Ponce Campus of the Inter American
University of Puerto Rico, since spring semester 1997. He returned to teach in the fall
semester of 2000.
Edgardo is member of the National Council of Teachers of Mathematics since
1993. He has served as a reviewer for NCTM professional journals for the last two years.
Since 1996, he is member of the Ponce Chapter of the Phi Delta Kappa, and was its
159

executive treasurer for two years. In 2000, he was invited to become a member of the Phi
Kappa Phi Honor Society, Urbana-Champaign Chapter.
160