chapter 1 - the university of bath's research portal · web viewas pore sizes of zeolites are...
TRANSCRIPT
Deactivation of PtH-ZSM-5 Bifunctional
Catalysts by Coke Formation during Benzene
Alkylation with Ethane
Li Min Chua
A thesis submitted for the degree of Doctor of Philosophy
University of Bath
Department of Chemical Engineering
March 2010
COPYRIGHT
Attention is drawn to the fact that copyright of this thesis rests with its author. A copy
of this thesis has been supplied on condition that anyone who consults it is understood
to recognise that its copyright rests with the author and they must not copy it or use
material from it except as permitted by law or with the consent of the author.
This thesis may be made available for consultation within the University Library and
may be photocopied or lent to other libraries for the purposes of consultation.
Acknowledgements
This thesis would not have been possible without the assistance and
encouragement from different sources in various ways.
I would like to first thank my supervisor, Dr Sean Rigby for his continuous
support and guidance throughout the course of this research. I would also like to
acknowledge Dr Dmitry Lukyanov, my second supervisor for the valuable and
constructive discussions on the reaction studies as well as assistance in other aspects of
the research.
I wish to thank Dr Tim Mays for his contributions towards my thesis.
Appreciation to Tanya Vazhnova for the training and assistance in the catalytic lab, to
Dr Karen Edler for performing the SAXS experiments, to Dr Gabriele Kociok-Kohnin
for carrying out the XRD experiments. Not forgetting the other administrative and
technical staff in the Department of Chemical Engineering, thank you for your support
during my time at the University. I would also like to express my gratitude to Dr Peter
Chigada who was very patient with me during the many hours spent teaching me
FORTRAN programming.
I am grateful to Engineering and Physical Sciences Research Council (EPSRC)
UK and the University of Bath for providing financial support for this project.
I would like to thank my parents, Robert Chua and Pauline Lim, and my sisters
for their constant love and motivational support that got me through the difficult times
of my PhD research. And finally, a special thanks to all my friends whom I have met
during my time in Bath for their friendship, emotional support, entertainment and care
that they have provided me while I was away from home.
i
Abstract
The alkylation of benzene with ethane was studied at 370 oC over two Pt-
containing ZSM-5 catalysts with SiO2/Al2O3 ratios of 30 and 80. While the benzene and
ethane conversion decreased with time-on-stream for the PtH-ZSM-5(30) catalyst, the
PtH-ZSM-5(80) catalyst demonstrated a stable performance. The deactivation of the
PtH-ZSM-5(30) catalyst was found to be more significant, when compared to the PtH-
ZSM-5(80) catalyst as a result of differences in the formation of coke. Results from gas
sorption and x-ray diffraction experiments showed that coke is preferentially formed
within the channel segments of the PtH-ZSM-5(30) catalyst as opposed to coke
deposition on the outside surface of the PtH-ZSM-5(80) crystallites, subsequently
blocking entrance to the zeolite channels.
The location of the coke deposition was found to affect the product selectivity of
the two PtH-ZSM-5 catalysts. The accessibility functions, derived from nitrogen and
argon sorption data, suggested that, with prolonged time-on-stream, the coke molecules
build up from the middle of the zeolite crystallites outwards towards the surface, as the
reaction was carried out over the PtH-ZSM-5(30) catalyst. Partial blockage of the
internal pore structure of the PtH-ZSM-5(30) catalyst decreased the diffusion length
within the crystallites. In contrast to the typical effect of coking, where the selectivity of
para- isomers would be enhanced with coke deposition, the effect of the reduction in
the diffusion length of the PtH-ZSM-5(30) crystallites is consistent with the decreasing
para-selectivity of the diethylbenzene (DEB) isomers with time-on-stream.
An investigation of the causes of coke locations was conducted, and the results
suggested that, the spatial distribution of Pt metal was responsible for the different
locations of coke observed. Surface reactions initiated coking in the intercrystalline
region of the PtH-ZSM-5(80) catalyst, as the Pt particles on the surface of the PtH-
ZSM-5(80) crystallites increased the difficulty of access for reactants to the interior of
the crystallites. Within the PtH-ZSM-5(30) catalyst, ethane dehydrogenation and
benzene alkylation took place in the micropore network as a result of preferential
intracrystalline deposition of Pt metal. Further conversions on the active sites within the
PtH-ZSM-5(30) crystallites thus lead intracrystalline coking.
ii

List of Publication and Presentations
List of Publication
1. L.M. Chua, T. Vazhnova, T.J. Mays, D.B. Lukyanov, S.P. Rigby. 2010.
Deactivation of PtH-MFI Bifunctional Catalysts by Coke Formation during Benzene
Alkylation with Ethane. Journal of Catalysis, 271, 401-412.
List of Presentations
1. Chua, LM, Vazhnova, T, Lukyanov, DB, Rigby, SP, (2009), ‘Deactivation by Coke
Formation of PtH-ZSM-5 Bifunctional Catalyst during Benzene Alkylation with
Ethane into Ethylbenzene’. 11th International Symposium on Catalyst Deactivation,
25-28 October 2009, Delft, The Netherlands (Oral Presentation)
2. Chua, LM, Vazhnova, T, Lukyanov, DB, Rigby, SP, (2009), ‘Pore Structure
Analysis of Bi-functional Zeolite Catalysis for Benzene Alkylation: Effect of
Deactivation by Coking’. 5th International Porous Material Workshop:
Characterisation of Porous Materials from Angstroms to Millimeters, 24-26 June
2009, New Brunswick, NJ, USA (Poster); Book of Abstracts, p. 87.
3. Chua, LM, Vazhnova, T, Lukyanov, DB, Rigby, SP, (2009), ‘Pore Structure
Modification by Coking during Benzene Alkylation with Ethane on Bi-functional
Zeolite Catalysts’. 5th Pacific Basin Conference on Adsorption Science and
Technology (PBAST 5), 25-27 May 2009, Singapore (Poster); Book of Abstracts,
Poster 99
4. Chua, LM, Vazhnova, T, Lukyanov, DB, Rigby, SP, (2008), ‘ Deactivation of Bi-
functional Zeolite Catalysts for Benzene Alkylation with Ethane into Ethylbenzene’.
14th International Congress on Catalysis, 13-18 July 2008, Seoul, Korea (Poster);
Book of Abstracts, PIII-64-55; Extended Abstracts (CD-ROM)
iii
5. Chua, LM, Vazhnova, T, Lukyanov, DB, Rigby, SP, (2008), ‘Pore Structure
Modification during Deactivation of Bi-functional Zeolite Catalysts for Benzene
Alkylation with Ethane into Ethylbenzene’. 8th International Symposium on the
Characterisation of Porous Solids (COPS-VIII), 10-13 June 2008, Edinburgh, UK
(Poster); Book of Abstracts, p.85
6. Chua, LM, Vazhnova, T, Lukyanov, DB, Rigby, SP, (2008), ‘Studies of The
Deactivation of Bi-functional Zeolite-based Catalysts for Benzene Alkylation’. 31st
Annual Meeting of British Zeolite Association, 31 March - 2 April 2008, Keele, UK
(Oral Presentation)
7. Chua, LM, Vazhnova, T, Lukyanov, DB, Rigby, SP, (2008), ‘Characterisation of
ZSM-5 Catalyst for Benzene Alkylation with Ethane’. Catalysis: Fundamental and
Practice Summer School, 3-7 September 2007, Liverpool, UK (Poster)
iv
Table of Contents
Acknowledgements...........................................................................................................i
Abstract............................................................................................................................ii
List of Publication and Presentations...........................................................................iii
Table of Contents.............................................................................................................v
List of Figures..................................................................................................................x
Abbreviation................................................................................................................xvii
Nomenclatures............................................................................................................xviii
Chapter 1 : Introduction...........................................................................................1
1.1 Background........................................................................................................1
1.2 Thesis Structure.................................................................................................3
1.3 References.........................................................................................................4
Chapter 2 : Introduction to Zeolites and Synthesis of Bifunctional Zeolite
Catalysts ...................................................................................................................6
2.1 Introduction.......................................................................................................6
2.2 Catalyst Selection for the Production of Ethylbenzene by Benzene Alkylation
with Light Alkanes........................................................................................................6
2.3 Zeolites..............................................................................................................9
2.3.1 Characteristics of Zeolites.......................................................................11
2.3.2 Zeolite Modification................................................................................13
2.3.3 ZSM-5 Zeolite.........................................................................................14
2.4 Bifunctional Zeolite Catalysts.........................................................................16
2.4.1 Preparation Method.................................................................................16
2.4.2 Calcination and Reduction......................................................................18
2.4.3 Metal Loading.........................................................................................19
2.5 Synthesis of the Bifunctional PtH-MFI Catalyst for Benzene Alkylation
Reaction with Ethane...................................................................................................19
2.5.1 Calcination...............................................................................................20
2.5.2 Impregnation............................................................................................20
v
2.5.3 Preparation of Catalyst Fractions............................................................22
2.6 Conclusion.......................................................................................................22
2.7 References.......................................................................................................23
Chapter 3 : Benzene Alkylation with Ethane over PtH-ZSM-5 Catalysts.........27
3.1 Introduction.....................................................................................................27
3.2 Catalyst and Process Development in the Commercial Ethylbenzene
Production Process......................................................................................................27
3.3 Benzene Alkylation with Light Alkanes.........................................................28
3.3.1 Conversion of Light alkanes into Light Alkenes and Aromatic
Hydrocarbons..........................................................................................................29
3.3.2 Benzene Alkylation with Light Alkanes.................................................33
3.4 Experimental Materials and Methodology......................................................35
3.4.1 Experimental Set-up (Preparing the catalytic rig)...................................35
3.4.2 Catalyst Pre-treatment.............................................................................36
3.4.3 Catalytic Experiments.............................................................................38
3.5 Calculations.....................................................................................................39
3.5.1 Conversion and selectivity calculations..................................................39
3.5.2 Thermodynamic Conversion Calculations..............................................40
3.6 Results and Discussions..................................................................................42
3.6.1 Effect of time-on-stream (TOS) on the performance of the 1 wt% PtH-
ZSM-5(30) catalyst..................................................................................................42
3.6.2 Effect of TOS on shape selectivity reactions for the 1 wt% PtH-ZSM-
5(30) catalyst...........................................................................................................50
3.6.3 Effect of Acidity on Benzene Alkylation with Ethane............................52
3.6.4 Effect of acidity on product distribution.................................................55
3.7 Conclusions.....................................................................................................59
3.8 References.......................................................................................................59
Chapter 4 : Pore Structure Modification by Coking during Benzene Alkylation
with Ethane .................................................................................................................62
4.1 Introduction.....................................................................................................62
4.2 Theory..............................................................................................................65
4.2.1 Gas Sorption............................................................................................65
4.3 Experimental Methods.....................................................................................79
vi

4.3.1 Fourier Transform Infrared (FT-IR)........................................................79
4.3.2 Thermogravimetric Analysis (TGA).......................................................80
4.3.3 X-Ray Diffraction (XRD)........................................................................81
4.3.4 Electron Microscopy...............................................................................81
4.3.5 Gas Sorption............................................................................................81
4.4 Results.............................................................................................................84
4.4.1 IR Spectroscopy.......................................................................................84
4.4.2 Thermogravimetric Characterisation of Coke Component.....................85
4.4.3 X-Ray Diffraction....................................................................................89
4.4.4 Scanning Electron Microscopy................................................................91
4.4.5 Nitrogen and argon sorption....................................................................94
4.5 Discussion......................................................................................................109
4.5.1 Variation in the Characteristic of Coke Deposits with TOS.................109
4.5.2 Pore Structure Evolution with Deposition of Coke...............................111
4.5.3 Location of Coke Deposition.................................................................112
4.6 Conclusions...................................................................................................113
4.7 References.....................................................................................................114
Chapter 5 : Monte Carlo Simulation...................................................................117
5.1 Introduction...................................................................................................117
5.2 Percolation Theory........................................................................................117
5.2.1 Application of percolation theory in this study.....................................119
5.2.2 Analysis of catalyst deactivation by coke formation in a ZSM-5 lattice –
a percolation approach...........................................................................................120
5.3 Diffusion in Zeolites......................................................................................121
5.4 Construction of Lattices................................................................................124
5.4.1 Cubic Lattice.........................................................................................124
5.4.2 ZSM-5 Lattice.......................................................................................125
5.5 Simulation Methods.......................................................................................126
5.5.1 Accessibility Simulation........................................................................126
5.5.2 Self-diffusivity Monte-Carlo Simulations.............................................127
5.6 Calculations...................................................................................................128
5.6.1 Accessibility Study................................................................................128
5.6.2 Calculating/Estimation of Self-Diffusion Coefficient, Ds.....................130
vii

5.7 Results and Discussion..................................................................................131
5.7.1 Accessibility..........................................................................................131
5.7.2 Random walk / Mean square displacement...........................................137
5.8 Conclusion.....................................................................................................140
5.9 References.....................................................................................................140
Chapter 6 : Ethane Adsorption and Mass Transport Kinetics.........................142
6.1 Introduction...................................................................................................142
6.2 Theory............................................................................................................142
6.3 Previous Studies............................................................................................144
6.4 Experimental Procedure................................................................................144
6.4.1 Sample Preparation................................................................................145
6.4.2 Adsorption Analysis..............................................................................145
6.4.3 Calculations...........................................................................................145
6.5 Results and Discussion..................................................................................148
6.5.1 Ethane Adsorption Isotherms................................................................148
6.5.2 Isosteric Heat of Adsorption, Qst...........................................................153
6.5.3 Mass Transfer Coefficient (MTC).........................................................155
6.6 Conclusions...................................................................................................158
6.7 References.....................................................................................................159
Chapter 7 : Investigation of the Cause of Coke Location during Benzene
Alkylation with Ethane...............................................................................................161
7.1 Introduction...................................................................................................161
7.2 Theory............................................................................................................161
7.2.1 Nuclear Magnetic Resonance (NMR) Theory.......................................162
7.3 Experimental Procedure................................................................................167
7.3.1 Nitrogen Sorption..................................................................................167
7.3.2 PFG NMR Experiments........................................................................167
7.4 Results...........................................................................................................169
7.4.1 Nitrogen Sorption..................................................................................169
7.4.2 PFG NMR Results.................................................................................171
7.4.3 Discussion..............................................................................................176
7.5 Conclusion.....................................................................................................178
7.6 References.....................................................................................................179
viii
Chapter 8 : Conclusions and Future Work.........................................................181
8.1 Conclusions...................................................................................................181
8.2 Future Work...................................................................................................186
8.3 References.....................................................................................................188
Appendix...........................................................................................................................i
A1 – Gas Chromatogram (GC) Analysis....................................................................i
A1-1 – Typical chromatogram of chemical components detected by TCD...............i
A1-2 – Typical chromatogram of chemical components detected by FID................i
A2 – Thermodynamic Calculations..........................................................................iii
A2-1 – Benzene Alkylation with Ethane.................................................................iii
A2-2 – Ethane Dehydrogenation..............................................................................iv
A3 – Alkylation of Benzene with Ethane Experimental Data................................vi
A3-1 – Concentration of products (mol %) produced over PtH-ZSM-5(30) catalyst
at 370oC....................................................................................................................vi
A3-2 – Concentration of products (mol %) produced over PtH-ZSM-5(80) catalyst
at 370oC..................................................................................................................viii
A4 – Fortran Programming........................................................................................x
A4-1 – Cubic Lattice Generation...........................................................................xiii
A4-2 – ZSM-5 Lattice Generation.......................................................................xviii
A4-3 – ZSM-5 Accessibility Program..................................................................xxix
A4-4 – ZSM-5 Random Walk..................................................................................xl
ix
List of Figures
Figure 1.1 – Steps taken to determine the coking behaviour of bifunctional zeolite
catalyst during benzene alkylation with ethane.................................................................4
Figure 2.1 - Basic Structure of Zeolite (Adapted from ref [26]).....................................10
Figure 2.2 - Interconversion of Brønsted and Lewis Acid Sites (Adapted from ref [27])
.........................................................................................................................................11
Figure 2.3 - Framework of MFI Type Zeolite [40].........................................................15
Figure 2.4 - Pore Structure of H-ZSM-5 [20]..................................................................15
Figure 2.5 – Temperature profile for calcination of NH4ZSM-5 catalyst.......................20
Figure 2.6 - Temperature profile for calcination process................................................22
Figure 3.1 - General reaction network for benzene alkylation with light alkanes Adapted
from ref [3]......................................................................................................................29
Figure 3.2 - Reactor Profile.............................................................................................36
Figure 3.3 - Catalyst Activation with Air Temperature Profile.......................................37
Figure 3.4 – Hydrogen Treatment Temperature Profile..................................................37
Figure 3.5 – Effect of TOS on ethane (-■-) and benzene (-●-) conversion.....................42
Figure 3.6 – Effect of TOS on the ethene (-■-) concentration........................................44
Figure 3.7 – Effect of TOS on hydrogen (-■-) concentration.........................................44
Figure 3.8 – Effect of TOS on methane (-■-) concentration...........................................46
Figure 3.9 – Effect of TOS on EB (-■-) concentration...................................................46
Figure 3.10 – Effect of TOS on meta-DEB (-■-) and para-DEB (-●-) concentration....47
Figure 3.11 – Effect of TOS on the selectivity of meta-DEB (-■-) and para-DEB (-●-)
.........................................................................................................................................50
Figure 3.12 – Effect of TOS on the selectivity of ortho-xylene (-■-) and meta- + para-
xylene (-●-)......................................................................................................................51
Figure 3.13 – Comparison of ethane (-■-) and benzene (-●-) conversion on PtH-ZSM-
5(30) catalyst...................................................................................................................53
Figure 3.14 – Comparison of ethane (-■-) and benzene (-●-) conversion on PtH-ZSM-
5(80) catalyst...................................................................................................................53
Figure 3.15 – Comparison of ethene selectivity in the aromatic products for PtH-ZSM-
5(30) (-●-) and PtH-ZSM-5(80) (-■-) catalyst................................................................54
x
Figure 3.16 – Comparison of EB selectivity in the aromatic products for PtH-ZSM-
5(30) (-●-) and PtH-ZSM-5(80) (-■-) catalyst................................................................56
Figure 3.17 – Variations of meta-DEB (-■-) and para-DEB (-●-) isomer selectivity with
TOS over PtH-ZSM-5(30) catalyst.................................................................................57
Figure 3.18 – Variations of meta-DEB (-■-), para-DEB (-●-) and ortho-DEB (-▲-)
isomer selectivity with TOS over PtH-ZSM-5(80) catalyst............................................58
Figure 3.19 – Comparison of meta-DEB (-■-), para-DEB (-●-) and ortho-DEB (-▲-)
isomer selectivity over PtH-ZSM-5(80) catalyst with meta-DEB (-▼-) and para-DEB
(-♦-) isomer selectivity over PtH-ZSM-5(30) catalyst, with TOS...................................58
Figure 4.1 – Various types of pores. Modified from ref [16]..........................................66
Figure 4.2 - Adsorption Process......................................................................................68
Figure 4.3 – The six main types of physisorption isotherms, according to IUPAC
classification [15]............................................................................................................70
Figure 4.4 – Types of Hysteresis Loop [15]....................................................................74
Figure 4.5 – V(Po-P) vs P/Po for the fresh PtH-ZSM-5(30) catalyst...............................84
Figure 4.6 – IR spectra of fresh (―) and 48 hour coked (―) PtH-ZSM-5(30) catalysts85
Figure 4.7 – Thermogravimetric (TG) profile for fresh (─), 4 h (─), 24 h (─) and 48 h
(─) coked PtH-ZSM-5(30) catalysts...............................................................................86
Figure 4.8 – Thermogravimetric (TG) profile for fresh (─), 4 h (─), and 48 h (─) coked
PtH-ZSM-5(80) catalysts.................................................................................................86
Figure 4.9 – dTG profile for fresh (─), 4 h (─), 24 h (─) and 48 h (─) coked PtH-ZSM-
5(30) catalysts..................................................................................................................88
Figure 4.10 – dTG profile for fresh (─), 4 h (─), and 48 h (─) coked PtH-ZSM-5(80)
catalysts...........................................................................................................................88
Figure 4.11 – XRD data for fresh (─) and coked PtH-ZSM-5(30) samples after 4 h (─),
24 h (─) and 48 h (─)TOS...............................................................................................89
Figure 4.12 – XRD data for fresh (─) and coked PtH-ZSM-5(80) samples after 4 h (─),
and 48 h (─) TOS............................................................................................................90
Figure 4.13 – Backscattered images of fresh (A), 4 h coked (B), 24 h coked (C), and 48
h coked (D) PtH-ZSM-5(30) catalysts............................................................................91
Figure 4.14 – Backscattered images of fresh (A), 4 h coked (B), and 48 h coked (C)
PtH-ZSM-5(80) catalysts.................................................................................................92
Figure 4.15 – Backscattered image of H-ZSM-5(30) (A) and H-ZSM-5(80) (B) catalysts
.........................................................................................................................................92
xi
Figure 4.16 – Effect of TOS on the concentration of Pt particles on the surface of the
PtH-ZSM-5(30) crystallites.............................................................................................93
Figure 4.17 – Effect of TOS on the concentration of Pt particles on the surface of the
PtH-ZSM-5(80) crystallites.............................................................................................93
Figure 4.18 – Nitrogen sorption isotherms at 77 K: (-■-) H-ZSM-5(30) heated until
sample weight remained constant, (-●-) H-ZSM-5(30) heated overnight.......................95
Figure 4.19 – Nitrogen sorption isotherms at 77 K: (-■-) 4h coked PtH-ZSM-5(30)
heated until sample weight remained constant, (-●-) 4 h coked PtH-ZSM-5(30) heated
overnight..........................................................................................................................95
Figure 4.20 – Reproducibility of nitrogen sorption isotherms of PtH-ZSM-5(30) : (-■-)
Isotherm 1, (-●-) Isotherm 2............................................................................................96
Figure 4.21 – Reproducibility of nitrogen sorption isotherms of 48 h coked PtH-ZSM-
5(30): (-■-) Isotherm 1, (-●-) Isotherm 2........................................................................97
Figure 4.22 – Nitrogen sorption isotherms for 48 h coked PtH-ZSM-5(30) catalysts
(-■-) freshly prepared and (-●-) samples kept for 1 year................................................98
Figure 4.23 – Nitrogen (-●-) and argon (-■-) sorption isotherms for fresh PtH-ZSM-
5(30) catalyst...................................................................................................................99
Figure 4.24 – Nitrogen adsorption isotherms for fresh PtH-ZSM-5(30) (-■-) and PtH-
ZSM-5(80) (-●-) catalysts.............................................................................................101
Figure 4.25 – Nitrogen adsorption isotherms for fresh (-■-), 4 h (-●-), 24 h (-▲-) and 48
h (-▼-) coked PtH-ZSM-5(30) catalysts.......................................................................103
Figure 4.26 – Argon adsorption isotherms for fresh (-■-), 4 h (-●-), 24 h (-▲-) and 48 h
(-▼-) coked PtH-ZSM-5(30) catalysts..........................................................................103
Figure 4.27 – Semi log plot of nitrogen adsorption isotherms for fresh (-■-), 4 h (-●-),
24 h (-▲-) and 48 h (-▼-) coked PtH-ZSM-5(30) catalysts.........................................104
Figure 4.28 – Semi log plot of argon adsorption isotherms for fresh (-■-), 4 h (-●-), 24 h
(-▲-) and 48 h (-▼-) coked PtH-ZSM-5(30) catalysts.................................................104
Figure 4.29 – Nitrogen adsorption isotherms for fresh (-■-), 4h (-●-) and 48h (-▼-)
coked PtH-ZSM-5(80) catalysts....................................................................................105
Figure 4.30 – Argon adsorption isotherms for fresh (-■-), 4h (-●-) and 48h (-▼-) coked
PtH-ZSM-5(80) catalysts...............................................................................................105
Figure 4.31 – Semi log plot of nitrogen adsorption isotherms for fresh (-■-), 4h (-●-)
and 48h (-▼-) coked PtH-ZSM-5(80) catalysts............................................................106
xii

Figure 4.32 – Semi log plot of argon adsorption isotherms for fresh (-■-), 4h (-●-) and
48h (-▼-) coked PtH-ZSM-5(80) catalysts...................................................................106
Figure 4.33 – Conversion of benzene (-■-) vs coke content (-●-) with TOS for the PtH-
ZSM-5(30) catalyst........................................................................................................110
Figure 4.34 – Pore size distribution for fresh (─), 4 h (─), 24 h (─) and 48 h (─) coked
PtH-ZSM-5(30) catalysts...............................................................................................111
Figure 5.1 – Representation of real pore structure on a cubic and Bethe lattice – adapted
from reference [6]..........................................................................................................118
Figure 5.2 – Square lattice with different bond occupational probability, pb................119
Figure 5.3 – Effect of pore diameter on diffusivity and diffusional activation energy.
Adapted from reference [12].........................................................................................122
Figure 5.4 – Cubic lattice model; (-●-) sites and (-●-) bonds.......................................125
Figure 5.5 – Lattice model of ZSM-5; (-●-) sites and (-●-) bonds................................126
Figure 5.6 – Accessibility fraction, F as a function of unblocked pores, f for bond
percolation on a simple cubic lattice : Comparison of results from Liu et al. [17] (-■-)
and our simulated data (-●-)..........................................................................................131
Figure 5.7 – Effect of network size on the accessibility for Z=6: L=21 (-■-), L=41 (-●-)
and L=61 (-▲-)..............................................................................................................132
Figure 5.8 – Accessibility fraction, F as a function of unblocked pores, f for site (-■-)
and bond (-●-) percolation on a simple cubic lattice.....................................................132
Figure 5.9 – Effect of network size on the accessibility for ZSM-5 lattice : L=24 (-■-),
L =48 (-●-), L =96 (-▲-)...............................................................................................134
Figure 5.10 – Accessibility plot – No percolation (Dash line), Accessibility in a ZSM-5
lattice assuming random deposition of coke (Solid line), nitrogen adsorption data for
PtH-ZSM-5(30) coked samples after 4 h (●), 24 h (▲), and 48 h (■) TOS.................135
Figure 5.11 – Accessibility plot – No percolation (Dash line), Accessibility in a ZSM-5
lattice assuming random deposition of coke (Solid line), argon adsorption data for PtH-
ZSM-5(30) coked samples after 4 h (●), 24 h (▲) and, 48 h (■) TOS.........................136
Figure 5.12 – Self-diffusivities as a function of occupancy for a simple cubic (-■-) and a
ZSM-5 (-●-) lattice........................................................................................................137
Figure 5.13 – Normalised diffusivity for various fractional occupancies and different
percentages of blocked sites in ZSM-5 lattice model: (-■-) 0% blocked,.....................139
Figure 6.1 – Schematic diagram of an ideal and real pressure step, and the
corresponding change in the mass of the sample with time..........................................143
xiii

Figure 6.2 – Mass up take curve (■) for pressure step from P/Po of 0.00172 to 0.00196
from ethane adsorption experiment on PtH-ZSM-5(30) sample after 48 hours on-stream.
.......................................................................................................................................147
Figure 6.3 – Ethane adsorption isotherms for fresh PtH-ZSM-5(30) catalyst at 10oC
(-■-), 20 oC (-●-) and 30 oC (-▲-).................................................................................149
Figure 6.4 – Ethane adsorption isotherms for fresh (-■-), 4 h (-●-), 24 h (-▲-) and 48 h
(-▼-) coked PtH-ZSM-5(30) catalysts at 30 oC............................................................151
Figure 6.5 – Ethane adsorption isotherms for fresh (-■-), 4 h (-●-), and, 48 h (-▼-)
coked PtH-ZSM-5(80) catalysts at 30 oC......................................................................151
Figure 6.6 – Variation of isosteric heat of sorption, Qst for fresh (-■-), 4 h coked (-●-),
24 h coked (-▲-) and 48 h coked (-▼-) PtH-ZSM-5(30) catalyst................................153
Figure 6.7 – Ethane adsorption isotherm for PtH-ZSM-5(30) catalyst coked for 48 hours
at 30 oC..........................................................................................................................156
Figure 6.8 – Variation of LDF mass transfer coefficients with TOS for PtH-ZSM-5(30)
(-■-) and PtH-ZSM-5(80) (-●-) at ethane loading of 6 molecules per unit cell............157
Figure 7.1 – A spinning nucleus with a magnetic moment, μ (left) and a Cartersian
coordinate frame with the motion of nucleus represented as a vector moving on the
surface of a cone (right) (Adapted from ref [3])............................................................162
Figure 7.2 – NMR spin echo pulse sequence [4]...........................................................163
Figure 7.3 – Vector model representation of the spin echo pulse sequence [2]............164
Figure 7.4 – NMR pulse sequence – pulsed gradient spin echo sequence where pulsed
field gradient, g is applied (Adapted from ref [4])........................................................165
Figure 7.5 – NMR experimental set-up for diffusion measurement.............................168
Figure 7.6 – Nitrogen sorption isotherms for H-ZSM-5(30) (-■-) and PtH-ZSM-5(30)
(-●-) catalysts.................................................................................................................169
Figure 7.7 – Nitrogen sorption isotherms for H-ZSM-5(80) (-■-) and PtH-ZSM-5(80)
(-●-) catalysts.................................................................................................................170
Figure 7.8 – Comparison of log attenuation plot for bulk liquid C6H12 (-■-) and C8H16
(-●-)...............................................................................................................................171
Figure 7.9 – Diffusion coefficient, DPFG of C6H12 imbibed in PtH-ZSM-5(30) (-■-) and
PtH-ZSM-5(80) (-▲-) catalysts as a function of diffusion time, ∆..............................173
Figure 7.10 – Diffusion coefficient, DPFG of C8H16 imbibed in PtH-ZSM-5(30) (-■-) and
PtH-ZSM-5(80) (-▲-) catalysts as a function of diffusion time, ∆..............................174
xiv

Figure 7.11 – Tortuosity, τp of PtH-ZSM-5(30) (-■-) and PtH-ZSM-5(80) (-▲-)
catalysts as a function of diffusion time, ∆ for C6H12 probe molecules.........................174
Figure 7.12 – Tortuosity, τp of PtH-ZSM-5(30) (-■-) and PtH-ZSM-5(80) (-▲-)
catalysts as a function of diffusion time, ∆ for C8H16 probe molecules.........................175
xv
List of Tables
Table 1 – Molecular weight of various components.......................................................21
Table 3-1 – Thermodynamic data at 298 K [25].............................................................40
Table 4-1 – Definition associated with porous solids [17]..............................................67
Table 4-2 - Comparison of Physical and Chemical Adsorption......................................68
Table 4-3 – Values of coke content for PtH-ZSM-5 catalysts after different TOS. The
coke content measured has a standard error of ± 0.03 %................................................87
Table 4-4 – Volume of coke deposited in PtH-ZSM-5 catalysts.....................................87
Table 4-5 – Modified-BET Surface Area for PtH-ZSM-5(30) and PtH-ZSM-5(80)
catalysts at different TOS..............................................................................................107
Table 4-6 – Results of Langmuir and BET composite model fit to (i) nitrogen and argon
(ii) adsorption isotherms for PtH-ZSM-5(30) and PtH-ZSM-5(80) catalysts...............109
Table 5-1 – ZSM-5 channel dimensions [18]................................................................129
Table 5-2 – Volume of ZSM-5 channels in 1 unit cell..................................................129
Table 5-3 – Percolation threshold, pc for simple cubic and ZSM-5 lattice...................134
Table 6-1 – ZSM-5/Silicalite-1 Channel Lengths [10]..................................................146
Table 6-2 – Sorption Capacities for ZSM-5/Silicalite-1...............................................150
Table 6-3 – Variation of adsorption capacity of PtH-ZSM-5 with TOS.......................152
Table 7-1 – Results of Langmuir and BET composite model fit to nitrogen adsorption
isotherms for H-ZSM-5 and PtH-ZSM-5 catalysts.......................................................170
Table 7-2 – Comparison of bulk diffusion coefficient, DPFG of C6H12 and C8H16 in C10
pellets at diffusion time, ∆ = 0.05 s...............................................................................172
Table 7-3 – RMSD of C6H12 and C8H16 imbibed within PtH-ZSM-5 catalysts.............173
xvi
Abbreviation
B Benzene
BSE Back-scattered electron
C2 / C2H6 Ethane
DEB Diethylbenzene
EB Ethylbenzene
FCC Fluid catalytic cracking
FTIR Fourier-transformed infra-red
GC Gas chromatogram
H+ Acid site
LDF Linear driving force
M Metal site
Mx/n[(AlO2)x(SiO2)y].zH2O General formula of zeolite
NMR Nuclear magnetic resonance
PFG Pulsed field gradient
PPCP Protonated pseudo-cyclopropane
PSD Pore size distribution
SBU Secondary building units
SEM Scanning electron microscopy
TEB Triethylbenzene
TEM Transmission electron microscopy
TGA Thermogravimetric analysis
TOS Time-on-stream
TPD Temperature programmed desorption
XRD X-ray diffraction
xvii
Nomenclatures
Mean squared displacement
[p] Equilibrium pressure Pa
∆ Diffusion time s
a Sphere radius/diffusion length m
Ao Pre-exponential factor
Bo Applied magnetic field Gauss
CB
Concentration of benzene in the reaction
mixturemol %
CB0 Initial concentration of benzene mol %
CC2 Concentration of ethane in the reaction mixture mol %
Ci
Concentration of species i in the reaction
mixturemol %
Ci0 Initial concentration of species i mol %
Cp Specific heat capacity kJ mol-1 K-1
D Effective diffusion coefficient m2 s-1
D/a2 Diffusional time constant s
Do Self-diffusivity at zero coverage m2 s-1
DPFG
Self-diffusion coefficient measured by PFG
experimentsm2 s-1
Ds Self-diffusion coefficient m2 s-1
Dt Transport diffusion coefficient m2 s-1
ED Activation energy for diffusion J mol-1
F Accessibility fraction
f Total fraction of unplugged pores
fb Bond occupation probability
fbc Bond percolation threshold
fs Site occupation probability
fsb Site-bond occupation probability
fsbc Site-bond percolation threshold
fsc Site percolation threshold
g Magnitude of the gradient pulse G cm-1
xviii
H Henry’s constant
I Nuclear spin quantum number
k Mass transfer coefficient s-1
kD
numerical factor which depends on the
dimensionality of the system
Kp Equilibrium Constant
LNumber of bonds between one side of the
lattice and another
M(∞) Equilibrium mass uptake mg
M(t) Mass uptake at time t mg
P/Po Relative pressure
Pe Equilibrium pressures Pa
Po Saturation vapour pressure Pa
qexp Experimental adsorption capacity molecule per unit cell
Qst Heat of adsorption kJ mol-1
qtheo Theoretical adsorption capacity molecule per unit cell
R Gas constant J mol-1 K-1
R2 Regression coefficient
Si Selectivity of species i mol %
t Time s
T Temperature oC / K
t Total time for successful and unsuccessful hops
u Random number
V(t=0) Pore volume for the fresh catalyst cm3 g-1
V(t=t)Externally accessible pore volume of the coked
catalyst at different TOScm3 g-1
Vc(t=TOS) Volume of coke at different TOS cm3 g-1cat
x Spatial coordinate
Xben Conversion of benzene %
Y Yield %
Z Coordination number
Γ constant amount adsorbed mg mg-1
γ Magnetogyric ratio rad s-1 T-1
xix

δ Gradient pulse duration s
ΔG Gibbs free energy kJ mol-1
ΔH Differential molar enthalpy of adsorption kJ mol-1
ΔS Entropy kJ mol-1 K-1
Δt Time interval between each attempted hops
ε Voidage
θ Occupancy
λ Jump distance m
ν Frequency of the Larmor precession s-1
τ Correlation time s
τp Tortuosity
xx
Chapter 1 : Introduction
1.1 Background
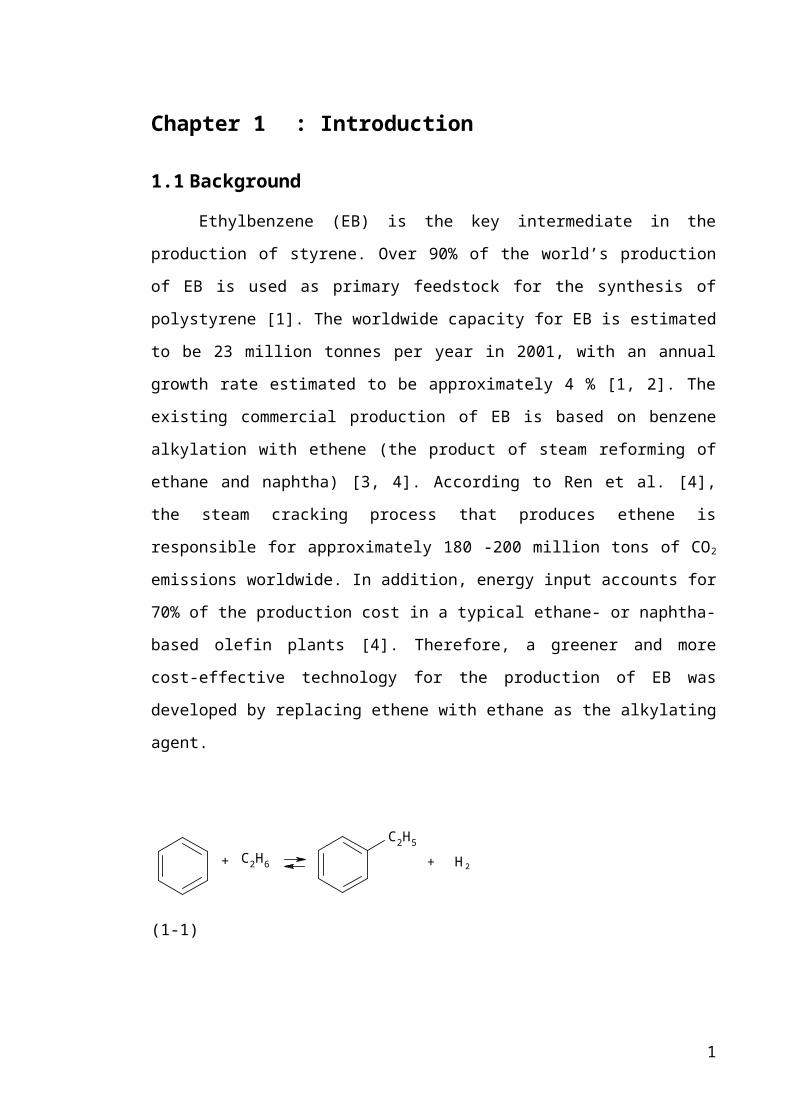
Ethylbenzene (EB) is the key intermediate in the production of styrene. Over
90% of the world’s production of EB is used as primary feedstock for the synthesis of
polystyrene [1]. The worldwide capacity for EB is estimated to be 23 million tonnes per
year in 2001, with an annual growth rate estimated to be approximately 4 % [1, 2]. The
existing commercial production of EB is based on benzene alkylation with ethene (the
product of steam reforming of ethane and naphtha) [3, 4]. According to Ren et al. [4],
the steam cracking process that produces ethene is responsible for approximately 180 -
200 million tons of CO2 emissions worldwide. In addition, energy input accounts for
70% of the production cost in a typical ethane- or naphtha- based olefin plants [4].
Therefore, a greener and more cost-effective technology for the production of EB was
developed by replacing ethene with ethane as the alkylating agent.
C2H5
C2H6 H 2++
(1-1)
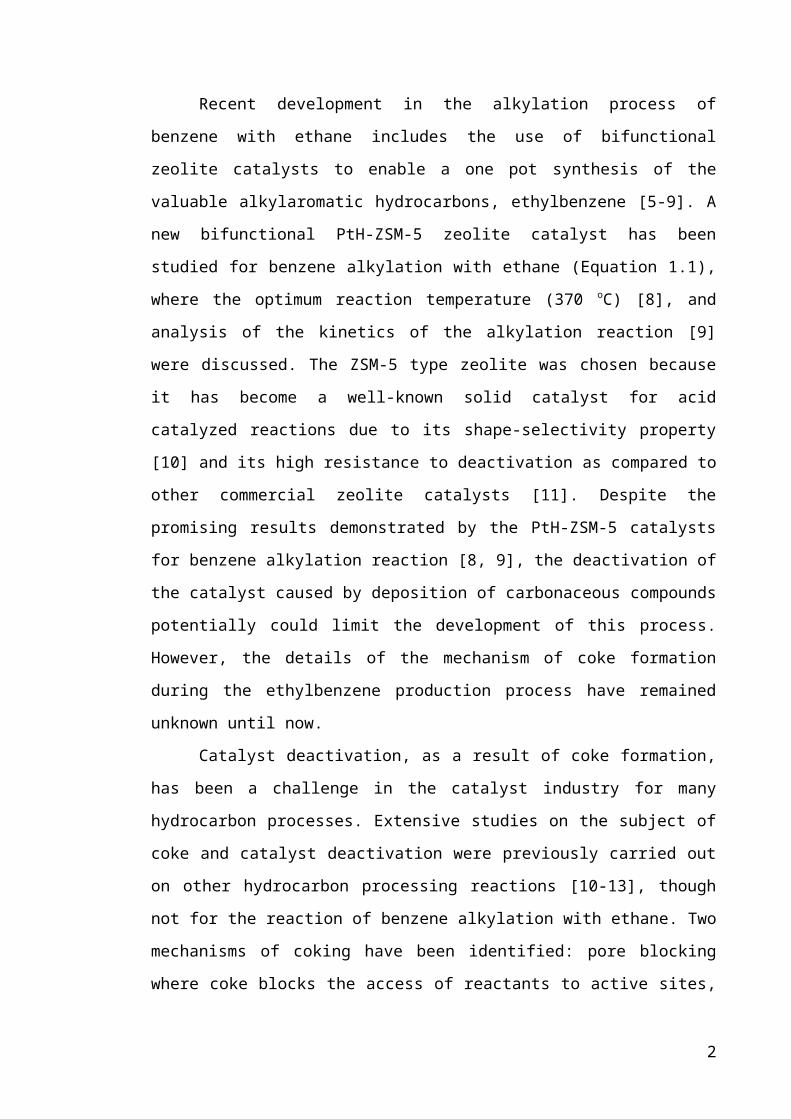
Recent development in the alkylation process of benzene with ethane includes
the use of bifunctional zeolite catalysts to enable a one pot synthesis of the valuable
alkylaromatic hydrocarbons, ethylbenzene [5-9]. A new bifunctional PtH-ZSM-5 zeolite
catalyst has been studied for benzene alkylation with ethane (Equation 1.1), where the
optimum reaction temperature (370 oC) [8], and analysis of the kinetics of the alkylation
reaction [9] were discussed. The ZSM-5 type zeolite was chosen because it has become
a well-known solid catalyst for acid catalyzed reactions due to its shape-selectivity
property [10] and its high resistance to deactivation as compared to other commercial
zeolite catalysts [11]. Despite the promising results demonstrated by the PtH-ZSM-5
catalysts for benzene alkylation reaction [8, 9], the deactivation of the catalyst caused
by deposition of carbonaceous compounds potentially could limit the development of
this process. However, the details of the mechanism of coke formation during the
ethylbenzene production process have remained unknown until now.
1

Catalyst deactivation, as a result of coke formation, has been a challenge in the
catalyst industry for many hydrocarbon processes. Extensive studies on the subject of
coke and catalyst deactivation were previously carried out on other hydrocarbon
processing reactions [10-13], though not for the reaction of benzene alkylation with
ethane. Two mechanisms of coking have been identified: pore blocking where coke
blocks the access of reactants to active sites, and active site coverage where coke
poisons the active sites responsible for the reaction [11, 12].
Modification of the ZSM-5 catalysts by coking has been reported to influence
the product distribution of shape selective reactions [11, 14, 15]. The effect of coke
deposition on para-selectivity was found to be dependent on the location of coke,
specifically whether it was located either within the internal pore structure, or on the
external surface of the zeolite catalyst [11, 15]. For example, some partially deactivated
catalysts have been shown to become less para-selective because of coke deposition by
pore filling, as demonstrated by Soleto et al. [11], who studied the deactivation of
toluene alkylation with methanol reaction on ZSM-5 catalysts. Conversely, Chen et al.
[15] showed that, with increasing coke content, para-DEB selectivity increased during
the disproportionation of ethylbenzene. Similarly, Lin et al. [16] showed that pore
blockage as a result of coke formation, caused an increase in the para-xylene selectivity
with prolonged time-on-stream (TOS). However, this previous work does not consider
the effect of intracrystalline coke distribution on the diffusivity and/or diffusion path
length, which can then influence product selectivities.
The lack of understanding of the deactivation phenomena during this new
process for ethylbenzene production encouraged the work carried out in this research.
This study examined new bi-functional zeolite catalysts for benzene alkylation with
ethane, and focused on the effect of coking on the accessibility and mass transport
within the zeolite catalyst in relation with changes in surface chemistry and network
geometry. The aim of this project is to obtain a correlation between the product
distribution and the structural evolution of the pore structure of the zeolite catalyst as a
result of coke deposition.
2

1.2 Thesis Structure
This thesis is divided into 8 chapters.
Chapter 2 gives an introduction to zeolites as catalysts. Factors that influence the
synthesis of a bifunctional zeolite catalyst will be discussed. Detailed experimental
procedures for the preparation of bifunctional PtH-ZSM-5 catalysts will be given in
Chapter 2. The alkylation of benzene with ethane over PtH-ZSM-5 catalysts of different
SiO2/Al2O3 ratios will be discussed in Chapter 3. The effect of time-on-stream (TOS)
and the influence of acidity on the activity and selectivity of PtH-ZSM-5 catalysts are
investigated. Chapter 4 examines the pore structure evolution of PtH-ZSM-5 catalysts
as a result of coke deposition, using a variety of characterisation techniques such as gas
sorption, x-ray diffraction (XRD), thermogravimetric analysis (TGA), scanning electron
microscopy (SEM) and infra-red (IR) spectroscopy. The simulation of accessibility and
diffusivity in a fresh and partially blocked cubic and ZSM-5 lattice will be performed in
Chapter 5. The effect of coke deposition on the thermodynamics and kinetics of the
main reactant, ethane will be studied in Chapter 6. Parameters such as heat of adsorption
and mass transport coefficient will be determined from the experimental data obtained
from ethane adsorption experiments. The use of pulsed field gradient (PFG) NMR
technique to study the diffusivity of probe molecules within the H-ZSM-5 and PtH-
ZSM-5 catalysts will be discussed in Chapter 7. Finally, the findings of this thesis are
summarised in Chapter 8. A proposal for further investigation in this area of research
will also be presented.
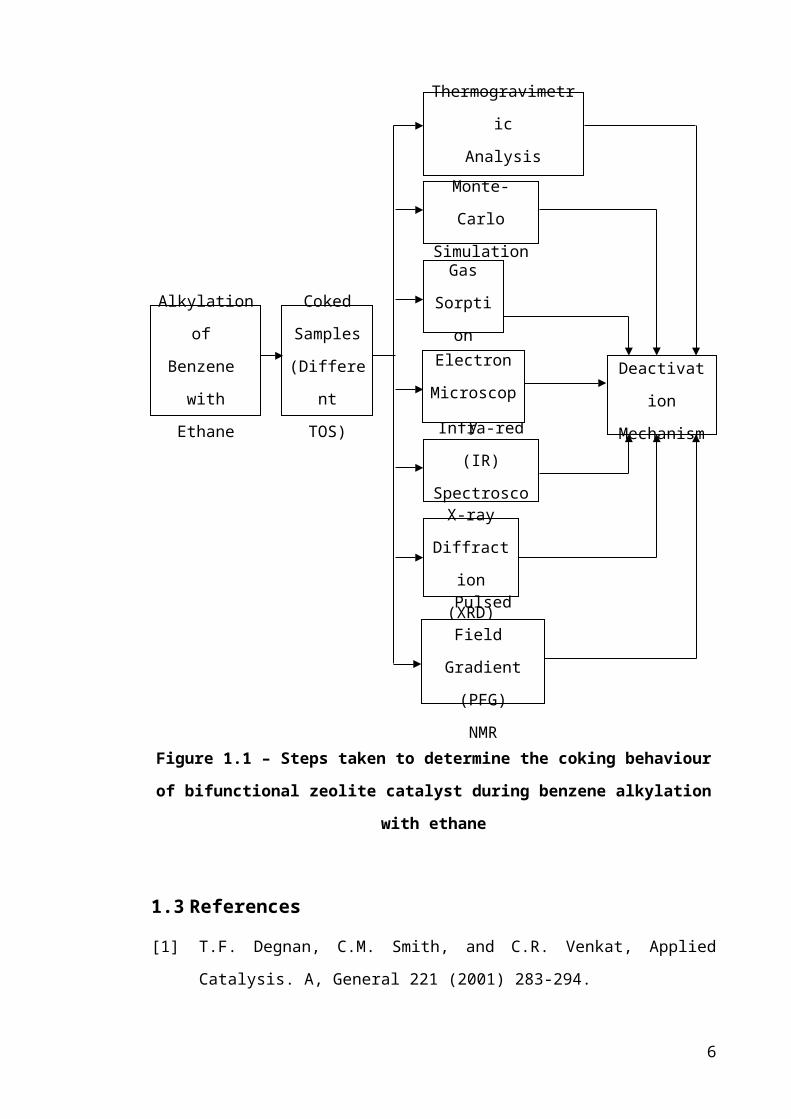
A schematic representation of the route taken to illustrate the different
deactivation mode for the benzene alkylation with ethane reaction is shown in Figure
1.1.
3
Figure 1.1 – Steps taken to determine the coking behaviour of bifunctional zeolite
catalyst during benzene alkylation with ethane
1.3 References
[1] T.F. Degnan, C.M. Smith, and C.R. Venkat, Applied Catalysis. A, General 221
(2001) 283-294.
[2] M. Hartmann, Angewandte Chemie International Edition 43 (2004) 5880-5882.
[3] J.A. Moulijn, M. Makkee, and A. van Diepen, Chemical Process Technology,
John Wiley & Sons, Ltd. 109-130.
Deactivation
Mechanism
Alkylation
of
Benzene
with Ethane
Coked
Samples
(Different
TOS)
Thermogravimetric
Analysis
(TGA)
Infra-red (IR)
Spectroscopy
Monte-Carlo
Simulation
Gas
Sorption
Electron
Microscopy
X-ray
Diffraction
(XRD)
Pulsed Field
Gradient (PFG)
NMR
4

[4] T. Ren, M. Patel, and K. Blok, Energy 31 (2006) 425-451.
[5] S. Kato, K. Nakagawa, N. Ikenaga, and T. Suzuki, Chemistry letters 3 (1999)
207-208.
[6] S. Kato, K. Nakagawa, N. Ikenaga, and T. Suzuki, Catalysis Letters 73 (2001)
175.
[7] A.V. Smirnov, E.V. Mazin, E.E. Ponomoreva, E.E. Knyazeva, S.N. Nesterenko,
and I.I. Ivanova, Benzene Alkylation with Alkanes over Modified MFI
Catalysts, Montpellier, France. 2001.
[8] D.B. Lukyanov, and T. Vazhnova, Journal of Molecular Catalysis A:Chemical
279 (2008) 128-132.
[9] D.B. Lukyanov, and T. Vazhnova, Journal of Catalysis 257 (2008) 382-389.
[10] D.M. Bibby, N.B. Milestone, J.E. Patterson, and L.P. Aldridge, Journal of
Catalysis 97 (1986) 493-502.
[11] J.L. Sotelo, M.A. Uguina, J.L. Valverde, and D.P. Serrano, Applied Catalysis
A:General 114 (1994) 273-285.
[12] A. De Lucas, P. Canizares, A. Durfin, and A. Carrero, Applied Catalysis A:
General 156 (1997) 299-317.
[13] M. Guisnet, and P. Magnoux, Applied Catalysis 54 (1989) 1-27.
[14] D.H. Olson, and W.O. Haag, ACS Symposium Series 248 (1984) 275-307.
[15] W.H. Chen, T.C. Tsai, S.J. Jong, Q. Zhao, C.T. Tsai, I. Wang, H.K. Lee, and
S.B. Liu, Journal of Molecular Catalysis A:Chemical 181 (2002) 41-55.
[16] X. Lin, Y. Fan, G. Shi, H. Liu, and X. Bao, Energy and Fuels 21 (2007) 2517-
2524.
5

Chapter 2 : Introduction to Zeolites and Synthesis of
Bifunctional Zeolite Catalysts
2.1 Introduction
Zeolites, oxides, complex oxides and ion-exchange resins are the most common
types of catalysts used in hydrocarbon processes [1]. According to the study carried out
by Tanabe and Holderich [1], zeolites account for approximately 40 % of the types of
catalysts used in the chemical and petrochemical industries. The extensive use of
zeolites as catalysts in industrial applications is primarily due to their unique physical
and chemical characteristics, such as their well defined pore structures and high acidity
properties. Therefore, in the present work, zeolites will be used to catalyse the
alkylation of benzene with ethane.
2.2 Catalyst Selection for the Production of Ethylbenzene by Benzene
Alkylation with Light Alkanes
The transformation of light alkanes (ethane and propane) is an interesting area of
research for many research groups as it allows the direct use of these cheap and readily
available materials to provide an alternative to processes that are currently based on
alkenes and aromatics [2]. Given the low reactivity of light alkanes, the activation of
these short-chain alkanes remains a great challenge in catalysis research. In most
reactions that involve the functionalisation of light alkanes, such as aromatization,
alkylation and isomerisation, zeolites are commonly used as catalysts.
Early studies of aromatization and alkylation reactions were carried out using
pure acidic zeolite catalysts. Guisnet et al. [3] reported that the formation of olefinic
compounds from dehydrogenation and cracking is the limiting step of the aromatization
reaction with these pure acidic catalysts. Kato et al. [4] also mentioned that unloaded
zeolites are inactive when light alkanes are used as the alkylating agent. Therefore, to
enhance the alkylation and aromatization reaction, bifunctional catalysts were suggested
to be significantly more active than pure acid catalyst.
6
Previous studies clearly show that incorporation of metal particles into the
zeolite structure helps to enhance the performance of pure acidic zeolite catalysts [2, 5].
The metal functions as a dehydrogenating agent for the light alkanes. Zinc, platinum
and gallium have been demonstrated to improve the zeolite reactivity during alkane
activation. However, depending on the reactants used, different metals yield different
catalytic activities. According to Guisnet et al. [3], gallium and zinc are the most active
dehydrogenating component for the propane aromatization reaction, even though zinc is
usually eliminated because of its volatility. This was also pointed out by other authors
[2, 6] who reported that the addition of Ga and Zn promotes the dehydrogenation of
propane during alkylation and aromatization reactions.
Ga-incorporated zeolite catalysts only showed slight activity for ethane [4, 7],
contrary to its higher catalytic activity for propane. Similar to the activity of the Ga-
incorporated zeolite catalyst, the performance of other metals such as Ni, Rh and Ru
also produce small amounts of ethene [7], which then limits the benzene alkylation
reaction. Even though platinum-incorporated zeolite catalysts are less stable and not
selective for propane aromatization and benzene alkylation [3], their reactivity is
excellent when ethane is used as the reactant during aromatization and benzene
alkylation [4, 7].
When a reaction is carried out in the presence of a dual-functional catalyst, the
reaction proceeds through a bifunctional reaction pathway where the transformation of
light alkanes would initiate with the dehydrogenation reaction to form light alkenes,
which will then react with benzene to form alkylbenzenes. Likewise, for benzene
alkylation with light alkanes over a metal-incorporated zeolite catalyst, the light alkanes
would be dehydrogenated over the metallic site while the formation of the carbenium
ion takes place on the acidic site. (The detailed mechanism will be discussed later in
Chapter 3).
Therefore, when choosing the catalyst for the alkylation reaction of benzene
with ethane, the main consideration would be to enhance : (i) ethane dehydrogenation to
ethene and hydrogen and (ii) benzene alkylation with ethene to form ethylbenzene,
while suppressing the side reactions such as hydrogenolysis of ethane, oligomerization
and cracking as well as ethylbenzene transformation reactions [8]. In addition, the
7
catalyst chosen should demonstrate stable performance with time-on-stream (TOS) and
also be selective to the formation of ethylbenzene. The cost of the catalyst should also
be taken into consideration as it influences the production cost of ethylbenzene/stryrene.
In order to determine the most effective zeolite catalyst for benzene alkylation
reaction with ethane, Kato et al. [7] carried out experiments to compare the performance
of pure and metal-incorporated H-mordenite, H-Y and H-ZSM-5 zeolites. Among the
zeolites studied, the Pt/H-ZSM-5 catalyst gave the highest yield of total C8 aromatics
[7]. Other zeolites such as the Pt/H-Y and Ga/H-MCM-41 did not yield ethylbenzene
and styrene in the product stream. The difference in the catalytic activity of these
zeolites was said to be due to the differing acid strengths, as measured by NH3-TPD.
The ZSM-5 catalyst has a unique catalytic activity in transformation of
hydrocarbons to aromatics as it has a low coking rate and it limits the growth of bulky
molecules by steric constraints [5, 9-12]. ZSM-5 catalysts have life cycles of 40-60 days
before regeneration [13]. In addition to that, their acidic property also makes them a
preferred catalyst for these reactions.
Even though platinum incorporated H-ZSM-5 catalyst was demonstrated to be
the most promising catalyst for the alkylation reaction of benzene with ethane [4, 7], the
high platinum loading used is not economical because of the high cost of platinum.
Hence, there is an economic incentive to minimize the amount of platinum used in the
preparation of platinum loaded catalysts while maintaining their catalytic activity [14].
This could be achieved by reducing metal loading while increasing the metal dispersion,
hence increasing the performance of the catalyst and at the same time, reducing the cost
of metal incorporated [14-15].
In addition to increasing the conversion and selectivity of the alkylation reaction,
the presence of platinum is also believed to reduce coke formation, because of its role of
the entrance of H2 spill-over [16]. During the H2 spill-over phenomenon, the olefins and
carbenium ions are converted into paraffins, thus suppressing the aromatization reaction
which prevents coke formation [17]. With the possibility of controlling coke formation,
the lifetime of the catalyst may be increased, therefore making it more stable during the
alkylation reaction.
8

As previous studies have proven that dual-functional catalysts are beneficial to
processes that require two different catalytic sites, attempts have been made to employ
bifunctional catalysts for benzene alkylation. However, up to now, only a few research
groups have carried out the one step synthesis for benzene alkylation with ethane using
bifunctional zeolite catalysts [4, 7-8, 18-19]. Recently, Lukyanov and Vazhnova [8, 19]
carried out benzene alkylation with ethane over 1 wt % PtH-ZSM-5 catalysts with
different SiO2/Al2O3 ratio (SiO2/Al2O3 = 30, 72 and 280). It was shown that the Pt-
incorporated H-ZSM-5 catalysts yielded stable catalyst performance, as well as high
selectivity into EB (> 90 mol % selectivity in aromatic products). As a result, this study
will investigate the alkylation of benzene with ethane on low loading Pt-modified H-
ZSM-5 catalysts.
2.3 Zeolites
Zeolites are highly-structured microporous inorganic solids which contain
channels and pores of very well-defined sizes, in which catalytic groups are situated
[20]. Due to their large application, zeolites have a global market of several million
tonnes per annum [21].
Zeolites are crystalline, hydrated aluminosilicates with well-defined structures
(Figure 2.1) [21]. Zeolite structures consist of silicon cation (Si4+) and aluminium
cations (Al3+) that are linked through by oxygen anions (O2-). Each oxygen anion
connects two cations yielding a macromolecular three-dimensional framework. The
negative charge arises from the difference in formal valency between silicon- and
aluminium cations, and will be located on one of the oxygen anions connected to an
aluminium cation [22]. The negative charges on the aluminium-oxygen tetrahedra can
be balanced by positive charges to allow the zeolite to be a neutral material [23-25]. The
positive charges can be a metal ion or protons, which can be exchanged for other
positively charged ions [23].
9

Figure 2.2 - Basic Structure of Zeolite (Adapted from ref [26])
The general formula for zeolite is Mx/n[(AlO2)x(SiO2)y].zH2O, where M
represents the non-framework cation and n is the charge [24].
There are two kinds of zeolites available, natural and synthetic zeolites. Natural
zeolites are processed from natural ore bodies. Although natural zeolites are present in
large amounts, they have limited range of structures and properties. Therefore, new
species of zeolites (synthetic zeolites) which have a wider range of properties and pore
architectures than the former counterparts are being manufactured.
Zeolites are built of primary and secondary building units. The primary unit is
constructed by joining the [SiO4]4- and [AlO4]5- coordination polyhedral. A Si or Al
atom sits at the centre of the tetrahedron with 4 oxygen atoms co-valently bonded to the
centered Si or Al atom (so-called T-atom). Zeolite structures can be classified by
observing the identical repeating structural sub-units which are called the secondary
building units (SBU) [27]. A number of secondary building units can be built by a
linkage through the oxygen atom covalent bonding, which is called an oxygen bridge.
Zeolites with different structures are made possible by varying the arrangements of
linked TO4 (T=Si or Al atom/ion) tetrahedra within the secondary building units. The
size of zeolite pores can be classified as narrow-pore, medium-pore or wide-pore
zeolites, depending on the ring opening of either 8-, 10- or 12-member rings. The exact
diameter of the pore depends on the coordination and the amount of cations and anions
present in the ring [22].
10
2.3.1 Characteristics of Zeolites
Zeolites play an important role in the heterogeneous catalysis field and there has
been a significantly rise in the available range of catalysts in the past few decades [28].
The interest in the usage of zeolites as catalysts arises from their unique properties,
namely their acid strength and their well-defined pore structure. The high thermal
stability of zeolites makes them ideal for use in petrochemical industry, where high-
energy transformations are carried out [20, 29].
2.3.1.1 Acidity
The possibility of controlling the acid strength, as well as the density of acid
sites, of zeolite catalysts has led to their wide application in the field of oil refining and
petrochemistry.
Acidity can be introduced into a zeolite by creating ‘hydroxyls’ within the pore
structure [27]. These hydroxyls are formed either by ammonium or polyvalent cation
exchange, followed by a calcination step. They are associated with the negatively
charged framework of oxygens linked into alumina tetrahedral, which is the Brønsted
acid sites [27].
Figure 2.3 - Interconversion of Brønsted and Lewis Acid Sites (Adapted from ref
[27])
11
The Brønsted acid sites have greater mobility at high temperature, thus forming
the unstable Lewis acid sites. An annealing process stabilizes the structure by ejecting
Al species from the framework and produces so-called ‘true’ Lewis acid sites [27]. The
interconversion of Brønsted and Lewis acid sites can be seen from Figure 2.2.
The effective acidity of the zeolite catalyst is influenced by a few factors such as
the total number of Brønsted and Lewis acid sites, their strength distribution and
location [28]. The two most commonly used methods to determine the acidic properties
of the zeolite catalysts are temperature-programmed desorption (TPD) of ammonia and
Fourier transform infrared spectroscopy (FTIR). Theoretically one acid site is generated
by substitution of one aluminium atom into the silicalite matrix. The acidity of zeolites
is determined by the SiO2 to Al2O3 ratio in the framework. According to Ribeiro et al.
[28], the increase in Si/Al ratio increases the number of strong Brønsted acid sites,
despite the decrease in the total amount of acid sites. However, the acid site density is
reduced with higher Si/Al ratio [29]. Based on NH3-TPD results, Kato et al. [7] reported
that the total acidity of zeolite catalysts increases with the decrease in SiO2 to Al2O3
ratio.
2.3.1.2 Shape-selectivity
The pore structure of zeolites is also an important feature in their application as
catalysts. Their well-defined pore dimensions can discriminate reactants and products
by size and shape when these molecules present significant differences in diffusivity
through a given pore channel system [31]. It was pointed out that access to active sites
within the zeolite framework is controlled by the oxygen window [30]. With the
dimension of pores about the same order of magnitude as many hydrocarbon molecules,
zeolite catalysts can control the adsorption of reactants and products, hence inducing
shape selectivity. Relative to traditional catalysts, zeolites can be tailored to admit
certain reactant molecules which produce selective products [30]. The product
distribution when using different types of zeolites as catalyst differs from one another
due to the different pore network structure.
Due to the high activity of zeolite catalysts, they are vulnerable to coke
deposition, which has been identified as the primary reason for deactivation of the
12
catalyst during acid-catalysed hydrocarbon reactions [32]. However, the coking process
is a shape selective reaction which can be controlled by the pore structure of zeolite
catalysts [33]. The build-up of the carbonaceous residues in the microporous channels
of the zeolite catalyst can block access of reactants to active sites or products from
diffusing out of the zeolite crystallites.
The shape selectivity property of zeolite catalysts can be classified into three
categories:
(a) Reactant shape selectivity: due to the complexity of the pore structure of zeolites,
only reactants that can penetrate into the pore, or have a favourable shape, will be able
to react on the active sites of the catalyst [24, 30]
(b) Product shape selectivity: the size of the product formed must be smaller than the
size of the pores structure and intersections [24, 30]
(c) Restricted transition state selectivity: the transition state intermediate product should
not be too bulky due to the limited volume available around the active site of the zeolite
framework. This will control the shape and size of the product [24, 30]
2.3.2 Zeolite Modification
Zeolites can be treated to optimise their physical and chemical properties to suit
the requirement of a desired reaction. Preparation of zeolites having various pore sizes
and acidities have been given a lot of attention. The framework of zeolites can be
modified by synthesizing zeolites with metal cations other than aluminum and silicon in
the framework. According to Perot and Guisnet [29], the characteristics of the zeolite
catalyst, i.e. acid strength, density of acid sites, and porosity cannot be modified
independently. For example, dealumination decreases the acid site density but increases
the acid strength and also changes the porosity of the zeolite [29], where mesopores are
created to overcome diffusion problem in microporous zeolite [33].
The size of the zeolite pore channels is a major advantage for separation
processes and for applications as adsorbents and heterogeneous catalysts. In some
13
applications, zeolites with larger pores are required to reduce diffusion limitations on
the reaction rate, while in some separation processes channels of microporous
dimensions are required. The micropore structure limits the performance of the catalyst
due to mass transport limitations of the reactants and products. Therefore, Christensen et
al. [35] suggested using mesoporous zeolite single crystals to increase the activity and
selectivity of the catalyst while reducing diffusional limitations [35]. These mesoporous
zeolites could be obtained by minimizing the size of the zeolite crystals or by increasing
the pore size of the zeolite catalyst [36].
Hartmann [36] drew attention to the advantages of the new mesoporous zeolites
in relation to their catalytic activity. The author highlighted that these modified zeolites
offer higher reaction rates for diffusion-limited reactions which could improve the
selectivity of the target product plus slow down deactivation of the catalyst due to pore
mouth blockage in the microporous zeolites.
Studies have been carried out to compare the performance of the conventional
zeolite and the modified zeolites which has mesopore channels. Rovik et al. [37]
showed that the conversion and selectivity of the mesoporous Re/H-ZSM-5 catalyst
during the dehydrogenation of propane is much higher than the conventional ReH-
ZSM-5 catalyst due to pore blocking of Re on the conventional MFI catalyst. Earlier
studies by Christensen et al. [35] also showed an increase in the selectivity of
ethylbenzene over a mesoporous MFI catalyst during benzene alkylation with ethene.
2.3.3 ZSM-5 Zeolite
ZSM-5 zeolite is part of the pentasil family of high-silica zeolites [20, 38]. Since
the synthesis of ZSM-5 by Mobil scientists, it has been regarded as one of the most
versatile zeolites found and used industrially. ZSM-5 zeolite has also been of scientific
interest due to its diverse application in heterogeneous catalysis, separation, purification
and lately in environmental applications [39]. As mentioned earlier, zeolites account for
approximately 40 % of the type of catalysts used in the chemical and petrochemical
industries, and out of the 40 %, 42 % of the zeolite catalysts used is the ZSM-5 zeolite
[1]. Results from the survey carried out [1] demonstrate the importance of ZSM-5
zeolite as solid acid catalysts.
14
Figure 2.4 - Framework of MFI Type Zeolite [40]
ZSM-5 zeolites consist of two types of pores, both formed by 10-membered
oxygen rings (Figure 2.3). The framework contains two intersecting channels, one of the
channel structures is straight and elliptical in cross section, whereas the second sort of
pores intersect the straight pores at right angles, in a zig-zag pattern and are circular in
cross section [11, 41-44]. The sinusoidal and nearly circular opening has a dimension of
5.4 Å x 5.6 Å whereas the straight elliptical opening has a dimension of 5.1 Å x 5.6 Å
[30].
Figure 2.5 - Pore Structure of H-ZSM-5 [20]
The ZSM-5 type zeolite is known to be a shape selective catalyst due to its
unique channel structures [42]. The channel opening of the 10-membered ring controls
the type of molecules that can have access to the internal zeolite pore channels by its
size. The ZSM-5 zeolite is also considered as a remarkably stable acid catalyst due the
15
absence of large supercages and small windows [29] that are present in other zeolites
such as zeolite-Y and zeolite-A. Figure 2.3 shows the framework of MFI type zeolite
while the representation of the channel system of ZSM-5 can be seen from Figure 2.4.
The ZSM-5 zeolite was chosen as the preferred alkylation catalyst to other acid
catalysts because it induces shape selective catalysis and it has low ageing rates.
Amongst them, the steric factor plays a significant role in catalyst selection. The shape
selectivity property of the ZSM-5 zeolite can be illustrated by para-selectivity
enhancement during xylene isomerisation, toluene-methanol alkylation and toluene
disproportionation experiments [45] as a result of the higher diffusivity of para-isomers
compared to meta- and ortho-isomers in the pores of ZSM-5 catalysts. Compared to
other zeolites with larger pore dimensions, the geometry of ZSM-5 imposes constraints
to prevent formation of large polynuclear hydrocarbons (by hydrogen transfer or
cyclization) which are responsible for coking [29, 46].
2.4 Bifunctional Zeolite Catalysts
The catalytic properties of a bifunctional catalyst depend upon the technique
applied and also the preparation method which includes the type of metal precursor
used, amount of metal loading, and the calcination and reduction conditions. The
preparation step is vital for determining the location of the metal species, metallic
dispersion and the particle size of the metal species, which will influence the desired
activity, selectivity and life time of the catalyst. The balance between the metal and acid
strength is another factor that changes the catalytic activity of the bifunctional catalyst.
The types of precursors used to form the bifunctional catalyst have been shown to affect
the metallic and acidic properties of the bifunctional catalyst [47].
2.4.1 Preparation Method
Bifunctional catalysts can be prepared via several techniques such as ion
exchange [15, 47-49], incipient wetness impregnation [15, 48-49], mechanical mixing
and spontaneous monolayer dispersion [48]. However, the two most commonly used
techniques for the preparation of bifunctional catalysts are the ion exchange and
impregnation method [15]. The ion exchange method is described as an irreversible
16
chemical reaction where the zeolite is mixed in a soluble salt solution of the desired
ingoing cation. The ion from the solution is exchanged with the cation attached to the
zeolite particles. If the bifunctional catalyst is prepared via the incipient wetness
impregnation method, the zeolite will be immersed in a solution of metal salts of
interest, inducing deposition.
Many studies have been carried out to investigate the effect of different metal
incorporation techniques on the properties of the bifunctional catalyst. Schulz and
Baerns [9] reported that the method of preparation (impregnation or ion exchange) had
no influence on the activity of the catalyst during ethane aromatization. However, it was
found that the impregnated Ga/H-ZSM-5 catalyst is a more active catalyst when
compared with the physical mixed catalyst, for ethane aromatization, due to the close
interaction between Ga2O3 and the Brønsted acid sites. Likewise, Smirnov et al. [18]
found that the mixed platinum modified H-ZSM-5 catalyst has lower activity compared
to the ion-exchanged and impregnated catalyst for the alkylation of benzene with
propane [18].
In contrast to the findings of Schulz and Baerns [9], Jao et al. [49] found that the
isomerization selectivity for the catalyst prepared via ion exchange technique is higher
as a result of higher platinum dispersion and smaller platinum particles as compared to
the mordenite-supported Pt catalyst prepared by impregnation method. Based on the
shift in the Ni reduction temperature to higher temperature for the ion-exchange
catalysts, Romero et al. [47] reported that a Ni/H-ZSM-5 catalyst prepared via
impregnation method has a lower nickel dispersion compared to one prepared by the ion
exchange technique. Their result is in agreement with the conclusions drawn by Jao et
al. [49]. It was proposed that the platinum precursors are deposited on the external
surface area of the zeolite catalyst after impregnation and these platinum precursors
agglomerate during the calcination and/or reduction step [49]. In addition, the shorter
distance between the acidic and metal centers [18] also explains the better performance
of the ion exchange catalysts.
Ni/H-ZSM-5 catalysts prepared via impregnation method was reported to have a
higher activity during n-decane hydroisomerization compared to the one prepared by
mechanical mixing. The increase in hydroisomerization activity was because of the
17

smaller Ni particles formed and the closer interaction between the acid and metal
function after impregnation [50].
2.4.2 Calcination and Reduction
The preparation of a bifunctional catalyst usually includes a calcination and
reduction step after the metal precursors have been introduced into the zeolite support to
activate the catalyst. These heat-treatment procedures have great influence on the
performance and properties of the bifunctional catalyst in terms of the position and the
size of the metal particles in the catalyst. The calcination step is required to decompose
the precursor compound and to form oxide species [6]. The calcined catalyst will
usually undergo a reduction step in the presence of a reducing gas such as hydrogen.
The calcination and reduction conditions have significant effect on the metal dispersion
and the distribution of the metal in the final product [6]. Given the significant influence
of the pre-treatment conditions, continuous work has been carried in this area of
research.
The study carried out by Folefoc and Dwyer [51] is in agreement with the earlier
results obtained by Kubo et al. [52] on the effect of calcination temperature on the size
of the platinum particle, where a higher calcination temperature would result in lower
platinum dispersion and larger platinum particles. These results are independent of the
type of metal and zeolite support used, as observed by Jao et al. [49] for mordenite-
supported Pt and Canizares et al. [15] for Pd incorporated on H-ZSM-5. It was proposed
that at higher calcination temperature, the metal ions migrate to the outer surface of the
zeolite crystallites, where during reduction, the metal atoms sinter to form large
particles [51].
The calcination step is usually carried out under flowing air atmosphere.
However, de Araujo and Schmal [53] looked into the effect of calcination temperature
on the structural properties of Pt/ZSM-5 catalyst under different conditions. In contrast
to earlier findings, the authors reported that a catalyst calcined at 350 oC presented
lower Pt dispersion compared to a catalyst calcined at 550 oC [53]. Based on a mass
spectroscopy analysis, it was observed that the lower temperature was not sufficient to
18
completely decompose the [Pt(NH3)4]2+ complex, which leads to platinum
agglomeration after reduction with hydrogen [53].
The effect of the reduction conditions on the metal dispersion of supported
metal-catalysts has also been investigated [14-15, 49]. It was shown that the dispersion
is inversely proportional to the reduction temperature for severe reduction temperatures
(>500 oC). Therefore, the higher the reduction temperature, the tendency for sintering of
the reduced metal increases, decreasing the isomerization selectivity of the bifunctional
catalyst, as pointed out by Jao et al. [49].
2.4.3 Metal Loading
The balance between the acid and metal site density is important in determining
the reactivity of a bifunctional catalyst. The activity of the bifunctional catalyst is not
proportional to the amount of metal incorporated onto the zeolite support according to
M’Kombe et al. [14] and Canizares et al. [15]. Both studies showed that the metal
dispersion is inversely proportional to metal loading based on TEM images [14], CO
chemisorption [14] and TPR profiles [15]. The reduction in metal dispersion has been
associated with the low performance of the bifunctional catalyst because the metal
particles are not exposed to the reactants or that the distance between the metal and acid
site is very far from one another. Therefore, a low metal loading with high dispersion
will not only lead to a higher activity of the catalyst, but also reduce the cost of the raw
material. It is also believed that the metal component should be present in excess in
order for the reaction on the acid site to be the rate limiting reaction so that the
equilibrium between the saturated and unsaturated species is achieved [14, 47].
2.5 Synthesis of the Bifunctional PtH-MFI Catalyst for Benzene
Alkylation Reaction with Ethane
Two bifunctional PtH-ZSM-5 catalysts of different SiO2/Al2O3 ratio (30 and 80)
were chosen for the alkylation of benzene with ethane investigated in this study. The
preparation steps for the PtH-ZSM-5(30) and PtH-ZSM-5(80) catalysts will be
described in detail in this section.
19
2.5.1 Calcination
The parent catalyst of ZSM-5 with different silicon dioxide (SiO2) to aluminium
oxide (Al2O3) ratio in the form of NH4ZSM-5 was calcined to convert the zeolite catalyst
from NH4+ into H-form zeolite. Approximately 1 g of NH4
+ form zeolite ZSM-5 was
placed in a crucible, and then heated in a muffle furnace following the temperature
profile shown in Figure 2.5.
The heating profile was set using the Carbolite temperature programmer by
entering the desired temperature profile for the calcination process. The temperature
profile was divided into a few segments. The segment where the temperature remains
the same for a certain time is called the dwell, while the temperature rising segment is
called the ramp.
Figure 2.6 – Temperature profile for calcination of NH4ZSM-5 catalyst
Following the heating of the catalysts, any water residue trapped in the catalysts
would be removed. H-ZSM-5 catalyst obtained at the end of the heating process was left
to dry in the drying cabinet (~ 50oC) over the weekend.
2.5.2 Impregnation
In the case of Pt incorporated zeolite catalyst, Pt metal was impregnated onto the
H-ZSM-5 catalyst. For this research, Pt loading of 1 wt% was chosen and
tetraamineplatinum(II)nitrate, Pt(NH3)4(NO3)2 was used as the platinum precursor.
The amount of platinum precursor required to make 1 wt % PtH-ZSM-5 catalyst
can be calculated as shown below:
20

1 wt % PtH-ZSM-5 catalyst contains 0.99 weight fraction of H-ZSM-5 and 0.01 weight
fraction of Pt.
Table 1 – Molecular weight of various components
Component Molecular Weight (kg kmol-1)
Platinum (Pt) 195
Nitrogen (N) 14
Hydrogen (H) 1
Oxygen (O) 16
The molecular weight of Pt(NH3)4(NO3)2 = 387 kg kmol-1
387 g Pt(NH3)4(NO3)2 → 195 g Pt
For 1 g of 1 wt % PtH-ZSM-5,
X g Pt(NH3)4(NO3)2 → 0.01 g Pt
From the calculation above, it is shown that 0.02 g of Pt(NH3)4(NO3)2 is needed
for the preparation of 1 g of 1 wt % PtH-ZSM-5 catalyst.
Pt solution was prepared by mixing 0.02 g of Pt(NH3)4(NO3)2 and 0.8 ml of
deionised water, ensuring that the Pt(NH3)4(NO3)2 salt was completely dissolved in
water. Then, the solution was added drop by drop using a pipette to the 0.99 g H-ZSM-5
catalysts placed in a crucible. The mixture was left to dry overnight under room
temperature. The dried mixture was cracked into powder form using a spatula and was
then placed in a crucible for further treatment.
21

The PtH-ZSM-5 catalyst was calcined in a furnace via the temperature profile
shown in Figure 2.6.
Figure 2.7 - Temperature profile for calcination process
2.5.3 Preparation of Catalyst Fractions
The powdered form catalysts cause a large backpressure (due to lack of voidage
in the catalyst bed) which is undesired during the alkylation reaction. Therefore, the
powder catalyst is made into the form of small particles referred to as ‘fractions’ before
it was loaded into the reactor.
The catalyst powder samples were pressed into discs, then, crushed and sieved
using 250-710 μm meshes, creating size fractions. The catalyst was thus obtained in its
final form as used in the reaction studies.
2.6 Conclusion
Zeolites have been extensively used as solid acid catalysts for light alkane
activation reactions because of their unique properties; in particular their acidity,
microporosity and shape-selectivity. The incorporation of metal or metal oxides onto
zeolite catalysts improves their activity in catalysing reactions, but the number of
metallic and acidic sites needs to be balanced for optimum performance. The catalyst’s
active metal ingredient incorporation method and preparation conditions are also
important factors to be considered as they affect the activity of the catalyst as well as the
selectivity of the products.
A Pt incorporated H-ZSM-5 catalyst was chosen for the current work on
benzene alkylation with ethane to produce ethylbenzene. The incorporation of Pt has
22

been proven to enhance the dehydrogenation reaction of ethane, while the H-ZSM-5
catalyst was reported to be the most promising catalyst, in terms of activity for
alkylation reactions. In addition, PtH-ZSM-5 catalysts have also been known to
suppress the formation of carbonaceous deposits, which are responsible for catalyst
deactivation.
The synthesis of the 1 wt % PtH-ZSM-5 catalyst with SiO2/Al2O3 ratio of 30 and
80 via incipient wetness impregnation method was discussed. The PtH-ZSM-5 catalysts
are made in the form of ‘fractions’ of dimensions between 250-710 μm to prevent large
backpressure during the alkylation reaction.
2.7 References
[1] K. Tanabe, and W.F. Holderich, Applied Catalysis A: General 181 (1999) 399-
434.
[2] E.G. Deruoane, H.Y. He, S.B.D.A. Hamid, and I. Ivanova, Journal of Molecular
Catalysis A:Chemical 158 (2000) 5-17.
[3] M. Guisnet, N.S. Gnep, and F. Alario, Applied Catalysis A: General 89 (1992)
1-30.
[4] S. Kato, K. Nakagawa, N. Ikenaga, and T. Suzuki, Chemistry letters 3 (1999)
207-208.
[5] G. Caeiro, R.H. Carvalho, Z. Wanga, M.A.N.D.A. Lemosa, F. Lemos, M.
Guisnet, and F.R. Ribeiro, Journal of Molecular Catalysis. A, Chemical 255
(2006) 131-158.
[6] C. Bigey, and L. Su, Journal of Molecular Catalysis. A, Chemical 209 (2004)
179-187.
[7] S. Kato, K. Nakagawa, N. Ikenaga, and T. Suzuki, Catalysis Letters 73 (2001)
175.
[8] D.B. Lukyanov, and T. Vazhnova, Journal of Catalysis 257 (2008) 382-389.
[9] P. Schulz, and M. Baerns, Applied Catalysis A:General 78 (1991) 15-29.
[10] S.J. Kulkarni, S.B. Kulkari, P. Ratnasamy, H. Hattori, and K. Tanabe, Applied
Catalysis 8 (1983) 43-56.
[11] D.H. Olson, G.T. Kokotailo, S.L. Lawton, and W.M. Meier, Journal of Physical
Chemistry 85 (1981) 2238-2243.
23
[12] M.A. Uguina, D.P. Serrano, R. Van Grieken, and S. Venes, Applied Catalysis A:
General 99 (1993) 97-113.
[13] C. Perego, and P. Ingallina, Catalysis Today 73 (2002) 3-22.
[14] C.M. M'kombe, M.E. Dry, and C.T. O'Connor, Zeolites 19 (1997) 175-179.
[15] P. Canizares, A. De LuCas, F. Dorado, and J. Aguirre, Microporous and
Mesoporous Materials 42 (2001) 245-254.
[16] S. Todorova, and B. Su, Journal of Molecular Catalysis A:Chemical 201 (2003)
223-235.
[17] U. Mroczek, K.H. Steinberg, and F. Roessner, Reaction Kinetics and Catalysis
Letters 44 (1991) 201-207.
[18] A.V. Smirnov, E.V. Mazin, E.E. Ponomoreva, E.E. Knyazeva, S.N. Nesterenko,
and I.I. Ivanova, Benzene Alkylation with Alkanes over Modified MFI
Catalysts, Montpellier, France. 2001.
[19] D.B. Lukyanov, and T. Vazhnova, Journal of Molecular Catalysis A: Chemical
279 (2008) 128-132.
[20] D.J. Macquarrie, Philosophical Transactions. Mathematical, Physical, and
Engineering Sciences 358 (2000) 419-430.
[21] R.G. Bell. 2001. What are Zeolites? [online] Available from:
http://www.bza.org/ [Accessed 7 May 2007].
[22] S. Van Dock. 2002. Adsorption, Diffusion and Reaction Studies of
Hydrocarbons On Zeolite Catalysts In Inorganic Chemistry & Catalysis. Utrecht
University. 168.
[23] J.W. Ward, Journal of Catalysis 9 (1967) 225-236.
[24] E. Roland, and P. Kleinschmit. 1996. Zeolites. In Ullmann's Encyclopedia of
Industrial Chemistry B. Elvers, Hawkins, S., editor. VCH,Weinhem. 314-362.
[25] X. Wu. 2003. Zeolite Catalysts Bound With Silica and Alumina. In Chemical
Engineering. Texas A&M University.
[26] B.K. Marcus, and W.E. Cormier, Chemical Engineering Progress 95 (1999) 47-
53.
[27] W.M. Meier, and D.H. Olson, Atlas of Zeolite Structure Types. Butterworths,
1987.
[28] F.R. Ribeiro, F. Alvarez, F.L. Henriques, J.M. Lopes, and M.F. Ribeiro, Journal
of Molecular Catalysis A: Chemical 96 (1995) 245-270.
[29] G. Perot, and M. Guisnet, Journal of Molecular Catalysis 61 (1990) 173-196.
24
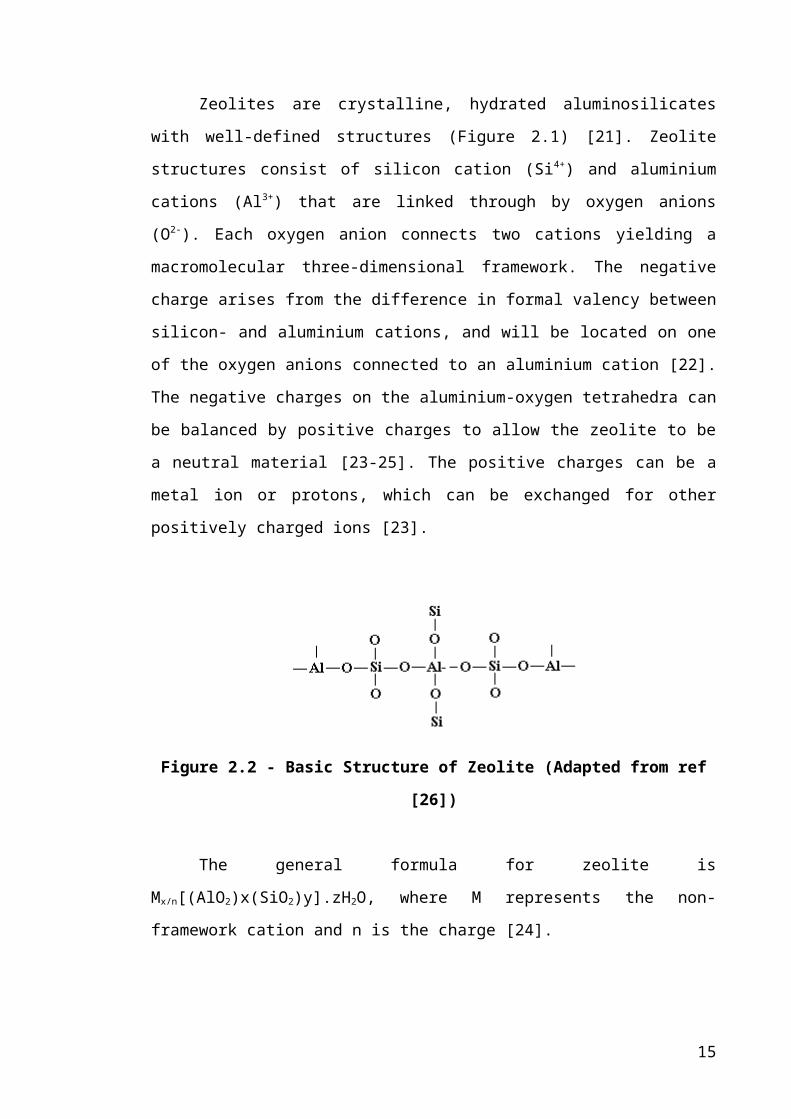
[30] A. Dyer, An Introduction To Zeolite Molecular Sieves. John Wiley and Sons,
1988.
[31] A. Corma, Journal of Catalysis 216 (2003) 298-312.
[32] L.Y. Fang, S.B. Liu, and I. Wang, Journal of Catalysis 185 (1999) 33-42.
[33] L.D. Rollman, and D.E. Walsh, Journal of Catalysis 56 (1979) 139-140.
[34] R. Lu, H. Tangbo, Q. Wang, and S. Xiang, Journal of Natural Gas Chemistry 12
(2003) 56-62.
[35] C.H. Christensen, K. Johannsen, I. Schmidt, and C.H. Christensen, Journal of
the American Chemical Society 125 (2003) 13370-13371.
[36] M. Hartmann, Angewandte Chemie International Edition 43 (2004) 5880-5882.
[37] A.K. Rovik, A. Hagen, I. Schmidt, S. Dahl, I.B. Chorkendorff, and C.H.
Christensen, Catalysis Letters 109 (2006) 153-156.
[38] P.A. Jacobs, Zeolites 1 (1981) 161-168.
[39] Y.S. Tao, H. Kanoh, and K. Kaneko, Advanced Materials 17 (2005) 2789-2791.
[40] C.H. Baerlocherm, and L.B. McCusker. Database of Zeolite Structures.
[41] L. Song, and L.V.C. Rees, Microporous and Mesoporous Materials 35-36 (2000)
301–314.
[42] G.T. Kokotailo, S.L. Lawton, and D.H. Olson, Nature 272 (1978) 437-438.
[43] E.M. Flanigen, J.M. Bennett, R.W. Grose, J.P. Cohen, R.L. Patton, and R.M.
Kircher, Nature 271 (1978) 512-516.
[44] R.E. Richards, and L.V.C. Rees, Langmuir 3 (1987) 335-340.
[45] L.B. Young, S.A. Butter, and W.W. Kaeding, Journal of Catalysis 76 (1982)
418-432.
[46] D.E. Walsh, and L.D. Rollman, Journal of Catalysis 56 (1979) 195-197.
[47] M.D. Romero, A. De LuCas, J.A. Calles, and A. Rodriguez, Applied Catalysis :
A General 146 (1996) 425-441.
[48] L. Qian, and Z.F. Fan, Colloids and Surfaces A: Physicochemical and
Engineering Aspects 180 (2001) 311-316.
[49] R.M. Jao, L.J. Leu, and J.R. Chang, Applied Catalysis:A General 135 (1996)
301-316.
[50] M.D. Romero, J.A. Calles, and A. Rodriguez, Industrial & Engineering
Chemistry Research 36 (1997) 3533-3540.
[51] G.N. Folefoc, and J. Dwyer, Journal of Catalysis 136 (1992) 43-49.
25
[52] T. Kubo, H. Arai, H. Tominaga, and T. Kunugi, Bulletin of the Chemical
Society of Japan 45 (1972) 607-612.
[53] L.R.R. De Araujo, and M. Schmal, Applied Catalysis A:General 203 (2000)
275-284.
26
Chapter 3 : Benzene Alkylation with Ethane over PtH-ZSM-5
Catalysts
3.1 Introduction
The complexity of the reaction pathway of benzene alkylation with light alkanes
was pointed out by Derouane et al. [1], Bigey and Su [2], and Smirnov et al. [3-4].
Smirnov et al. [3] highlighted that the reaction pathway was determined by the
alkylating agent, as well as the types of catalysts used. Therefore, in this chapter, the
evaluation of the performance of PtH-ZSM-5 catalysts of different acidity (different
SiO2/Al2O3 ratio) on the alkylation of benzene with ethane (Equation 3.1) will be
discussed in detail.
C2H5
C2H6 H 2++
(3-2)
3.2 Catalyst and Process Development in the Commercial
Ethylbenzene Production Process
The history of EB manufacturing goes all the way back to the 1930s when the
alkylation reaction was performed by reacting benzene and ethene in the presence of a
Friedel-Crafts catalyst (i.e. AlCl3-HCl) under mild conditions of 160 oC [5]. Advances
to the EB production technology were made to avoid the use of corrosive liquid-phase
acidic catalysts. In the 1940s, the first solid acid catalyst was introduced to enhance the
alkylation of benzene with ethene in the vapour phase.
Zeolites were first used as catalysts for alkylation in the 1960s when zeolites
with large pores such as REX, HY and REY were used to catalyse the EB formation
reaction. The first industrial application of zeolites as catalysts for the production of EB
was introduced in 1976. However, commercialisation was achieved in 1980 by Mobil-
Badger as the ‘second generation Mobil-Badger process’ with improved catalyst
27
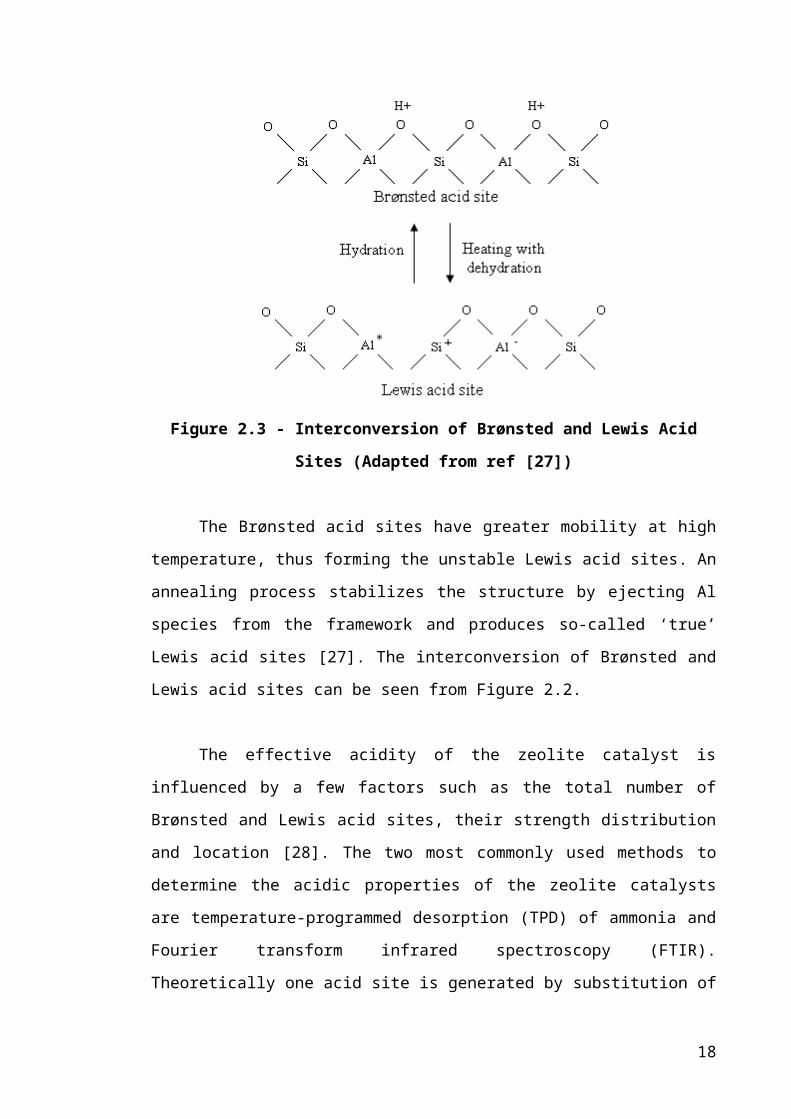
lifetime and yield of EB [6] over earlier processes. Since then, the Mobil-Badger vapour
phase process is the most widely used zeolite catalysed EB manufacturing process [6].
In later years, developments in EB production focused on the liquid-phase
process, where zeolites were catalysing the alkylation reaction of benzene with ethene.
Example of the liquid-phase alkylation process is the Mobil-Badger EBMax process
with MCM-22 as the zeolite catalyst. In 1989, Unocal-ABB Lummus Crest introduced a
liquid-phase process based on a modified Y-zeolite which yields 99.6 % of EB [5-6].
According to Perego and Ingallina [5], 76 % of EB production processes are based on
zeolite catalysts, while the remaining 24 % still uses AlCl3-HCl technology. A summary
of the EB production processes based on benzene alkylation with ethene was reviewed
by Degnan et al. [6] and Perego and Ingallina [5].
The possibility of direct benzene alkylation with light alkanes was first reported
by Olah et al. [7], however with the use of fluoroantimonic acid (HF-SbF5) as the
catalyst. Later on, the use of bifunctional zeolite catalysts for benzene alkylation with
ethane was reported [3, 8-11]. Detailed discussion on the alkylation of benzene with
light alkanes will be presented in the next section.
3.3 Benzene Alkylation with Light Alkanes
The alkylation of benzene with light alkanes has been extensively studied [3-4,
8-11]. Based on previous investigations, it was reported that the direct alkylation of
benzene with alkane was possible over a dual-functional catalyst, where metal and acid
centres allowed the dehydrogenation and protonation of the light alkanes respectively,
to take place at the same time [4, 8]. In comparing the reactivity of different alkanes for
the benzene alkylation reaction over modified ZSM-5 zeolite catalyst, it was shown that
the reactivity of the alkanes increased as the chain length was increased [3].
A general reaction network (Figure 3.1) for the alkylation of benzene with light
alkanes was proposed by Smirnov et al. [3]. In addition to the main alkylation reaction,
side reactions also took place simultaneously, influencing the selectivity of the desired
product. Therefore, an understanding of the reaction mechanism for benzene alkylation
28

is necessary in order to suppress these side reactions and maximise the yield of the
desired product.
Figure 3.8 - General reaction network for benzene alkylation with light alkanes
Adapted from ref [3]
3.3.1 Conversion of Light alkanes into Light Alkenes and Aromatic
Hydrocarbons
Direct benzene alkylation with light alkanes on a bifunctional catalyst includes
the initial dehydrogenation reaction of light alkanes forming light alkenes, followed by
alkylation of benzene with the alkenes produced [2, 4, 8, 12]. Similarly, in
aromatization reactions, short chained alkanes are first dehydrogenated to form light
alkenes, then aromatized to form aromatics [12-15]. Kato et al. [8] stated that
dehydrogenation of light alkanes is the key reaction in the ethylation of benzene
reaction. It was demonstrated that the reactivity of zeolite catalysts in alkane activation
was improved significantly by modification with Pt, Ga or Zn [4, 15-16].
29
The first step in the alkylation reaction with alkanes would be the activation of
light alkanes prior to further reactions. According to Buckles and Hutchings [17], the
activation of light alkanes on a bifunctional catalyst is a two step reaction that could
take place either at the interface between the metal and the zeolite or on the metal oxide
[17]. The activation of light alkanes has been extensively studied [1, 15, 17-18] and
different reaction mechanisms were proposed. All reaction mechanisms suggested the
formation of mono-alkenes from the corresponding feed alkanes [19].
In studying the aromatization reaction of short-chain alkanes on zeolite catalysts,
Guisnet and Gnep [18] proposed a reaction mechanism for the activation of propane
dehydrogenation reaction carried out over Ga/H-ZSM-5 bifunctional catalyst. The
authors suggested that propane was initially dissociated with the formation of gallium
hydride and gallium alkoxide species. Then, the propyl carbenium ion was rapidly
exchanged with zeolite protons through an alkyl surface migration reaction before
propene desorbed from the zeolite surface [18].
In a later study by Derouane et al. [1], the authors reported that the activation of
propane by Ga/H-ZSM-5 catalyst occurred via a bifunctional mechanism that involved
the formation of cylic protonated pseudo-cyclopropane (PPCP) intermediate. The PPCP
intermediate was formed via propane interaction with the Ga3+ and O2- ion pair via a
positively and negatively charged hydrogen atom respectively, and was further
converted into a pseudo-cyclopropane entity which was protonated by the Brønsted acid
[1]. The PPCP intermediate then decomposed to form CH4, C2H6, H2, and methyl, ethyl
and propyl carbenium ions which could react with benzene to form alkylbenzenes [1].
The same activation mechanism was also proposed by Bigey and Su [2] when the
authors investigated the alkylation of benzene with propane over Ga-modified H-ZSM-
5 catalyst.
In the presence of pure acidic catalyst only, alkanes are transformed into alkenes
via protolytic dehydrogenation or cracking reactions. The activation of light alkanes can
be explained by a monofunctional acid mechanism, which differs from the bifunctional
mechanism described earlier. The monofunctional reaction mechanism proposed that
alkanes are protonated on Brønsted acid sites of the zeolite catalyst to form the unstable
transition state carbonium ions. For propane activation, the carbonium ions were
30

decomposed to form methane and C2H5+ via -scission, to C3H7
+ via dehydrogenation or
to CH3+ and C2H6, depending on whether the proton attacks the C-C bond or the C-H
bond of the reacting alkane [2, 15, 17].
It was reported by Smirnov et al. [3] that the first reaction step for light alkanes
could proceed via three possible routes; dehydrogenation, cracking or hydrocracking.
The alkane activation on the strong Brønsted acid sites (H+) of H-MFI catalysts can be
described by the formation of the carbonium ion transition state which will then be
transformed either by dehydrogenation (Equation 3.2) or cracking (Equation 3.3)
reaction.
(3-3)
(3-4)
On a metal containing system however, dehydrogenation reaction became the
main reaction pathway [3]. The general equation for light alkane dehydrogenation on
metal (M) site [3] is as shown below :
(3-5)
Alkenes formed on the metal site can be further protonated on the acidic site
(H+) to give carbenium ion (Equation 3.5) which will then be involved in further
reactions.
(3-6)
The study by Smirnov et al. [3] showed that the reaction pathway for the
activation of light alkanes depend on the catalyst in the reaction system. The reactions
described by Equation 3.4 and 3.5 takes place on a mixed catalyst system where the
metallic and protonic sites are further apart. In the case where the acidic and metallic
sites are in close proximity, such as in a bifunctional catalyst, the dehydrogenation and
protonation steps occurred on the bifunctional metal-acidic centres (M, H+) [3], which
resulted in a direct formation of a very reactive carbenium ion:
(3-7)
31

Alkenes formed from the protolysis of light alkanes and/or from hydrogen
transfer reactions on the metal centres are very reactive in acid catalysed systems [15].
In addition to reacting with benzene to form alkylbenzene, these alkenes can go through
a series of oligomerization, cyclization, and cracking steps on the acidic sites of the
zeolite catalyst to form aromatic hydrocarbons [13, 15, 17, 20]. The CH3+ carbocation
and C2H5+ carbenium ion can react further with alkenes and alkanes while the C3H7
+
carbenium ion can be oligomerized by reaction with alkeneic intermediates.
In addition to promoting the dehydrogenation of light alkanes, the incorporation
of metal species on acidic catalysts enhances side reactions such as the hydrogenolysis
reaction that takes place on the metallic site of a bifunctional catalyst. Steinberg et al.
[20] reported that ethane was converted to methane via hydogenolysis on the Pt surface.
Even though Pt is believed to catalyse efficiently the dehydrogenation of ethane, it also
supports the hydrogenolysis of alkanes and higher aromatics [14]. It had been reported
that hydrogenolysis is a structural sensitive reaction as this reaction depends on the
metal type and metal surface [21], as well as metal particle size of the active phase [22].
Hydrogenolysis suppresses the formation of light alkenes via dehydrogenation,
which is a disadvantage to the main alkylation reaction as fewer alkene intermediates
will then react with benzene to produce alkylbenzenes [23]. The reaction mechanism of
ethane hydrogenolysis (Equation 3.7 – 3.10) proposed by Nayssilov [21] was initiated
via dissociative adsorption of ethane by breaking the C-H bond and then the obtained
ethyl radical undergoes dehydrogenation to the basic surface intermediate C2Hx(a). This
was followed by breaking of the C-C bond in the intermediate and the formation of
adsorbed particles containing one carbon atom [21].
(3-8)
(3-9)
(3-10)
(3-11)
32

Besides hydrogenolysis, oligomerization and cracking are other side reactions
that take place during alkylation. Smirnov et al. [3] mentioned that on Pt incorporated
ZSM-5 type catalysts; the main reaction pathway includes hydrocracking.
Hydrocracking produces methane, thus lowering the concentration of ethene for further
reactions. The oligomerization of light alkenes leads to the formation of larger alkenes,
which will then crack into smaller alkenes. These smaller alkenes will act as alkylating
agents for reaction with benzene on the acid sites.
As oligomerization is said to occur faster than dehydrogenation [17], it causes a
major problem to most alkylation reactions. Oligomerization is responsible for the
growth of bulky molecules in the product stream. These bulky molecules could prevent
further reactions from taking place if they are adsorbed on these active sites or if they
block access of reactants to these sites.
3.3.2 Benzene Alkylation with Light Alkanes
As the activation of light alkanes takes place on the metallic centre of the
bifunctional catalyst, aromatic formation occurs at Brønsted acid sites. The carbenium
ions or alkenes produced from the activation of light alkanes (described in the previous
section) act as alkylating agents for benzene alkylation reactions.
Derouane et al. [1] reported that the benzene alkylation reaction can be initiated
by benzene activation. During the benzene activation process, benzenium ion is formed
by benzene protonation on strong acid sites (Equation 3.11). However, if benzene was
adsorbed on weak acid sites, it cannot be activated, and the adsorbed carbenium ions
cannot react with benzene. The benzenium ion abstracts a hydride ion from the nearest
alkane molecule resulting in the formation of alkyl carbenium ion and cyclohexadiene
[1]. This benzene activation scheme was supported by Caeiro et al. [15] when
investigating the alkylation of benzene with light alkanes over a bifunctional catalyst.
H H
+H+ +C2H6C2H5
+++
(3-12)
33

Alkylbenzenes are formed by reactions of benzene with alkyl carbenium ions.
Equation 3.12 shows the reaction of carbenium ion with benzene to form alkylbenzene,
the desired product.
(3-13)
As pointed out earlier, the reaction pathway for light alkanes is dependent on the
catalytic system of the alkylation reaction. This suggests that the final product
composition will depend on the activation of light alkanes. Activation of propane on a
pure acidic catalyst forms propyl-, ethyl- and methylcarbonium ions which further lead
to the formation of propyl-, ethyl- and methylbenzenes. Modification of the acidic
zeolite catalyst with a metal species increases the activity of the catalyst and selectivity
to the desired alkylbenzene as the metal-acid centres can act together to dehydrogenate
and protonate the alkane at the same time.
Ethylbenzene formed from the alkylation of benzene with ethene may also
undergo polyalkylation reaction to produce diethylbenzenes (DEB) and triethylbenzenes
(TEB) as proposed by Perego and Ingallina [5]. The authors pointed out that the
polyethylbenzenes can be recycled back to the reactor where transalkylation takes place
to form EB until thermodynamic equilibrium is reached [5]. Over a bifunctional zeolite
catalyst, EB can be transformed into other products via secondary reactions as described
by Moreau et al. [24]. The alkylation of benzene is a reversible reaction. At high
reaction temperature and reactant conversion, dealkylation of alkylbenzenes is favoured.
This is responsible for the large amount of alkenes in the product stream [15].
The isomerization of EB into xylene isomers has been said to occur through a
bifunctional mechanism, and the rate of reaction was dependant on both metallic and
acidic sites [24]. Hydrogen was produced when light alkanes are dehydrogenated to
alkenes. In the presence of hydrogen, hydrogenolysis of EB takes place on the metallic
site of the bifunctional catalyst leading to the formation of toluene and methane. The
disproportionation of EB into benzene and diethylbenzene and the transalkylation
reaction of EB and xylene into ethyltoluenes and toluene or to dimethylethylbenzenes
and benzene are other side reactions that involve the consumption of EB.
34
The side reactions described could potentially decrease the yield and selectivity
of the desired product, EB. Therefore, knowledge of the main and side reaction
pathways is required to yield a stable and highly selective reaction. To achieve this, a
detailed kinetic study of the benzene alkylation with ethane was carried out. The
experimental set-up and results obtained will be discussed in the following sections.
3.4 Experimental Materials and Methodology
3.4.1 Experimental Set-up (Preparing the catalytic rig)
In this study, the alkylation reaction of benzene with ethane was catalysed by Pt
incorporated H-ZSM-5 catalysts with different SiO2/Al2O3 ratios. The steps taken to
prepare the PtH-ZSM-5(30) and PtH-ZSM-5(80) catalysts were discussed in Chapter 2.
In the following section, the operating procedure for the benzene alkylation reaction is
described.
3.4.1.1 Charging the reactor
The prepared catalyst fractions were loaded into the reactor so that the reaction
gas could flow through the catalyst bed. A layer of quartz wool was filled at the bottom
of the reactor to support the carborundum which was placed above the quartz wool
layer. The catalyst was positioned in the centre of the reactor in between a top and
bottom layer of quartz wool which separated the catalyst from the carborundum. The
quartz wool that was placed on the top and bottom part of the catalyst was flattened to
make a flat bed. A thermocouple, used to measure the temperature of the catalyst bed,
was positioned on the upper layer of the quartz wool between the carborundum and the
catalyst, and not in the catalyst bed to prevent breaking the catalyst particles. At the
upper most part of the reactor, another layer of carborundum was placed. Carborundum
layers work to reduce the temperature gradient between the feed gas and the catalyst
layers and also ensures constant reaction temperature along the catalyst bed. Figure 3.2
illustrates the schematic diagram of the reactor profile:
35
Figure 3.9 - Reactor Profile
3.4.1.2 Installing the reactor
The reactor was installed in a furnace, connected to gas pipelines. When the
reactor was properly positioned in the middle of the furnace, nitrogen gas was allowed
to flow through the reactor. Simultaneously, pipeline connections and joints were
checked for gas leakage with soap foams.
Glass wool was used to prevent heat loss at the top and bottom of the furnace in
addition to preventing the reactor from being in contact with the edge of the furnace.
The outlet of the reactor was not protected and this could lead to heat loss and
condensation of products. To avoid condensation of products, naked sections of glass
lines were wrapped with glass wool and after that, with heating tape (set to 70-75 oC).
3.4.2 Catalyst Pre-treatment
Prior to the reaction taking place, catalysts were activated overnight. Activation
of the catalyst was done by flowing air through the catalyst bed under the temperature
profile shown in Figure 3.3. The airflow rate was 30 ml min -1 and was maintained by a
purgemeter at a constant flow rate throughout the whole activation process. The initial
36
temperature was 20 oC and the temperature was increased to 530 oC at a rate of 1 oC
min-1. During the heating process, water was released. Therefore, to avoid damaging the
catalyst structure, the rate of heating was kept low. The catalyst was kept at 530 oC for 4
hours before it was reduced to 200 oC at a rate of 2 oC min-1.
Figure 3.10 - Catalyst Activation with Air Temperature Profile
The next step after activation in air was hydrogen pre-treatment. However,
before H2 was allowed to flow through the reactor, the system was purged with N2 to
remove all the air from the furnace so that an explosion resulting from the mixture of air
and H2 does not occur. N2 was set to a flow rate of 50 ml min -1 using a purgemeter, and
was left for an hour to purge the reactor.
If the traces of O2 in the reactor were negligible, the flow of N2 was switched to
H2 at a flow rate of 50 ml min-1. The hydrogen reduction step was carried out following
a temperature profile shown in Figure 3.4.
Figure 3.11 – Hydrogen Treatment Temperature Profile
37
3.4.3 Catalytic Experiments
3.4.3.1 Reaction gases mixture set-up
The reaction gases were mixed in the by-pass line so that the gas mixtures were
at the right composition and condition before being in contact with the catalyst. The
ratio of benzene to ethane concentration (mol %) in the experiment was 1:9. Ethane gas
(Grade N2 99.99 % purity) was bubbled through a perforated tube into a saturator that
contained liquid benzene (99.9+ % HPLC grade). Ethane flow rate was kept constant at
16 ml min-1 while the saturator temperature was maintained at 20 oC. The ratios of the
reactants are affected by the vapour pressure of the volatile liquid reactant, which is
highly influenced by temperature. As a result, the saturator is placed in a thermo flask to
keep the liquid phase benzene at a specific temperature throughout the experiment. At
20oC, atmospheric pressure, the ratio of ethane to benzene (mol %) is 1:9.
3.4.3.2 Kinetic Studies
Benzene alkylation with ethane was carried out at atmospheric pressure in a
continuous flow reactor at 370 oC. The reaction time starts once the gas mixtures were
allowed through the reactor. Catalyst loading of 500 mg was used. The gas stream was
redirected to the reactor channel once the desired composition of the reactant mixture
was achieved. The first GC injection was made at 1 hour on stream, on the Varian CP-
3800GC. Further injections were made automatically at a certain time interval. Before
any injection was made, the flow rates of ethane and benzene were determined. After
being run for different times-on-stream the reactor was purged with N2 (30 ml min -1)
for 0.5 h at the reaction temperature and then cooled down to room temperature in a
nitrogen atmosphere. The catalysts were then unloaded from the reactor for further
analyses.
3.4.3.3 Analysis of products
The product composition was analyzed by on-line GC, which was equipped with
a molecular sieve 13X packed column and a thermal conductivity detector (TCD) for
analysis of H2, and a 25 m long PLOT Al2O3/KCl capillary column with a flame
ionization detector (FID) for analysis of hydrocarbons (argon was used as a carrier gas
in both columns). The GC was calibrated once a year to ensure accurate analysis of
38
product compositions. An example of a typical GC trace obtained from the TCD and
FID detector is shown in Appendix A1.
3.5 Calculations
3.5.1 Conversion and selectivity calculations
The feed conversion is defined as the percentage of total products produced from the
initial feed reactant:
(3-14)
where Ci0 is the initial concentration of species i; Ci is the concentration of species i in
the reaction mixture.
Therefore, benzene conversion was calculated based on the ratio of the total amount of
benzene converted into aromatics to the total amount of benzene fed into the reactor:
(3-15)
where CAR is the aromatic product concentration; CB is the concentration of benzene in
the reaction mixture.
Likewise, ethane conversion was determined from the amount of ethane converted
during the alkylation reaction, i.e. the ratio of ethane converted to the total ethane feed.
(3-16)
where Ci is the product concentration, and CC2 is the ethane concentration
In this work, two different selectivities were defined; the selectivity of products formed
from ethane, SC2 (Equation 3.16) and the selectivity of products formed from benzene,
SB (Equation 3.17).
(3-17)
39
(3-18)
where CAR is the concentration of aromatic products.
The reaction yield is the amount of desired product formed in a chemical reaction.
Therefore, in the benzene alkylation reaction, the yield is the total amount of EB formed
(Equation 3.18).
(3-19)
3.5.2 Thermodynamic Conversion Calculations
The alkylation of benzene with ethane over bifunctional zeolite catalysts is a
two-step reaction which involves the dehydrogenation of ethane on the metallic centre
and the alkylation of benzene with ethene on acidic sites. Both reactions are reversible
reactions governed by thermodynamic equilibrium. Therefore, the thermodynamic
equilibrium conversion of these reactions should be known in order to analyse the
performance of the catalyst used. Detailed calculations for the equilibrium conversion
of the dehydrogenation and alkylation reactions are presented in Appendix A2.
The enthalpy, ∆H and entropy, ∆S of the reaction at a specific temperature can
be calculated using the standard enthalpy and entropy values given in Table 3.1.
Table 3-2 – Thermodynamic data at 298 K [25]
ComponentsSpecific Heat Capacity,
Cp (J mol-1 K-1)
Enthalpy,
∆H (J mol-1)
Entropy,
∆S (J mol-1 K-1)
Ethane 52.5 -84000 229.12
Ethene 42.9 52400 219.3
Hydrogen 28.8 0 130.57
Benzene 81.67 82880 269.3
EB 128.41 29920 360.63
40
The standard enthalpy and entropy of a reaction can be calculated using the equations
below:
(3-20)
(3-21)
For calculation of enthalpy and entropy of reaction at a specific temperature, the
following equations were used:
(3-22)
(3-23)
The equilibrium constant (Equation 3.24) can be determined using the Gibbs free
energy equation (Equation 3.23):
(3-24)
(3-25)
3.5.2.1 Dehydrogenation of ethane
The equilibrium conversion of the dehydrogenation of ethane (Equation 3.24)
was determined from the pure ethane feed.
C2H6 H 2C2H4
+ (3-26)
The calculation for the conversion of ethane dehydrogenation reaction gives an
equilibrium conversion of 0.52 % at reaction temperature of 370 oC. (See Appendix A2-
2)
3.5.2.2 Alkylation of benzene with ethane
The alkylation reaction of benzene with ethane (Equation 3.25) was carried out
with feed ratio of 90 mol% of ethane and 10 mol% of benzene. The same calculation
41
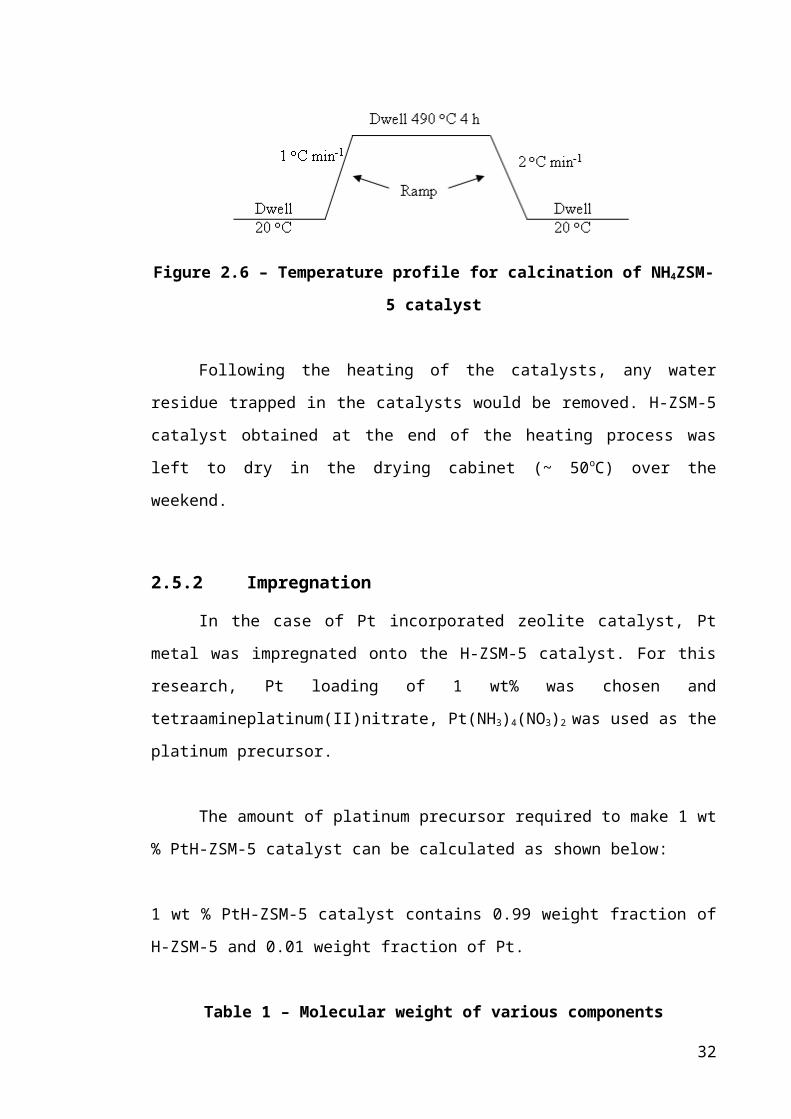
steps were followed to determine the equilibrium conversion of the alkylation reaction.
The equilibrium conversion was calculated to be 13.2 %. (See Appendix A2-1)
C2H5
C2H6 H 2++
(3-27)
3.6 Results and Discussions
The alkylation of benzene with ethane was carried out over two different 500 mg
loadings of PtH-ZSM-5 catalyst with SiO2/Al2O3 ratios of 30 and 80 respectively. The
ratio of benzene to ethane concentration (mol %) in this experiment was 1:9. The
experimental data for benzene alkylation with ethane are presented in Appendix A3.
3.6.1 Effect of time-on-stream (TOS) on the performance of the 1 wt%
PtH-ZSM-5(30) catalyst
0 10 20 30 40 500
5
10
15
20
25
y = 2.69 + 4.18 e-0.079t
y = 12.22 + 8.67 e-0.035t
Con
vers
ion,
%
Time on Stream, h
Figure 3.12 – Effect of TOS on ethane (-■-) and benzene (-●-) conversion
Figure 3.5 demonstrates the performance of the PtH-ZSM-5(30) catalyst used in
this work for benzene alkylation with ethane. The activity of the PtH-ZSM-5(30)
42
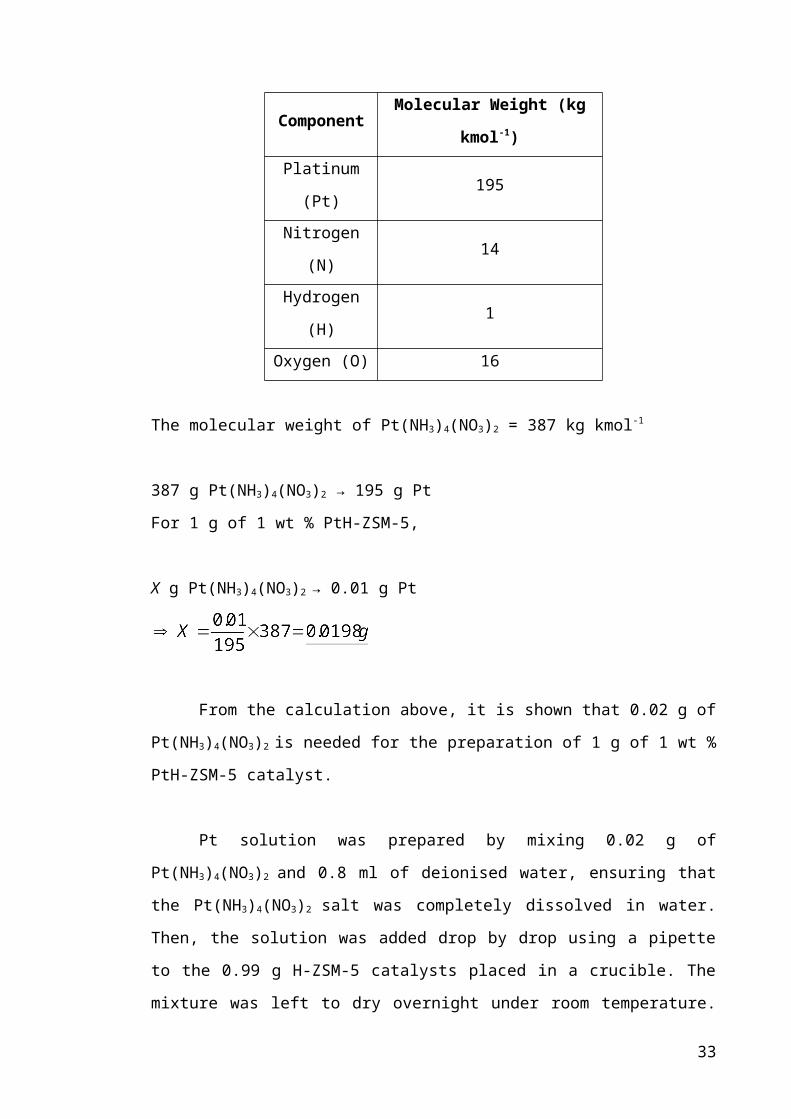
catalyst decreased with TOS, as shown by the decreasing benzene and ethane
conversion with TOS. The conversion of ethane decreased more rapidly compared to
the drop in benzene conversion during the 48 h on-stream as demonstrated by the fitted
exponential decay time constants of 0.079 ± 0.009 h-1 for ethane and 0.035 ± 0.014 h-1
for benzene. This demonstrates the unstable performance of the PtH-ZSM-5(30)
catalyst. The conversion of benzene is higher than the conversion of ethane, since
ethane is available in excess, in the feed stream, compared to benzene.
As discussed in the literature review, ethane undergoes dehydrogenation
(Equation 3.26) over platinum sites of the bifunctional zeolite catalyst. At the reaction
temperature (370 oC), equilibrium conversion for the dehydrogenation of ethane was
calculated to be 0.52 %. Ethane conversion was observed to be higher than the
equilibrium conversion (Figure 3.5) for the PtH-ZSM-5(30) catalyst. On highly acidic
catalysts, such as PtH-ZSM-5(30), the alkylation of benzene with ethene would be
enhanced, hence pulling the ethane dehydrogenation reaction forward.
C2H6 H 2C2H4
+ (3-28)
Similarly to the conversion of ethane, benzene conversion into EB was also
limited by thermodynamics, and the equilibrium conversion (Equation 3.27) was
calculated to be 13.5 % (Section 3.5.2.2). The conversion of benzene over the PtH-
ZSM-5(30) catalyst exceeded this equilibrium conversion to give a benzene conversion
of 20.5 % at the start of the reaction, suggesting that, apart from the transformation of
benzene into EB, benzene was also converted into other aromatic products.
C2H5
C2H6 H 2++
(3-29)
Figure 3.6 shows the variation of ethene concentration in the product stream
with TOS. The increasing concentration of ethene could be due to the enhanced
alkylation of benzene on the highly acidic PtH-ZSM-5(30) catalyst, as discussed earlier.
The high concentration of ethene led to side reactions such as oligomerization and
43
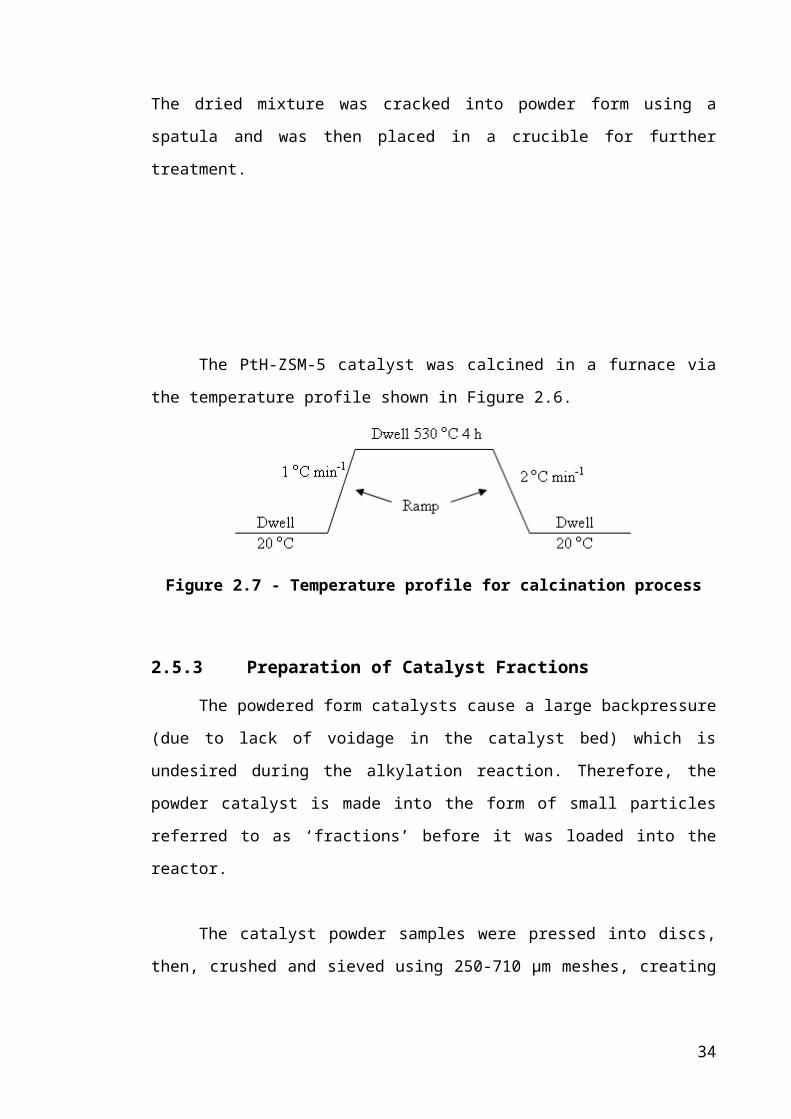
cracking which produces large amount of alkenes. It was previously reported that
coking occurred rapidly from alkenes due to the high reactivity of the adsorbed species
(carbenium ions) formed from alkenes [26]. Therefore, the low stability of the PtH-
ZSM-5(30) catalyst, illustrated by the drop in reactant’s conversions (see Figure 3.5),
could result from the poisoning of the complex metal-acid centre of the PtH-ZSM-5(30)
catalyst by the irreversibly chemisorbed coke precursors [27].
0 10 20 30 40 500.00
0.02
0.04
0.06
0.08
0.10
0.12
0.14
Con
cent
ratio
n, m
ol%
Time on Stream, h
Figure 3.13 – Effect of TOS on the ethene (-■-) concentration
44
0 10 20 30 40 501.2
1.3
1.4
1.5
1.6
1.7
1.8
Con
cent
ratio
n, m
ol%
Time on Stream, h
Figure 3.14 – Effect of TOS on hydrogen (-■-) concentration
The incorporation of platinum on H-ZSM-5 catalyst was reported to enhance the
dehydrogenation, but it also supports hydrogenolysis of alkanes and alkylaromatics
[14]. The high concentration of ethene at low TOS indicated that ethane was
dehydrogenated into ethene, producing hydrogen at the same time. Hence this explains
the large amount of hydrogen detected by the GC at low TOS as shown in Figure 3.7.
As the dehydrogenation reaction of ethane produces equimolar concentration of ethene
and hydrogen (Equation 3.26), the concentration of hydrogen would be expected to
increase with TOS. However, the contrary was observed. The concentration of hydrogen
decreased with TOS, suggesting that the hydrogen produced during the dehydrogenation
reaction could be consumed by side reactions such as hydrogenolysis and hydrogenation
reactions.
Hydrogenolysis only takes place in the presence of hydrogen. The existence of
hydrogen will influence the reaction pathway during the alkylation reaction [20]. The
hydrogen produced during dehydrogenation would be adsorbed on platinum metal
species, catalysing hydrogenolysis (Equation 3.28) which produces methane (Figure
3.8). Previous study pointed out that large amounts of methane were formed on Pt-
loaded catalysts due to their strong hydrogenolysis activity [28].
45
C2H6 + 2CH4H2 (3-30)
As methane was not supplied in the reaction feed, the concentration of methane
detected could be a result of side reactions that took place during the alkylation of
benzene. The concentration of methane decreased rapidly with TOS, from 6 mol % to
3.5 mol % in the first 8 hours of alkylation. Due to the depleting concentration of
hydrogen (Figure 3.7), the rate of hydrogenolysis was also reduced. This resulted in a
decrease in the concentration of methane. Hydrogenolysis is a ‘structural-sensitive’
reaction where the specific rate of alkane hydrogenolysis is highly dependent on the
metal particle size of the active phase [22].
0 10 20 30 40 50
1
2
3
4
5
6
Con
cent
ratio
n, m
ol%
Time on Stream, h
Figure 3.15 – Effect of TOS on methane (-■-) concentration
46
0 10 20 30 40 500.5
0.6
0.7
0.8
0.9
1.0
Con
cent
ratio
n, m
ol%
Time on Stream, h
Figure 3.16 – Effect of TOS on EB (-■-) concentration
The alkylation of benzene with ethane was reported to proceed via two
consecutive reactions steps; the dehydrogenation reaction of ethane to form ethene over
metallic platinum sites and the alkylation of benzene with ethene over Brønsted acid
sites [11]. Even though the activity of PtH-ZSM-5(30) catalysts (based on benzene
conversion) decreased from 20.5 % to 13.8 %, the selectivity of EB increased by 30 %
to yield a selectivity of 80 % at 48 h TOS. Ethene, being the intermediate product
formed on the metal centre would proceed to the acid sites of the catalyst for further
reactions [20]. The desired pathway for ethene molecules would be alkylation with
benzene to form EB. The production of EB was dependent on the intermediate product,
ethene. Thus, the increase in EB concentration observed in Figure 3.9 could be related
to the increase in concentration of ethene with TOS. In addition, the drop in the
concentrations of toluene and triethylbenzene (TEB) could explain the increment in EB
concentration with TOS.
47
0 10 20 30 40 500.000
0.002
0.004
0.006
0.008
0.010
0.012
0.014
0.016
Con
cent
ratio
n, m
ol%
Time on Stream, h
Figure 3.17 – Effect of TOS on meta-DEB (-■-) and para-DEB (-●-) concentration
Further alkylation of EB with ethene produces diethylbenzene (DEB). DEB
could also be formed via disproportionation of EB [29]. Due to pore restrictions within
the ZSM-5 channels, it is more likely that DEB was formed via alkylation than
disproportionation as the disproportionation of EB required two EB molecules as
opposed to alkyation reaction which required only one [30]. The concentration of the
DEB isomers; meta- and para-DEB shown in Figure 3.10 varied with TOS. The
differences in the mobility rate of the DEB isomers inside the catalyst’s framework
could have influenced the concentration of the DEB isomers at the reactor’s outlet. The
changes in the selectivity of the DEB isomers with TOS will be discussed in the next
section.
Besides the main reactions (dehydrogenation of ethane and alkylation of
benzene), side reactions also took place. These side reactions have a negative effect on
the EB selectivity. An example of a competing reaction is hydrogenolysis discussed
previously. The high concentration of ethene could contribute to the presence of by-
products from oligomerization, cracking and isomerization, which eventually led to
decrease in catalytic performance of PtH-ZSM-5(30) catalysts.
48
Propane and propene were observed in the product stream and their
concentration decreased as the reaction progressed. The possible route for propene
formation is from oligomerization of ethene to form higher hydrocarbons, then followed
by a cracking reaction. Steinberg et al. [20] reported that propene was formed via the
oligomerization reaction of ethene to form hexene (Equation 3.29), which was then
cracked to produce propene (Equation 3.30). Instead of the direct formation of hexene
from ethene oligomerization, hexene was formed from the reaction of ethene with
butene (Equation 3.31 – 3.32). Hexene was then involved in cracking reaction to
produce propene (Equation 3.30). Propene would then be converted into propane by
hygrogenation on the platinum dispersed on H-ZSM-5 catalysts (Equation 3.33).
3C2H4 C6H12 (3-31)
C6H12 C3H6 + C3H6 (3-32)
C2H4 + C2H4 C4H8 (3-33)
C2H4 + C4H8
C6H12 (3-34)
C3H6 + H2 C3H8 (3-35)
Hexene was produced as an intermediate during oligomerization and cracking
reactions to form propane. However, hexene was not present in the product distribution.
This may possibly be because of the low concentration of hexene in the product stream.
Hexene is a very reactive molecule and cracks immediately into propene, and is
therefore not detected by the GC.
The concentrations of propane and propene both decreased, while the
concentration of isopropylbenzene increased with TOS. The propene concentration
remained low throughout the course of the reaction as it was being consumed during the
alkylation of benzene with propene. In addition, the decreasing concentration of
propane and propene could also result from the lower cracking reactions, since Wang
and Manos [31] concluded that strong acid sites, which were responsible for the
cracking reactions, were preferably poisoned by coke.
49

Toluene was the most abundant aromatic formed after EB. The formation of
toluene is undesirable as it affects the selectivity to the desired product, EB. Toluene
could possibly be formed via hydrogenolysis of EB and alkylation of benzene with
methane. In addition, Smirnov et al. [3] suggested that transalkylation reaction of EB
with benzene or the direct alkylation of benzene with ethane could lead to the high
concentration of toluene at the reactor outlet. However, at the reaction conditions used,
the reactivity of methane is very low. Therefore, toluene was possibly formed from the
hydrogenolysis of EB and transalkylation of EB and benzene. As the hydrogen
concentration decreased with TOS, hydrogenolysis reaction of EB was unlikely to take
place. Hence, the concentration of toluene decreased with time.
While the selectivity towards DEB increased with TOS, it decreased with
benzene conversion. The decrease in the selectivity of DEB could be associated with the
increasing selectivity of ethyltoluene and TEB in the product distribution. Ethyltoluene
could either be formed from hydrogenolysis of DEB or it could also be a product of
alkylation of toluene with ethene. Due to the high concentration of toluene, compared
with the concentration of DEB, ethyltoluene was most likely formed from the alkylation
of toluene with ethene.
3.6.2 Effect of TOS on shape selectivity reactions for the 1 wt% PtH-ZSM-
5(30) catalyst
The variations in the shape selective reactions that took place during the
alkylation of benzene with ethane, such as the alkylation of EB with ethene to form
DEB and the EB hydroisomerization to produce xylenes demonstrate the effect of
catalyst deactivation with TOS.
50
0 10 20 30 40 5030
35
40
45
50
55
60
65
70
Sele
ctiv
ity, m
ol%
Time on Stream, h
Figure 3.18 – Effect of TOS on the selectivity of meta-DEB (-■-) and para-DEB
(-●-)
The product distribution of the isomers of DEB; meta- and para- DEB is shown
in Figure 3.11. The ratio of meta-DEB to para-DEB expected at thermodynamic
equilibrium at 370 oC is 1.81. Due to steric constraints of the two ethyl groups, ortho-
DEB was not observed in the product distribution. According to Schumacher and Karge
[32], para-DEB diffuses much faster to the outside of the pores of the catalyst than the
other 2 isomers. In addition, a previous study also found that the selectivity of para-
isomers should be enhanced as coke deposition reduces the effective channel size of the
catalyst and increases the diffusion resistance [33]. This should have resulted in an
enhancement of selectivity to para-isomers as the diffusivity of para-DEB was not
hindered by geometrical constraints. Despite this, the selectivity to para-DEB decreased
while the selectivity to meta-DEB increased with TOS in this work. This finding is rare
in comparison with the typical effect of coking.
It was proposed that, due to thermodynamic limitations, para-DEB is converted
to meta-DEB via isomerization [29]. This led to a higher meta-DEB selectivity in the
product distribution. However, a different explanation was given for the enhancement of
the para-DEB selectivity when the alkylation reaction of benzene with ethene was
51
carried out over ZSM-5 catalyst. Kaeding [34] pointed out that large ZSM-5 crystals
gave higher concentrations of para-DEB as compared with small ZSM-5 crystallites
[34]. In large crystallites, meta-DEB and ortho-DEB isomers were isomerized to para-
DEB because of the longer residence time of DEB isomers in the crystallites [34].
Given that there are two possible explanations for the variation of DEB isomers with
TOS, no conclusion will be proposed for the observed trend until the effect of pore
structure has been taken into consideration.
0 10 20 30 40 5020
22
76
78
80
Sele
ctiv
ity, m
ol%
Time on Stream, h
Figure 3.19 – Effect of TOS on the selectivity of ortho-xylene (-■-) and meta- +
para- xylene (-●-)
The formation of xylenes could be explained by the isomerization of EB, as
described by Lukyanov and Vazhnova [11]. The ratio of para- + meta-xylene to ortho-
xylene expected at thermodynamic equilibrium at 370 oC is 3.24. The relationship
between the selectivity of xylene isomers with TOS (Figure 3.12) illustrates that ortho-
xylene selectivity increased, while meta- + para- xylene selectivity decreased with
TOS. This result is consistent with earlier research by Sotelo et al. [35], who reported
the decrease in selectivity to para-xylenes with TOS during the alkylation of toluene
with methanol over Mg-modifed ZSM-5 catalyst. They suggested that pore blockage by
coke molecules was responsible for the observed trend [35].
52
Further explanation for the product distribution variation of the shape selectivity
reactions will be given in Chapter 8 after taking into consideration the effect of coke
deposition on the structural and transport properties of PtH-ZSM-5 catalysts.
3.6.3 Effect of Acidity on Benzene Alkylation with Ethane
In this section, the difference between the catalytic activities of PtH-ZSM-5(30)
and PtH-ZSM-5(80) catalysts will be discussed.
Figures 3.13 and 3.14 compare the conversion of benzene and ethane for the two
bi-functional zeolite catalysts used in this work. The activity of the PtH-ZSM-5(30)
catalyst decreased with TOS, as shown by the decreasing ethane and benzene (Figure
3.13) conversion with TOS. As for the PtH-ZSM-5(80) catalyst, a small drop in benzene
and ethane conversion was observed initially, but the benzene and ethane conversion
remained stable after 15 hours on stream. The difference in the activity of the two PtH-
ZSM-5 catalysts could be due to deactivation of different active sites, where the
deactivation of the Pt sites could lead to the drop in the activity of the PtH-ZSM-5(80)
catalyst, while coke deposition on the acid sites could possibly dominate the
deactivation of the PtH-ZSM-5(30) catalyst. Further work is required to conclude the
cause of catalyst deactivation, and this will be discussed in the future work section in
Chapter 8.
53
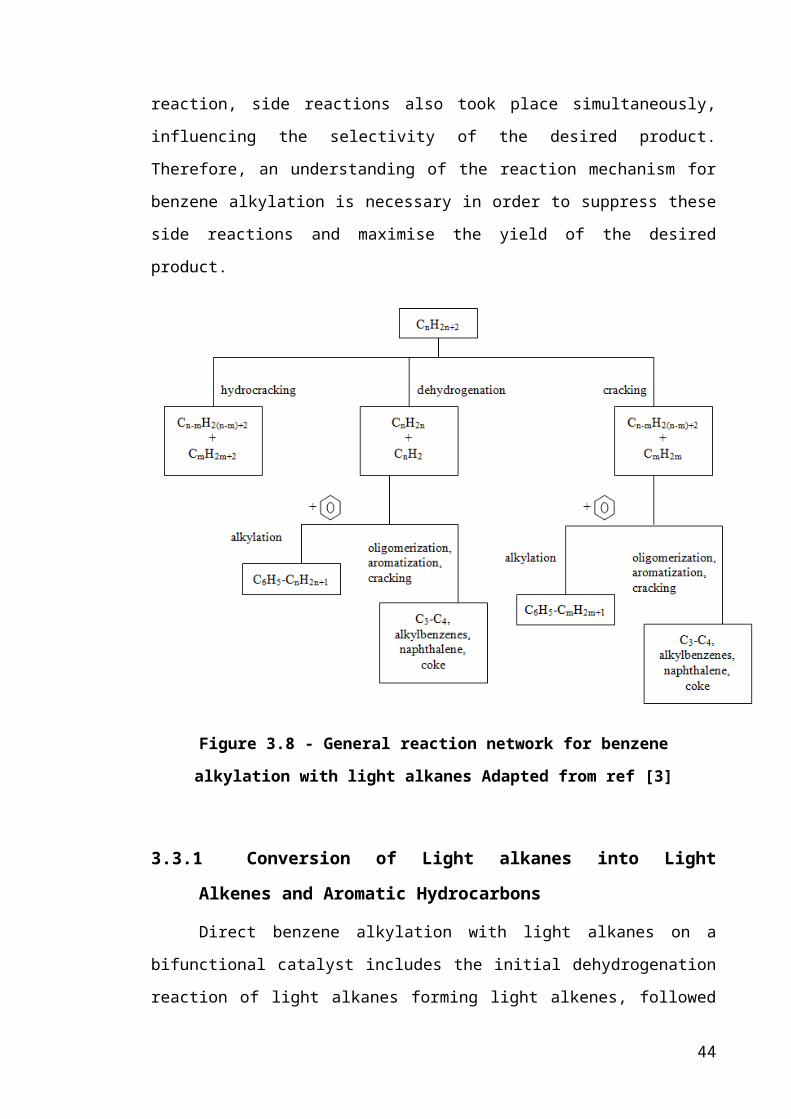
0 10 20 30 40 500
5
10
15
20
25
Con
vers
ion,
%
Time on Stream, h
Figure 3.20 – Comparison of ethane (-■-) and benzene (-●-) conversion on PtH-
ZSM-5(30) catalyst
0 10 20 30 40 500
2
4
6
8
10
12
Con
vers
ion,
%
Time on Stream, h
Figure 3.21 – Comparison of ethane (-■-) and benzene (-●-) conversion on PtH-
ZSM-5(80) catalyst
54
0 10 20 30 40 500123456789
1011121314
Sele
ctiv
ity, m
ol%
Time on Stream, h
Figure 3.22 – Comparison of ethene selectivity in the aromatic products for PtH-
ZSM-5(30) (-●-) and PtH-ZSM-5(80) (-■-) catalyst
The conversion of ethane for both the catalysts studied was higher than the
equilibrium conversion of ethane dehydrogenation (0.52 %). The PtH-ZSM-5(30)
catalyst yielded a larger ethane conversion, but lower stability as illustrated by the drop
in the conversion of the reactants with time. With higher acidity for the PtH-ZSM-5(30)
catalyst, the alkylation of benzene with ethene was enhanced, hence pushing ethane
dehydrogenation forward. Even though the conversion of ethane is higher on the PtH-
ZSM-5(30) catalyst, the selectivity of ethene is lower compared with the PtH-ZSM-
5(80) catalyst. The lower selectivity of ethene (Figure 3.15) for the PtH-ZSM-5(30)
catalyst than the corresponding selectivity for the PtH-ZSM-5(80) catalyst could be due
to the higher bimolecular ethene dimerization steps, which are the initial steps in alkane
oligomerization and cracking reactions [10].
Similarly, benzene conversion is greater on the PtH-ZSM-5(30) catalyst than the
PtH-ZSM-5(80) catalyst. This result is consistent with previous work which proved that
the catalytic activity increased when the SiO2/Al2O3 ratio decreased, as a result of
increasing acidity of the zeolite catalyst [4, 10]. The higher acidity of the PtH-ZSM-
5(30) catalyst also enhanced other reactions involving benzene apart from its
55
transformation into EB. Therefore, benzene conversion was greater than the equilibrium
conversion (13.5 %) evaluated for benzene alkylation at 370oC. As for the PtH-ZSM-
5(80) catalyst, the catalyst demonstrated stable performance during the alkylation. This
could be attributed to lower concentrations of alkenes which helped suppress side
reactions that lead to coke formation and catalyst deactivation.
3.6.4 Effect of acidity on product distribution
Even though Kato et al. [8] reported the effect of SiO2/Al2O3 on the alkylation of
benzene with ethane in terms of the yield of EB and styrene, their work did not include
the effect of acidity on reactant’s conversion as well as product selectivities. In this
section, the variations in product selectivities due to different acidities of the PtH-ZSM-
5 catalyst are discussed.
The alkylation of benzene with ethane over bifunctional PtH-ZSM-5 catalysts is
dominated by two consecutive reactions; ethane dehydrogenation into ethene, catalyzed
by platinum sites and benzene alkylation with ethene, taking place on Brønsted acid
sites. In Figure 3.15, it is shown that the selectivity of ethene is higher when the reaction
was carried out with the PtH-ZSM-5(80) catalyst. The lower ethene selectivity indicated
that ethene was involved in side reactions such as oligomerization and cracking over
Brønsted acid sites of the PtH-ZSM-5(30) catalyst.
The sequence of oligomerization and cracking reactions led to the production of
different alkenes such as propenes, butenes, pentenes and hexenes. However, only
propenes and butenes were detected by GC in the product stream. The higher
concentration of propenes and butenes in the product distribution of the PtH-ZSM-5(30)
catalyst compared to the PtH-ZSM-5(80) catalyst explained the lower selectivity to
ethene observed for the two different catalysts. The higher concentration of these
alkenes promoted side reactions leading to coke formation which consequently reduces
the performance of the catalyst. The formation of propene is unfavourable as it
competes with ethene to react with benzene. The alkylation reaction of benzene with
propene produces propylbenzene. The selectivity of propylbenzene increased with TOS
for both bifunctional PtH-ZSM-5 catalysts although the selectivity of propylbenzene is
lower for the PtH-ZSM-5(30) catalyst.
56
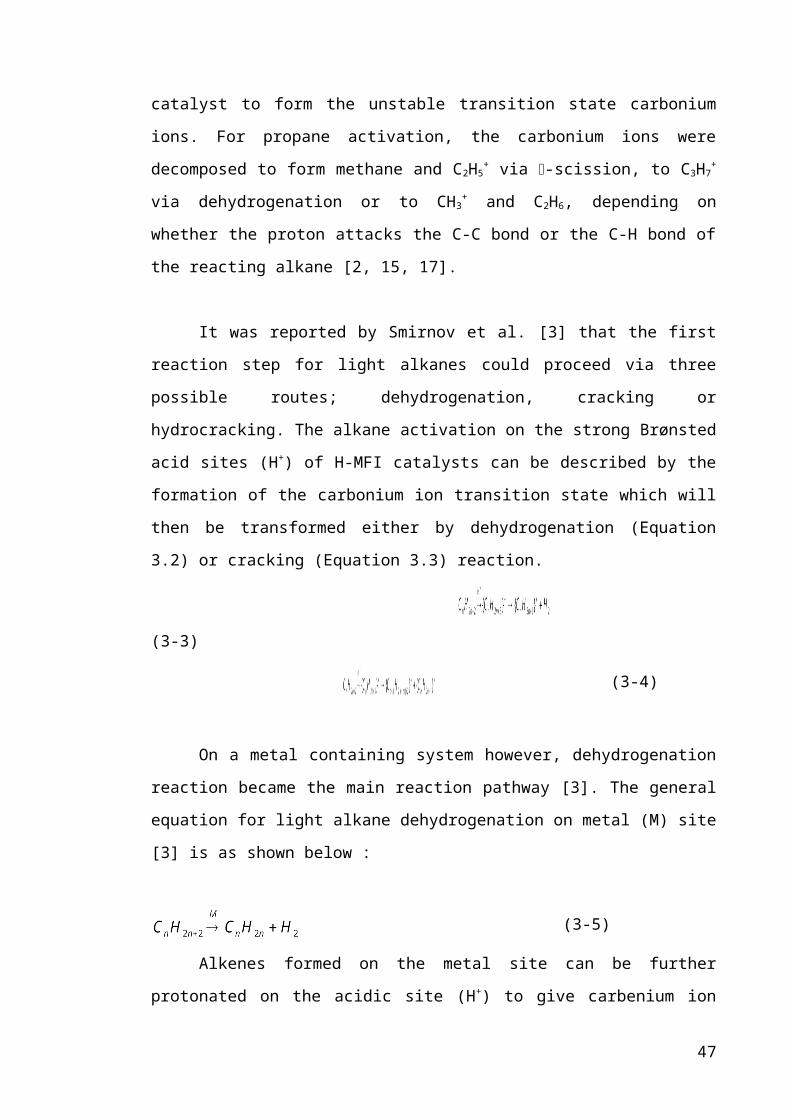
0 10 20 30 40 5035404550556065707580859095
Sele
ctiv
ity, m
ol%
Time on Stream, h
Figure 3.23 – Comparison of EB selectivity in the aromatic products for PtH-ZSM-
5(30) (-●-) and PtH-ZSM-5(80) (-■-) catalyst
From Figure 3.16, it follows that the selectivity of the desired product, EB was
increasing with TOS for both zeolite catalysts. The gain in EB selectivity could be
associated with the decrease in selectivities of side products such as toluene, xylene,
triethylbenzene, and ethyltoluene. The EB selectivity is lower for the PtH-ZSM-5(30)
catalyst when compared with the corresponding selectivities observed with the PtH-
ZSM-5(80) catalyst. The higher acidity of the PtH-ZSM-5(30) catalyst could possibly
be responsible for the transformation of EB to other aromatic products, hence
decreasing the selectivity of EB.
As benzene conversion increased, the selectivity of EB in the aromatic products
decreased. The decreasing selectivity of EB could result from the transformation of EB
into secondary and tertiary products such as toluene, DEB, xylenes, TEB and
ethyltoluene which demonstrated increasing selectivity with benzene conversion. Since
the concentration of toluene is much higher than the concentration of methane for the
PtH-ZSM-5(80) catalyst, it was proposed that toluene could be formed from other
reactions such as the transalkylation of EB with xylene to produce toluene and
57
ethyltoluene, apart from EB hydrogenolysis over platinum sites on the H-ZSM-5
catalyst.
From the experimental data, it was observed that the selectivity of the tertiary
product, TEB was higher when the alkylation reaction was carried out with the PtH-
ZSM-5(30) catalyst. As a result, the selectivity to DEB was reduced as TEB was formed
via alkylation of DEB with ethene. The effect of acidity on selectivites of DEB isomers
are illustrated in Figures 3.17 and 3.18. For the reaction that was carried out over the
PtH-ZSM-5(80) catalyst, the selectivity of the meta-DEB and para-DEB isomers
remained constant with TOS. However, this was not the case for the reaction over the
PtH-ZSM-5(30) catalyst, where the selectivity of meta-DEB isomer increased at the
expense of the selectivity of the para-DEB isomer with TOS. The difference observed is
believed to be related to the deactivation of the catalyst by coke molecules, which could
either poison the active sites or block access to these active sites. Further investigations
were carried out to understand these observations. They will be discussed in Chapter 8.
0 10 20 30 40 5030
35
40
45
50
55
60
65
70
Sele
ctiv
ity, m
ol%
Time on Stream, h
Figure 3.24 – Variations of meta-DEB (-■-) and para-DEB (-●-) isomer selectivity
with TOS over PtH-ZSM-5(30) catalyst
58
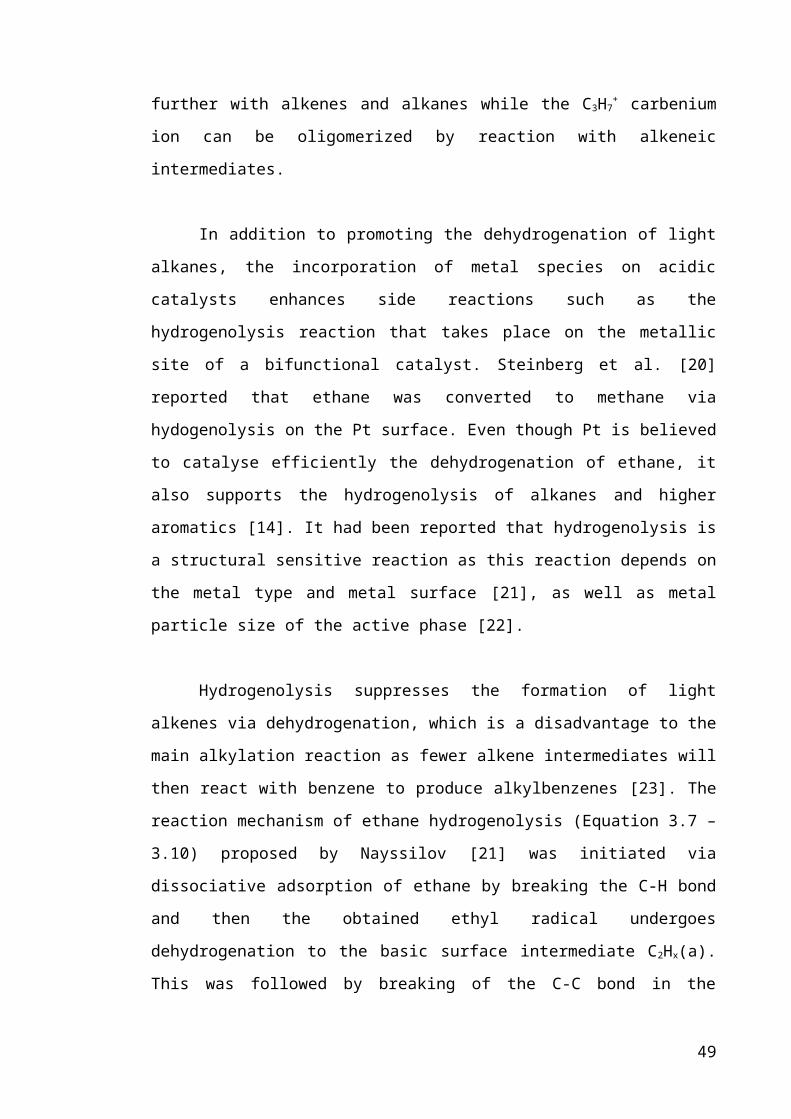
0 10 20 30 40 500
10
20
30
40
50
60
Sele
ctiv
ity, m
ol%
Time on Stream, h
Figure 3.25 – Variations of meta-DEB (-■-), para-DEB (-●-) and ortho-DEB (-▲-)
isomer selectivity with TOS over PtH-ZSM-5(80) catalyst
0 10 20 30 40 500
10
20
30
40
50
60
70
Sele
ctiv
ity, m
ol %
Time on Stream, h
Figure 3.26 – Comparison of meta-DEB (-■-), para-DEB (-●-) and ortho-DEB (-▲-)
isomer selectivity over PtH-ZSM-5(80) catalyst with meta-DEB (-▼-) and para-
DEB (-♦-) isomer selectivity over PtH-ZSM-5(30) catalyst, with TOS
59

Figure 3.19 combines the selectivites of DEB isomers for both the PtH-ZSM-5
catalysts studied. It can be seen that the PtH-ZSM-5(30) catalyst was more para-
selective when compared with the PtH-ZSM-5(80) catalyst at the start of the reaction.
However, at higher TOS, the enhanced para- selectivity observed for the PtH-ZSM-
5(30) catalyst disappears, and the para- and meta- DEBs selectivities obtained over the
PtH-ZSM-5(30) and PtH-ZSM-5(80) catalysts are approximately the same.
3.7 Conclusions
The alkylation of benzene with ethane over two PtH-ZSM-5 catalysts of
different SiO2/Al2O3 was analysed in this study. Due to the difference in acidities, the
performance of these PtH-ZSM-5 catalysts differs in terms of the reactant conversion
and product selectivities. However, detailed analysis of the product
distributions/selectivities confirmed that for both reactions, EB was formed via two
consecutive reactions, (i) dehydrogenation of ethane into ethene and hydrogen on
platinum sites and (ii) benzene alkylation with ethene over Brønsted acid sites.
The deactivation of the PtH-ZSM-5(30) catalyst was found to be more
significant when compared with the PtH-ZSM-5(80) catalyst as a result of lower ethene
and/or alkene concentration in the latter, which is responsible for the formation of coke.
During the alkylation of benzene with ethane over the PtH-ZSM-5(30) catalyst, it was
observed that the partially deactivated catalysts were more para-selective than the fresh
PtH-ZSM-5(30) catalyst. On the contrary, the selectivity of the DEB isomers remained
constant with TOS when the reaction was carried out over the PtH-ZSM-5(80) catalyst.
The difference in the selectivity changes of the DEB and xylene isomers with TOS for
the shape selective reactions of the two PtH-ZSM-5 catalysts was suggested to be
caused by the effect of coke deposition during alkylation.
3.8 References
[1] E.G. Deruoane, H.Y. He, S.B.D.A. Hamid, and I. Ivanova, Journal of Molecular
Catalysis A:Chemical 158 (2000) 5-17.
[2] C. Bigey, and L. Su, Journal of Molecular Catalysis. A, Chemical 209 (2004)
179-187.
60

[3] A.V. Smirnov, E.V. Mazin, E.E. Ponomoreva, E.E. Knyazeva, S.N. Nesterenko,
and I.I. Ivanova, Benzene Alkylation with Alkanes over Modified MFI
Catalysts, Montpellier, France. 2001.
[4] A.V. Smirnov, E.V. Mazin, V.V. Yuschenko, E.E. Knyazeva, S.N. Nesterenko,
I.I. Ivanova, L. Galperin, R. Jensen, and B. S., Journal of Catalysis 294 (2000)
266-277.
[5] C. Perego, and P. Ingallina, Catalysis Today 73 (2002) 3-22.
[6] T.F. Degnan, C.M. Smith, and C.R. Venkat, Applied Catalysis. A, General 221
(2001) 283-294.
[7] G.A. Olah, P. Schiling, J.S. Staral, Y. Halpern, and J.A. Olah, Journal of
American Chemical Society 97 (1975) 6807-6810.
[8] S. Kato, K. Nakagawa, N. Ikenaga, and T. Suzuki, Catalysis Letters 73 (2001)
175.
[9] S. Kato, K. Nakagawa, N. Ikenaga, and T. Suzuki, Chemistry letters 3 (1999)
207-208.
[10] D.B. Lukyanov, and T. Vazhnova, Journal of Molecular Catalysis A: Chemical
279 (2008) 128-132.
[11] D.B. Lukyanov, and T. Vazhnova, Journal of Catalysis 257 (2008) 382-389.
[12] A. Krogh, A. Hagen, T.W. Hansen, C.H. Christensen, and I. Schmidt, Catalysis
Communications 4 (2003) 627-630.
[13] P. Schulz, and M. Baerns, Applied Catalysis A:General 78 (1991) 15-29.
[14] L.R.R. De Araujo, and M. Schmal, Applied Catalysis A:General 203 (2000)
275-284.
[15] G. Caeiro, R.H. Carvalho, Z. Wanga, M.A.N.D.A. Lemosa, F. Lemos, M.
Guisnet, and F.R. Ribeiro, Journal of Molecular Catalysis. A, Chemical 255
(2006) 131-158.
[16] Y.V. Joshi, and K.T. Thomson, Catalysis Today 105 (2005 ) 106-121.
[17] G.L. Buckles, and G.J. Hutchings, Catalysis Today 31 (1996) 233-246.
[18] M. Guisnet, N.S. Gnep, and F. Alario, Applied Catalysis A: General 89 (1992)
1-30.
[19] M.M. Bhasin, J.H. McCain, B.H. Vora, T. Imai, and P.R. Pujad, Applied
Catalysis A: General 221 (2001) 397-419.
[20] K.H. Steinberg, U. Mroczek, and F. Roessner, Applied Catalysis : A General 66
(1990) 37-44.
61
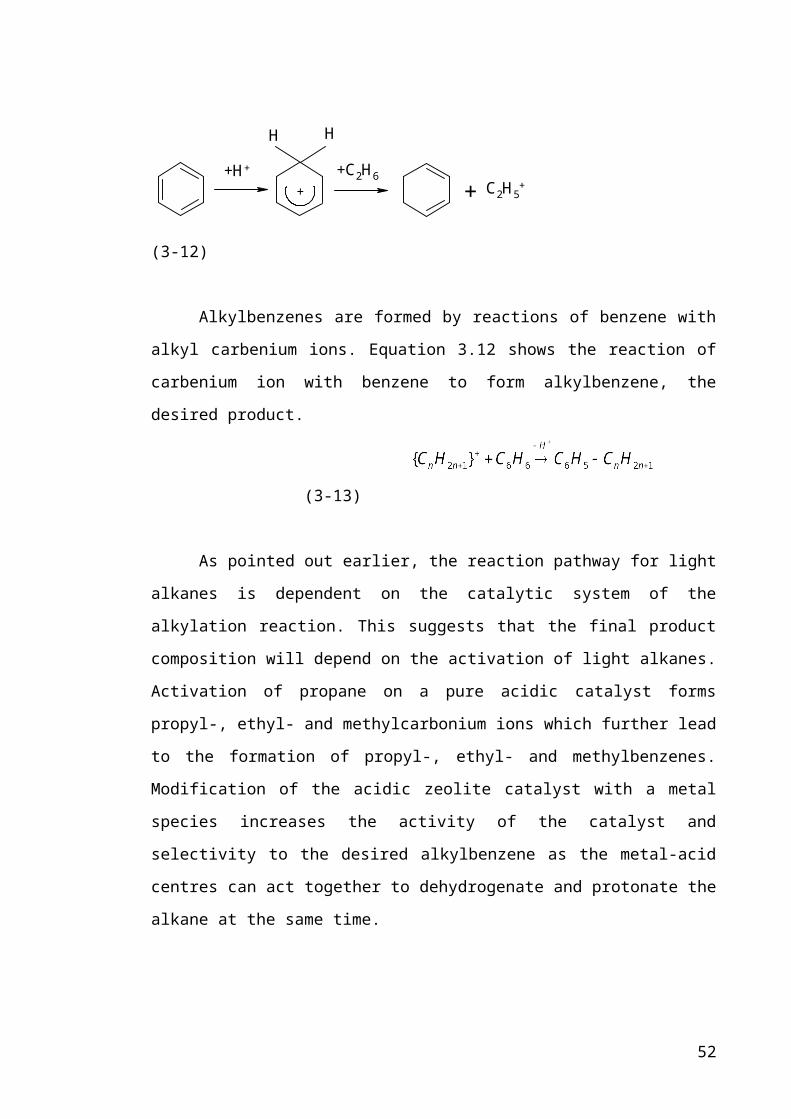
[21] G.N. Nayssilov, Advances in Colloid and Interface Science 47 (1993) 25-57.
[22] S.D. Jackson, G.J. Kelly, and G. Webby, Journal of Catalysis 176 (1998) 225-
234.
[23] U. Mroczek, K.H. Steinberg, and F. Roessner, Reaction Kinetics and Catalysis
Letters 44 (1991) 201-207.
[24] F. Moreau, N.S. Gnep, S. Lacombe, E. Merlen, and M. Guisnet, Applied
Catalysis : A General 230 (2002) 253-262.
[25] C.L. Yaws. 2003. Yaws' Handbook of Thermodynamic and Physical Properties
of Chemical Compounds. Knovel, Norwich, N.Y.
[26] M. Guisnet, and P. Magnoux, Catalysis Today 36 (1997) 477-483.
[27] W. Reschetilowski, U. Mroczek, and K.H. Steinberg, Applied Catalysis
A:General 78 (1991) 257-264.
[28] T. Komatsu, M. Mesuda, and T. Yashima, Applied catalysis A:General 194-195
(2000) 333-339.
[29] N. Arsenova-Hartel, H. Bludau, R. Schumacher, W.O. Haag, H.G. Karge, E.
Brunner, and U. Wild, Journal of Catalysis 191 (2000) 326-331.
[30] S. Alireza, S. Rezai, and Y. Traa, Catalysis Letters 122 (2008) 91-97.
[31] B. Wang, and G. Manos, Industrial & engineering chemistry research 47 (2008)
2948-2955.
[32] R. Schumacher, and H.G. Karge, Microporous and Mesoporous Materials 30
(1999) 307-314.
[33] X. Lin, Y. Fan, G. Shi, H. Liu, and X. Bao, Energy and Fuels 21 (2007) 2517-
2524.
[34] W.W. Kaeding, Journal of Catalysis 95 (1985) 512-519.
[35] J.L. Sotelo, M.A. Uguina, J.L. Valverde, and D.P. Serrano, Applied Catalysis A:
General 114 (1994) 273-285.
62
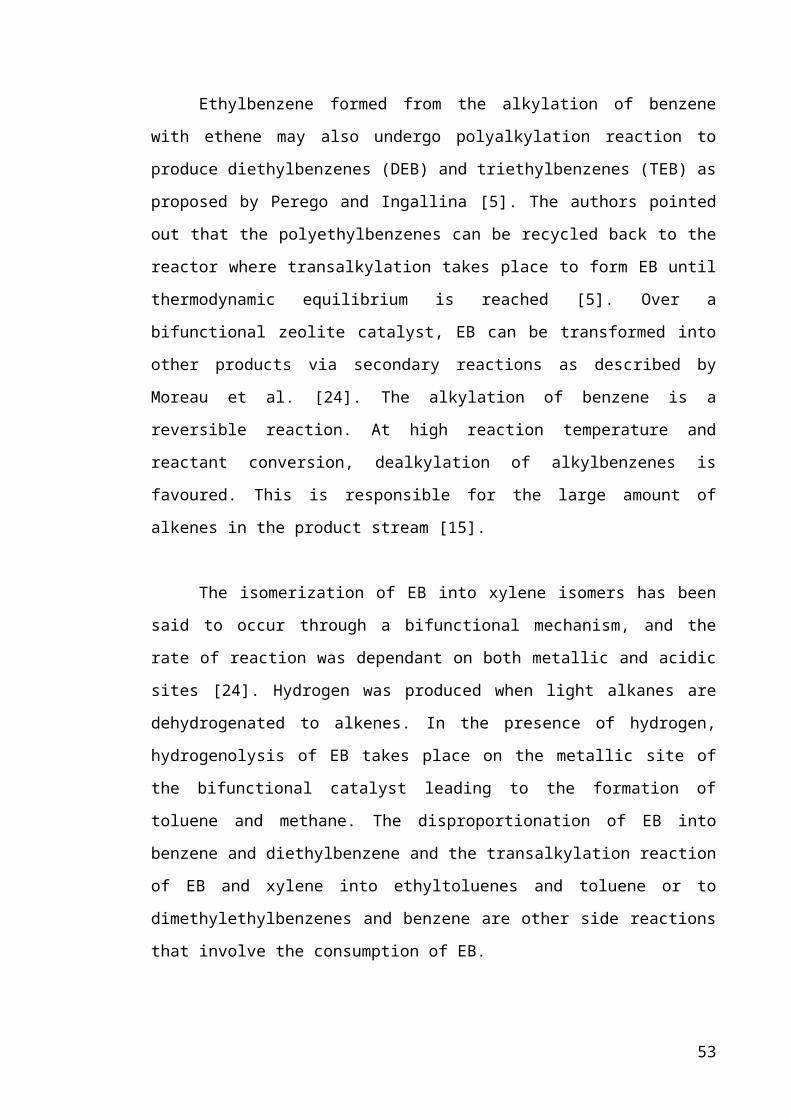
Chapter 4 : Pore Structure Modification by Coking during
Benzene Alkylation with Ethane
4.1 Introduction
The loss in activity of a catalyst could be due to the formation of coke, blocking
the pore structure as well as active sites, poisoning of the catalyst’s active sites by
strongly adsorbing molecules, or sintering of the active phase, which results in the loss
of metal surface area. In the previous chapter, it was suggested that the deactivation of
the PtH-ZSM-5 catalysts was due to the formation of carbonaceous residues, called
‘coke’. Coke components can be classified into two kinds, coke precursor (soft coke)
and hard coke. The character of coke precursors can be determined from their ability to
be removed from the catalyst. ‘Small’ coke precursors can be removed rapidly at lower
temperatures while ‘large’ coke precursors are removed at higher temperatures, at a
lower rate [1]. Wang and Manos [2] have shown that the thermogravimetric (TG)
methodology could differentiate between coke precursors and hard coke from the total
amount of coke deposited, because coke precursors can usually be removed from the
catalyst sample through volatilisation in inert nitrogen, where as hard coke is removed
by burning the coke in an air flow at high temperatures. This coke classification was
determined by raising the burning temperature from 473 K to 873 K under flowing
nitrogen, then switching the gas flow from nitrogen to air at 873 K. The difference in
the mass of the catalyst before and after switching the gases gives the amount of hard
coke present in the catalyst.
The carbonaceous deposits formed can be olefinic, saturated or aromatic
compounds. For the elucidation of the nature of coke, infrared (IR) spectroscopy has
been widely used. Previous studies have demonstrated that changes in the positions and
intensities of the IR peaks in regions between 1300 and 1700 cm -1 with coke deposition
[3-6] could give information regarding the chemical nature of coke compounds. Shape
changes of IR bands between 1359 and 1485 cm-1 was suggested to be due to the
presence of saturated species, formed at low reaction temperatures (300 - 500 K) [3].
Uguina et al. [4] and Sotelo et al. [5] observed an intense double peak at 1365 and 1380
63
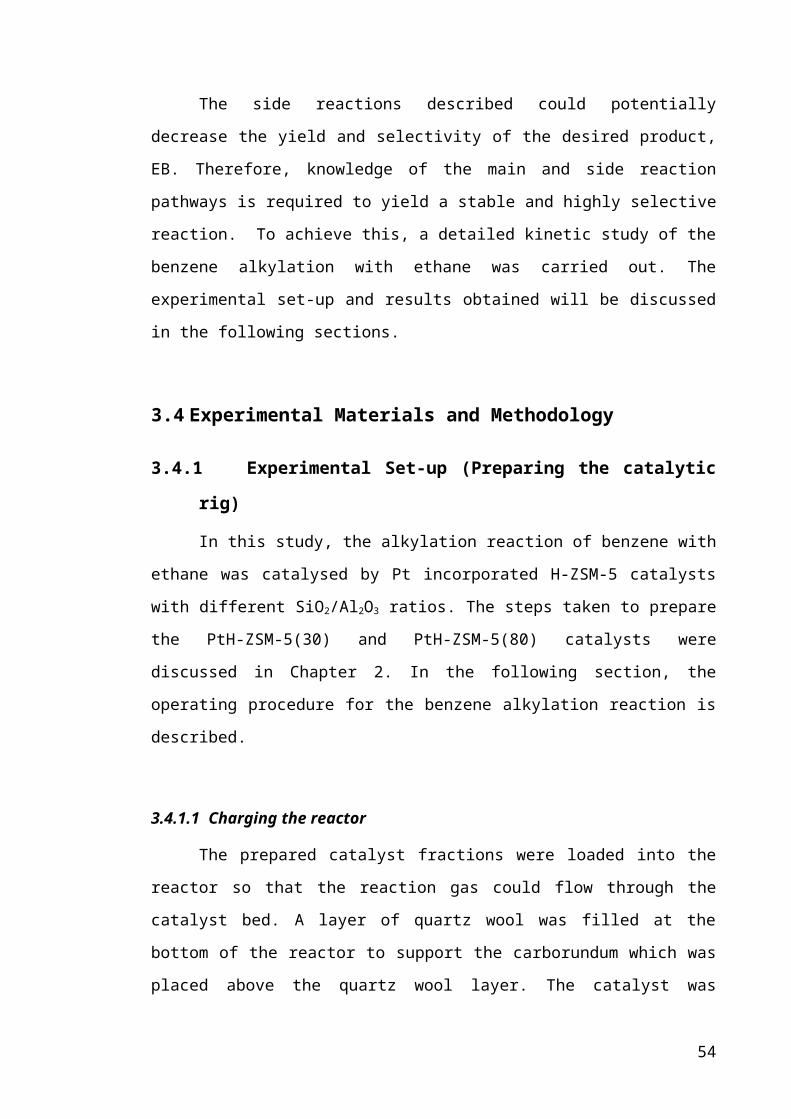
cm-1, suggesting that the coke deposits have a certain paraffinic character. At higher
reaction temperatures and increasing TOS, ‘coke’ bands around 1594 – 1592 cm-1,
which were ascribed to polyolefins and/or aromatics such as alkylnaphthalenes and
polyphenylenes [10-12], were observed. It was also reported that the IR band at 1585
cm-1 was attributed to C=C stretching vibration of microcrystalline graphitic carbon
structures, hence the carbonaceous residue formed has the structure of highly
unsaturated polycyclic aromatic hydrocarbons [6].
Deactivation by coking can occur in two ways; site coverage or pore blockage
[7-11]. Deactivation by site coverage is due to irreversible adsorption of coke on the
acid sites of a zeolite catalyst. As pore sizes of zeolites are close to the size of organic
molecules, only a few atoms of carbon are required to block the pores [9]. Two types of
pore blockage have been identified – (i) blockage of the channels or intersections by
coke molecules located at that site, and (ii) pore mouth plugging, which leads to
accessibility blockage to channels and intersections in which there are no coke
molecules. Coke deposition by pore blockage would eventually affect the architecture of
the catalyst. Therefore, the study of catalyst deactivation has to account for the changes
to the catalyst pore structure, to gain insight to the way in which pore structure evolves
with coke deposition.
The influence of coke on the pore structure of the catalyst has been studied by
various techniques, which includes adsorption of gases and x-ray diffraction (XRD)
studies. The most commonly used method for the characterisation of the catalysts is the
adsorption of gases, followed by the calculation of surface area, pore volume and pore
size distribution [10]. From nitrogen sorption results, Lin et al. [10] showed that both
micro- and mesopore volume of zeolite catalysts were affected by increasing coke
content. Shifts in the differential pore size curves were observed by Hopkins et al. [9]
when coke content increased to 4 wt % during n-hexane cracking, and by Schuurman et
al. [8], when the effect of coke deposition in FCC catalysts was studied.
However, not only does the modifications of the architecture of the catalyst
matter, the identification of the particular location of coke deposits is important to
understanding the mechanism of coking. Depending on the loss of adsorption capacity
of the coked catalyst and the amount of coke formed, Bibby et al. [12] were able to
64
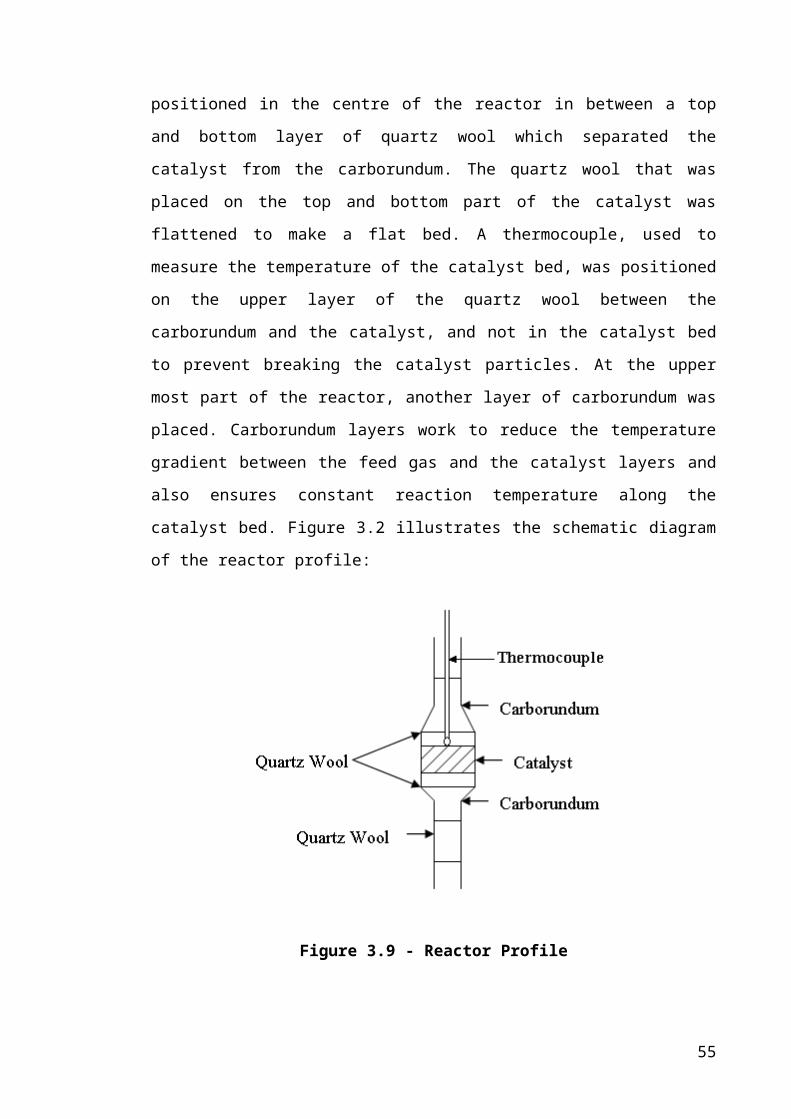
determine the broad location of coke deposition. From the linear relationship between
the adsorption capacity, S and coke content, C (Equation 4.1), the different location of
coke deposition on ZSM-5 catalysts during methanol conversion were identified [12].
The authors proposed the possible distributions of coke in a ZSM-5 pore network with
relation to the coefficient k, in the linear relationship given by Equation 4.1 [12]:
(4-36)
When coke fills the zeolite channels in a regular way, where the volume of coke
is equal to the loss in sorption capacity, the value of k is equal to 1, but when coke is
deposited on the external surface of the crystallite, k is found to be smaller than 1. The
coefficient k is greater than 1 when internal coke isolates part of the zeolite pores so that
a small amount of coke can have a large effect on the sorption capacity. In later years,
Guisnet and Magnoux [11] were able to identify the different modes of deactivation by
the loss of adsorption capacity of the coked catalyst and the amount of coke formed.
The ratio of the pore volume made inaccessible to adsorbates by coke molecules, VNA, to
the volume really occupied by coke, VC as a function of coke content were evaluated
and it was found that pore blockage occurs if the ratio of VC/VNA is smaller than 1, while
pore filling takes place if the ratio of VC/VNA is ~1. This method was then employed by
other researchers [4-5, 13] to further understand the effect of coke formation in different
catalytic reactions.
With coke deposition within the crystallites, deformations of the zeolite lattice
have been detected. These modifications in the framework of the crystallites can be
detected by x-ray diffraction, by the changes in the diffraction pattern. Fyfe et al. [14]
showed the perturbation of a zeolite structure, when sorbate molecules were present in
the zeolite framework, from changes in the diffraction patterns. Their finding was in
agreement with earlier findings of Bibby et al. [12] when the MFI lattice was occluded
by template ions. This demonstrates that the XRD technique is capable of differentiating
between internal [10, 12] and external [4, 13] coke deposition.
Even though adsorption and diffraction studies have been shown to be capable
of determining the locus of coke deposition, i.e. internal pore structure vs external
surface of the crystallites, they are unable to account for the distribution of coke
molecules within the crystallites. Therefore, in this study, the percolation method will
be employed to identify the intracrystalline spatial distribution of coke, and this will be
65
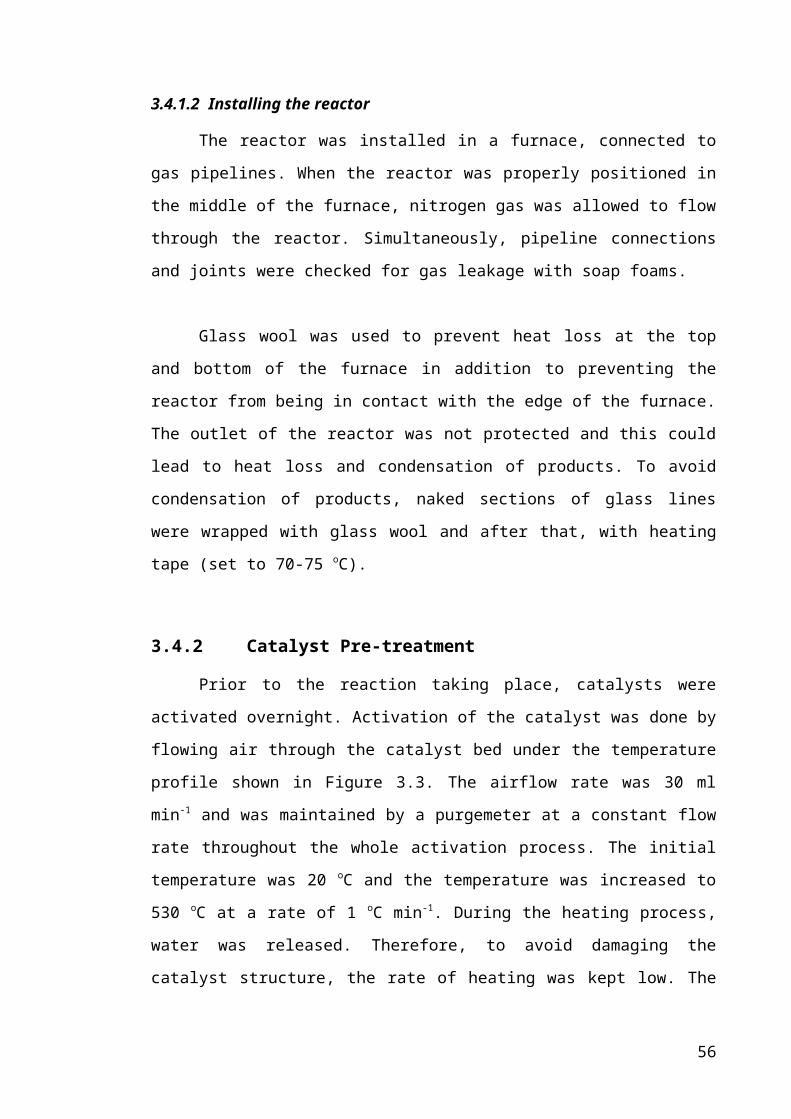
discussed in the next Chapter. This percolation method employed will give a more
comprehensive analysis of the coking phenomena as compared to the previous models
described earlier [11-12], which only made use of the data given by adsorption
measurements. In addition, a multi-component adsorption model will be employed in
this work. The multi-component adsorption model does not only allow the
determination of the location of coke deposition, but also gives information about the
changes in the adsorption capacities within and on the external surface of the
crystallites, which will then be used for the percolation study.
The previous studies discussed have shown that it is not satisfactory to
understand the coking mechanism by one technique. A combination of experimental
techniques is necessary in order to gain a further knowledge of the catalyst deactivation.
Therefore, in order to understand the effect coke formation during the alkylation of
benzene with ethane, the fresh and spent PtH-ZSM-5 catalysts were investigated by
several analytical techniques. The coke content on the zeolite catalysts was determined
via combustion of the carbonaceous residues by thermogravimetric analysis (TGA). The
nature of the coke content was analysed by infra-red (IR) spectroscopy. The sorption
measurements with various probe molecules on the fresh and coked catalysts were
carried out to determine the location of the coke deposition as well as the modification
of the pore structure of the zeolite catalyst as a result of coke deposition. The effect of
coke on the zeolite lattice could be observed by x-ray diffraction, while electron
microscopy images give evidence for the occlusion of platinum, on the external
crystallite surface, by coke deposition.
4.2 Theory
4.2.1 Gas Sorption
Depending on the types of pores present in the material, different
characterisation methods are applied. Examples of the different types of characterization
methods are physisorption of gases and liquids, radiation scattering, mercury
porosimetry and calometric methods [15]. Among the examples given, gas sorption is
the routinely used for pore structure characterisation as it is a well-established method
and it allows a wide range of pore sizes to be accessed.
66

4.2.1.1 Definition, Terminology and Pore Classification
The pores within the porous materials vary in sizes and shapes within the solids
and between one solid and another. In 1985, the International Union of Pure and
Applied Chemistry (IUPAC) produced a classification of pore size which gives a
guideline for pore widths descriptions applicable to all forms of porosity. Pores are
categorised according to their pore sizes:
1) macropores – pores with widths more than 50 nm (500 Å)
2) mesopores – pores of intermediate size of 2 nm < width < 50 nm
(20 Å < width < 500 Å)
3) micropores – pores with width not exceeding 2 nm (20 Å)
In many catalysts the different types of pores are all present. The pores can be
closed, blind or through, and each pore can be isolated or connected to other pores to
form a porous network (Figure 4.1).
Figure 4.27 – Various types of pores. Modified from ref [16]
Prior to further discussions of the characterisation techniques, the main terms
and definition for the study of surface area and porosity should be understood. Some
important definitions are given in Table 4.1:
Table 4-3 – Definition associated with porous solids [17]
Term Definition
67
Porous Solid Solid with cavities or channels which are deeper than
wide
Open Pore Cavity of channel with access to the surface
Interconnected Pore Pore which communicates with other pores
Closed Pore Cavity not connected to the surface
Void Space between particles
Pore Size Pore width – minimum dimension
Pore Volume Volume of pores determined by stated method
Porosity Ratio of pore volume to apparent volume of particle or
granule
Surface Area Extent of total surface area as determined by given
method under stated conditions
Specific Surface Area Surface area per unit mass of powder, area determined
under stated conditions
External Surface Area Area of surface outside pores
Internal Surface Area Area of pore wall
Tortuosity The path available for diffusion through a porous bed in
relation to the shortest distance across the bed
4.2.1.2 Adsorption
The term ‘adsorption’ was first used by Kayser to explain the condensation of
gases on surfaces, in contrast to gas absorption in which gas molecules penetrate the
bulk phase of the absorbing solid [18]. Then, McBain proposed the term ‘sorption’ as a
complete description of mass transport into a solid, encompassing surface adsorption,
absorption by penetration into the solid and condensation within pores [18]. According
to Rouquerol et al. [16], when a solid is exposed to a gas/vapour in a closed space, the
enrichment in the interfacial layer brought about by the interactions between the solid
and the molecules in the fluid phase is defined as adsorption.
Adsorption can be divided into two categories; physical adsorption, or van der
Waals adsorption, and chemisorption. Physisorption is applicable to all adsorbate-
adsorbent systems provided the conditions of pressure and temperature are suitable
whereas chemisorption may only occur if the system is capable of making a chemical
68
bond. The comparison between physical and chemical adsorption is given in Table 4.2
[16].
Table 4-4 - Comparison of Physical and Chemical Adsorption
ADSORPTION
Property Physical Chemical
Forces van der Waals (mainly
dispersion interaction)
Chemical bonds formed
between adsorbent and
adsorbate
Specificity Non-specific Specific
Heat of Adsorption 5-50 kJ mol-1 50-100 kJ mol-1
Activation Energy Rare 60-100 kJ mol-1
Reversibility Fast and reversible Slow and irreversible
Extent Multilayer Monolayer
4.2.1.3 Physisorption of Gas
Physical adsorption is defined as adsorption in which the forces involved are
intermolecular forces (van der Waals forces) and which do have a significant amount of
change in electronic orbital patterns of the species involved.
Figure 4.28 - Adsorption Process
The solid acts as the adsorbent, while the gas being adsorbed on the surface is
the adsorbate when adsorption occurs at a solid/gas interface. The amount of adsorbate
adsorbed on the adsorbent surface increases with the increase in gas pressure and
69
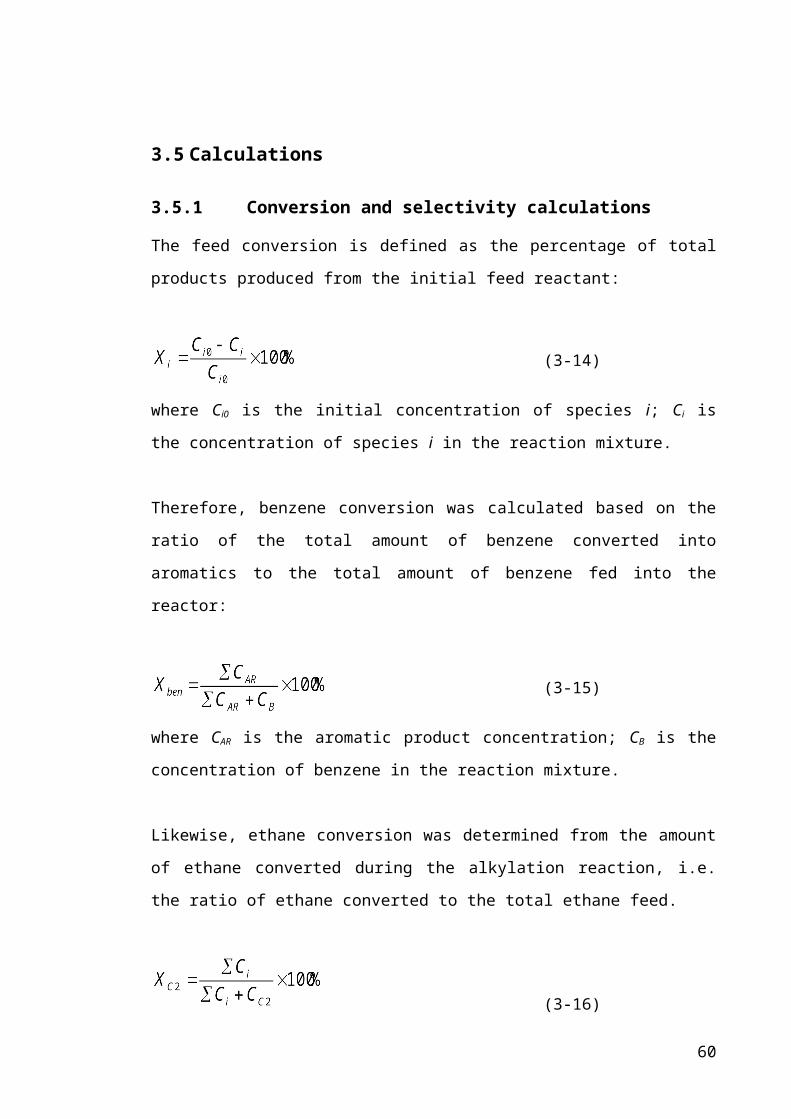
decreases with increasing temperature. The term adsorptive is used for the bulk phase
and/or the phase that is capable of being adsorbed (Figure 4.2).
During physical adsorption, no chemical bond is formed. However, attraction
between the adsorbate and adsorbent exists because of the formation of intermolecular
electrostatic interactions, such as London dispersion forces, or van der Waals forces
from induced dipole-dipole interactions [18]. The molecules in the adsorbed layer do
not only interact with the solid surface, but also with the neighbouring molecules within
the layers. As the fractional coverage of the surface is increased, the effect of adsorbate-
adsorbate interaction becomes more significant and should be taken into consideration
[16, 18].
A variety of probe gases can be used for the characterisation of a porous
materials, but nitrogen is the most widely used adsorptive for adsorption measurements.
The nitrogen molecule is recommended for determining the surface area and pore
volume because it is small enough to penetrate into pores of most adsorbent. In
addition, there is also a large amount of literature concerning the properties of nitrogen
relating to physical adsorption [19]. Besides nitrogen, argon, carbon dioxide, helium,
oxygen and other hydrocarbons have also been used for pore structure characterisation.
4.2.1.4 Adsorption Isotherm
The graphical relationship between the amount of gas adsorbed, and the pressure
or relative pressure at a constant temperature, is known as the adsorption isotherm. The
amount of gas adsorbed expressed in moles per gram of solid, n, depends on the
temperature, T, the equilibrium pressure, P, and the nature of the gas-solid system. This
can be represented by the equation:
(4-37)
For an adsorption system where the gas is adsorbed on a particular solid at a
constant temperature, the expression below can be used:
(4-38)
70

If the particular gas is below its critical temperature and the adsorbent is
maintained at a fixed temperature, the equation above simplifies to:
(4-39)
where Po is the saturation pressure of the adsorptive at temperature T.
During the adsorption process, the adsorptive condenses in the pores in order of
increasing pore size to form a liquid-like phase in a process known as capillary
condensation. The condensation pressure is an increasing function of the pore size,
where in smaller pores the adsorptive condenses at lower pressures. The adsorption
process may be followed by desorption where the pressure is progressively decreased
from its maximum value. During desorption, the liquid phase vaporises from the pores.
Vaporization can only take place if a pore has access to the vapour phase and is large
enough for vaporisation to be thermodynamically favourable (i.e. the applied pressure is
below the condensation pressure for a pore of that size). The desorption curve generally
lies above the adsorption isotherm over a range of pressures, forming a hysteresis loop.
71
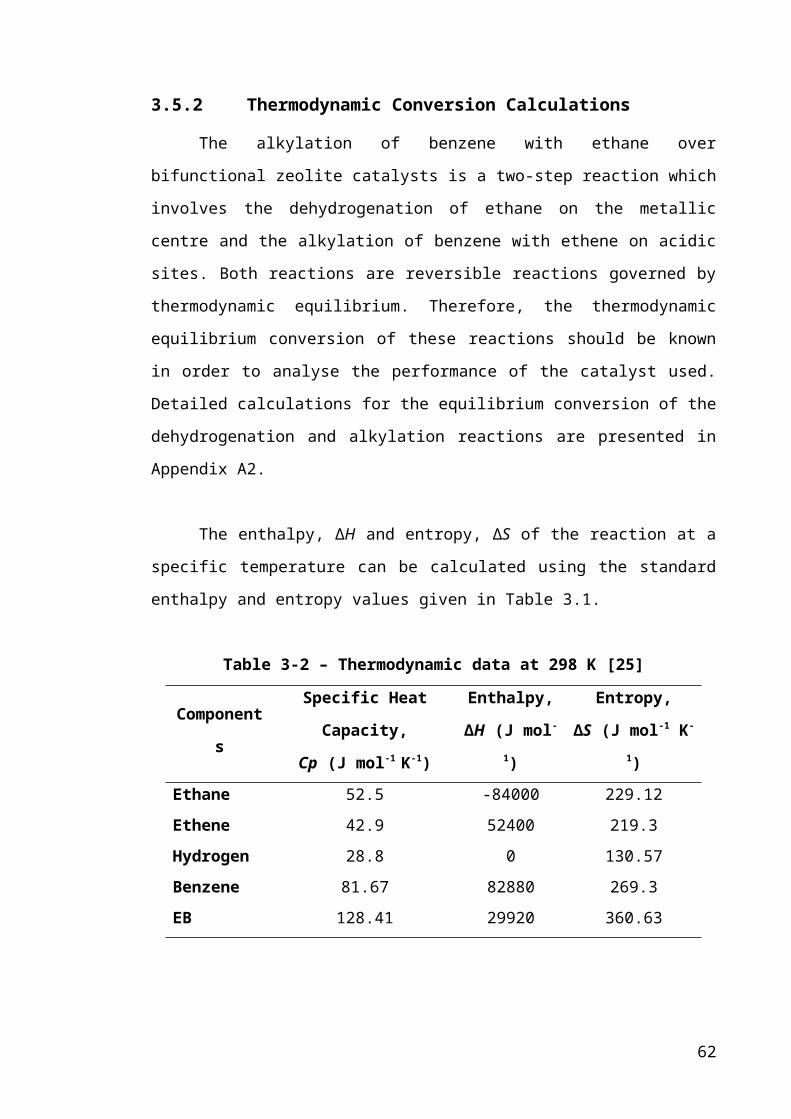
Figure 4.29 – The six main types of physisorption isotherms, according to IUPAC
classification [15]
The first step in the interpretation of the isotherm is the examination of the
isotherm shape. The shape of the isotherm reveals information about the nature of the
porosity of the sample examined. According to the IUPAC 1985 classification, there are
6 main types of isotherms [15]. The isotherms are shown in the Figure 4.3 [16] and are
classified as Type I, II, III, IV, V or Type VI isotherms. Type I isotherms are
characteristic of microporous adsorbents such as zeolites [20]. The adsorption takes
place at very low relative pressures because of strong interactions between the pore
walls and adsorbate. The adsorption energy increases, and the relative pressure at which
the micropore filling occurs decreases, when the micropore width decreases [16]. The
Type I isotherm is reversible and the shape of the isotherm is concave with respect to
the relative pressure axis. The amount adsorbed rises steeply, indicative of micropore
filling, reaching a plateau and the isotherm approaches a limiting value as P/Po tends to
1. A low slope of the plateau as the saturation pressure is approached is due to
multilayer adsorption on the small external surface area.
The Type II isotherm is a characteristic of non-porous and macroporous
adsorbents. Initially, a monolayer is formed and then, this is followed by multilayer
adsorption at high P/Po. The thickness of the adsorbed layer increases progressively
until the condensation pressure is reached. The monolayer and multilayer formation
processes are always overlapping. When the equilibrium pressure is equal to the
saturated vapour pressure, the adsorbed layer becomes a bulk solid or liquid. If the knee
of the isotherm is sharp, the uptake at point B (seen in Figure 4.3) indicates completion
of monolayer coverage and the beginning of multilayer adsorption. The location of
Point B gives an estimate of the amount of adsorbate required to cover the surface with
a complete monolayer.
The reversible Type III isotherm is convex to the P/Po axis over the complete
range; hence the isotherm does not have a knee. The type III isotherm is a characteristic
of a non-porous or macroporous solid which has weak adsorbent-adsorbate interactions.
72
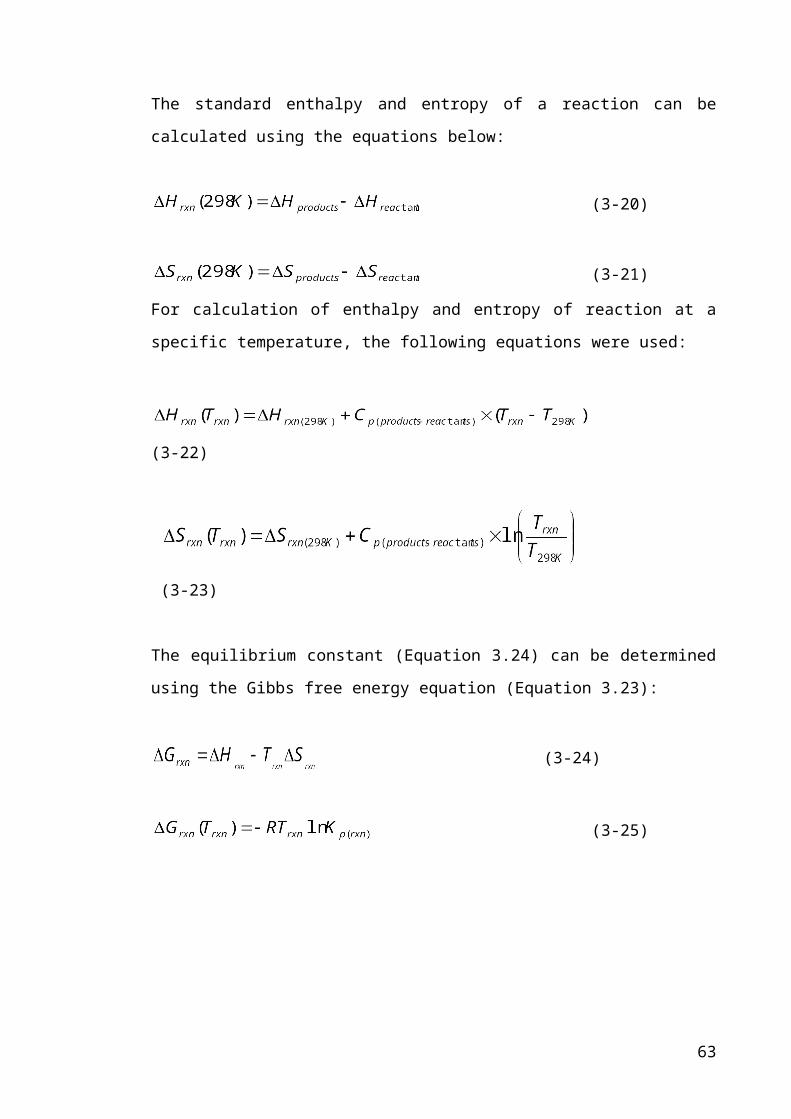
The shape of a Type IV isotherm is very similar to Type II isotherm at the start
of the isotherm, but differs at high P/Po. The hysteresis loop is associated with capillary
condensation taking place in mesopores and the limiting uptake over the high P/Po
range. The exact shape of the Type IV hysteresis loop differs from one adsorption
system to another, but the uptake is always greater along the desorption branch at any
given P/Po [18].
As with Type III isotherms, Type V isotherms are rare. They have similar
characteristics of weak adsorbent-adsorbate interactions, but Type V isotherms exhibit
hysteresis loops. The Type V isotherms represent mesoporous solids.
Stepped isotherms are classified as Type VI isotherm. The steepness of the steps
depends on the system and the temperature. The stepped isotherms represent adsorption
in porous solids that contain highly uniform surfaces. [16]
4.2.1.5 Assessment of Microporosity
Microporous solids are defined as materials with pore width less than 2 nm.
Adsorption on microporous solids occurs at very low P/Po because of the strength of
adsorbate-adsorbent interactions. The mechanism for physisorption in very fine pores is
unlike filling in mesopores due to the close proximity of the opposite pore wall. To
differentiate between the primary filling of pore spaces from the secondary process of
capillary condensation in mesopores, the term ‘ micropore filling’ is used [15].
Micropore filling capacity is dependent on the available pore volume as well as
the packing of the adsorbed molecule [16]. It was reported that there are two different
micropore filling mechanisms; the first stage occurs at very low relative pressures (P/Po
< 0.01) and is termed ‘primary micropore filling’ while the second takes place in wider
micropores and at higher relative pressures (P/Po ≈ 0.01-0.2). The initial adsorption is
related to monolayer adsorption on each micropore wall, whereas the secondary process
is related to the filling of the residual space in between the opposite monolayers on the
micropore walls [21].
73
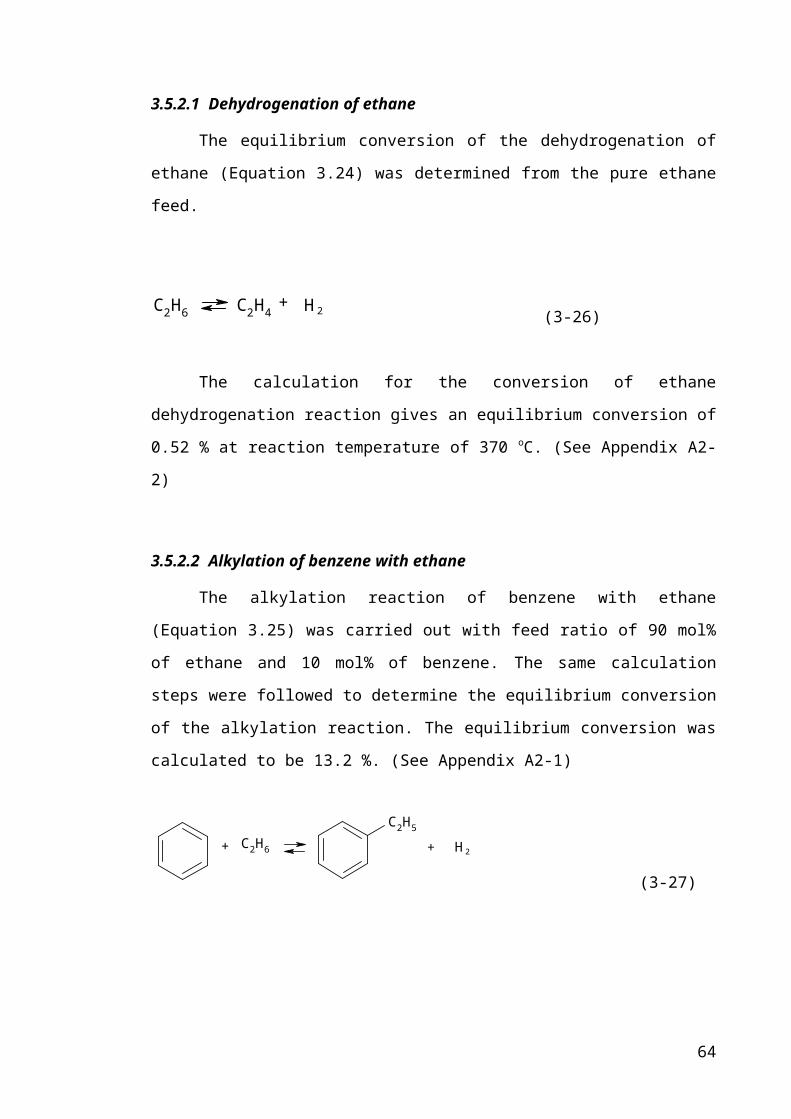
In primary micropore filling, adsorbates fill pores of width equivalent to no
more than two or three molecular diameters [20, 22]. This stage of micropore filling
leads to the distortion of the shape of the isotherm in the monolayer region [17]. In the
second phase of micropore filling, the interaction between the adsorbent and adsorbate
is very small, and thus the increase in adsorption energy is due to the cooperative
adsorbate-adsorbate interaction [17].
As discussed in the previous section, microporous solids produce type I
isotherms which are reversible and have a long horizontal plateau which extends up to
P/Po →1. The micropore capacity, np is the amount adsorbed at the plateau. From the
micropore capacity, the micropore volume, Vp, can be calculated assuming that pores
are filled with liquid adsorptive, and thus using the density of the adsorptive liquid at
the adsorption temperature [22].
Some microporous materials have very complex textures, where an appreciable
amount of surface area lies outside the micropores, i.e. in the form of external and/or
mesopore surface [22]. In that case, the type I isotherm has a finite slope in the
multilayer region [8, 33]. An isotherm that has Type IV appearance is due to the
presence of mesopores in some microporous adsorbents.
4.2.1.6 Assessment of Mesoporosity
The study of mesoporous solid is closely related with the concept of capillary
condensation and the Kelvin equation (Equation 4.5) [17-18]. The Kelvin equation
describes the capillary condensation process, where it relates the curvature of the
meniscus present in a pore to the P/Po value associated with condensation.
(4-40)
where rk is the Kelvin radius, v1 is the molar volume of the liquid condensate and σ is
the surface tension of the liquid condensate
The presence of the hysteresis loop observed for Type IV isotherms is associated
with capillary condensation in the mesopore structures. During desorption, the
adsorbates vaporise from pores at the surface, and as the pressure decreases, the vapour
74
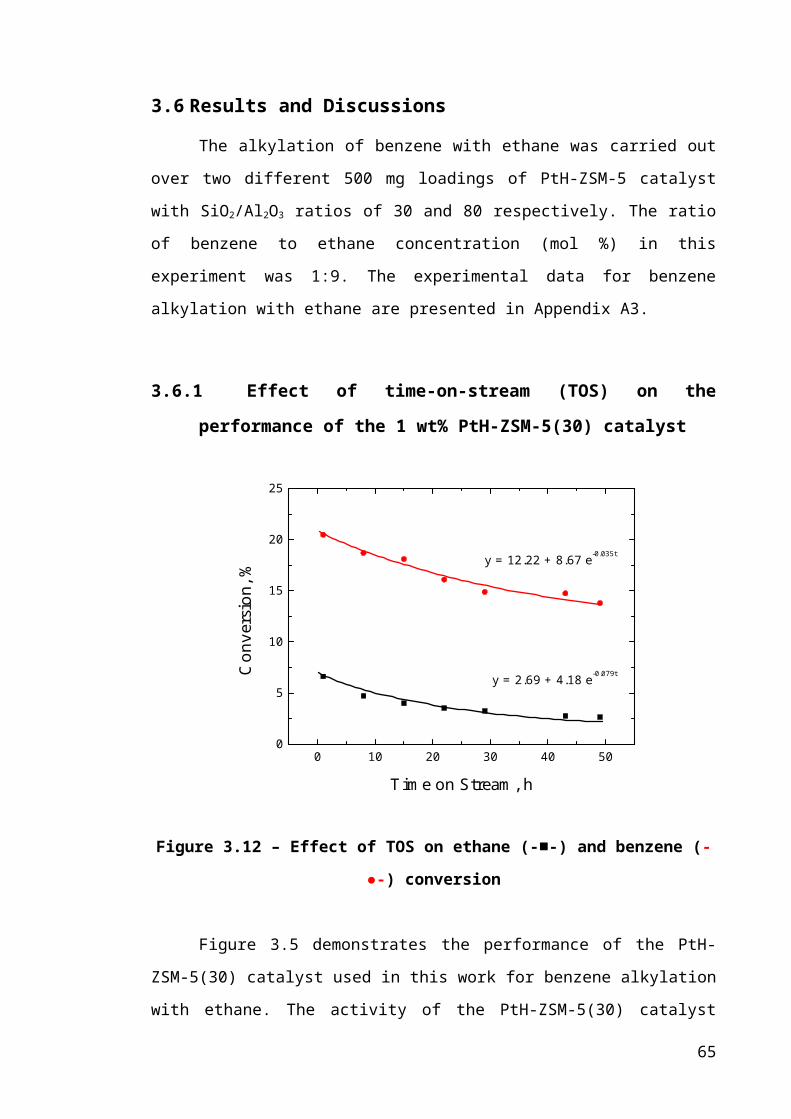
phase increasingly penetrates the solid. When the percolation transition is reached,
desorption is rapid and when the pressure is decreased further, all the liquid-filled pores
have access to the vapour phase, which corresponds to the closure of the hysteresis loop
[23].
Figure 4.4 shows 4 different types of hysteresis loop for Type IV isotherms.
Type H1 is usually associated with porous materials consisting of agglomerates or
materials that have narrow pore size distributions [15], for example open-ended tubular
pores as in MCM-41 [16] while H2 hysteresis represents a more complex pore structure
which tends to be made up of interconnected network of different size and shape pores
[16]. Type H3 and H4 do not exhibit any limiting adsorption at high P/Po which indicate
that the adsorbent does not possess a well-defined mesopore structure. Type H3 is often
observed with plate-like materials where as narrow slit-shaped pores produces isotherms
with Type H4 hysteresis loop.
Figure 4.30 – Types of Hysteresis Loop [15]
4.2.1.7 Surface Area Determination
4.2.1.7.1 Langmuir Method
75
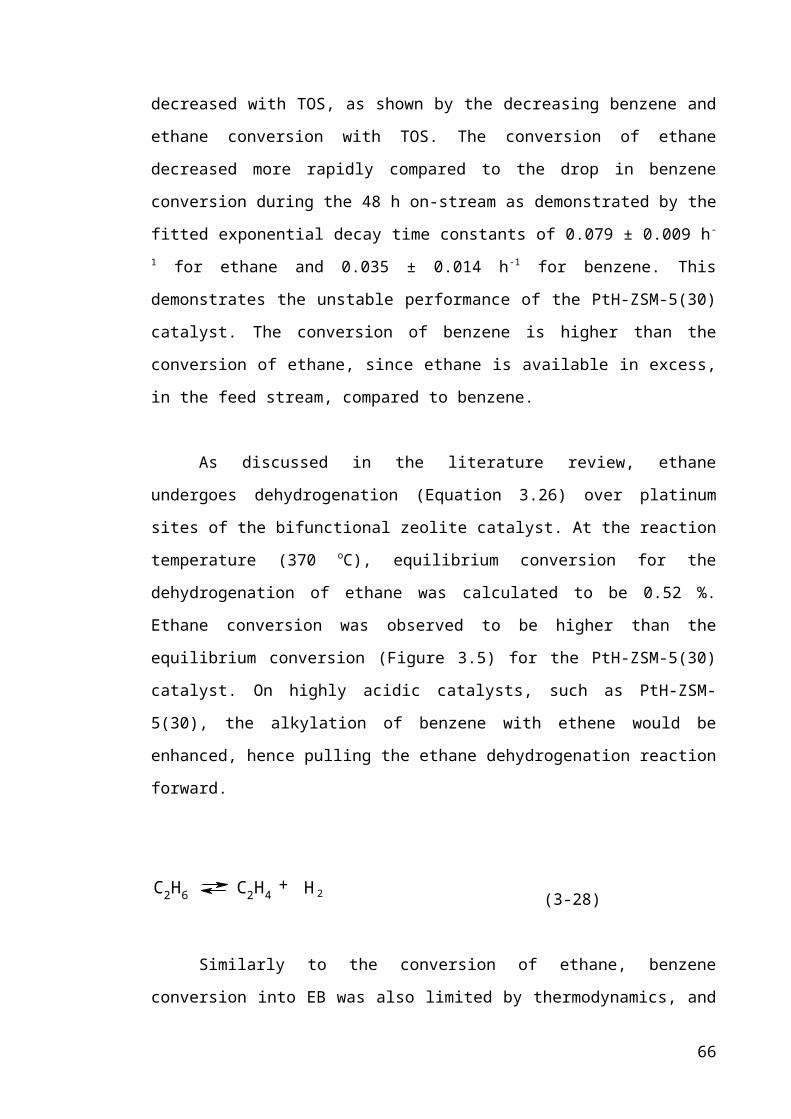
The BET method is the most widely used technique for surface area
determination. However, the BET method lacks applicability in the case of microporous
materials. It was reported by Seifert and Emig [24] that some researchers doubt the use
of BET theory to determine the surface area of a test material containing a certain
amount of micropores. BET theory states that it is applicable to multilayer physisorption
of vapour/gas in macropores and on the external surface in mesopores. The pores in
microporous materials are so narrow that they often cannot accommodate more than one
single molecular layer on their wall [18, 25]. Besides that, the monolayer volume
computed by the BET equation corresponds to micropore volume plus the monolayer
volume on the external surface of micropores [26]. Therefore, type I isotherms were
assumed to conform to the Langmuir equation.
According to the Langmuir theory, the limiting adsorption at the plateau
represents completion of a monolayer and can therefore be used for the calculation of
surface area [15]. Two stages are involved in calculating the surface area by the
Langmuir method. The first stage involves constructing the Langmuir plot and from it,
the derivation of a value of monolayer capacity, nm. Then, the specific surface area, A is
calculated.
The linear form of the Langmuir equation is given by:
(4-41)
where n is the specific amount adsorbed at the equilibrium pressure P, nm is the
monolayer capacity and b is the ‘adsorption coefficient’.
The plot of (P/n) versus P yields a straight line with slope, m and intercept, i. By
solving the two simultaneous equations, the monolayer capacity, nm (Equation 4.7) and
adsorption coefficient, b (Equation 4.8) can be determined.
(4-42)
76
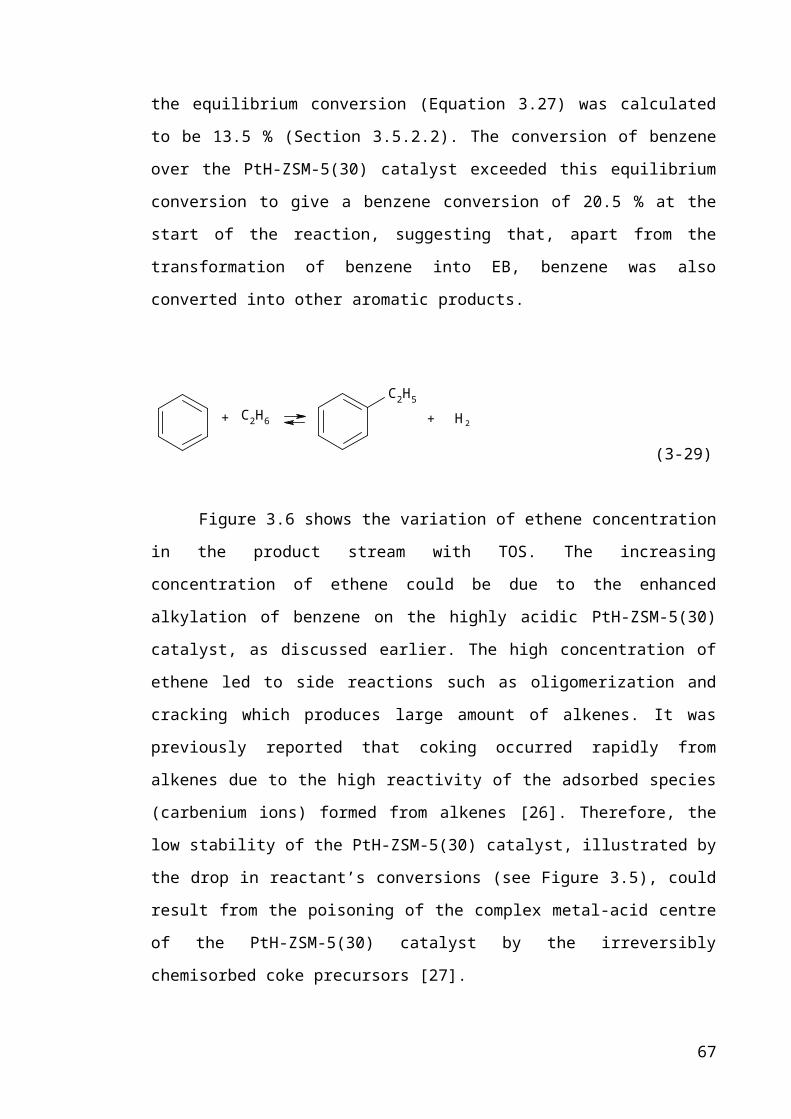
(4-43)
The calculation of the specific surface area, A(Langmuir) requires the molecular
cross-sectional area of the adsorbate molecule in the complete monolayer, σ. The values
of σ depend upon the temperature and the nature of the interactions between the
adsorbent and adsorptive. For adsorption with nitrogen at 77 K, the σ value is 0.162 nm2
assuming that the nitrogen monolayer is close-packed. When argon is used as the
adsorptive, the cross-sectional area is evaluated to be σ(Ar) = 0.138 nm2. The specific
surface area, A is given by:
(4-44)
where L is the Avogadro constant and σ is the average area occupied by each molecule
in the completed monolayer.
4.2.1.7.2 BET Model
The BET equation is applicable to multilayer adsorption of vapours in
macropores and on external surfaces, as well as in mesopores before capillary
condensation. The adsorbed molecules on the surface of the material can act as new
adsorption sites for further adsorption. The BET model was developed assuming that
the heat of adsorption of the first monolayer is constant and that the lateral interaction
between the adsorbed molecules is negligible. The heat of adsorption of all layers but
the first is said to be equal to the heat of condensation.
The validity of the BET equation is only limited to a restricted part of the
isotherm, which is usually not outside of the range of 0.05 < P/Po < 0.3. The failure of
the BET plot at very low P/Po (P/Po < 0.05) is because of the influence of high
adsorption potentials in the micropores. Even though the BET method is widely used to
determine surface areas of solids, it is criticised by many for the assumptions made
when developing the BET model. Some of the criticisms of the BET theory were
reported in the literature [18, 27].
77
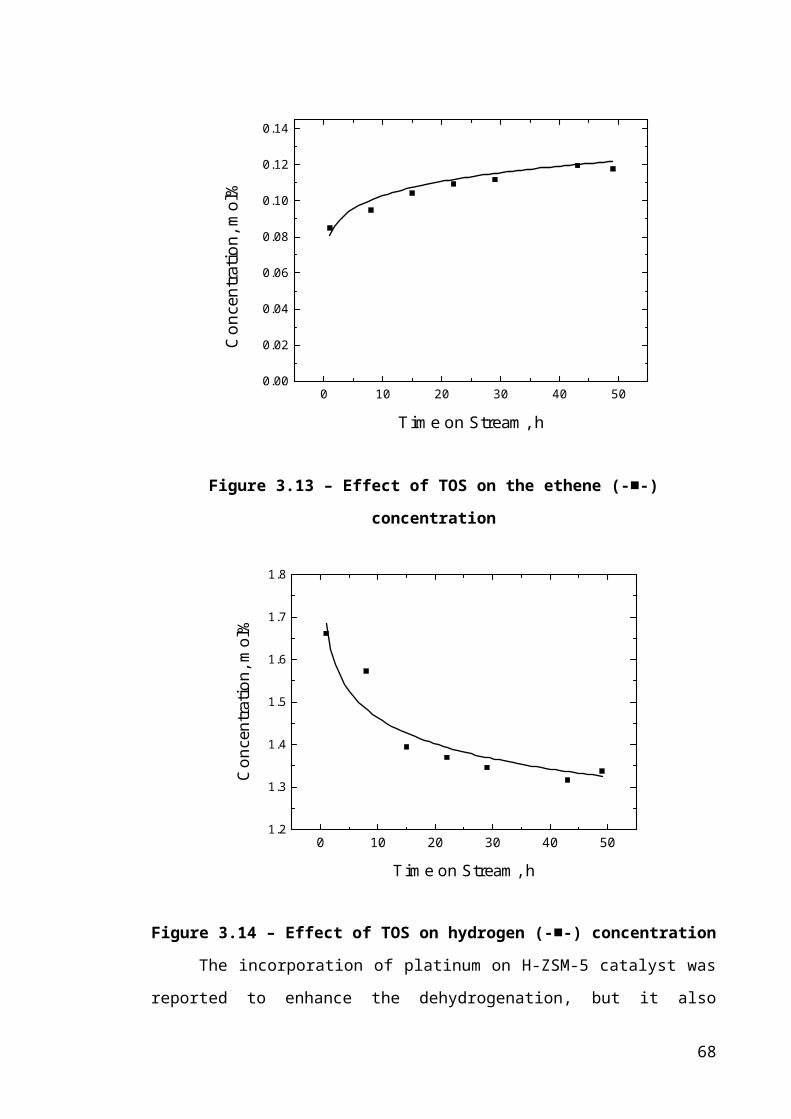
The BET equation is given by:
(4-45)
where nm is the monolayer capacity and C is the BET constant energy parameter.
In order to determine the surface area, a graph of (P/Po)/[n(1- P/Po)] vs P/Po is
required. As mentioned, the range where the straight line is fitted is generally between
0.05 < P/Po < 0.3, though, this may vary with different adsorption system. The values of
nm and C can be solved from the values of the slope and the intercept of the linear BET
plot. The specific area based on the BET method, A(BET) can then be calculated using
Equation 4.9 given in the previous section.
Due to the high microporosities in some materials, the BET plot deviates from
linearity, which could lead to meaningless negative values of the BET constant energy
parameter value [24]. Therefore, two criteria were proposed for the selection of the P/Po
range where the modified-BET equation is applied: (i) the pressure range chosen is in
the region where n(Po-P) is increasing with increase in P/Po and (ii) the y-intercept of
the linear region must be positive in order to give a meaningful value to BET constant,
C [28-29].
4.2.1.8 Pore Volume Determination
The simplest method to determine the pore volume of a porous material is
known as the Gurvitsch method, which is independent of the pore geometry of the
material. The plateau in an isotherm at high relative pressure corresponds to the
complete filling of the meso- and micropores (if present) [26]. According to the
Gurvitsch rule, the pore volume is determined from the quantity adsorbed at the plateau
assuming the adsorbate density to be the liquid density of the adsorbate at the
temperature of adsorption [18, 26].
Several methods including t-plot, αs-plot, Horvath-Kavazoe (HK), density
functional theory (DFT) and Dubinin-Radushkevich (DR) method could be used to
evaluate the micropore volume of a porous solid. The t-plot method is the easist method
to determine the total micropore volume [26]. The t-plot can be used to assess the
78
micropore capacity provided that the standard multilayer thickness curve has been
determined on a non-porous reference material with a similar surface structure to that of
the microporous sample [16]. The plot of volume adsorbed, V against t, statistical
thickness of the adsorbed layer will indicate the type of pores present in the adsorbent.
A non-zero intercept from the straight line indicates the presence of micropores while
vertical plots reveal mesopores [20]. The micropore volume of the adsorbent can be
obtained by extrapolating the straight line to a positive intercept on the y-axis of the t-
plot.
In the case of mesoporous solids, the t-plot could still be applied to calculate the
mesopore volume. An upward deviation from the linearity corresponds to when
capillary condensation is observed. A straight line with a slope corresponding to the
external surface area is obtained. The intercept of this line with the y-axis gives the
mesopore and micropore (if present) volume [26]. In addition to the t-plot, an αs-plot or
the BJH algorithm could also be used to determine the pore volume of a mesoporous
material.
4.2.1.9 Pore Size Distribution
To predict if diffusion through pores is likely to have a limiting effect on the
observed rate of reaction within a porous medium, it is necessary to know the pore size
distribution of a porous material [24]. Depending on the types of pores present in a
solid, different methods are used to compute the pore size distribution. If meso- and
macropores are present, the Kelvin equation is said to be a useful model for the
transformation of the adsorption data into a pore size distribution. The Kelvin equation
is only limited to pore radius greater than 2 nm [25]. In the later years, the Barret,
Joyner and Halenda (BJH) algorithm was developed for PSD determination, corrected
from the Kelvin equation and a t-layer to take into consideration of the multilayer
adsorption in meso- and macropores.
According to Storck et al. [20], it is necessary to use the Horwath-Kawazoe
(HK) model to characterise the pore-size distribution data for isotherms obtained at very
low P/Po (P/Po < 0.1) [20]. The HK method of analysis is based on a quasi-
thermodynamic approach, where the P/Po required for the filling of micropores of a
given size and width is directly related to the adsorbent-adsorbate interaction energy [1,
79
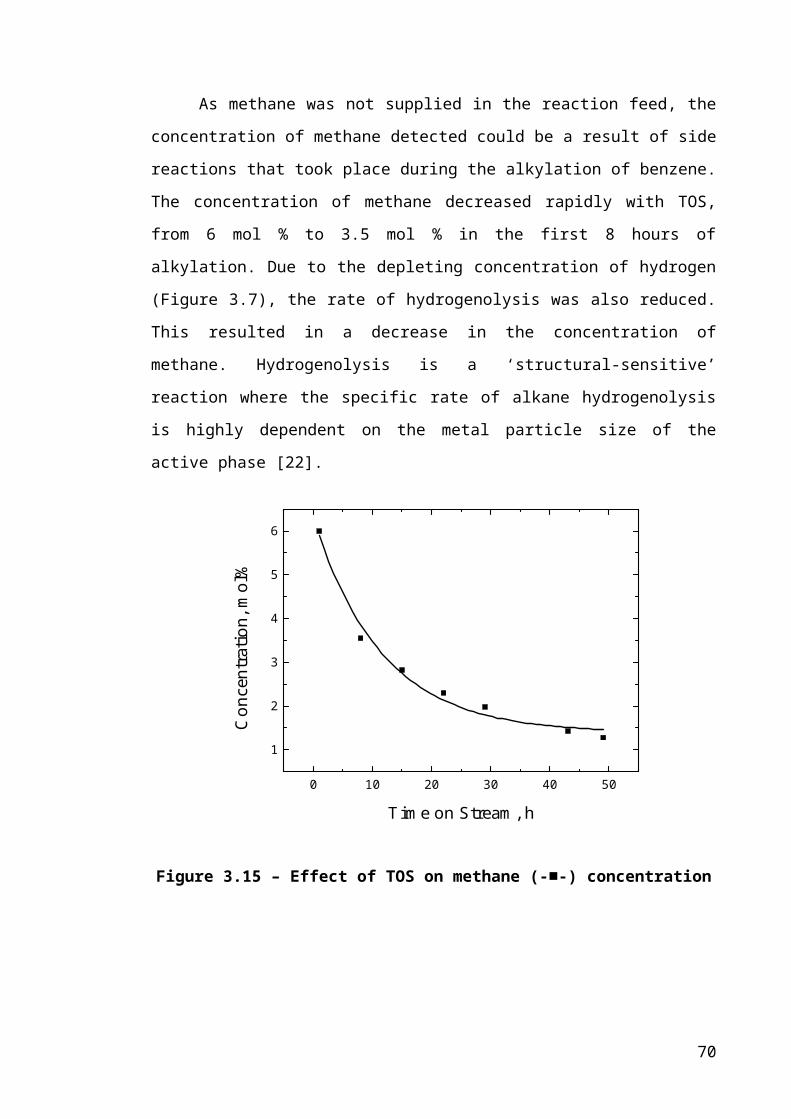
4, 12]. The original HK model only applies for nitrogen isotherms determined on
molecular sieve carbons. However, modifications were made so that the HK model is
now extended to argon and nitrogen adsorption in cylindrical and spherical pores [16,
20]. As a result, porous materials like zeolites, oxides and aluminophosphates can now
be characterised using the HK method.
It was reported that the use of argon as the adsorbate is preferred for the
determination of the micropore size distribution in zeolites compared with nitrogen. The
presence of quadrupole moment in N2 leads to enhanced interaction between the zeolite
surface and nitrogen molecules, which could make it difficult to discriminate between
zeolites of different pore sizes [27, 29, 40-41]. Besides that, N2 adsorption in micropores
starts at lower P/Po compared with Ar, which makes the measurement of micropores
less accurate for N2. Groen et al. [30] also pointed out that Ar adsorption at 77 K shows
limited application for mesopore size determination, because the temperature of
adsorption is below the bulk triple point, hence pore condensation vanishes when the
pore diameter exceeds 12 nm [30].
Even though previous studies have indicated that Ar is in favour over N2 for
micropore size distribution, Schuurman et al. [8] recommended the use of N2 to observe
the modifications of micropore populations following coke deposition in FCC catalysts
due to the smaller cross-section of the N2 molecules [8]. Nevertheless, the authors
mentioned that the micropore diameter deduced from Ar adsorption is more realistic
than the N2 adsorption because of the interaction between N2 and pore walls of zeolite,
leading to smaller micropore size diameter [8], in agreement with previous findings [7,
16].
It is the aim of this chapter to investigate the effect of coke deposition on the
pore structure of PtH-ZSM-5 catalysts during benzene alkylation with ethane. Previous
works have shown that N2 sorption is a useful method for the characterisation of fresh
and coked catalysts [8-10, 31]. In this study, Ar sorption was also carried out in addition
to the sorption of N2, for comparison since N2 posses a quadrupole moment, which can
preferentially interact with certain surface sites on the zeolite catalyst. Results from N2
and Ar sorption were then related to the data obtained from TGA, IR, SEM, and XRD
studies, and detailed discussion will be given in the following sections.
80
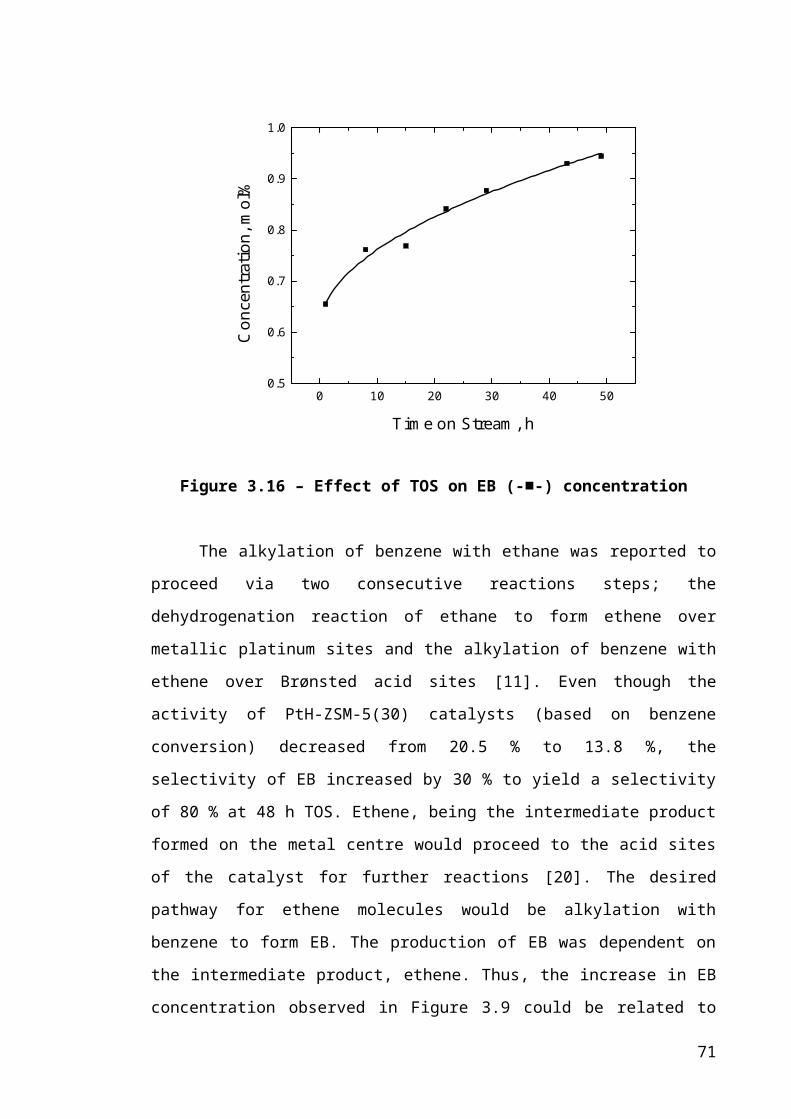
4.3 Experimental Methods
4.3.1 Fourier Transform Infrared (FT-IR)
IR measurements of fresh and coked PtH-ZSM-5 samples have been performed
to characterise carbonaceous residues formed during benzene alkylation with ethane.
The zeolite samples were pressed into wafer thin self-supporting disks (~10 mg), and
then placed into the IR cell holder. Prior to the IR experiments, the samples were heated
up to 350 oC with a heating rate of 1 oC min-1, and holding it at 350 oC for 2 hours,
before cooling it down to room temperature at a rate of 2 oC min-1. The spectra for coked
PtH-ZSM-5 samples were obtained by subtraction of that corresponding to the fresh
PtH-ZSM-5 sample.
The IR experiments were carried out by Tanya Vazhnova from the Department
of Chemical Engineering, at the University of Bath.
4.3.2 Thermogravimetric Analysis (TGA)
Thermogravimetric analysis of the coke content on the discharged PtH-ZSM-5
catalysts was performed in a Setaram TGA92 thermogravimetric analyzer. Coked
samples were heated from room temperature to 900 oC at a rate of 10 oC min-1 in
flowing, dry air. The first step observed was due to the desorption of water, and the
plateau at 300oC gives indication that the sample was free from water. Further loss in
the sample mass (between 300oC and 900oC) is a result of the burning of carbonaceous
deposits.
4.3.2.1 Calculations
The mass percentage of the coke per mass of pure zeolite was calculated as
follows:
(4-46)
where wT is the mass of sample at temperature T
81
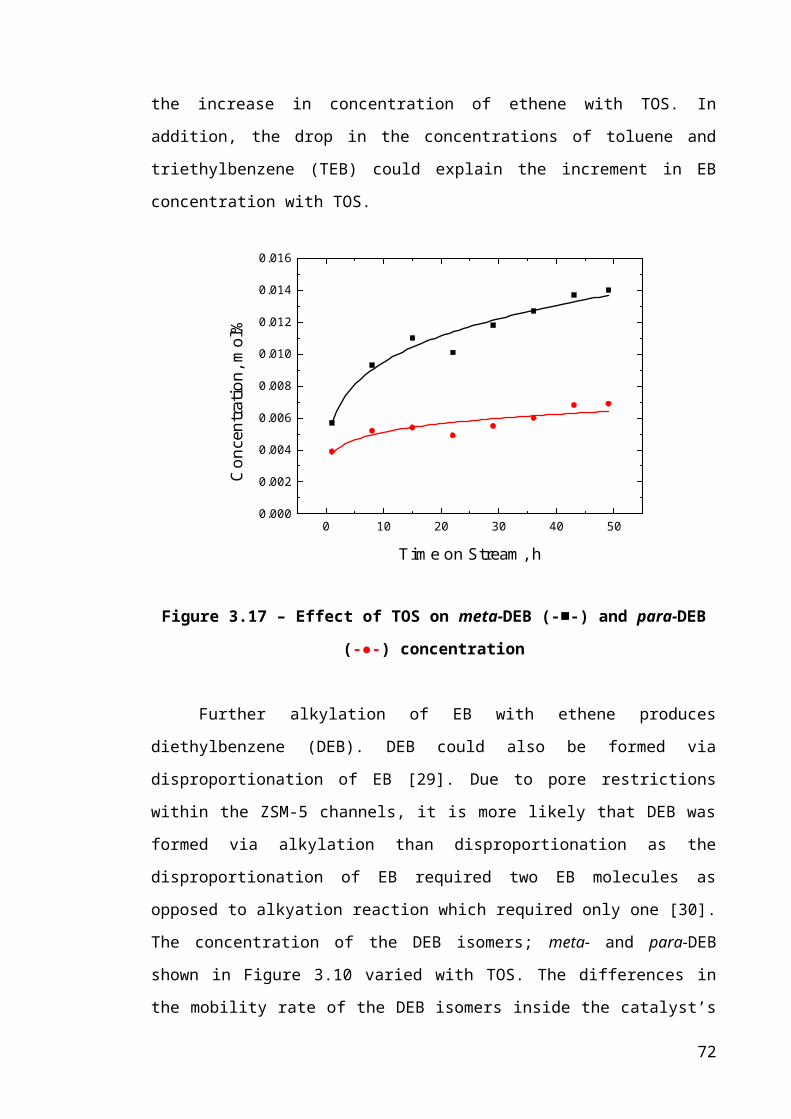
The volume of coke deposition in a deactivated sample was calculated using
Equation 4.12.
(4-47)
4.3.3 X-Ray Diffraction (XRD)
Powder X-ray diffraction experiments were carried out using a D8 Advance
Bruker X-ray diffractometer. Diffraction patterns were recorded using Cu Kα radiation
at 40 kV, 30 mA, and a scan rate of 1 o min-1.
The diffraction experiments were carried out by Dr Gabriele Kociok-Kohnin
from the Department of Chemistry, at the University of Bath.
4.3.4 Electron Microscopy
Scanning electron microscopy experiments were conducted on a JEOL
JSM6480LV system operating at 15 kV. The samples were coated with a thin carbon
layer to complete the electric circuit required for electron transfer before the imaging
analyses were carried out. Gold was not used to coat the samples due to the low
resolution of the images obtained. The use of carbon coating did not affect the data for
the H-ZSM-5(30) samples (see page 92). The effect of coke deposition on the platinum
particles impregnated onto the H-ZSM-5 catalysts was studied by backscatter electron
imaging.
4.3.5 Gas Sorption
Nitrogen and argon sorption experiments were performed using a Micrometric
Accelerated Surface Area and Porosimetry (ASAP) 2020 apparatus. The gas sorption
experiment for pore analysis consists of three steps; sample preparation, adsorption
analysis and free space analysis. These steps are independent of the adsorptive gases
used for the analysis.
82
4.3.5.1 Sample Preparation
Approximately 100 mg of the PtH-ZSM-5 catalysts were placed in a sample
flask and a seal frit was used to seal the opening of the tube. The tube was then placed
in the degassing port to expose the surface of the adsorbent to high vacuum. Prior to the
adsorption analysis, it is necessary to remove any physisorbed species from the surface
of the adsorbent by exposing the surface to high vacuum at elevated temperature. The
outgassing conditions (temperature and duration) should be controlled to prevent
changes in the structure of the catalyst.
The samples were heated at 250 oC for 4 hours. The sample was allowed to cool
down before reweighing the sample in the sample tube. The heating process was
repeated until the mass of the degassed samples has reached a constant value.
4.3.5.2 Adsorption Analysis
The prepared sample was transferred from the degassing port to the analysis port
where it is positioned in a liquid nitrogen dewar. For both; nitrogen and argon
adsorption, the adsorption temperature was set at 77 K.
4.3.5.3 Free Space Analysis
A free space analysis was performed at the end of the analysis to determine the
‘dead volume’ of the sample and sample cell from the relationship between pressure and
volume added. The dead space refers to the volume of the sample tube excluding the
sample itself. Helium was added to the system continuously, through a flow of
controller, for the determination of the dead volume in order to reduce the measurement
time. [32]
At the end of the adsorption analysis, the samples were degassed. Once the
vacuum condition is reached, the samples were heated at 250oC for 4 hours to prepare
the sample for the free space analysis. Then, free space analysis was performed.
83

4.3.5.4 Calculations
4.3.5.4.1 Renormalising uptake of nitrogen/argon
The total sorption capacity measured from gas sorption experiments gives the
amount of nitrogen/argon sorbed per unit mass of the sample. For coked samples, the
sample mass includes PtH-ZSM-5 catalysts as well as the mass of coke formed during
the reaction. Therefore, it is necessary to take into account of the coke content before
comparing isotherms of the fresh and coked PtH-ZSM-5 catalysts.
All the uptake values for the isotherms of the coked samples were renormalized
to give the amount of gas sorbed per unit mass of the catalyst.
(4-48)
4.3.5.4.2 Pore Volume Calculation
The sorption capacities, obtained from the sorption analyses were specified at
STP (101.3 kPa, 273.15 K). The pore volume is defined as the volume of adsorbed
materials which fills the pores, expressed in terms of bulk liquid at atmospheric pressure
and at the temperature of adsorption.
The pore volume of the fresh and coked PtH-ZSM-5 catalysts based on nitrogen
adsorption at 77 K was calculated based on Equation 4.14.
(4-49)
When argon was used as the adsorptive gas, Equation 4.14 is modified and the
pore volume at 77 K was calculated using Equation 4.15.
(4-50)
4.3.5.4.3 Modified-BET surface area
84

BET surface areas of the fresh and partially deactivated PtH-ZSM-5 catalysts
were calculated based on the method proposed by Rouquerol et al. [29] as this method
gives a more accurate surface area for microporous solids. According to the authors, the
pressure range for the application of the BET analysis should have values of V(Po-P)
increasing with P/Po and the y-intercept of the linear region should be positive to give a
meaningful value of the C parameter, which should be greater than zero. From the graph
of V(Po-P) vs P/Po, the maximum P/Po was used as the upper boundary for the BET plot
(Figure 4.5).
With the pressure range known, the BET analysis was performed by plotting
P/Po/(V(1-P/Po)) versus P/Po. From the slope (C-1)/nmC and the y-intercept (1/nmC), the
monolayer capacity, nm and the constant, C can be calculated. The surface area, A(BET)
is then calculated using Equation 4.9.
0.00 0.02 0.04 0.06 0.08 0.10 0.12 0.14 0.16 0.180
2000
4000
6000
8000
10000
V(P o-P
), kP
a cm
3 g-1
Relative Pressure, P/Po
Figure 4.31 – V(Po-P) vs P/Po for the fresh PtH-ZSM-5(30) catalyst.
Only the range below P/Po = 0.06 satisfies the first criterion for application of the
BET theory
85

4.4 Results
4.4.1 IR Spectroscopy
Figure 4.6 compares the IR spectra of the fresh and 48 h coked PtH-ZSM-5(30)
sample in the region between 1300 and 1700 cm-1. The appearance of new IR bands in
the CH deformation and C=C stretching regions in the spectrum of the coked catalyst
gives evidence of hydrocarbon species being deposited on or inside the zeolite catalyst.
The intense IR band at 1600 cm-1, which is assigned to C=C stretching vibrations of
microcrystalline graphitic carbon structure, is clearly seen in the spectra for the PtH-
ZSM-5(30) sample after 48 hours on-stream, indicating the presence of polyalkenes
and/or polyaromatic species. IR bands ascribed to alkylnaphthalenes or polyphenylene
structures between 1500 and 1540 cm-1 [33] was observed. A doublet at 1369 and 1382
cm-1, which is typical of branched alkanes was also observed, suggesting that the coke
deposits have some paraffinic character (e.g. alkyl chains attached to polyaromatics).
No IR bands were detected for wavenumber above 1700 cm-1.
1700 1650 1600 1550 1500 1450 1400 1350 13000.20.30.40.50.60.70.80.91.01.11.21.31.41.51.6
48 hour coked PtH-ZSM-5(30)
Fresh PtH-ZSM-5(30)
Abs
orba
nce
Uni
ts
Wavenumber, cm-1
Figure 4.32 – IR spectra of fresh (―) and 48 hour coked (―) PtH-ZSM-5(30)
catalysts
86
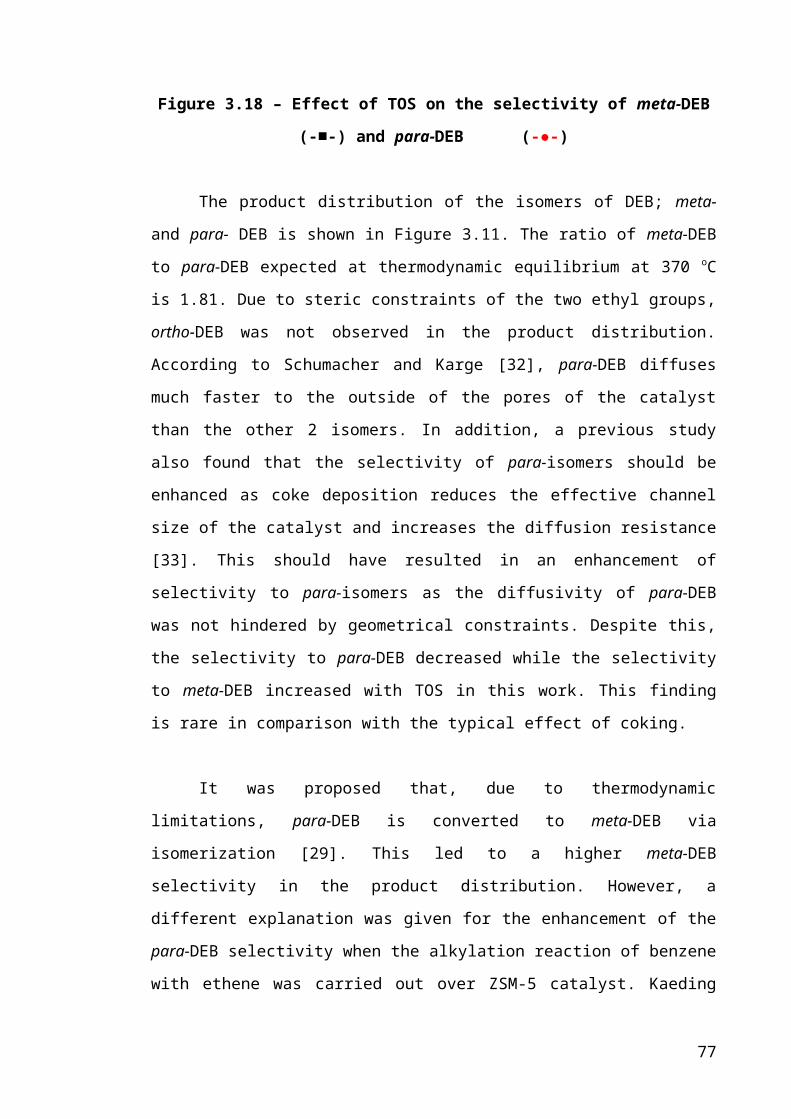
Quantitative analysis of the IR spectra found that the ratio between the intensity
of the coke band at 1585 cm-1 and that of the doublet at 1365 cm-1 and 1380 cm-1
increased with coke content.
4.4.2 Thermogravimetric Characterisation of Coke Component
The mass percentages of the coke deposits on the spent PtH-ZSM-5 catalysts
were determined via thermogravimetric analysis. Figures 4.7 and 4.8 show the change
in the mass of PtH-ZSM-5 catalysts with temperature. Two distinct mass loss steps were
observed for coked catalysts. The first mass loss step was attributed to desorption of
water, while the second step, between temperatures of 300 oC and 900 oC, was a result
of oxidation of the carbonaceous deposits arising from the reaction. The drop in the
mass of PtH-ZSM-5 catalysts after 4 h TOS at the start of the experiment, when there
was no rise in temperature, could possibly be due to the samples not thoroughly purged
with N2 at the end of the reaction experiments (see Figures 4.7 and 4.8).
0 100 200 300 400 500 600 700 800 900
88
90
92
94
96
98
100
Mas
s, %
Temperature, oC
Figure 4.33 – Thermogravimetric (TG) profile for fresh (─), 4 h (─), 24 h (─) and
48 h (─) coked PtH-ZSM-5(30) catalysts
87

0 100 200 300 400 500 600 700 800 900
92
93
94
95
96
97
98
99
100
Mas
s, %
Temperature, oC
Figure 4.34 – Thermogravimetric (TG) profile for fresh (─), 4 h (─), and 48 h (─)
coked PtH-ZSM-5(80) catalysts
The amount of coke formed at different TOS is summarized in Table 4.3. In
spite of an increase in the coke content, the rate of coke deposition declined with time
after a rapid increase in the amount of carbonaceous deposits at 4 h TOS. The highest
amount of coke deposition was 5.61 mass % on the PtH-ZSM-5(30) catalyst after 48
hours on-stream. Comparing the total amount of coke formed at the same TOS, the
bifunctional zeolite catalyst with lower SiO2/Al2O3 ratio yields a greater amount of
coke.
Table 4-5 – Values of coke content for PtH-ZSM-5 catalysts after different TOS.
The coke content measured has a standard error of ± 0.03 %.
Time on Stream
(h)
Total Coke
(mass %)
PtH-ZSM-5(30) PtH-ZSM-5(80)
4 1.83 0.76
24 3.39 -
48 5.61 2.00
88

Table 4-6 – Volume of coke deposited in PtH-ZSM-5 catalysts
Time on Stream
(h)
Coke Volume, Vc (cm3 g-1cat)
PtH-ZSM-5(30) PtH-ZSM-5(80)
4 1.44E-2 ± 4.08E-4 6.41E-3 ± 1.81E-4
24 2.72E-2 ± 7.71E-4 -
48 4.49E-2 ± 1.27E-3 1.60E-2 ± 4.53E-4
In order to calculate the volume of coke (Vc) given in Table 4.4 using Equation
4.3, the density of coke must be known. The IR spectrum of the 48 hour coked PtH-
ZSM-5(30) sample showed IR bands which were ascribed to coke molecules [4, 5].
Given that the IR bands observed for the coked catalyst in Figure 4.6 appeared at the
same wavenumber region as the IR bands reported by Uguina et al. [4] for ZSM-5
sample coked with toluene, and Sotelo et al. [5], for Mg-modified ZSM-5 samples
coked during alkylation of toluene with methanol, the nature of the coke deposit was
assumed to be the same. Hence, coke of density in the range between 1.2 g cm -3 and 1.3
g cm-3 [4-5, 13] was assumed. The uncertainties in the coke densities were taken into
account when evaluating the standard errors in coke volume, Vc (Table 4.4).
0 100 200 300 400 500 600 700 800 900-0.6
-0.5
-0.4
-0.3
-0.2
-0.1
0.0
dTG
, % m
in-1
Temperature, oC
Figure 4.35 – dTG profile for fresh (─), 4 h (─), 24 h (─) and 48 h (─) coked PtH-
ZSM-5(30) catalysts
89
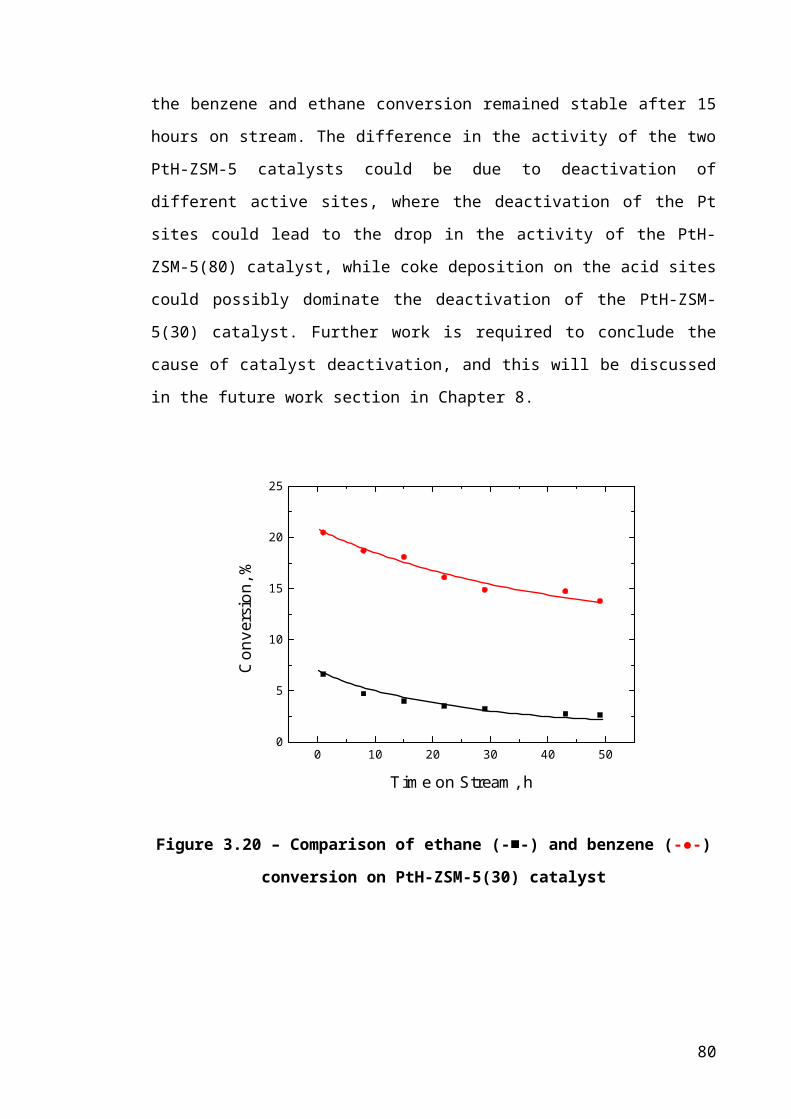
0 100 200 300 400 500 600 700 800 900-0.35
-0.30
-0.25
-0.20
-0.15
-0.10
-0.05
0.00
dTG
, % m
in-1
Temperature, oC
Figure 4.36 – dTG profile for fresh (─), 4 h (─), and 48 h (─) coked PtH-ZSM-
5(80) catalysts
Derivative thermogravimetric (dTG) curves, expressed as mass loss rates, are
also shown in Figures 4.9 and 4.10. Two maximum peaks were observed in the dTG
curves, which correspond to the two steps in the TGA curve (Figures 4.7 and 4.8). The
peaks for the coked samples differ in their positions and intensities when compared with
the fresh catalyst. The observed shift in the second maximum peak to higher
temperature with TOS (particularly comparing 4 h and 48 h TOS in Figure 4.10) could
be an indication of the presence of more heavy species/aromatics in the coked catalysts,
or that the coke being oxidised was then in regions which were more inaccessible, and
therefore required higher temperature for removal from the catalyst bed. It is also
possible that the shifts in dTG peaks to higher temperatures indicate a higher degree of
structural order in the deposited cokes, and hence lower oxidation reactivity. The shape
of the second maximum peak for the 24 h and 48h TOS dTG curves in Figure 4.9 is
very similar. Therefore, it is possible to conclude that the nature of coke is the same,
and hence the same densities were used to determine the coke volume for 24 h and 48 h
coked samples.
90
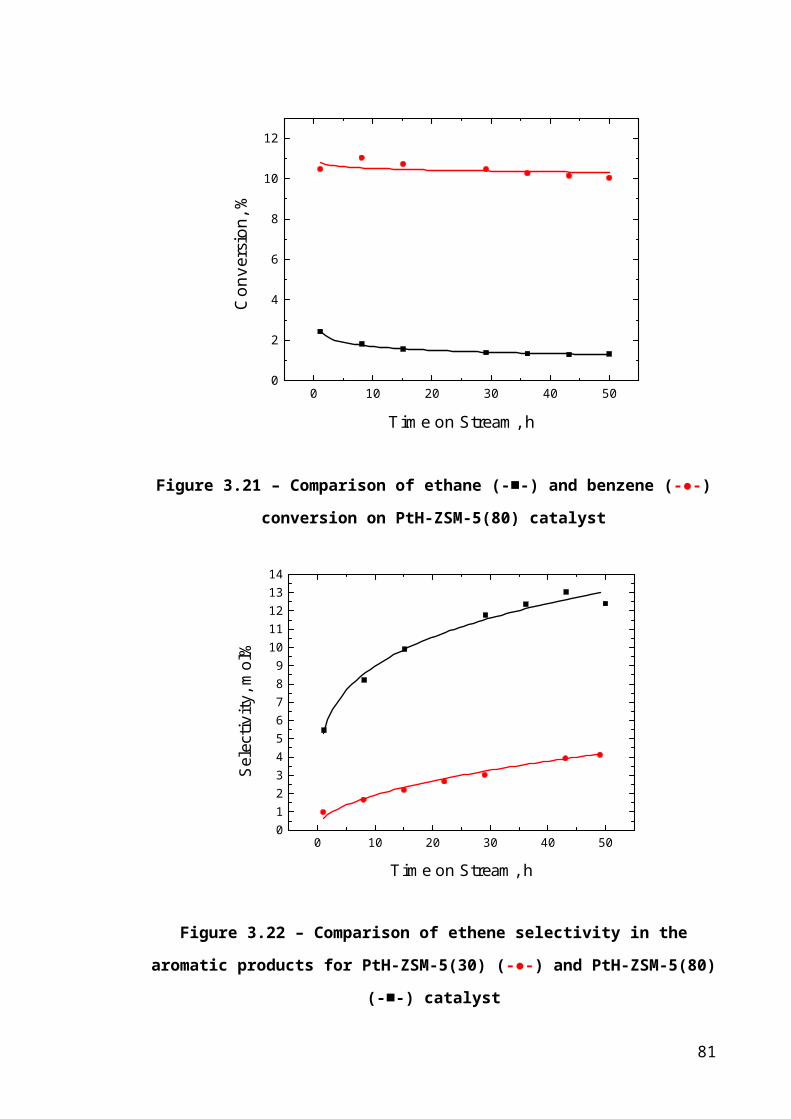
4.4.3 X-Ray Diffraction
22.0 22.5 23.0 23.5 24.0 24.5 25.00
50
100
150
200
250
300In
tens
ity (C
ps)
2 (o)
Figure 4.37 – XRD data for fresh (─) and coked PtH-ZSM-5(30) samples after 4 h
(─), 24 h (─) and 48 h (─)TOS
22.0 22.5 23.0 23.5 24.0 24.5 25.00
50
100
150
200
250
300
350
400
Inte
nsity
(Cps
)
2 (o)
Figure 4.38 – XRD data for fresh (─) and coked PtH-ZSM-5(80) samples after 4 h
(─), and 48 h (─) TOS
91
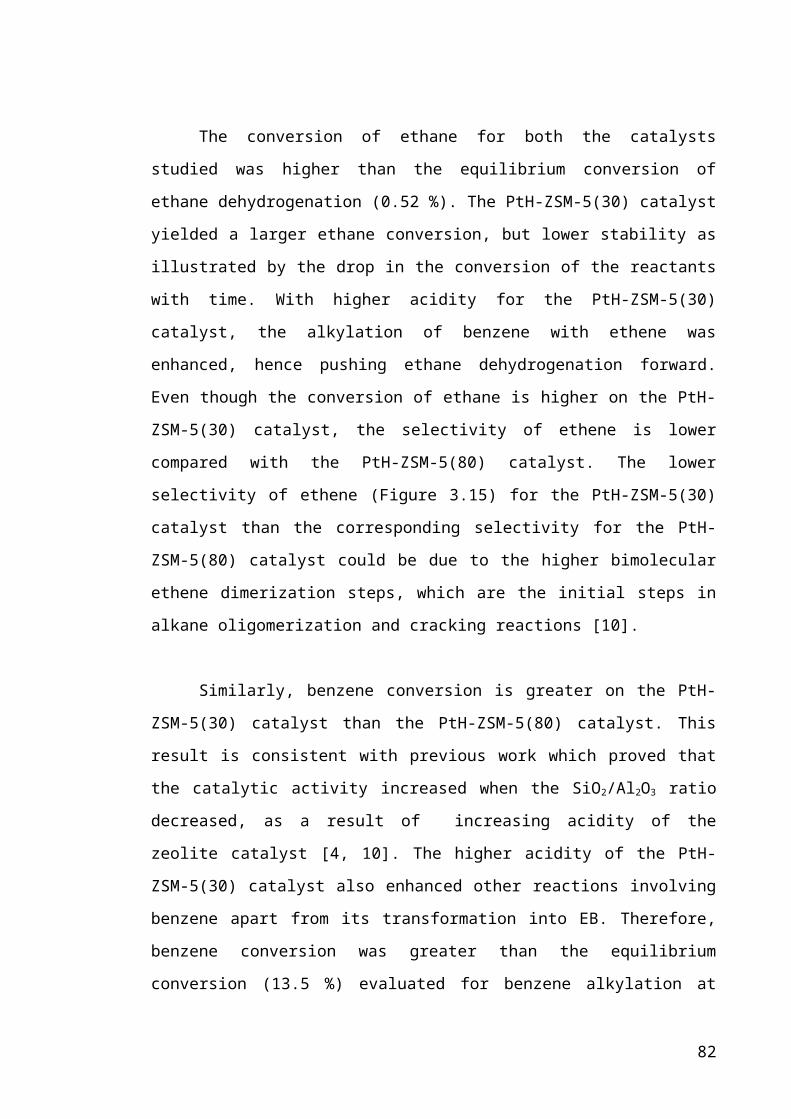
Figure 4.11 compares the diffraction patterns of the fresh and coked PtH-ZSM-
5(30) catalysts. The characteristic bands at 2θ = 22o to 25o were the main difference
between the diffraction pattern of the coked catalysts and that of the fresh ones, so the
spectra in these regions were expanded for clarity. The changes in the relative intensities
and diffraction peak positions were compared for the fresh and deactivated samples.
With increasing TOS, the doublet nature of the peak at 2θ = 23o-23.2o region collapsed
onto one peak at 2θ = 23.12o with increasing intensity.
In contrast to the behaviour of the PtH-ZSM-5(30) catalyst, the position and the
nature of the doublet peak was retained for the PtH-ZSM-5(80) (Figure 4.12) catalyst
even as the amount of coke formed increased with TOS. Since previous studies [4, 10]
have attributed the distortion of the diffraction peaks to coke formation within the
crystallites, the lack of this distortion suggests that no deformation of the zeolite
framework was detected when coke is formed during benzene alkylation with ethane
over PtH-ZSM-5(80) catalysts.
4.4.4 Scanning Electron Microscopy
SEM images of PtH-ZSM-5 catalysts were taken to investigate the changes in
the morphology of the zeolite crystallites with coking. Due to the resolution of this
technique, only the surface of the zeolite crystallites was captured.
Platinum was impregnated on the H-ZSM-5 catalyst since it is known to be an
active dehydrogenation catalyst. Since Pt has a higher atomic number (heavy element)
in comparison with other elements on the surface of the ZSM-5 crystallites (Si, Al, O),
it will backscatter electrons more strongly than the light elements, and, hence, appears
brighter in the BSE images. Typical examples of the BSE microscopy images of PtH-
ZSM-5 catalysts at different TOS are shown in Figures 4.13 – 4.14. In the backscattered
images, the bright white dots represent the platinum particles on the surface of the
zeolite crystallites. On pure H-ZSM-5 catalysts however, no white dots were detected as
Pt is not present on the catalyst (Figure 4.15).
92

Figure 4.39 – Backscattered images of fresh (A), 4 h coked (B), 24 h coked (C), and
48 h coked (D) PtH-ZSM-5(30) catalysts
Figure 4.40 – Backscattered images of fresh (A), 4 h coked (B), and 48 h coked (C)
PtH-ZSM-5(80) catalysts
93

Figure 4.41 – Backscattered image of H-ZSM-5(30) (A) and H-ZSM-5(80) (B)
catalysts
1 2 3 40.00
0.02
0.04
0.06
0.08
0.10
0.12
0.14
0.16(A)
1- Fresh 2- 4 h Coked 3- 24 h Coked 4- 48 h Coked
Con
cent
ratio
n,
num
ber o
f Pt p
artic
les p
er m
2
Sample Number
Figure 4.42 – Effect of TOS on the concentration of Pt particles on the surface of
the PtH-ZSM-5(30) crystallites
94

1 2 30.0
0.1
0.2
0.3
0.4
0.5
0.6(B)
1- Fresh 2- 4 h Coked 3- 48 h Coked
Con
cent
ratio
n,
num
ber o
f Pt p
artic
les p
er m
2
Sample Number
Figure 4.43 – Effect of TOS on the concentration of Pt particles on the surface of
the PtH-ZSM-5(80) crystallites
If coke was deposited on the surface of the zeolite crystallite, it would be
expected that some of the Pt particles would be obscured by coke molecules, and hence
not detected on the micrographs. A quantitative analysis was carried out on the BSE
images obtained to investigate the effect of coke deposition on the Pt particles present
on the surface of the zeolite crystallites. From, typically, images of three or more
different, but identically-sized, regions of the zeolite surface for each sample at different
TOS, the number of Pt particles on the surface of the crystallites was calculated. The
sampling errors in the surface Pt concentrations are given by the error bars shown in
Figures 4.16 and 4.17.
The average concentration of Pt on the surface of PtH-ZSM-5(30) crystallites
remained the same before and after coking (Figure 4.16). Conversely, a reduction in the
Pt concentration on the surface of the PtH-ZSM-5(80) crystallites with TOS (Figure
4.17) was observed.
95
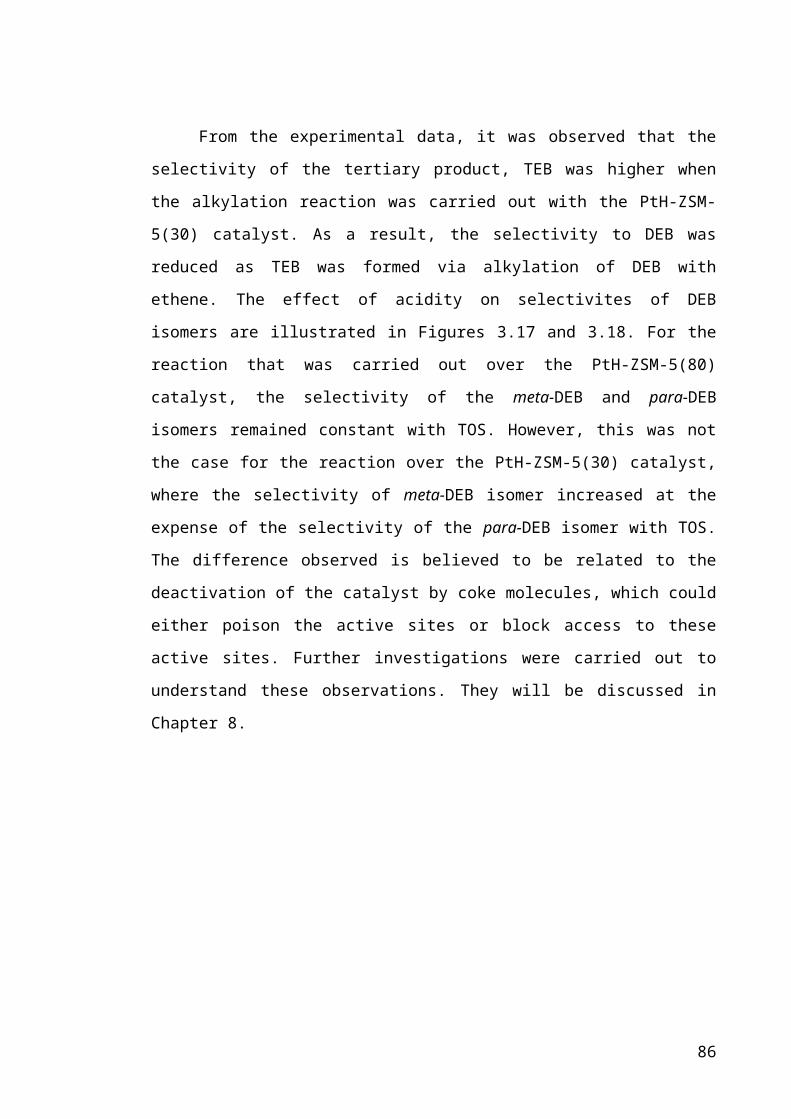
4.4.5 Nitrogen and argon sorption
4.4.5.1 Preliminary Checks
It was pointed out by Eleftherious and Theocharis [34] that by increasing the
thermal pre-treatment temperature, more space is created for nitrogen adsorption, as
more water was removed from zeolite pores. However, it was not mentioned that the
heating temperature and duration could possibly change the nature of the adsorbent.
Preliminary investigations were carried out to examine the reproducibility of the gas
sorption results, as well as the effect of sample preparation conditions on PtH-ZSM-5
samples. It is important to avoid changing the structure of the coked catalysts prior to
sorption analysis in order to examine the real effect of coke on the catalyst’s pore
structure.
0.0 0.2 0.4 0.6 0.8 1.00
2
4
6
8
10
Nor
mal
ised
Am
ount
Ads
orbe
d,
mm
ol g
-1
Relative Pressure, P/Po
Figure 4.44 – Nitrogen sorption isotherms at 77 K: (-■-) H-ZSM-5(30) heated until
sample weight remained constant, (-●-) H-ZSM-5(30) heated overnight
96

0.0 0.2 0.4 0.6 0.8 1.00
2
4
6
8
10
Nor
mal
ised
Am
ount
Ads
orbe
d,
mm
ol g
-1
Relative Pressure, P/Po
Figure 4.45 – Nitrogen sorption isotherms at 77 K: (-■-) 4h coked PtH-ZSM-5(30)
heated until sample weight remained constant, (-●-) 4 h coked PtH-ZSM-5(30)
heated overnight
Figures 4.18 and 4.19 compare the nitrogen sorption isotherms for H-ZSM-5(30)
and 4h coked PtH-ZSM-5(30) samples that were heated at 250 oC for different
durations. The temperature of 250 oC was chosen based on results from the
thermogravimetric analysis where at this temperature, water was shown to be desorbed
from the sample as discussed in Section 4.4.2. Despite different heating durations, the
shape of the isotherms remained the same. The difference between the sorption
capacities in Figure 4.18 is very small while the two isotherms in Figure 4.19 lie on top
of one another. The sorption results revealed that the pore structure of the zeolite
catalysts were not affected by the different heating durations, provided that the
temperature of pre-treatment is less than the temperature at which the reaction was
carried out.
97

0.0 0.2 0.4 0.6 0.8 1.00
2
4
6
8
10
Nor
mal
ised
Am
ount
Ads
orbe
d,
mm
ol g
-1
Relative Pressure, P/Po
Figure 4.46 – Reproducibility of nitrogen sorption isotherms of PtH-ZSM-5(30) :
(-■-) Isotherm 1, (-●-) Isotherm 2
0.0 0.2 0.4 0.6 0.8 1.00
1
2
3
4
5
6
7
8
Nor
mal
ised
Am
ount
Ads
orbe
d,
mm
ol g
-1
Relative Pressure, P/Po
Figure 4.47 – Reproducibility of nitrogen sorption isotherms of 48 h coked PtH-
ZSM-5(30): (-■-) Isotherm 1, (-●-) Isotherm 2
98
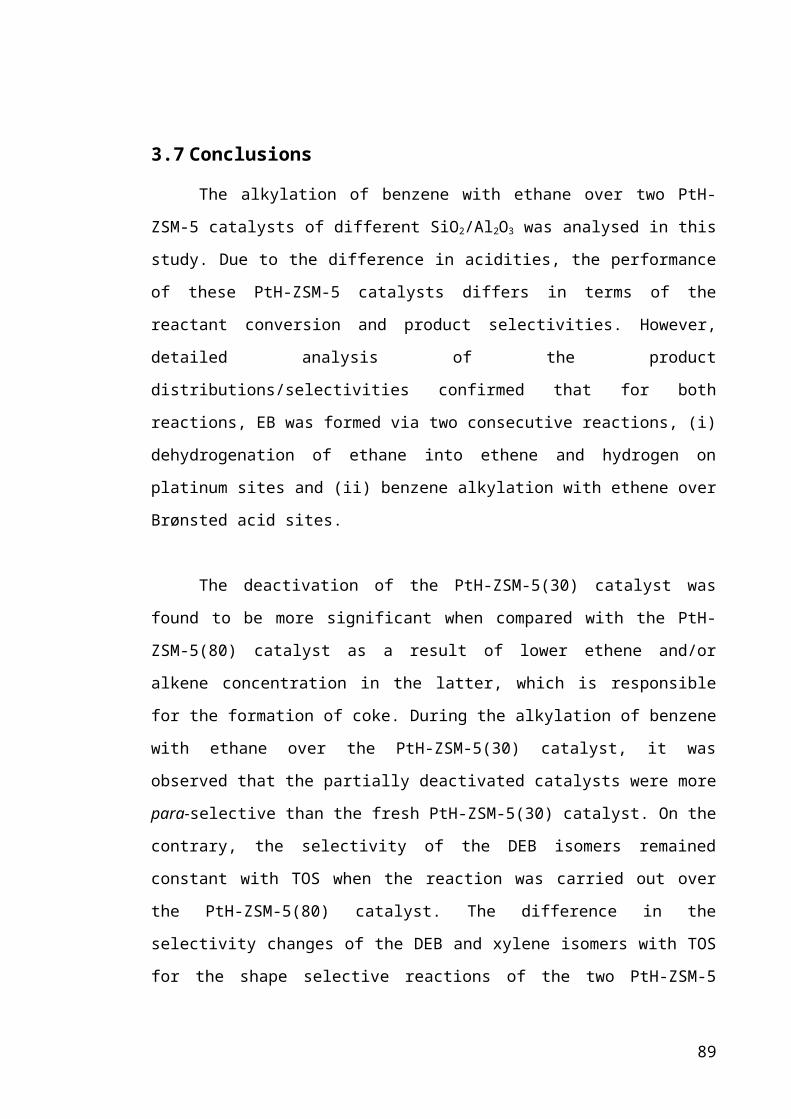
The architecture of porous solids could possibly be altered after the sorption
analysis. Hence, isotherms obtained are not reproducible and the sample cannot be
reused. Several experiments were carried out to ensure that the pore structures of PtH-
ZSM-5 catalysts were not destroyed by the first sorption analysis. Duplicate nitrogen
sorption isotherms for the fresh and coked PtH-ZSM-5(30) catalysts are shown in
Figures 4.20 and 4.21. The sorption isotherms overlap each other at low P/Po, and
showed a small variation between sorption capacities as the P/Po increases. However,
the difference observed was considered to be negligible in comparison with the effect of
coking illustrated in Figures 4.25 – 4.28. Hence, the reproducibility of sorption
isotherms applies to both, fresh zeolite catalysts as well as zeolite catalysts that were
coked during benzene alkylation.
0.0 0.2 0.4 0.6 0.8 1.00
2
4
6
8
Nor
mal
ised
Am
ount
Ads
orbe
d,m
mol
g-1
Relative Pressure, P/Po
Figure 4.48 – Nitrogen sorption isotherms for 48 h coked PtH-ZSM-5(30) catalysts
(-■-) freshly prepared and (-●-) samples kept for 1 year
As the series of PtH-ZSM-5 catalysts were involved in many experiments
throughout the duration of this project, the effect of time on coked catalysts was also
examined. Comparing sorption isotherms of freshly prepared coked samples with coked
samples that have been kept for 1 year in Figure 4.22, it was confirmed that the pore
characteristics of the coked catalysts were not affected by time, and any differences
observed in the sorption isotherms was not due to the effect of time.
99

4.4.5.2 N2 and Ar Sorption Isotherms
Figure 4.23 shows the nitrogen (77 K) and argon (77 K) sorption isotherms for
the PtH-ZSM-5(30) catalyst. Isotherms plotted are of type IV classification. PtH-ZSM-5
samples exhibit a high uptake of gas at very low P/Po, which is a characteristic of
adsorption in pores of molecular dimensions, with further adsorption on the external
crystal surface of the zeolite catalyst. The isotherms do not give the standard Type I
isotherm (for microporous adsorbents) with a horizontal plateau, but the isotherms are
convex to the P/Po axis at high P/Po due to the high adsorption on the external and/or
mesopore surface. The small step in the nitrogen sorption isotherm of the PtH-ZSM-
5(30) sample at P/Po ~ 10-7 was considered as noise in the data due to the low sensitivity
of pressure measurements at such low pressure region.
1E-8 1E-7 1E-6 1E-5 1E-4 1E-3 0.01 0.1 10
1
2
3
4
5
6
7
8
Nor
mal
ised
Am
ount
Ads
orbe
d,m
mol
g-1
Relative Pressure, P/Po
Figure 4.49 – Nitrogen (-●-) and argon (-■-) sorption isotherms for fresh PtH-
ZSM-5(30) catalyst
The shape of the isotherms obtained for ZSM-5 zeolites in this present work is
similar to that reported by other researchers [9, 12, 35]. According to Hudec et al. [35],
the further adsorption of nitrogen at high P/Po was due to metal loading on the ZSM-5
catalyst, which significantly increases the external surface area of zeolite crystallites.
100

Gervasini [25] subsequently reported that the deposition of metal on ZSM-5 leads to an
increase in surface area outside of the micropores, which is consistent with earlier
results of Hudec et al. [35]. Therefore, the high uptake of nitrogen and argon when P/Po
approaches unity (as seen in Figure 4.23), could be associated with the increase in
external surface area as a result of Pt metal impregnated on the ZSM-5 catalyst.
Hysteresis loops were present in the nitrogen and argon sorption isotherms
obtained. The hysteresis loop observed for PtH-ZSM-5 catalysts may possibly indicate
the presence of a mesopore network which allowed capillary condensation. Adsorption
in void spaces in the intercrystalline region could also result in the presence of
hysteresis loop in argon and nitrogen isotherms. The P/Po of the hysteresis loop of N2
and Ar isotherms are in the same range, and the low pressure (P/Po ~ 0.1-0.15)
hysteresis loop described in earlier research [22, 36-37] was not observed in this work.
Stepped isotherms were reported by previous studies for argon and nitrogen
adsorption on MFI type zeolites [48-51]. However, in this work, no obvious steps were
observed in nitrogen sorption isotherms, but a slight step was seen for argon sorption
isotherms for P/Po range of 10-4 and 10-3. It was reported that the step observed is due to
successive filling of channels and intersections [38]. The stepwise adsorption isotherm
for nitrogen adsorption on ZSM-5 crystals was later interpreted by Muller [39], and
Carrott and Sing [36] as localized adsorbate molecules in channel site and channel
interactions.
Based on molecular simulations and experimental work, it was suggested that
the step-like isotherm is due to progressive changes in the structure of the zeolite
adsorbent, from monoclinic to orthorhombic, as adsorbate loading increases [40]. On
the other hand, some researchers associate the transition to the densification of the
adsorbate phase [36, 37, 39, 42]. The densification of the adsorbate is linked with the
phase change of the adsorbate to a state of increased order, from a disordered phase to a
lattice fluid like phase as seen from diffraction patterns [41]. It was further suggested
that the relaxation of zeolite is accompanied by the ordering of the adsorbed phase [40].
101
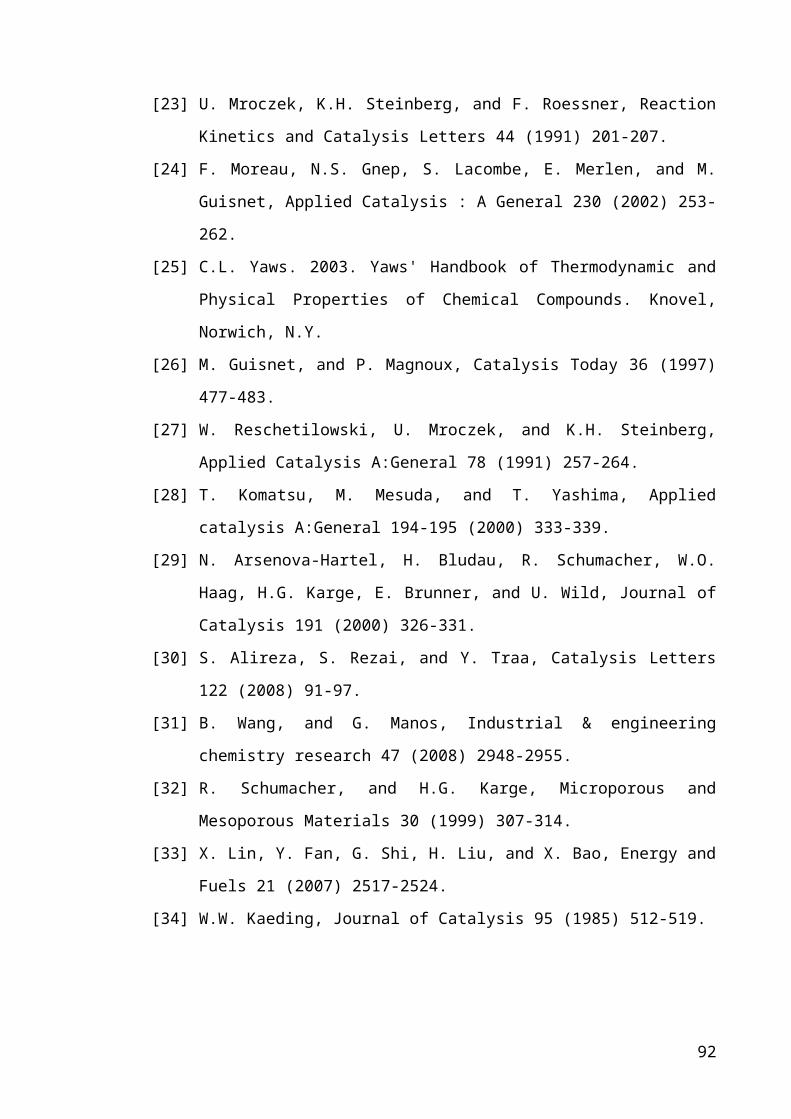
4.4.5.3 Comparison of N2 and Ar isotherms
Nitrogen and argon were used for characterisation of PtH-ZSM-5 catalysts by
gas sorption. The two gases have similar molecular diameter and polarizability, but
different potential interactions with the surface of porous solids. While a quadruole
moment is present in nitrogen, it is absent in argon. The difference between these two
gases allowed the investigation of the effect of quadrupole moment on the sorption
isotherms and the characteristics of the zeolite sample.
Figure 4.23 compares the nitrogen and argon adsorption isotherm for the fresh
PtH-ZSM-5(30) catalyst. The nitrogen isotherm is shifted an order of magnitude
towards lower P/Po in comparison to the argon adsorption isotherm, consistent with
previous findings [17, 42]. The quadrupole moment of the nitrogen molecule leads to
stronger interaction between nitrogen molecules and pore walls of zeolite catalysts as
compared to the non-specific adsorptive property of argon.
4.4.5.4 Comparison of adsorption isotherm for PtH-ZSM-5 catalysts with different
SiO2/Al2O3 ratio
1E-8 1E-7 1E-6 1E-5 1E-4 1E-3 0.01 0.1 10
1
2
3
4
5
6
7
8
Ren
orm
alis
ed A
mou
nt A
dsor
bed,
mm
ol g
-1
Relative Pressure, P/Po
Figure 4.50 – Nitrogen adsorption isotherms for fresh PtH-ZSM-5(30) (-■-) and
PtH-ZSM-5(80) (-●-) catalysts
102

In this study, the alkylation of benzene with ethane was carried out over two
PtH-ZSM-5 catalysts of different SiO2/Al2O3. Variations in the SiO2/Al2O3 ratio have
been said to affect the crystal size of the ZSM-5 zeolite [35] and hence, the shape of the
isotherms. It was previously reported that, decreasing the Si/Al ratio affects the
transition P/Po where the isotherm step occurs, as well as making it more diffuse [42-
43]. However, the aluminium content will only affect the transition when adsorbate
loading supplied for adsorption is large [42].
From the isotherms presented in Figure 4.24, it can be deduced that adsorption
took place at lower P/Po for the PtH-ZSM-5 catalyst that contains higher aluminium
content. This could possibly be due to the interaction of the quadrupole moment of
nitrogen molecules with the Al-sites (polar sites) present in the microporous channels of
ZSM-5 zeolites.
4.4.5.5 Effect of Coke on Nitrogen and Argon Adsorption
In the previous section, it was demonstrated that sorption isotherms were
reproducible and that the samples can be reused for further analysis. Following the
establishment of the experimental procedure for sorption measurements, the effects of
coke on the surface and structural properties of PtH-ZSM-5 catalysts were studied.
Nitrogen and argon adsorption isotherms for the fresh and partially deactivated
PtH-ZSM-5(30) catalysts are shown in Figures 4.25 - 4.28 while those of PtH-ZSM-
5(80) are illustrated in Figures 4.29 - 4.32. The overall shapes of the isotherms remained
the same before and after coking. The main difference observed between the fresh and
coked catalysts was the total adsorption capacity of the PtH-ZSM-5 catalysts. On the
linear isotherm plot, only a steep rise of amount adsorbed was observed at very low
P/Po range. The slope of the isotherm is very steep, indicating adsorption in pores of
molecular dimensions at these P/Po. It was recommended to plot the amount adsorbed
against log (P/Po) to identify the presence of micropores by the point of inflection in the
high-resolution isotherm at low P/Po [20, 44]. As suggested, the amount of nitrogen and
argon adsorbed was plotted against the P/Po range on a logarithmic scale on the x-axis
to allow a detailed observation of the micropore region. The logarithmic graph showed
103

the characteristic ‘S’ shaped curves of microporous solids as compared to the steep
rising region on the linear isotherm plot. The difference in the isotherms observed at
low P/Po indicated that the semi-logarithmic plot was clearly more informative for
micropore filling than the linear isotherm plot.
0.0 0.2 0.4 0.6 0.8 1.00
1
2
3
4
5
6
7
8
Nor
mal
ised
Am
ount
Ads
orbe
d,m
mol
g-1
Relative Pressure, P/Po
Figure 4.51 – Nitrogen adsorption isotherms for fresh (-■-), 4 h (-●-), 24 h (-▲-)
and 48 h (-▼-) coked PtH-ZSM-5(30) catalysts
0.0 0.2 0.4 0.6 0.8 1.00
1
2
3
4
5
6
7
Ren
orm
alis
ed A
mou
nt A
dsor
bed,
mm
ol g
-1
Relative Pressure, P/Po
104
Figure 4.52 – Argon adsorption isotherms for fresh (-■-), 4 h (-●-), 24 h (-▲-) and
48 h (-▼-) coked PtH-ZSM-5(30) catalysts
1E-8 1E-7 1E-6 1E-5 1E-4 1E-3 0.01 0.1 10
1
2
3
4
5
6
7
8
Nor
mal
ised
Am
ount
Ads
orbe
d,m
mol
g-1
Relative Pressure, P/Po
Figure 4.53 – Semi log plot of nitrogen adsorption isotherms for fresh (-■-), 4 h
(-●-), 24 h (-▲-) and 48 h (-▼-) coked PtH-ZSM-5(30) catalysts
1E-7 1E-6 1E-5 1E-4 1E-3 0.01 0.1 10
1
2
3
4
5
6
7
Nor
mal
ised
Am
ount
Ads
orbe
d,
mm
ol g
-1
Relative Pressure, P/Po
105
Figure 4.54 – Semi log plot of argon adsorption isotherms for fresh (-■-), 4 h (-●-),
24 h (-▲-) and 48 h (-▼-) coked PtH-ZSM-5(30) catalysts
0.0 0.2 0.4 0.6 0.8 1.00
1
2
3
4
5
6
7
Nor
mal
ised
Am
ount
Ads
orbe
d,m
mol
g-1
Relative Pressure, P/Po
Figure 4.55 – Nitrogen adsorption isotherms for fresh (-■-), 4h (-●-) and 48h (-▼-)
coked PtH-ZSM-5(80) catalysts
0.0 0.2 0.4 0.6 0.8 1.00
1
2
3
4
5
6
7
8
Nor
mal
ised
Am
ount
Ads
orbe
d,m
mol
g-1
Relative Pressure, P/Po
106

Figure 4.56 – Argon adsorption isotherms for fresh (-■-), 4h (-●-) and 48h (-▼-)
coked PtH-ZSM-5(80) catalysts
1E-8 1E-7 1E-6 1E-5 1E-4 1E-3 0.01 0.1 10
1
2
3
4
5
6
7
Nor
mal
ised
Am
ount
Ads
orbe
d,m
mol
g-1
Relative Pressure, P/Po
Figure 4.57 – Semi log plot of nitrogen adsorption isotherms for fresh (-■-), 4h
(-●-) and 48h (-▼-) coked PtH-ZSM-5(80) catalysts
107
1E-7 1E-6 1E-5 1E-4 1E-3 0.01 0.1 10
1
2
3
4
5
6
7
8
Nor
mal
ised
Am
ount
Ads
orbe
d,m
mol
g-1
Relative Pressure, P/Po
Figure 4.58 – Semi log plot of argon adsorption isotherms for fresh (-■-), 4h (-●-)
and 48h (-▼-) coked PtH-ZSM-5(80) catalysts
As with the results obtained from the PtH-ZSM-5(30) catalyst, the adsorption
capacity for the PtH-ZSM-5(80) also decreased with TOS (Figures 4.29 – 4.32). As
mentioned earlier, the coked sample isotherms for PtH-ZSM-5(30) were shifted to
lower P/Po as a result of coke deposition. However, this shift was not obvious for the
isotherms obtained for the PtH-ZSM-5(80) catalysts. The coked isotherms lie on top of
the fresh sample isotherms at low P/Po, and, only at higher P/Po, was the difference in
the adsorption capacity observed.
The adsorption isotherms for PtH-ZSM-5(30) catalysts (Figures 4.25 – 4.28)
showed a progressive decline in the total amount of argon and nitrogen adsorbed in the
microporous region (P/Po<0.2). The difference between the total adsorption capacity of
the fresh and coked catalysts was believed to be associated with the coke content
indicated by the TGA results. Comparing the isotherms for the fresh and coked PtH-
ZSM-5(30) samples, it was observed that the initial part of the isotherm was shifted to
lower P/Po for coked samples. The isotherm shift observed (Figure 4.27 and 4.28) for
the coked catalysts could possibly be due to the effect of coke deposition during the
reaction.
108
Table 4.5 shows the calculated values of the modified-BET surface area for the
fresh and coked PtH-ZSM-5 (SiO2/Al2O3 = 30 and 80) catalysts. The modified-BET
surface area decreased with TOS, indicating that parts of the zeolite pore network were
blocked or isolated by coke molecules formed.
Table 4-7 – Modified-BET Surface Area for PtH-ZSM-5(30) and PtH-ZSM-5(80)
catalysts at different TOS
Time-on-Stream
(TOS), h
Modified-BET Surface Area,
m2 g-1
PtH-ZSM-5(30) PtH-ZSM-5(80)
Nitrogen Argon Nitrogen Argon
0 369.13 389.73 428.63 444.64
4 347.84 347.20 384.79 398.12
24 322.06 321.47 - -
48 282.15 277.80 339.62 383.91
4.4.5.6 Langmuir-BET model fit
The reversible regions of the experimental adsorption isotherms were fitted to a
two-component model comprising of Langmuir and BET components to distinguish
between the adsorption in the dual pore system of the zeolite catalyst. Since PtH-ZSM-5
catalysts are made up of micropores within the zeolite crystallites and mesopores
surrounding the zeolite crystallites, the Langmuir (Type I) model was used to represent
adsorption within the microporous region, while a BET (Type II) model was used for
adsorption in the pores outside of the zeolite crystallites
To determine the adsorption capacity parameters corresponding to the
micropores and mesopores in the PtH-ZSM-5 catalyst, the adsorption data were fitted to
Equation 4.16:
(4-51)
109
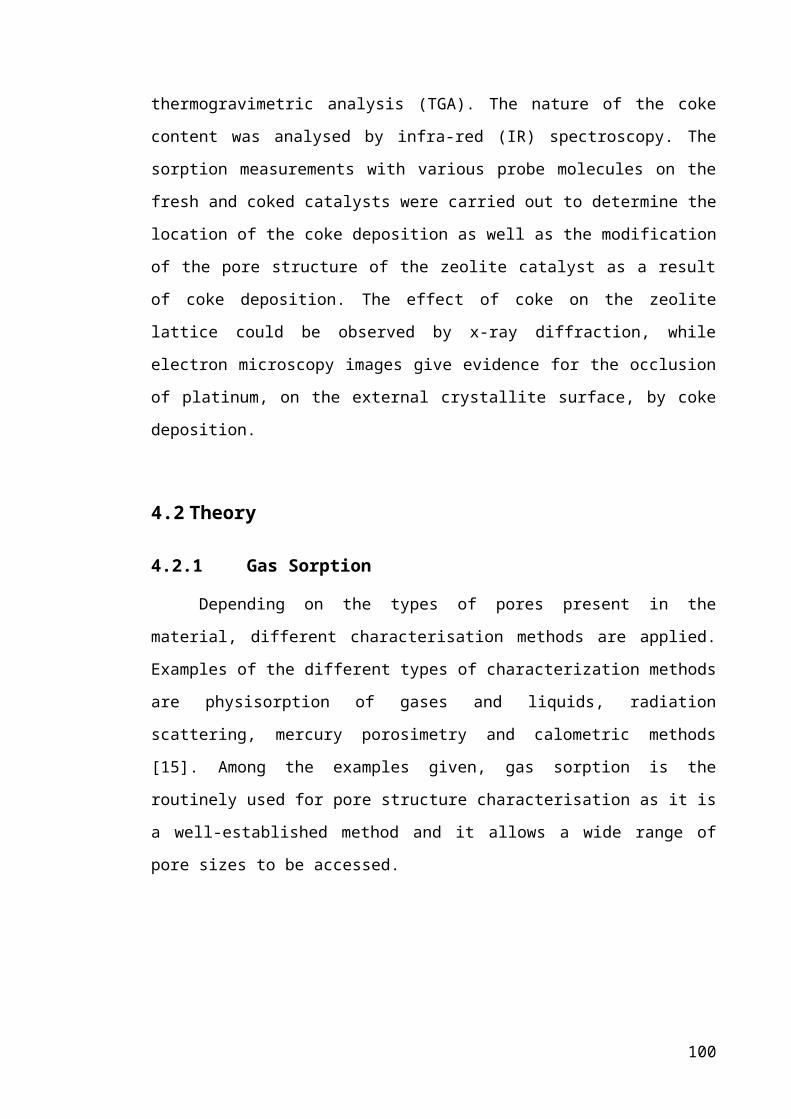
where V= volume adsorbed, z= fraction of pores corresponding to Langmuir component,
KL= Langmuir constant, P/Po= relative pressure , Vm= monolayer capacity, KBET= BET
constant
The ratios of the respective fitted adsorption capacity parameters to the total
value for both components for the fresh catalyst were determined. From Tables 4.6(i)
and 4.6(ii), it can be seen that the ratio of the BET component adsorption capacity
parameter showed little change with TOS relative to the Langmuir component for the
PtH-ZSM-5(30) catalysts.
In contrast to results for the PtH-ZSM-5(30) catalyst, a more significant drop
was observed for the adsorption capacity ratio for the BET component, with TOS for
PtH-ZSM-5(80) samples (Tables 4.6(i) and 4.6(ii)). Since only the ratio of the BET
component adsorption capacity parameter was changing with TOS, and little variation
was observed for the Langmuir component, a different deactivation mechanism was
proposed for the PtH-ZSM-5(80) catalyst.
Table 4-8 – Results of Langmuir and BET composite model fit to (i) nitrogen and
argon (ii) adsorption isotherms for PtH-ZSM-5(30) and PtH-ZSM-5(80) catalysts.
Notes: W/Wo is the ratio of the adsorption capacity parameter of the relevant
component, W, for the coked sample, to the corresponding total value, Wo, for the
fresh catalyst
(i) Nitrogen
Time on Stream
(TOS), h
W/Wo (Langmuir) W/Wo (BET)
PtH-ZSM-5(30) PtH-ZSM-5(80) PtH-ZSM-5(30) PtH-ZSM-5(80)
0 0.79 ± 0.05 0.75 ± 0.02 0.21 ± 0.02 0.25 ± 0.01
4 0.71 ± 0.05 0.67 ± 0.01 0.21 ± 0.02 0.22 ± 0.01
24 0.66 ± 0.05 - 0.21 ± 0.02 -
48 0.56 ± 0.04 0.67 ± 0.01 0.19 ± 0.02 0.19 ± 0.01
110
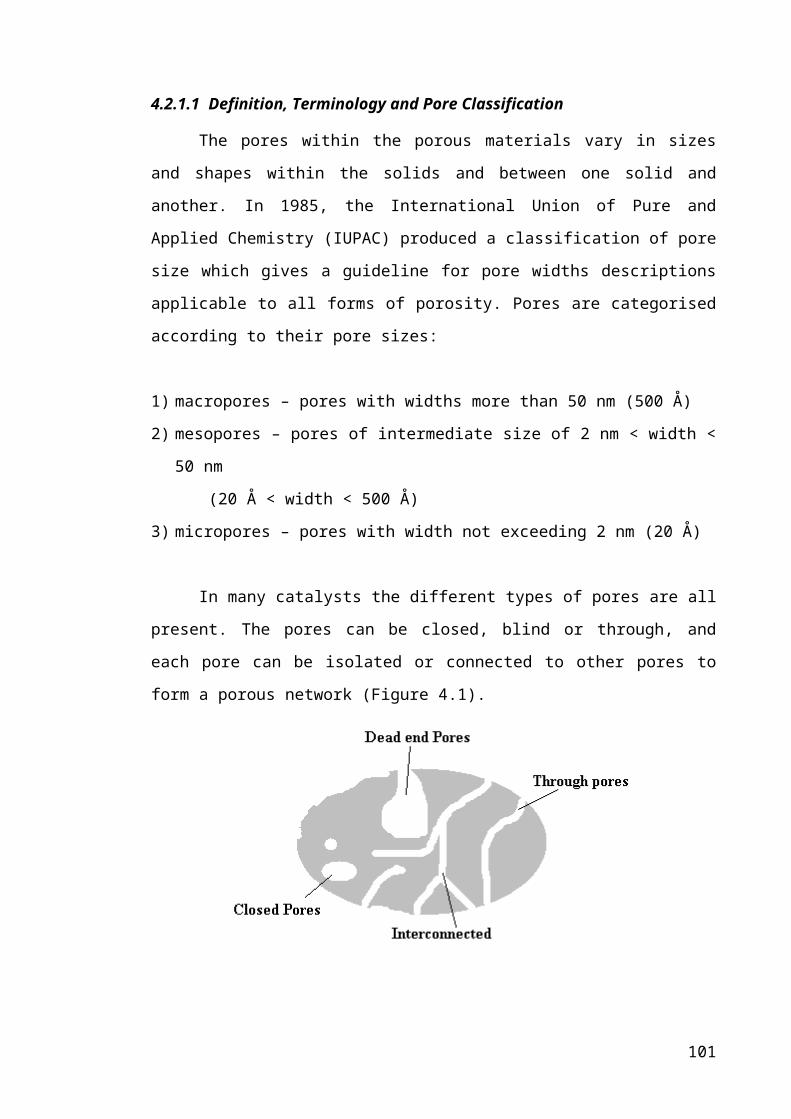
(ii) Argon
Time on Stream
(TOS), h
W/Wo (Langmuir) W/Wo (BET)
PtH-ZSM-5(30) PtH-ZSM-5(80) PtH-ZSM-5(30) PtH-ZSM-5(80)
0 0.76 ± 0.02 0.68 ± 0.01 0.24 ± 0.01 0.32 ± 0.01
4 0.74 ± 0.02 0.64 ± 0.01 0.25 ± 0.01 0.25 ± 0.01
24 0.61 ± 0.01 - 0.23 ± 0.01 -
48 0.55 ± 0.01 0.63 ± 0.01 0.20 ± 0.01 0.23 ± 0.01
4.5 Discussion
4.5.1 Variation in the Characteristic of Coke Deposits with TOS
From Table 4.3, it was shown that as TOS was increased to 48 hours, coke
deposition increased to 5.61 mass % and 2 mass % for PtH-ZSM-5(30) and PtH-ZSM-
5(80) catalysts, respectively. The formation of coke detected by TGA was believed to
be responsible for the drop in the activity of the PtH-ZSM-5 catalysts. The greater
amount of coke formed, and higher rate of coke formation for the PtH-ZSM-5(30)
catalyst compared with the PtH-ZSM-5(80) catalyst could be due to the greater number
of acid sites on the PtH-ZSM-5(30) catalyst, or due to the difference in the spatial
location and distribution of platinum as seen from the BSE images in Figures 4.13 and
4.14.
It was pointed out in Chapter 3 that, benzene conversion for the PtH-ZSM-5(30)
catalyst decreased rapidly at the start of the reaction, when compared with the drop in
benzene conversion at higher TOS. The plot of benzene conversion against TOS,
together with coke loading, for PtH-ZSM-5(30) catalyst is shown in Figure 4.33. At the
same time as when the activity of the PtH-ZSM-5(30) catalyst is deactivating
drastically, the corresponding coke content strongly increased (to 1.83 mass %) within
the first 4 hours of the benzene alkylation. This result implied that only a small amount
of coke was required to have such a large effect on the catalytic activity of the PtH-
ZSM-5(30) catalyst. Even though the amount of coke formed during benzene alkylation
111

over PtH-ZSM-5(80) catalyst was increasing with TOS, the benzene conversion
remained constant.
0 10 20 30 40 5012
14
16
18
20
22
Time on Stream, h
Con
vers
ion,
%
0
2
4
6 Coke C
ontent, mass %
Figure 4.59 – Conversion of benzene (-■-) vs coke content (-●-) with TOS for the
PtH-ZSM-5(30) catalyst
IR investigations of the 48 hour coked PtH-ZSM-5(30) catalyst demonstrate that
the nature of coke deposits from the alkylation of benzene with ethane have both
polyaromatic and paraffinic characters, as seen from the appearance of the IR bands at
1600 cm-1 and in the regions between 1300 and 1500 cm -1. However, the ratio between
the intensity of the ‘coke band’ at 1600 cm-1 and that of the doublet at 1369 cm-1 and
1382 cm-1 increased with coke content, which indicates the increase in polyaromatic
character of coke with TOS.
4.5.2 Pore Structure Evolution with Deposition of Coke
Modifications of the pore architecture of PtH-ZSM-5 catalysts with coking were
observed from nitrogen and argon adsorption results. The adsorption isotherms,
comparing the fresh and spent PtH-ZSM-5 catalysts, indicated that, as TOS is increased,
the amount of nitrogen and argon adsorbing is decreasing. The difference between the
total adsorption capacity of the fresh and deactivated catalysts is believed to be
associated with the increasing coke content at higher TOS. The loss of accessible pore
112
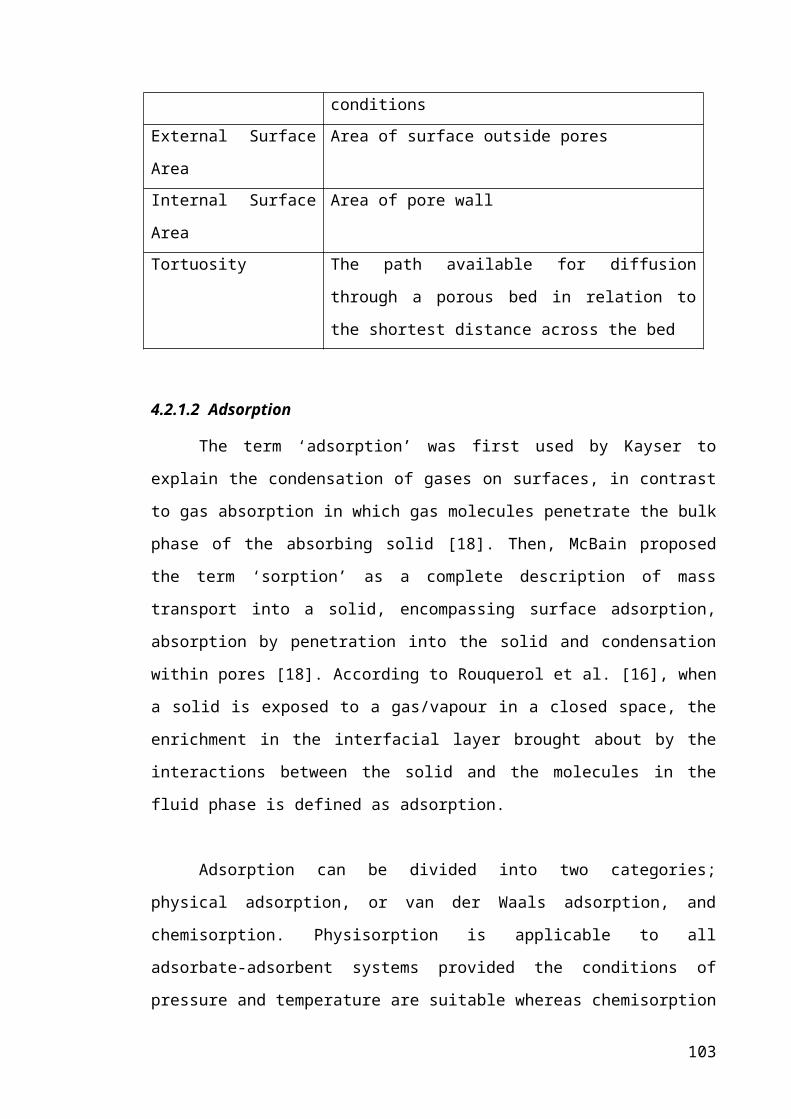
volume suggests that the internal pore structure of the catalyst and/or the surface
chemistry have been modified in some ways [45].
0.65 0.70 0.75 0.80 0.85 0.900.0
0.5
1.0
1.5
2.0
2.5
3.0
3.5
4.0
dV/d
w, c
m3 (g
.nm
)-1
Nominal Pore Diameter, nm
Figure 4.60 – Pore size distribution for fresh (─), 4 h (─), 24 h (─) and 48 h (─)
coked PtH-ZSM-5(30) catalysts
From the nitrogen adsorption data, the pore size distribution (PSD) for the PtH-
ZSM-5(30) catalyst was predicted using Horwath-Kawazoe cylindrical pore model. It
should be noted that due to the simple description of the adsorbate-adsorbent
interactions in the HK model, the PSD generated from it probably does not give a
correct absolute pore size for the MFI catalyst. Hence, only the relative shift in the PSD
is taken into account, which may reflect geometric or chemical changes, or both
together. The effect of coke on the micropore size distribution of the fresh and coked
PtH-ZSM-5(30) catalysts is shown in Figure 4.34. The differential pore volume plot of
the fresh catalyst showed three peaks at 0.725 nm, 0.743 nm and 0.749 nm. As the
carbon content increased, the three peaks progressively decreased, and the PSD was
shifted to smaller pore diameters.
A significant apparent increase in the micropore volume was observed at a pore
diameter of 0.72 nm for the 4 h coked catalyst and 0.71 nm for the 24 h coked catalyst.
In the case of the PtH-ZSM-5(30) catalyst coked for 4 and 24 h, the modification of the
micropore size distribution could result from coke deposition onto the walls of larger
113
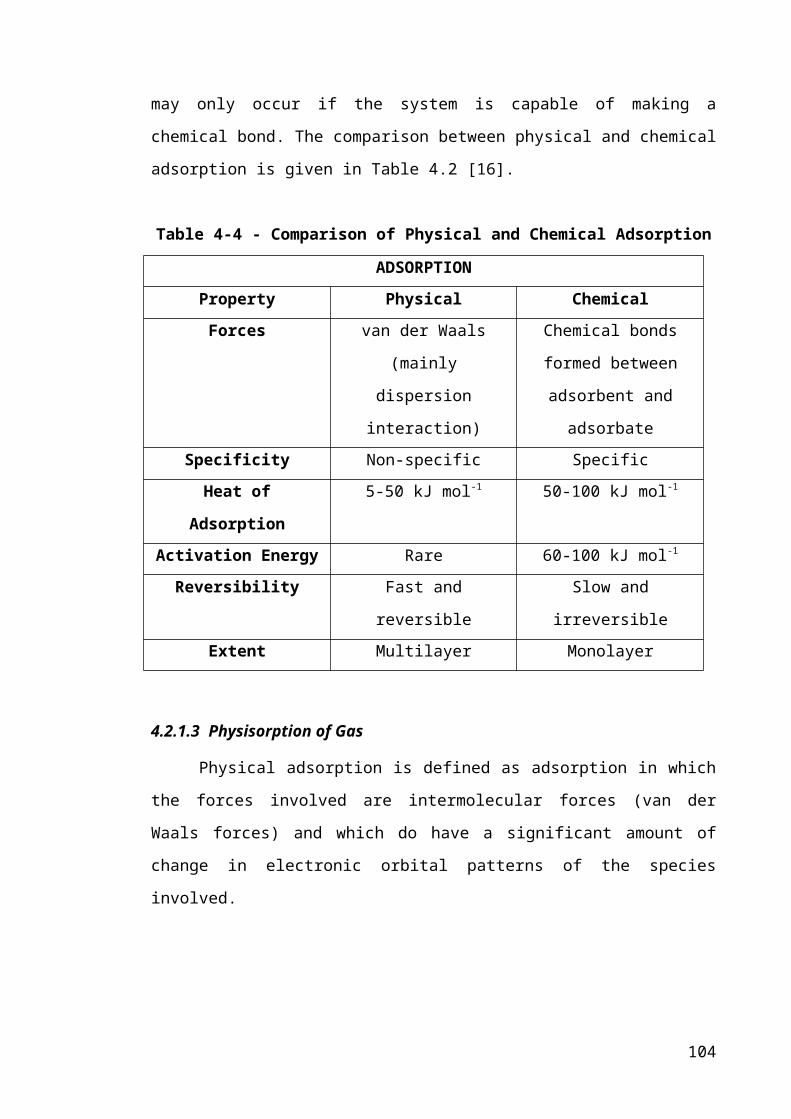
micropores, hence apparently creating more smaller pores. A general trend towards
apparently smaller pores with increased TOS might also arise from the increasing
formation of more dead-end pores as coke is deposited within the core of the
crystallites. This is because adsorption occurs more readily (at lower pressure) in dead-
end pores due to the increased pore potential. After 48 hours on-stream, a significant
loss in micropore volume was observed, possibly induced by the diminution of the
number of pores accessible to nitrogen.
4.5.3 Location of Coke Deposition
While the diffraction patterns for PtH-ZSM-5(30) catalysts changed from a
doublet peak at 2θ = 23o-23.2o for the fresh catalyst into a singlet with increasing
intensity when coke is formed, the doublet peak remained so for coked samples of PtH-
ZSM-5(80) catalysts. Changes in the relative position and intensities of the XRD peaks
have previously been suggested to result from the distortion of the ZSM-5 lattice when
it was occluded by template ions [12], or when carbonaceous residues were deposited
within the zeolite pores [10]. The similar changes, observed in Figure 4.11, to those
reported in the recent study by Lin et al. [10] provided evidence that the deposited coke
was located inside the zeolite crystallites, as opposed to the external location of the coke
formed during the reaction over the PtH-ZSM-5(80) catalyst.
As hypothesized earlier, if coke was formed on the surface of the zeolite
crystallites, it ought to obscure at least some Pt particles, but this was not observed for
the PtH-ZSM-5(30) catalyst. Therefore, it can be assumed that coke was deposited
inside the crystallites of the PtH-ZSM-5(30) catalyst. The reduction in the apparent
surface Pt concentration with TOS (Figure 4.17) suggests the deposition of coke on the
surface of the PtH-ZSM-5(80) crystallites.
The change in the ratios of the adsorption capacity parameters, from the two-
component (Langmuir and BET) adsorption fits, with TOS suggested that that the
deposition of coke within the PtH-ZSM-5(80) catalyst was predominantly located in the
mesopore network thus giving rise to pore blockage, where the entrance to the zeolite
channels was blocked by coke forming on the outside of the zeolite crystallite.
However, a different mechanism was proposed for the catalyst with higher acidity and
114

activity (PtH-ZSM-5(30)), since only the ratio of the Langmuir component adsorption
capacity parameter was changing with TOS, and no variation was observed for the BET
component adsorption capacity. Hence, only the pores within the zeolite crystallites
were modified by coke, supporting the proposed location of coke deposition by the
XRD spectra.
4.6 Conclusions
Thermogravimetric analysis showed that the amount of coke deposited on the
PtH-ZSM-5 catalysts increased with TOS. As a result, the total adsorption capacity for
nitrogen and argon decreased for the partially deactivated PtH-ZSM-5 catalysts, as
compared with the fresh catalysts. With coke deposition on the walls of larger
micropores, more smaller pores are generated, hence shifting the PSD of the coked PtH-
ZSM-5(30) catalysts towards smaller pore diameters.
The diffraction pattern, together with the sorption data of different probe
molecules (nitrogen and argon), suggested that coke is deposited inside the pore
network of the PtH-ZSM-5(30) catalyst. In addition, the back-scattered electron images
also showed that the coke molecules formed did not obstruct the Pt particles located on
the surface of the crystallites, which supports the diffraction and sorption results.
In contrast to the findings of PtH-ZSM-5(30) catalyst, coke is mainly formed in
the intercrystalline regions of the PtH-ZSM-5(80) catalysts, as shown by the diffraction
patterns and the decrease in BET component adsorption capacity parameters from the
Langmuir-BET fit, with TOS.
4.7 References
[1] B. Wang, and G. Manos, Journal of Catalysis 250 (2007) 121-127.
[2] B. Wang, and G. Manos, Industrial & Engineering Chemistry Research 47
(2008) 2948-2955.
[3] H.G. Karge, and E. Boldingh, Catalysis Today 3 (1988) 379-386.
[4] M.A. Uguina, D.P. Serrano, R. Van Grieken, and S. Venes, Applied Catalysis A:
General 99 (1993) 97-113.
115
[5] J.L. Sotelo, M.A. Uguina, J.L. Valverde, and D.P. Serrano, Applied Catalysis A:
General 114 (1994) 273-285.
[6] D. Eisenbach, and E. Gallei, Journal of Catalysis 56 (1979) 377-389.
[7] P. Dejaifve, A. Auroux, P.C. Gravelle, J.C. Vedrine, Z. Gabelica, and E.G.
Derouane, Journal of Catalysis 70 (1981) 123-136.
[8] Y. Schuurman, C. Delattre, I. Pitault, J.P. Reymond, and M. Forissier, Chemical
Engineering Science 60 (2005) 1007-1017.
[9] P.D. Hopkins, J.T. Miller, B.L. Meyers, G.J. Ray, R.T. Roginski, M.A. Kuehne,
and H.H. Kung, Applied Catalysis A: General 136 (1996) 29-48.
[10] X. Lin, Y. Fan, G. Shi, H. Liu, and X. Bao, Energy and Fuels 21 (2007) 2517-
2524.
[11] M. Guisnet, and P. Magnoux, Applied Catalysis 54 (1989) 1-27.
[12] D.M. Bibby, N.B. Milestone, J.E. Patterson, and L.P. Aldridge, Journal of
Catalysis 97 (1986) 493-502.
[13] A. De Lucas, P. Canizares, A. Durfin, and A. Carrero, Applied Catalysis A:
General 156 (1997) 299-317.
[14] C.A. Fyfe, G.J. Kennedy, C.T. De Shutter, and G.T. Kokotailo, Journal of
Chemical Society-Chemical Communication 8 (1984) 541-542.
[15] K.S.W. Sing, D.H. Everett, R.A.W. Haul, L. Moscou, R.A. Pierotti, J.
Rouquerol, and T. Siemieniewska, Pure and Applied Chemistry 57 (1985) 603-
619.
[16] F. Rouquerol, J. Rouquerol, and K. Sing, Adsorption By Powders and Porous
Solids Principles, Methodology and Applications San Diego, Calif. ; London :
Academic Press, 1999.
[17] G. Ertl, H. Knozinger, and J. Weitkamp, editors. 1997. Handbook of
Heterogeneous Catalysis. VCH : Weinheim.
[18] S.J. Gregg, and K.S.W. Sing, Adsorption, Surface Area and Porosity. London :
Academic Press, 1982.
[19] A.F. Venero, and J.N. Chiou, Materials Research Society Symposium
Proceedings 111 (1987) 235-240.
[20] S. Storck, H. Bretinger, and W.F. Maier, Applied Catalysis A: General 174
(1998) 137-146.
[21] A. Gil, Adsorption 4 (1998) 197-206.
[22] K.S.W. Sing, Colloids and Surfaces 38 (1989) 113-124.
116
[23] H. Liu, L. Zhang, and N.A. Seaton, Journal of Colloid and Interface Science 156
(1993) 285-293.
[24] J. Seifert, and G. Emig, International Chemical Engineering - New York 31
(1991) 29-41
[25] A. Gervasini, Applied Catalysis A: General 180 (1999) 71-82.
[26] G. Leofanti, M. Padovan, G. Tozzola, and B. Venturelli, Catalysis Today 41
(1998) 207-219.
[27] S. Lowell, and J.E. Shields, Powder Surface Area and Porosity. Chapman and
Hall, London, 1984.
[28] K.S. Walton, and R.Q. Snurr, Journal of The American Chemical Society 129
(2007) 8552-8556.
[29] J. Rouquerol, P. Llewellyn, and F. Rouquerol, Characterization of Porous Solids
VII : Proceedings of the 7th International Symposium on the Characterization of
Porous Solids (COPS-VII) Elsevier, Amsterdam ; London 2007, 49-56.
[30] J.C. Groen, L.A.A. Peffer, and J. Perez-Ramirez, Microporous and Mesoporous
Materials 60 (2003) 1-17.
[31] D. Chen, H.P. Rebo, K. Moljord, and A. Holmen, Chemical Engineering
Science 51 (1996) 2687-2692.
[32] E. Maglara, A. Pullen, D. Sullivan, and W.C. Conner, Langmuir 10 (1994)
4167-4173.
[33] H.G. Karge, W. NieBen, and H. Bludau, Applied Catalysis A: General 146
(1996) 339-349.
[34] M.-E. Eleftheriou, and C.R. Theocharis in: B. McEnaney, Mays, T.J.,
Rouquerol, J., Rodriguez-Reinoso, F., Sing, K.S.W., Unger, K.K., (Ed.), An
Anomalous Adsorption of ZSM-5 Zeolites, Royal Society of Chemistry,
University of Bath. 1997, 475-490.
[35] P. Hudec, A. Smieskova, Z. Zidek, M. Zubek, P. Schneider, M. Kocirik, and J.
Kozankova, Collection of Czechoslovak Chemical Communications 63 (1998)
141-154.
[36] P.J.M. Carrott, and K.S.W. Sing, Chemistry and Industry 22 (1986) 786-787.
[37] K.S.W. Sing, Unger, K.K., Chemistry and Industry 5 (1993) 165-166
[38] P.A. Jacobs, Zeolites 1 (1981) 161-168.
117
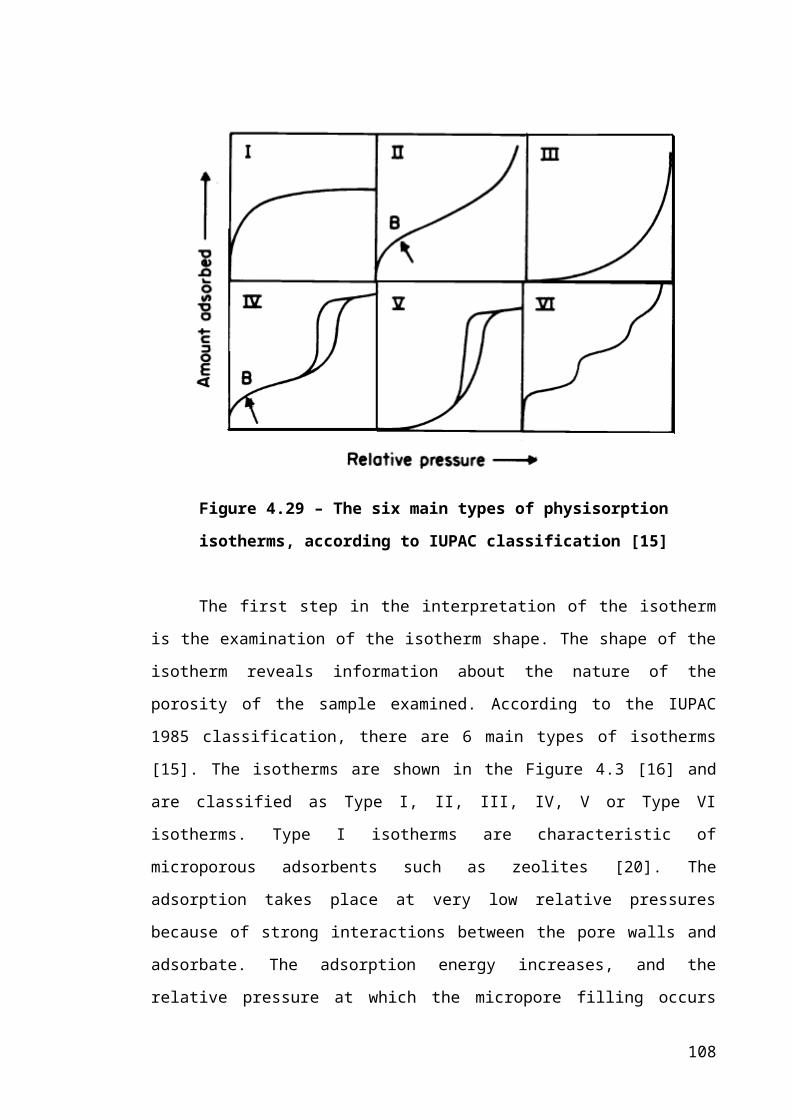
[39] U. Muller, E. Robens, K.K. Unger, Y. Grillet, F. Rouquerol, J. Rouquerol, D.
Pan, and A. Mersmann, Fresenius' Journal of Analytical Chemistry 333 (1989)
433-436.
[40] D. Douguet, R.J.M. Pellenq, A. Boutin, A.H. Fuchs, and D. Nicholson,
Molecular Simulation 17 (1996) 255-288.
[41] P. Llewellyn, Coulomb, J.P., Reichert, H., Patarin, J., Grillet, Y., Rouquerol, J.,
Langmuir 9 (1993) 1852-1856.
[42] P. Llewellyn, Coulomb, J.P., Reichert, H., Patarin, J., Grillet, Y., Rouquerol, J. ,
Langmuir 9 (1993) 1846-1851.
[43] Y.S. Tao, H. Kanoh, and K. Kaneko, Advanced Materials 17 (2005) 2789-2791.
[44] X. Guo, Y. Han, Y. Zou, D. Li, J. Yu, S. Qiu, and F. Xiao, Microporous And
Mesoporous Materials 42 (2001) 325-336.
[45] J. Wang, F. Hassan, P.I. Chigada, S.P. Rigby, B. Al-Duri, and J. Wood,
Industrial & Engineering Chemistry Research 48 (2009) 7899-7909.
Chapter 5 : Monte Carlo Simulation
5.1 Introduction
In the previous chapter, the location of coke deposition, either within the zeolite
crystallite or in the intercrystalline region, has been identified. However, the distribution
of coke inside the zeolite crystallite is still not known. It is believed that the
interconnectivity of the zeolite pore structure influences the diffusivity and accessibility
within the zeolite crystals. In order to study the effect of coke on the accessibility of a
molecule in a blocked pore network, the percolation theory was adapted in this work.
The effect of pore blockage on the self-diffusivity in zeolite crystallites was also studied
by Monte Carlo simulation.
5.2 Percolation Theory
Percolation theory is commonly used to describe the effect of connectivity and
accessibility in porous materials. The key concept of percolation theory is the
occupation of sites or bonds, which indicates if a site or bond is available for diffusion
118
i.e. open (unoccupied) or close (blocked or occupied) [1]. Sites and bonds are randomly
selected as blocked with probability f and empty with probability (1-f) [2].
Percolation theory was developed for three different types of occupation: bond
percolation where the bond between neighbouring lattice sites can be closed with a
probability fb or open with a probability of (1-fb), site percolation where the intersections
between bonds are closed or open with a probability fs and (1-fs) respectively. Lastly,
site-bond percolation where both sites and bonds are blocked or remain empty randomly
with a probability fsb and (1-fsb), respectively.
The pore structure of any porous medium can be mapped onto an equivalent
three-dimensional network of random bonds connected to each other by sites/nodes of
the network [5]. Several models are available to describe the structure of porous media
and study the deactivation of catalysts at a particle level. Cubic and random stochastic
pore networks, fractal pore structures, and Bethe-tree networks [6] are a few examples.
The simplest model consists of a regular network of nodes or sites connected by
identical bonds, as in the case of cubic tessellation or Bethe network, as shown in Figure
5.1. In the cubic lattice and Bethe network, only the accessible volume and connectivity
are changed, but the pore radii and diffusivity remain constant [6]. The cubic lattice is
widely used as it takes into account isolated inaccessible pore clusters which are
responsible for rapid deactivation [6]. The Bethe network does not give a realistic
representation of the real pore structure since pores present in the network are connected
through a central node. As a result, most models are now using more connected lattice
networks to mimic pore structures within the crystallites.
119
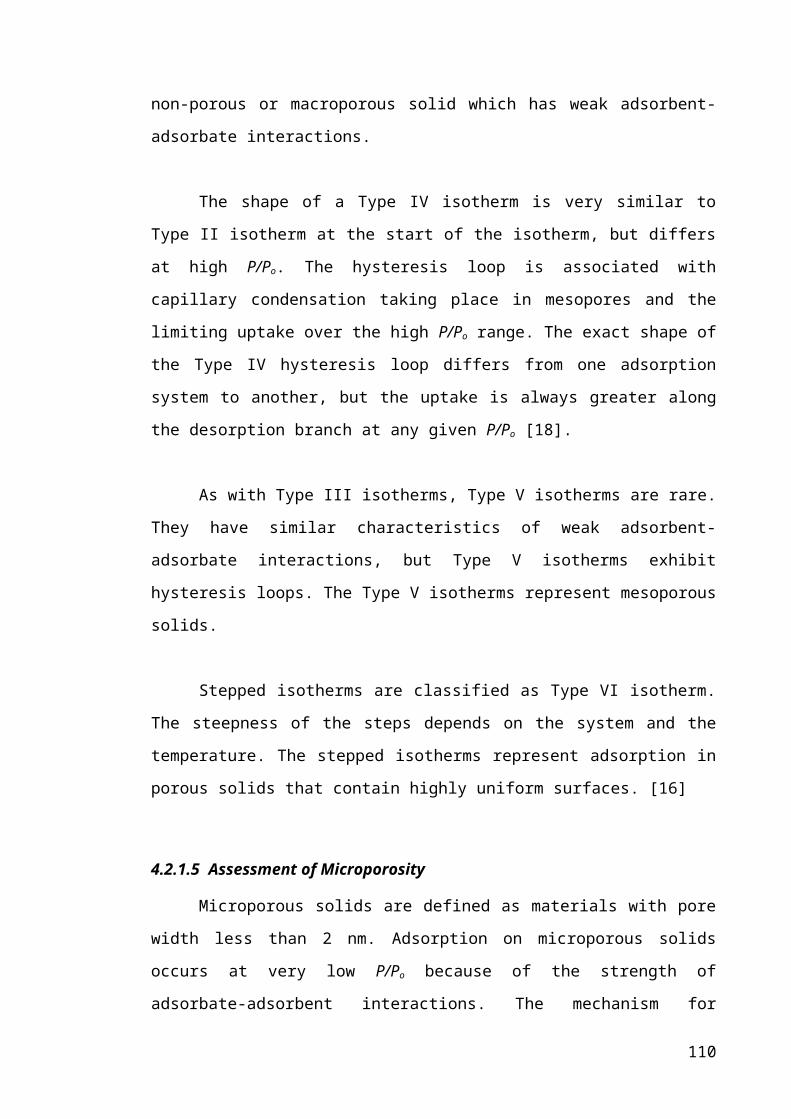
Figure 5.61 – Representation of real pore structure on a cubic and Bethe lattice –
adapted from reference [6]
The complexity of the architecture of a porous medium can be represented by an
array of lattices. Both two and three dimensional lattices consist of an array of sites
which are connected to their neighbouring sites by bonds, and can be described in terms
of L, number of bonds between one side of the lattice and another and Z, the
coordination number (connectivity), i.e. the number of bonds that are connected to one
node. Even though the cubic lattice is mostly used, other types of lattices such as the
triangular lattice, honeycomb lattice, and the diamond lattice can also be applied to
mimic the pore structure of a porous material.
If a pathway exists for a molecule to move from one side of the lattice to the
other, then, a percolation cluster is said be present in the lattice. Figure 5.2 shows a
square lattice with a bond probability of (a) 0.25 and (b) 0.5. The bond probability is
defined as the number of occupied bonds divided by the total number of bonds. As the
bond probability increases (transition from Figure 5.2a to 5.2b), larger clusters are
formed until a percolation cluster is formed, where the cluster is large enough to span
the lattice [7]. The phenomenon, when this spanning cluster is formed, is known as the
percolation threshold.
120
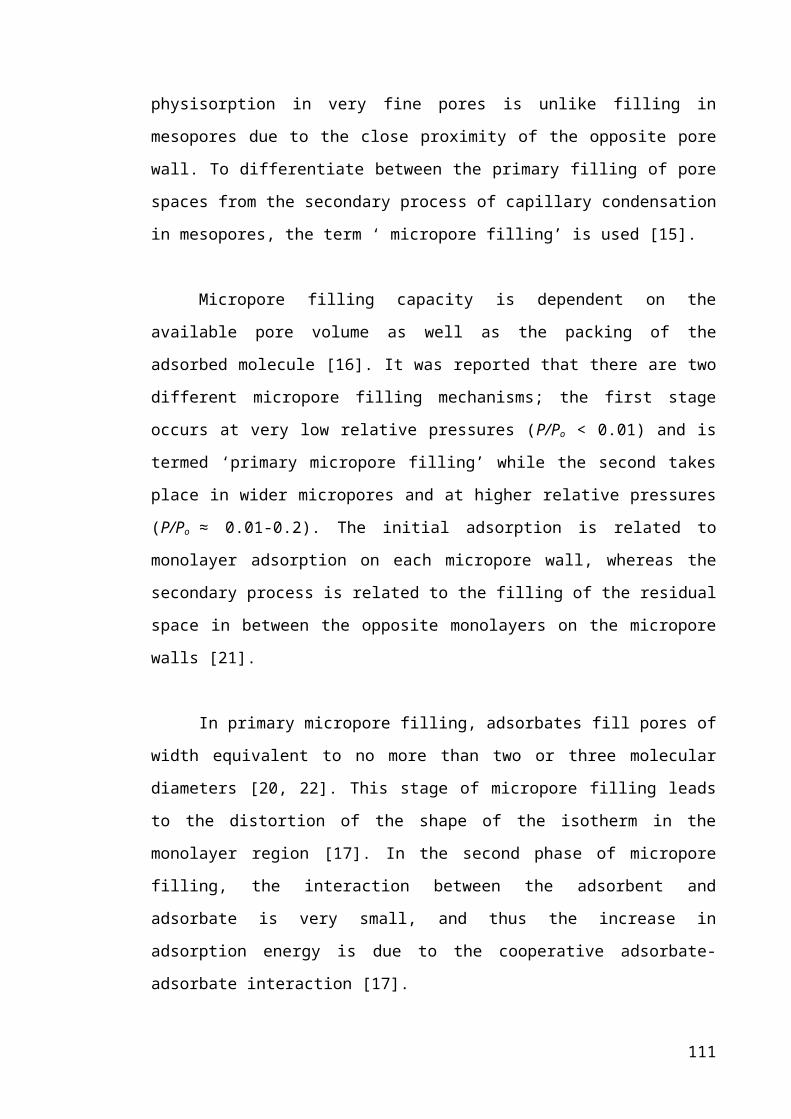
(a) fb = 0.25 (b) fb=fbc=0.5
Figure 5.62 – Square lattice with different bond occupational probability, pb
5.2.1 Application of percolation theory in this study
The connection between the deactivation process and percolation theory is made
by relating the state of bonds or sites in the lattice with coke deposition. Therefore, three
types of pores are defined in terms of pore content:
a) Pores that are open or unblocked – can be accessed by reactants/products
b) Pores that are occupied or blocked pores by coke molecules – cannot be
accessed by reactant/products
c) Pores that are open or unblocked but are only accessed through other pores
blocked by coke molecules (isolated pores) – cannot be accessed by
reactant/products
The probability of a bond/site being blocked, f is the ratio of the number of
blocked bonds/sites to the total number of bonds/sites (Equation 5.1). The accessibility
or percolation fraction, F is the probability that network bonds/sites are in the spanning
cluster (Equation 5.2). As the fraction of unblocked pores decreases, the connectivity of
the lattice decreases, and eventually the molecules are unable to penetrate through the
pore network from the bulk of the lattice. The minimum fraction of unblocked pores
that still allows a percolation cluster to exist in the lattice is termed percolation
threshold. The percolation threshold determines the critical porosity at which most of
the pore space becomes completely isolated, and the transport diffusivity/accessibility is
reduced to zero. In terms of catalyst deactivation, the catalyst becomes deactivated
when the percolation threshold is reached because of general inaccessibility to the
interior of the catalyst pore volume.
(5-52)
121

(5-53)
5.2.2 Analysis of catalyst deactivation by coke formation in a ZSM-5 lattice
– a percolation approach
During the catalyst deactivation process, coke formed can either deactivate
active sites or block access to the active centres. Deactivation by coking which results in
active site loss has been comprehensively studied over the years, but little information is
available for deactivation by pore blocking. According to Beyne and Froment [3], pore
blockage depends on the geometrical and topological characteristics of the pore
network. The connectivity of a lattice plays an important role in determining the
behaviour of the catalyst in terms of catalyst lifetime. It was previously shown that a
catalyst has higher resistance to deactivation when the pores are more interconnected
[5]. Since the gradual build up of coke within the pore cavities during the deactivation
process cause changes in the morphology of the porous medium, the concept of
percolation was applied to describe this occurrence. Sahimi and Tsotsis [5] were the
first to identify catalyst deactivation as a percolation phenomenon. From that study,
percolation models of catalyst deactivation were developed by other researchers to
investigate reaction and diffusion in a porous catalyst. [3, 6, 8-9].
The ZSM-5 zeolite is widely used because of its unique catalytic property, in
particular its high resistance to deactivation by coke formation. As a result, there has
been increasing interest in understanding transport within the ZSM-5 zeolite. In order to
simulate diffusion and reaction in the ZSM-5 zeolite, Beyne and Froment [3, 8-9] made
use of the diamond lattice to mimic the network of pores inside the ZSM-5 zeolite
crystallites in a series of studies. The use of diamond lattice which has a coordination
number of four is possible only if site percolation is taken into account as the
connectivities of the sites (intersections) and bonds (channels) of a ZSM-5 lattice are
not equal. In later years, the diffusion and reaction in ZSM-5 catalysts was studied by
Monte Carlo simulation based on a more realistic model of the ZSM-5 lattice as shown
in Figure 1 in reference [10]. According to Trout et al. [10], the inherent anisotropy in
ZSM-5 lattice could not be captured by the isotropic model such as square, diamond or
122
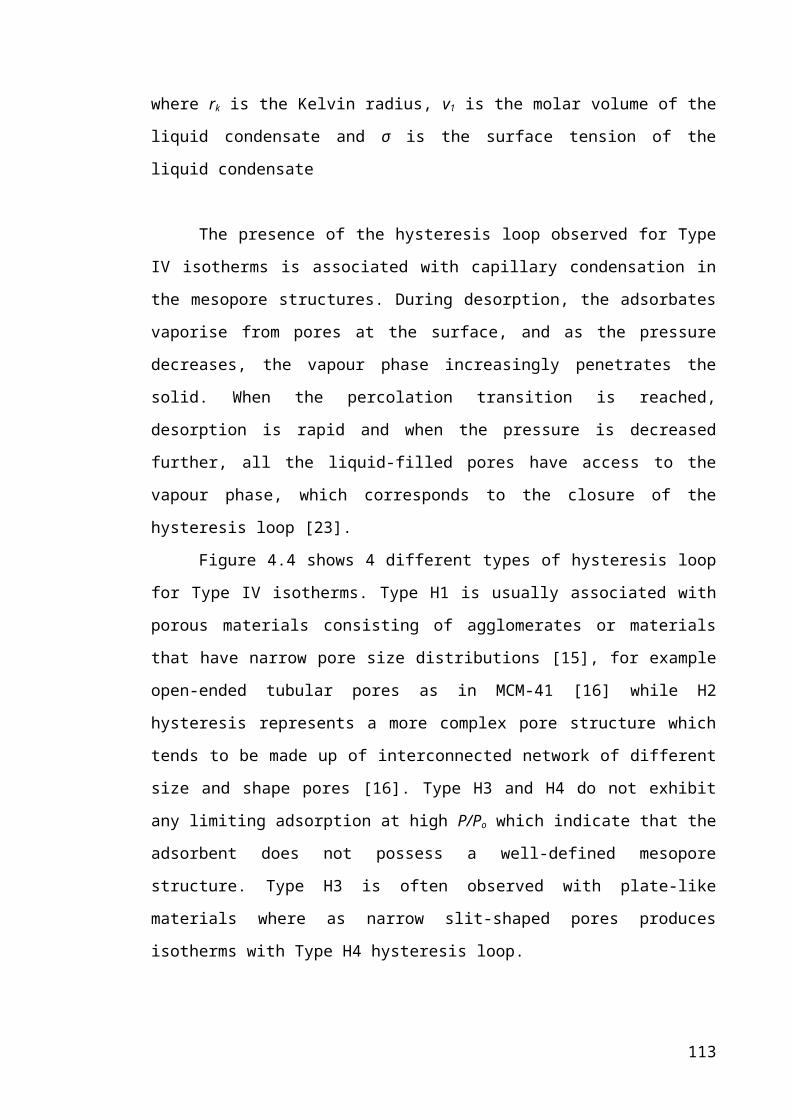
cubic lattices. Therefore, the authors modelled the ZSM-5 lattice in such a way that the
sites have a coordination number of four while the coordination number of the bonds is
two. It was reported that the effect of pore blockage on diffusivity is more pronounced
on the ZSM-5 lattice employed compared with the two-dimensional square and three-
dimensional cubic lattice. In addition, the critical percolation probability (percolation
threshold) for the ZSM-5 lattice employed by Trout et al. [10], which consists of sites
both in the channels and intersections (site-bond percolation) was evaluated to be 0.64.
5.3 Diffusion in Zeolites
The diffusion of molecules can be classified in a number of different regimes
depending on the pore diameter of the porous material (Figure 5.3). Most applications
of zeolites (in catalysis and separation processes) involve the migration of sorbates
within the crystallite. The separation of mixtures is based on the differences in their
diffusion coefficients, while in catalytic applications, diffusion of reactants to the active
site can be a rate limiting step [11]. Therefore, diffusion behaviour in zeolites has been
studied extensively over the years. Transport in zeolites is beyond the molecular and
Knudsen diffusion regions and takes place in the configurational diffusional regime.
When discussing diffusion in zeolites, two situations are involved: (i) diffusion within
the zeolite crystal and (ii) diffusion in between zeolite crystals, in the pellet.
Figure 5.63 – Effect of pore diameter on diffusivity and diffusional activation
energy. Adapted from reference [12]
123

Transport diffusion results from a concentration gradient, while self-diffusion
takes place in the absence of a chemical potential gradient. Transport diffusivity can be
described by Fick’s first law:
(5-54)
where C is the concentration, x is the spatial coordinate and Dt is the transport diffusion
coefficient.
Self diffusivity monitors the diffusion path of a tagged molecule placed in the
centre of the lattice over a preset number of steps [13]. Equation 5.4 can be used to
describe the flow of the tagged component:
(5-55)
in which * refers to the labelled component, and Ds is the self-diffusion coefficient.
The self-diffusion coefficient could be related to the mean square displacement
(defined by Einstein equation) after time t by Equation 5.5:
(5-56)
where is the position of particle i at time t (average of the squared distance
travelled by a particle at time t.
For diffusion in inhomogeneous frameworks such as the ZSM-5 type zeolite,
Equation 5.5 is modified to:
(5-57)
where α denotes the displacement along x, y or z direction and
In a current review on diffusion in zeolites, Smit and Maesen [11] pointed out
the difficulty in measuring the diffusion coefficient, and that the diffusion coefficient
124
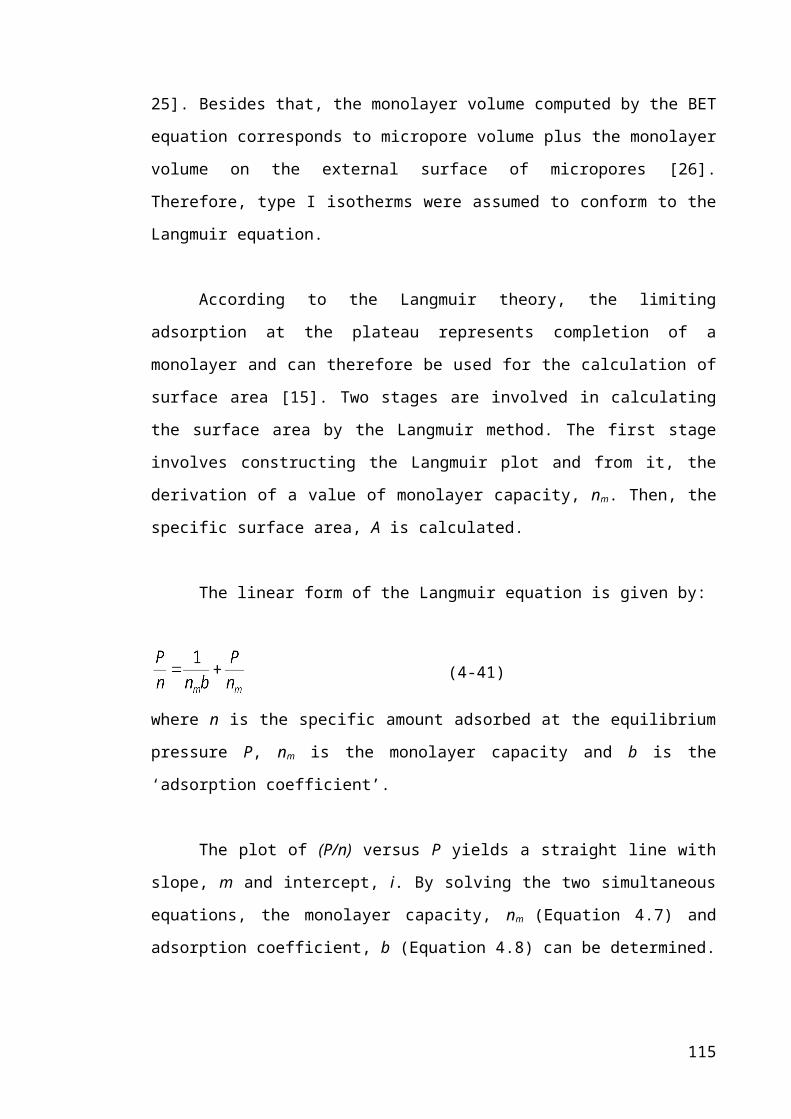
measured could differ by orders of magnitude depending on the particular experimental
technique used. Therefore, theoretical predictions of diffusivity at the molecular level
were performed. This computational modelling has provided useful information on the
mobility of a probe molecule in a lattice.
The diffusion of molecules can be affected by several factors, such as the size of
adsorbate molecules, the connectivity of a lattice, the molecular occupancy, the
interaction between the molecule and the lattice, and pore blockage. The effects of
lattice topology and occupancy on the self-diffusivity of a molecular species was
studied by Coppens et al. [4]. The diffusivity variation with occupancy differs for each
lattice with different coordination number, Z. However, the value of self-diffusivity at
zero coverage is independent of connectivity as molecules do not encounter each other
in the lattice. It was found that the dependency of diffusivity on occupancy is non-linear
because at high occupancies and low connectivities, the probability of a molecule
returning to its original site is high as a result of molecules blocking the sites.
Theoretical investigations have also provided useful information on the transport
properties in a catalyst as a result of coke deposition. The earliest study of diffusion and
reaction in blocked ZSM-5 catalysts was carried out by Theodorou and Wei [14] using a
random walk approach. It was found that the intracrystalline diffusivity is sensitive to
the blocking modes applied, either pore blocking or surface/border blocking. This study
was then extended to investigate the effect of reactant pressure on the modes of catalyst
deactivation [15-16]. The effect of blocked sites on self-diffusivity was investigated by
Trout et al. [10] for a ZSM-5 catalyst. Results generated by Monte Carlo simulations
indicated that the occupancy effect is more significant on a ZSM-5 lattice than on a two-
dimensional square or three-dimensional cubic lattice. In addition, the normalised
diffusivity was reported to decrease with increasing fraction of blocked sites as a result
of reduced accessibility of the molecules.
It is the purpose of this chapter to understand the effect of coking on the mass
transport within the catalyst pellets studied, as well as identifying the distribution of
coke molecules formed during the reaction. In the next section, the models and
simulation methodology will be presented, followed by discussion of the results
obtained.
125
5.4 Construction of Lattices
In order to model the diffusion/accessibility in a catalyst particle, the pore
structure of the catalyst can be represented either by two or three dimensional lattice
networks constructed by bonds and sites. All the pore volumes of the pore space can be
assigned to the bonds or sites, or both the bonds and sites inside the lattice. A simple
cubic network and ZSM-5 lattice was employed in this study.
5.4.1 Cubic Lattice
The cubic lattice is generated by a network of cylindrical pores as described by
Liu et al. [17]. At the start of the simulation, each site has a coordination number, Z of
6, but changes when the bonds and/or sites are blocked at random. The cubic lattice
used in the simulations for this study is illustrated in Figure 5.4, where the black dots
represent sites and the grey dots signify bonds in the cubic lattice.
Figure 5.64 – Cubic lattice model; (-●-) sites and (-●-) bonds
126
5.4.2 ZSM-5 Lattice
As described in Chapter 2, the ZSM-5 structure contains the circular sinusoidal
channel (0.54 x 0.56 nm) and straight elliptical channel (0.51 x 0.55 nm) which are
connected by a spherical intersection (~ 0.8 nm). The model of the ZSM-5 lattice used
is adapted from previous work by Trout et al. [10] and is presented in Figure 5.5. The
black dots represent the adsorption sites in the intersections (sites) while the gray dots
represent the straight/zig-zag channels (bonds). There are 12 lattice points per unit cell;
four in the intersections (there being four intersections in the unit cell) and eight in the
straight and zig-zag channels [10].
Figure 5.65 – Lattice model of ZSM-5; (-●-) sites and (-●-) bonds
The coordination numbers of the intersections and channels of the ZSM-5 lattice
are not equal to one another. If a particle/molecule is in the channel, it has only 2
neighbours hence it only has 2 directions of hop. In the straight channels, a particle can
only move in the up (UP) or down (DN) direction, while in the zig-zag channels, the
directions of northeast (NE)/southwest (SW) or northwest (NW)/southeast (SE) can be
chosen. If however, a particle sits in the channel intersection, it has 4 neighbours.
Therefore it has 4 directions (UP, DN, NE and NW or SE and SW) of hop.
127

5.5 Simulation Methods
The accessibility and self-diffusion simulations described in the following
sections were computed by an in-house computer program written using Fortran 95
(Appendix A4).
5.5.1 Accessibility Simulation
The deactivation phenomenon was represented by the blocking of the bonds and
intersections of the lattice generated. In this study, bond-site percolation was
investigated for the ZSM-5 lattice. The intersections and bonds that were blocked were
chosen at random according to a probability weighted by their volume in the real
zeolite. The coke molecules could only occupy the bonds and intersections if they were
previously empty. Once a bond or intersection was occupied by coke, no further
occupancy was allowed.
For calculations of accessibility, a layer of diffusing molecules was placed along
the boundaries of the lattice to represent the nitrogen (or argon) bulk phase during
adsorption. These molecules then penetrated into the pore network to identify accessible
bonds and sites. Any pores plugged with coke were considered inaccessible and
potentially barred the way for further penetration. If pores were unplugged, or not
blocked by coke molecules, but were completely surrounded by blocked pores, these
isolated clusters were also considered as not accessible.
In this study, bond and site percolation was studied on a simple cubic lattice
while bond-site percolation was investigated for a ZSM-5 lattice. The network size, L
was also varied in this study to investigate its effect on the accessibility for a constant
coordination number of the network, Z. Simulations were repeated for sets of new
lattices, and random number seeds, and average values for the accessibility fraction
were taken, in order to obtain a typical result for random dispersion/distribution of coke
molecules in the lattice/crystallites.
128
5.5.2 Self-diffusivity Monte-Carlo Simulations
The simulation of self-diffusivity was carried out on a simple cubic lattice (Z=6)
of lattice size, L = 21 and on a ZSM-5 pore network of lattice size, L = 24. The
simulation of self-diffusivity in the ZSM-5 lattice is based on previous work by Trout et
al. [10] and Coppens et al. [4].
The occupancy θ of the lattice (0≤θ≤1) is defined as the number of
simultaneously diffusing molecules divided by the number of lattice sites [4]. Initially, a
certain number of molecules, corresponding to θ, occupy randomly chosen sites on the
grid. Before the displacement of the molecules is sampled, the molecules are allowed to
hop for a certain equilibration time so that the diffusivity does not change as a function
of number of hops. When steady state diffusion in the lattice is achieved, the clock is
reset to zero and the positions of the particles are recorded. The particles are then
allowed to hop for an average of 3000 successful hops per particle.
A particle is selected at random to make a hop. Each particle can migrate to the
neighbouring sites with equal probability. The direction at which the particle hops to is
selected at random and the jump probability in each direction is the same. It is also
assumed that there is no interaction between the molecules or a molecule and the zeolite
lattice. If the direction chosen corresponds to the zeolite wall, the particle selected does
not move. If another particle occupies the particular site that was chosen, the particle
also does not move. The time interval between each attempted hops, Δt is calculated
from a Poisson distribution where , where u is a random number between
0 and 1. Even if the hop is unsuccessful and the molecule returns to its original site, the
clock is advanced by the time, Δt. However, if the site chosen is empty, the particle hops
to its adjacent lattice point and the successful hop counter is incremented.
Periodic boundary conditions are used to avoid finite size effects, where a
particle/molecule on the border of the grid exiting the simulation lattice can hop to the
symmetrically opposite site. Nevertheless, the real coordinates of each molecule are
updated and saved, as if the lattice were infinite [4]. Simulations are performed at
different occupancy, θ to study the influence of θ on self-diffusivity, Ds.
129
5.6 Calculations
5.6.1 Accessibility Study
5.6.1.1 Calculating volume of ZSM-5 lattice
The total volume of 1 unit cell of ZSM-5 lattice is modelled by the total volume
occupied by 4 straight cylindrical channels, 4 zig-zag cylindrical channels and 4
spherical intersections [1]. The dimensions for the channels and intersections for the
ZSM-5 lattice are taken from reference [18].
Table 5-9 – ZSM-5 channel dimensions [18]
Channel
Type
Length
(nm)
Diameter
(nm)
Straight 0.46 0.55
Zig-zag 0.66 0.53
Intersection 0.54 0.80
Table 5-10 – Volume of ZSM-5 channels in 1 unit cell
Channel
Type
Volume of 1
channel
(nm3)
Volume of 1
channel
(cm3)
Total volume of
channels in 1 unit cell
(nm3 per unit cell)
Total volume of
channels in 1 unit cell
(cm3 per unit cell)
Straight 0.109 1.09E-22 0.437 4.37E-22
Zig-zag 0.146 1.46E-22 0.583 5.83E-22
Intersectio
n0.268 2.68E-22 1.072 1.07E-21
Total volume of 1 unit cell of ZSM-5 2.09E-21
5.6.1.2 Analysis of Experimental Data
Pore blockage due to coke formation on the PtH-ZSM-5 catalysts was accounted
for by changes in the pore volumes determined from the nitrogen and argon adsorption
isotherms. The pore volume obtained from these adsorption experiments comprises the
volume of micro- and mesopores. However, in this work, the percolation model only
130
applies to the zeolite crystallite, hence only pore volumes inside the crystallites which
consist of straight and zig-zag channels and intersections are taken into account.
In order to distinguish between the internal and external pore volume of the
zeolite crystallites, the graphs of cumulative pore volume as a function of pore diameter
from nitrogen and argon adsorption experiments were used. It was assumed that the
micropores within the ZSM-5 crystal were less than 2 nm while pore volume between 2
and 50 nm was occupied by mesopores. The mesopore volume loss was assumed to be
occupied by coke molecules. This volume of coke was then subtracted from the total
coke volume determined from TGA so that the coke content in the micropores could be
evaluated.
Equations 5.1 and 5.2 were modified in order to incorporate the adsorption
experiment data for the accessibility plot. The values of F and f are determined by the
following equations:
(5-58)
where F is the accessibility fraction, V(t=0) is the pore volume for the fresh catalyst and
V(t=t) corresponds to the externally accessible pore volume of the coked catalyst at
different times-on-stream (t). The total fraction of unplugged pores, f, is given by:
(5-59)
where Vc(t=TOS) is the volume of coke at different TOS (t). The uncertainties in Vc as a
result of coke density values used (as described in Chapter 4) were taken into account
when evaluating the standard errors in the fraction of unplugged pores, f, and are given
by error bars shown in Figures 5.10 and 5.11.
5.6.2 Calculating/Estimation of Self-Diffusion Coefficient, Ds
The self-diffusivity was computed by calculating the mean squared displacement
of the molecule using Einstein equation: where is the mean square
displacement of the molecule between the position at time t and the initial position of
that particle, Ds is the self-diffusion coefficient and t is the total time for successful and
unsuccessful hops.
131

From the Monte-Carlo simulation, a linear plot of mean square displacement,
against time t was obtained. The slope of the graph corresponds to 2Ds, where the
self-diffusion coefficient, Ds can be calculated.
The self-diffusivity at zero coverage, Do is required to determine the normalised
self-diffusivity value. In order to evaluate Do, the diffusivity at low loading (20
molecules) was simulated. Then, normalised self-diffusivity, D/Do was calculated.
5.7 Results and Discussion
5.7.1 Accessibility
5.7.1.1 Validation of the accessibility program
The accessibility program was initially written for a simple cubic lattice. In
order to validate the program, simulated results were compared with published data.
Figure 5.6 shows the bond percolation simulation results on a simple cubic
lattice of network size, L = 61. On the same graph, the simulated result is also compared
with previously reported data on accessibility in a cubic lattice [17]. The agreement
between the simulated results and those of Liu et al. [17] validates the Fortran program
written.
0.0 0.1 0.2 0.3 0.4 0.5 0.6 0.7 0.8 0.9 1.00.0
0.1
0.2
0.3
0.4
0.5
0.6
0.7
0.8
0.9
1.0
Acc
essi
bilit
y Fr
actio
n, F
Fraction of Unblocked Pores, f
132
Figure 5.66 – Accessibility fraction, F as a function of unblocked pores, f for bond
percolation on a simple cubic lattice : Comparison of results from Liu et al. [17]
(-■-) and our simulated data (-●-)
The effect of network size, L on the percolation transition is shown in Figure
5.7. As the network size decreases, the percolation transition is more diffuse when
compared with a bigger network size. According to Liu et al. [17], as the network size is
decreased, the surface cluster dominates the accessibility of the network [17].
0.0 0.1 0.2 0.3 0.4 0.5 0.6 0.7 0.8 0.9 1.00.0
0.1
0.2
0.3
0.4
0.5
0.6
0.7
0.8
0.9
1.0
Acc
essi
bilit
y Fr
actio
n, F
Fraction of Unblocked Pores, f
Figure 5.67 – Effect of network size on the accessibility for Z=6: L=21 (-■-), L=41
(-●-) and L=61 (-▲-)
133
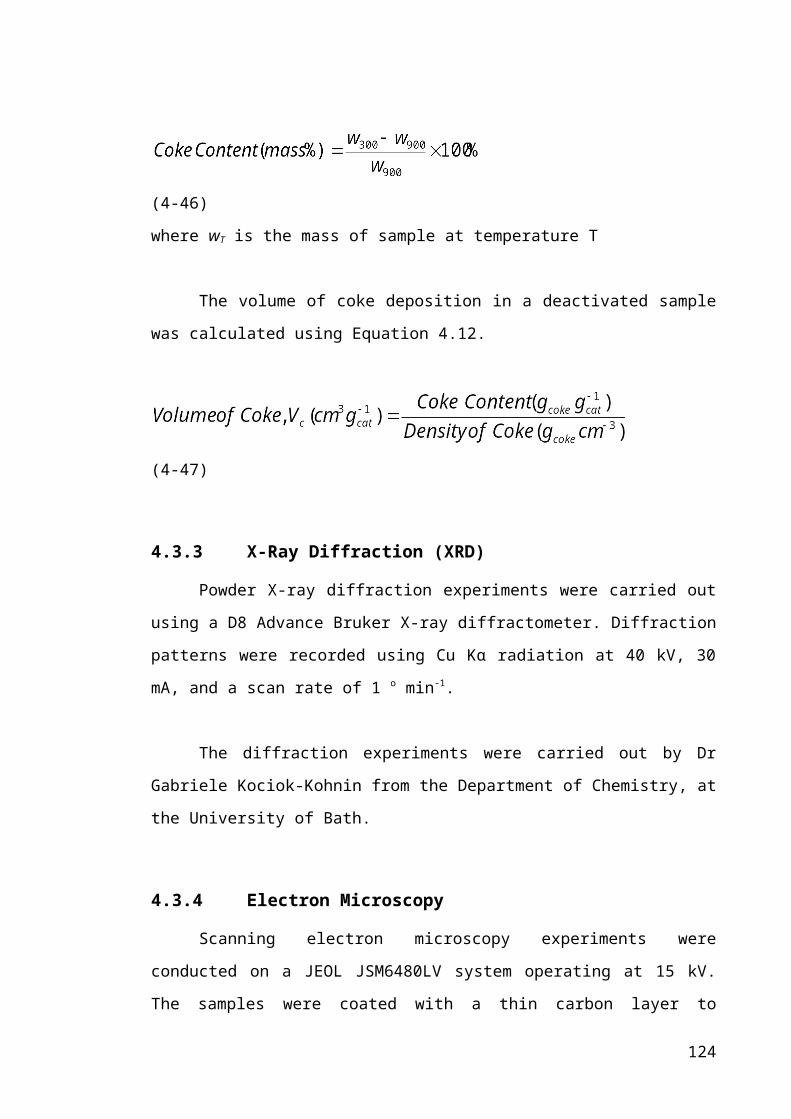
0.0 0.1 0.2 0.3 0.4 0.5 0.6 0.7 0.8 0.9 1.00.0
0.1
0.2
0.3
0.4
0.5
0.6
0.7
0.8
0.9
1.0
pbc
= 0.25psc = 0.3
Acc
essi
bilit
y Fr
actio
n, F
Fraction of Unblocked Pores, f
Figure 5.68 – Accessibility fraction, F as a function of unblocked pores, f for site
(-■-) and bond (-●-) percolation on a simple cubic lattice
The bond percolation program was then modified to investigate site percolation
on a simple cubic lattice. Figure 5.8 compares the accessibility of a molecule in a cubic
lattice for bond and site percolation. The percolation study on a simple cubic lattice has
been extensively studied, and the percolation threshold, fc for the bond percolation was
said to be fbc=0.2492 while the percolation threshold for site percolation was reported to
be fsc=0.3117 [2]. Consistent with published literature, simulations from this work yields
percolation threshold values of fbc=0.25 and fsc=0.3.
5.7.1.2 Determination of the lattice size, L for a ZSM-5 network
Based on the accessibility program written for a cubic lattice, the program was
modified in order to investigate pore blockage effects on a ZSM-5 lattice. No previous
work have developed a bond-site percolation model for the ZSM-5 lattice shown in
Figure 5.5 using a volume weighted probability, hence the accessibility plot for the
ZSM-5 lattice was generated in this study. Two types of occupation positions are
present in the ZSM-5 lattice; one in the intersection and another in the straight/zig-zag
channels.
134
The previous section pointed out the effect of surface clusters on the
accessibility function of a cubic lattice. A large lattice size was used to represent a large
zeolite crystallite to avoid finite size effects on the percolation accessibility function.
Simulations were carried out by varying the network size, L (from 24 to 96). Figure 5.9
shows the effect of network size, L on the percolation transition in a ZSM-5 lattice for
site-bond percolation. As the network size decreases, the percolation transition becomes
more diffuse, consistent with results obtained for a cubic lattice.
It was found that by increasing the lattice size above 484848, the
accessibility function did not then change significantly with lattice size at the
percolation limit. The simulation work in this study was carried out on a 969696
lattice with 13 824 unit cells, giving a total of 165 888 accessible lattice points.
0.0 0.1 0.2 0.3 0.4 0.5 0.6 0.7 0.8 0.9 1.00.0
0.1
0.2
0.3
0.4
0.5
0.6
0.7
0.8
0.9
1.0
pc = 0.64
Acc
essi
bilit
y Fr
actio
n, F
Fraction of Unblocked Pores, f
Figure 5.69 – Effect of network size on the accessibility for ZSM-5 lattice : L=24
(-■-), L =48 (-●-), L =96 (-▲-)
5.7.1.3 Determination of percolation threshold, pc
In terms of pore blockage, the percolation threshold, pc is defined as (1 –
maximum blockage probability) that still allowed accessibility across the lattice.
135

Percolation threshold of different lattices was determined from the accessibility plot
generated by Monte Carlo simulations.
Table 5-11 – Percolation threshold, pc for simple cubic and ZSM-5 lattice
LatticeType of
percolation
Percolation Threshold, pc
Literature Current work
Cubic Lattice Site (fsc) 0.3117 [2] 0.30
Bond (fbc) 0.2492 [2, 17] 0.25
ZSM-5 Site-bond (fsbc) 0.64 [10] 0.64
The percolation thresholds of a cubic lattice and ZSM-5 lattice are listed in
Table 5.3. Results obtained from the current work are consistent with the percolation
threshold values reported for simple cubic [2, 17] and ZSM-5 lattice [10].
5.7.1.4 Comparison of accessibility function from experimental results and
simulated data
The changes in the accessibility of nitrogen and argon molecules determined
from adsorption studies were compared with the accessibility plot simulated assuming
that coke molecules are deposited in both the straight and zig-zag channels, and in the
intersections of the ZSM-5 lattice.
0.0 0.1 0.2 0.3 0.4 0.5 0.6 0.7 0.8 0.9 1.00.0
0.1
0.2
0.3
0.4
0.5
0.6
0.7
0.8
0.9
1.0
Acc
essi
bilit
y Fr
actio
n, F
Fraction of Unblocked Pores, f
136
Figure 5.70 – Accessibility plot – No percolation (Dash line), Accessibility in a
ZSM-5 lattice assuming random deposition of coke (Solid line), nitrogen
adsorption data for PtH-ZSM-5(30) coked samples after 4 h (●), 24 h (▲), and 48 h
(■) TOS
In the case of the PtH-ZSM-5(30) catalysts at different TOS, the experimentally
measured accessibility of the micropore lattice to nitrogen and argon still remained high
even when the value of f corresponding to the percolation threshold, fsbc of the ZSM-5
lattice, assuming randomly distributed deposition of coke, is reached. This indicated that
even with increasing coke deposition, all of the unblocked pores are still in the
percolating cluster of the ZSM-5 network. The results thus showed that the potential
scenario of random deposition of coke in the ZSM-5 crystallites during the alkylation
reaction is incorrect.
0.0 0.1 0.2 0.3 0.4 0.5 0.6 0.7 0.8 0.9 1.00.0
0.1
0.2
0.3
0.4
0.5
0.6
0.7
0.8
0.9
1.0
Acc
essi
bilit
y Fr
actio
n, F
Fraction of Unblocked Pores, f
Figure 5.71 – Accessibility plot – No percolation (Dash line), Accessibility in a
ZSM-5 lattice assuming random deposition of coke (Solid line), argon adsorption
data for PtH-ZSM-5(30) coked samples after 4 h (●), 24 h (▲) and, 48 h (■) TOS
If the coke were blocking access to pores which did not contain coke molecules,
then the difference between the accessibility fraction and the fraction of unplugged
pores (Figure 5.10 and Figure 5.11) would have been significant. In the case of pore
137
mouth plugging, a small amount of coke on the surface of the zeolite crystallite can lead
to a large decrease in the accessibility of the molecules to the center of the catalyst. In
addition, if the percolation threshold (fsbc) of the lattice was reached, the pore network
would lose its connectivity, resulting in the complete loss in accessibility. However, this
was not observed in our results for the PtH-ZSM-5(30) catalysts even when the
percolation threshold for the lattice, assuming a random distribution of coke, was
reached. Figure 5.10 and Figure 5.11 show that the PtH-ZSM-5(30) pore network
remained highly accessible to nitrogen and argon even when the percolation threshold
for random deposition was reached. Two different gases with different potential
interactions with the surface were used. Nitrogen has a permanent quadrupole moment,
while argon is a spherically symmetric (though polarisable) molecule. Since both gases
gave similar results, this suggests that accessibility was not affected by chemistry.
The bond-site percolation threshold (fsbc = 0.64) for the ZSM-5 catalyst was
evaluated from blocking the bonds and sites randomly with coke molecules. Comparing
the theoretical and experimental accessibility plots (Figure 5.10 and Figure 5.11), the
results suggested that the coke molecules were initially formed in the core of the
crystallite, and as the coke content increased, these coke molecules block the channels
and intersections in such a way that the coke was progressively building up from the
middle of the structure, moving outwards towards the crystallite surface, hence
decreasing the diffusion length of the zeolite crystallites. Such mode of pore blocking
would not obstruct the accessibilities of nitrogen and argon molecules, hence the
accessibility fraction remained high.
138

5.7.2 Random walk / Mean square displacement
5.7.2.1 Effect of Lattice Topology
0.0 0.1 0.2 0.3 0.4 0.5 0.6 0.7 0.8 0.9 1.00.0
0.1
0.2
0.3
0.4
0.5
0.6
0.7
0.8
0.9
1.0
Nor
mal
ised
Sel
f-D
iffus
iviti
es
Occupancy,
Figure 5.72 – Self-diffusivities as a function of occupancy for a simple cubic (-■-)
and a ZSM-5 (-●-) lattice
The effect of topology and occupancy on the self-diffusivity was investigated in
this study. A simple cubic lattice with connectivity, Z=6 and a ZSM-5 lattice with
average connectivity, . The connectivity of a
ZSM-5 lattice is much lower than the connectivity of a cubic lattice. Figure 5.12 shows
the relationship between the normalised self-diffusivities, Ds/Do and occupancy, θ for
the two different lattices examined in this study.
Results showed that the normalised diffusivities do not decrease linearly with
fractional occupancy for both, cubic and ZSM-5 lattice. When the number of molecules
in the lattice increases, the molecules hindered each other as one site can only be
occupied by one molecule. As a result, the molecule returned to its original site when
the chosen site was not vacant. The probability of this scenario taking place was greater
at higher occupancies and also at low connectivites as the tendency of the molecule
139
return to its original site was higher. Therefore, the deviation from linearity was more
significant for a ZSM-5 lattice when compared with a cubic lattice (due to lower
connectivity of the ZSM-5 lattice compared with cubic lattice) as demonstrated in
Figure 5.12. These results are consistent with those of Coppens et al. [4], who compared
the effect of connectivity, Z on the self-diffusivity for various lattices.
Previous studies on the diffusion in a ZSM-5 type zeolites were approximated
by a 2-dimensional square lattice (Z=4) or even a 3-dimensional cubic lattice (Z=6),
which have much higher connectivities. The difference between the variation of self-
diffusivity with occupancy for a cubic and ZSM-5 lattice showed in this work (Figure
5.12) implies that the approximated lattice to represent the ZSM-5 catalyst in previous
work may lead to inaccuracies in the results obtained.
5.7.2.2 Effect of Pore Blockage on Self-Diffusivity, Ds
In order to determine the relationship between the self-diffusivity and extent of
pore blocking, pores are blocked at random in the interior of the zeolite crystallite.
Similar to the accessibility study, the straight/zig-zag channels and intersections are
blocked at random. Figure 5.13 shows the normalised self-diffusivity as a function of
fractional occupancy for different fractions of blocked sites.
0.0 0.1 0.2 0.3 0.4 0.5 0.6 0.7 0.8 0.9 1.00.0
0.1
0.2
0.3
0.4
0.5
0.6
0.7
0.8
0.9
1.0
Nor
mal
ised
Sel
f-Diff
usiv
ity
Fractional Occupancy,
140
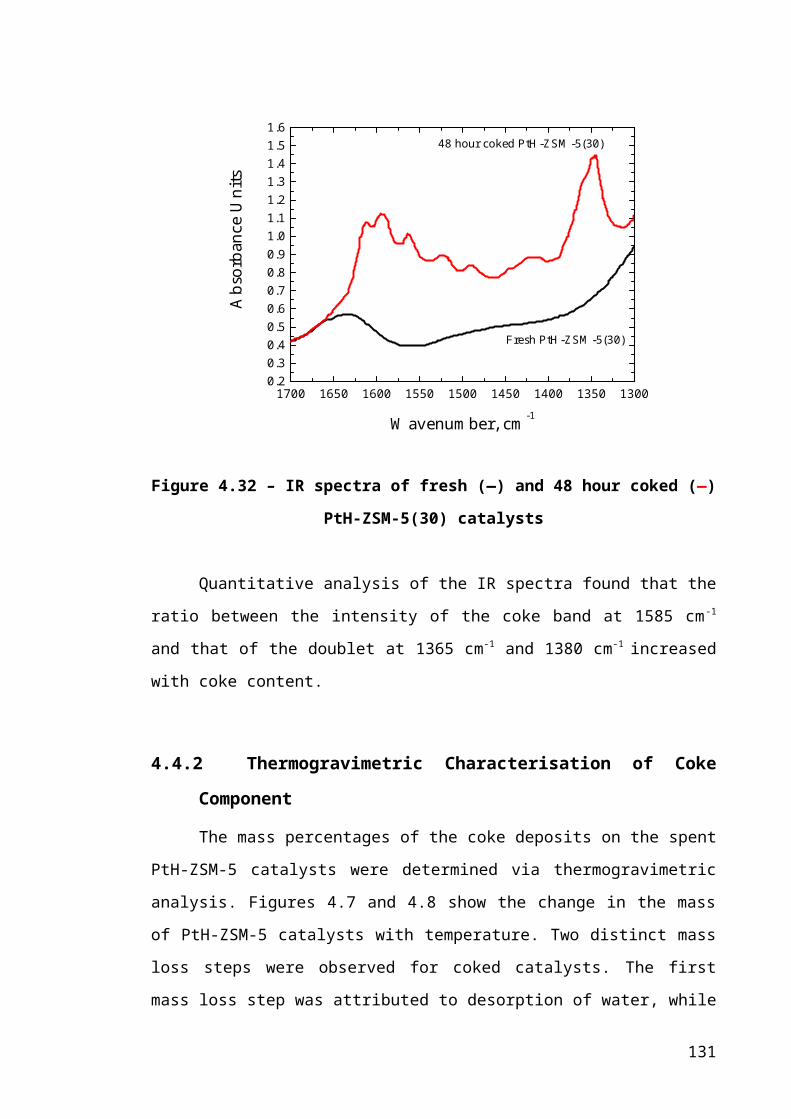
Figure 5.73 – Normalised diffusivity for various fractional occupancies and
different percentages of blocked sites in ZSM-5 lattice model: (-■-) 0% blocked,
(-●-) 10% blocked, (-▲-) 20% blocked, (-♦-) 30% blocked and (-◄-) 36% blocked.
(The lines shown are to guide the eye).
Similar to the findings of Trout et al. [10], simulation results showed that, for the
same occupancy, Ds/Do decreases with increasing fraction of blocked sites. This could
be a direct consequence of lower connectivity of the zeolite channel system when sites
were blocked to represent the deposition of coke molecules.
In the previous section, the percolation threshold in a ZSM-5 lattice where
straight/zig-zag channels and intersections are blocked at random was evaluated to be
fsbc = 0.64. Therefore, the diffusivity of a molecule should reduce to a great extent if
36% of the pores within the zeolite lattice are blocked by coke molecules. The results
(Figure 5.13) from the random walk simulation in a ZSM-5 model showed that, when
coke molecules occupy 36 % of the total lattice space, Ds/Do decreased rapidly, hence
consistent with what would be expected at the percolation limit.
5.8 Conclusion
The structural modifications of PtH-ZSM-5 catalysts during deactivation were
investigated using percolation theory by Monte Carlo simulations. A three-dimensional
lattice with a more realistic representation of the ZSM-5 pore network was used for the
simulations in this study. Percolation analysis of nitrogen and argon adsorption data
obtained in Chapter 4 indicated that the random distribution of coke inside the zeolite
crystallite is incorrect for the catalytic PtH-ZSM-5(30) system. Results for PtH-ZSM-
5(30) catalysts showed that the straight/zig-zag channels and intersections within the
ZSM-5 catalyst remained highly accessible to nitrogen and argon even when the
percolation threshold assuming randomly distributed deposition of coke is reached.
Based on Monte Carlo simulations, it was found that the relationship between
the self-diffusivity with molecular occupancy, θ is non-linear. The non-linearity is more
significant for a lattice with lower connectivity, as demonstrated by the comparison
between a simple cubic lattice and a ZSM-5 lattice. The dependency of self-diffusion on
141
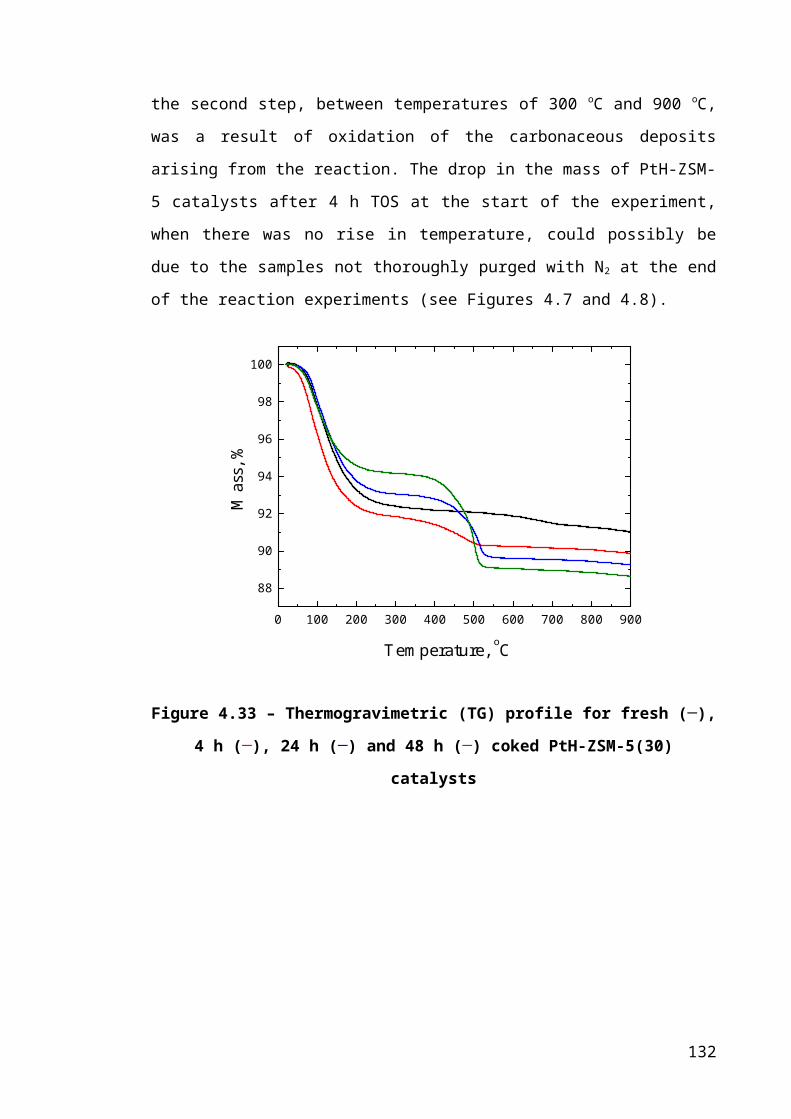
occupancy at different degree of pore blockage was also examined. The intracrytalline
diffusivity decreased with increasing pore blockage, but dropped rapidly when the
percolation limit is reached.
5.9 References
[1] J. Holakovsky, I. Kratochvilova, and M. Korcirik, Microporous and Mesoporous
Materials 91 (2006) 170-171.
[2] D. Stauffer, Introduction to Percolation Theory. Taylor and Francis, London and
Philadelphia, 1985.
[3] A.O.E. Beyne, and G.F. Froment, Chemical Engineering Science 48 (1993) 503-
511.
[4] M.-O. Coppens, A.T. Bell, and A.K. Chakraborty, Chemical Engineering
Science 53 (1998) 2053-2061.
[5] M. Sahimi, and T.T. Tsotsis, Journal of Catalysis 96 (1985) 552-562.
[6] B.M. Vogelaar, R.J. NBerger, B. Bezemer, J. Janssens, A.D. van Langeveld, S.
Eijsbouts, and J.A. Moulijn, Chemical Engineering Science 61 (2006) 7463-
7478.
[7] N.A. Seaton, Chemical Engineering Science 46 (1991) 1895-1909.
[8] A.O.E. Beyne, and G.F. Froment, Chemical Engineering Journal 82 (2001) 281-
290.
[9] A.O.E. Beyne, and G.F. Froment, Chemical Engineering Science 45 (1990)
2089-2096.
[10] B.L. Trout, A.K. Chakraborty, and A.T. Bell, Chemical Engineering Science 52
(1997) 2265-2276.
[11] B. Smit, and T.L.M. Maesen, Chemical Reviews 108 (2008) 4125-4184.
[12] D.M. Ruthven, and M.F.M. Post, in: H. van Bekkum, E.M. Flanigen, P.A.
Jacobs, and J.C. Jansen, (Eds.), Introduction to Zeolite Science and Practise
Elsevier, Amsterdam. 525-578.
[13] B. Frank, K. Dahlke, G. Emig, E. Aust, R. Broucek, and M. Nywlt, Microporous
Materials 1 (1993) 43-56.
[14] D. Theodorou, and J. Wei, Journal of Catalysis 83 (1983) 205-224.
[15] P.H. Nelson, D.M. Bibby, and A.B. Kaiser, Zeolites 11 (1991) 337-344.
142
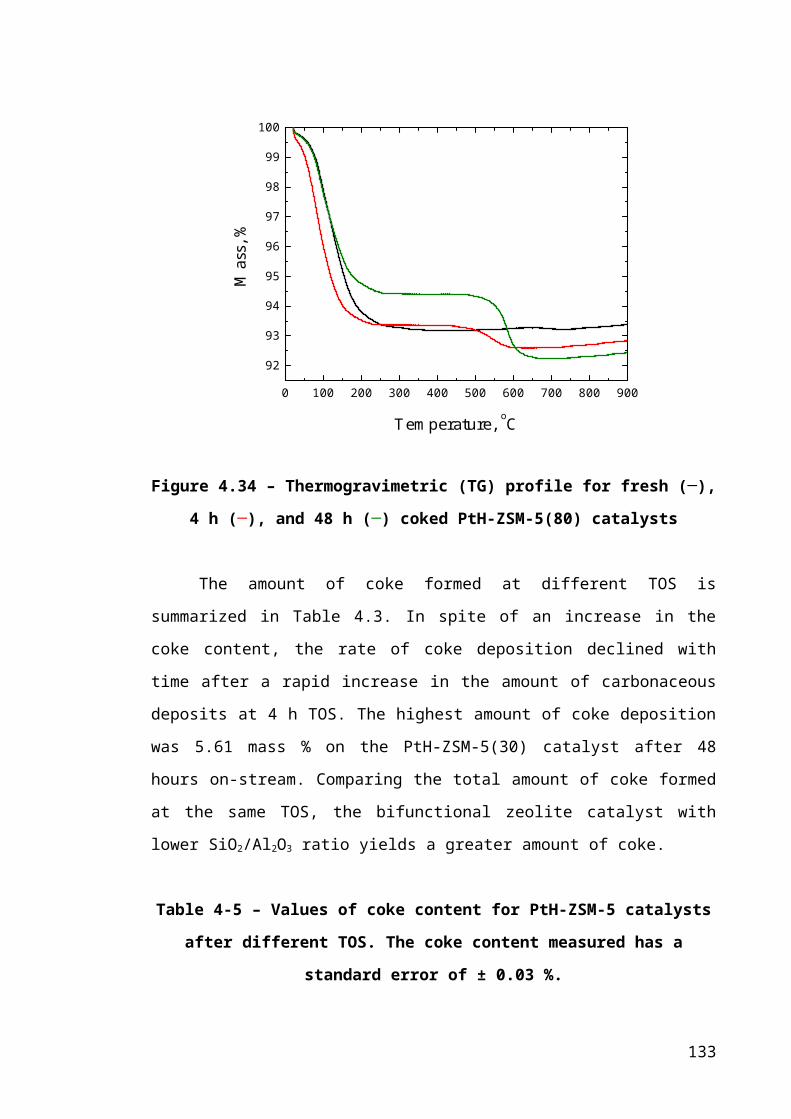
[16] X. Guo, Z. Liu, and B. Zhong, Microporous and Mesoporous Materials 23
(1998) 203-209.
[17] H. Liu, L. Zhang, and N.A. Seaton, Journal of Colloid and Interface Science 156
(1993) 285-293.
[18] R.E. Richards, and L.V.C. Rees, Langmuir 3 (1987) 335-340.
143

Chapter 6 : Ethane Adsorption and Mass Transport Kinetics
6.1 Introduction
Modification of the pore structure of zeolite catalysts by coking usually leads to
transport resistance for reactants and products, as well as hinders accessibility to active
sites, as described in the work of several researchers [1-3]. It is therefore important to
understand the effects of coke on equilibrium and kinetics of adsorption/mass transport
rates in zeolites. Detailed investigations of the evolution of the catalyst pore structure,
and its effects on the thermodynamics and kinetics of adsorption of ethane, a key
reactant molecule during benzene alkylation was studied and will be discussed in this
Chapter.
6.2 Theory
Adsorption kinetics in porous materials can be described by a variety of models
such as Fickian, linear driving force (LDF), and a combined barrier resistance/Fickian
diffusion model [4]. The LDF model was originally proposed by Glueckauf and Coates
[5] for adsorption chromatography. In a later study, Sircar and Hufton [6] showed that
the LDF model gives a good approximation to the Fickian solution for diffusion within
an adsorbent particle.
For the solution of Fick’s second law of diffusion within a sphere, the total
amount of diffusing substance entering the sphere at time t, can be determined using
Equation 6.1 [6]:
(6-60)
where M(t) the mass uptake at time t (mg), M(∞) is the equilibrium mass uptake (mg), a
is the radius of sphere (m), and D is the effective diffusion coefficient (m2 s-1).
For the fraction of uptake M(t)/M(∞) > 0.5, Equation 6.1 can be simplified and
the uptake data fitted to Equation 6.2. The simplified form is called the LDF model.
144

(6-61)
where k is the mass transfer coefficient, MTC (s-1) and M(∞) is the equilibrium uptake
of ethane.
The mass transport coefficient, k is related to the effective diffusivity, D (m2 s-1)
and a (m) is the sphere radius (diffusion length):
(6-62)
Figure 6.1 illustrates the method to obtain the values of M(t) and M(∞) from the
plot of sample mass/pressure versus time.
Figure 6.74 – Schematic diagram of an ideal and real pressure step, and the
corresponding change in the mass of the sample with time
The development of the LDF model is based on assumptions which may lead to
inaccuracy in the calculations of the mass transport coefficient. An ideal pressure step is
assumed for the LDF model (vertical step increase). The real pressure step during the
adsorption experiment is not vertical as expected in the LDF model. A diagram to
illustrate this is shown in Figure 6.1. In addition, the solution to the LDF equation
assumes isothermal behaviour, and this is not always the case since adsorption is an
exothermic process.
Pressure
or
Sample
Weight
Time
Real Pressure Step
Ideal Pressure Step
t’= 0t = tt = 0
M(t)
M(∞)
_
_
145

6.3 Previous Studies
The formation of coke in zeolites usually leads to transport resistance as well as
hinders the access of reactants and/or products to the active sites. Many experiments
have shown the effect of coke deposition on the diffusion rate of a probe molecule [2-3,
7-8]. In addition to reducing the diffusion coefficient (D), coke may change the
diffusional pathway ( ) within the crystallite, depending on the location of coke
deposition during the reaction.
The diffusivity of a probe molecule usually decrease with increasing coke
content when intracrystalline coking dominates. This was demonstrated by Karger et al.
[7] for coking with n-hexane and Paweewan et al. [3] when the authors studied the
mode of coke formation during ethene conversion over USY zeolite. In addition, Chen
et al. [2] and Schuurman et al. [8] reported that, at low coke content, the decrease in the
intracrystalline diffusivity could explain the decrease in the diffusion time constant
. However, when coke is deposited on the surface of the catalyst, the diffusional
time constant, is lowered, as a result of an increase in the diffusion length of a
probe molecule, as illustrated by Figure 4 in the work of Uguina et al. [9]. Similarly,
later studies [2, 8] showed that, when coke deposition in the pores resulted in pore
blockage, the decrease in the diffusion time can be explained by the decrease in
diffusion path length.
These studies showed that, by measuring the influence of coke on the diffusivity
of a probe molecule, it is possible to distinguish between surface and intracrystalline
coking. Therefore, analysis of ethane mass transport in the fresh and coked zeolite
catalysts investigated in Chapter 3 could give information on the mode of coke
formation, and the effect of coke on the pore structure of the zeolite catalysts. The
adsorption of ethane will be discussed in the following sections.
6.4 Experimental Procedure
Ethane adsorption experiments were performed on an Intelligent Gravimetric
Analyser (IGA) supplied by Hiden Ltd U.K.
146
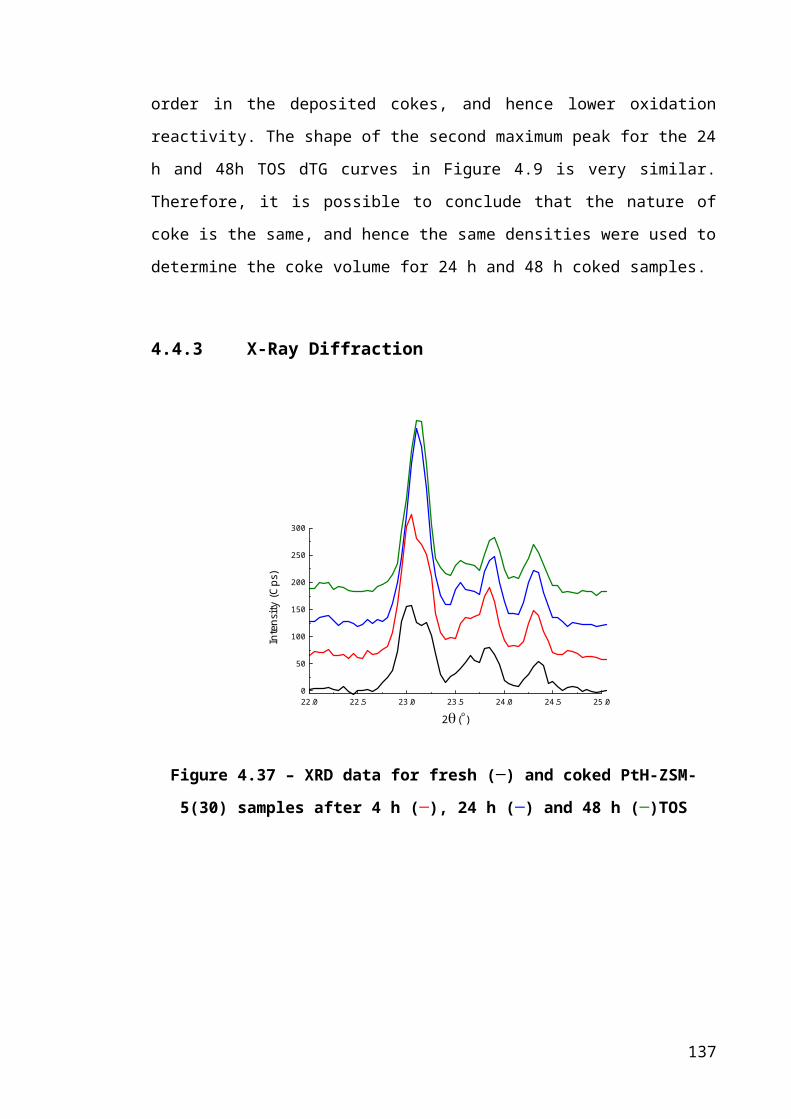
6.4.1 Sample Preparation
Approximately 100 mg of PtH-ZSM-5 catalysts were loaded on a sample pan
and the reactor chamber was then sealed tightly. The system was out gassed until
vacuum was reached. Then, the sample was heated at 250 oC until no further weight loss
was observed. The reactor chamber was then allowed to cool to room temperature.
6.4.2 Adsorption Analysis
A stainless steel cylinder containing ethylene glycol, connected to a water bath
was attached to the reactor to maintain the temperature of the reactor at the desired
temperature for analysis. The isothermal analysis was performed once the temperature
of the reactor had reached the desired temperature.
6.4.3 Calculations
6.4.3.1 Ethane Adsorption Capacity (molecule per unit cell)
The adsorption capacity of ethane was expressed in terms of molecules of ethane
adsorbed per unit cell of the zeolite catalyst and effective chain length of sorbate
molecules per unit cell (nm per unit cell) (Equation 6.4) instead of the mass of ethane
adsorbed per unit mass of the zeolite catalyst as it gives a more helpful understanding of
the adsorption process according to Richard and Rees [10].
(6-63)
The theoretical adsorption capacities were calculated from the channel lengths of
the ZSM-5 zeolite (Table 6.1) and the length of ethane molecule based on the sorption
of one or two ethane molecules adsorbed per intersection.
147
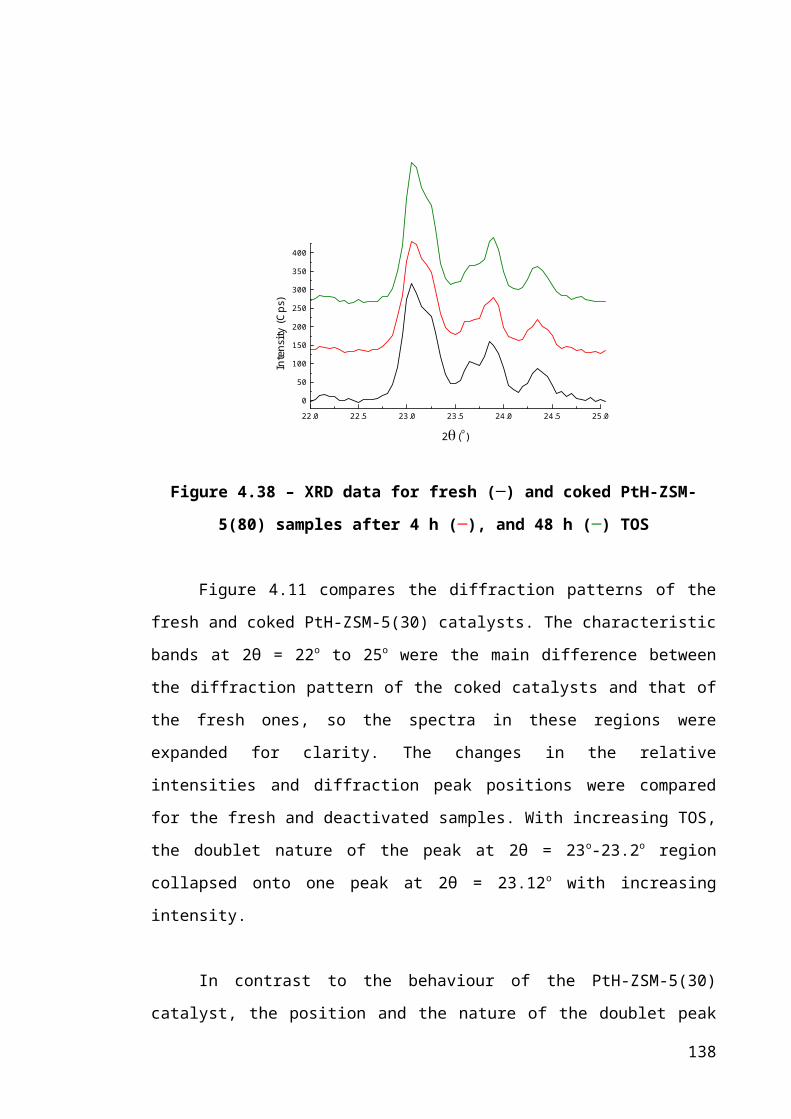
Table 6-12 – ZSM-5/Silicalite-1 Channel Lengths [10]
Channel Type Channel Length (nm per unit cell)a
Sinusoidal channels and intersections only 4.83
Linear channels and intersections only 3.98
Sinusoidal and linear channels and
intersections (1 molecule per intersection)6.65
Sinusoidal and linear channels and
intersections (2 molecules per intersection)8.81
a Unit cell parameters: a=2.007, b=1.992, c=1.342 nm
6.4.3.2 Heat of Adsorption
The differential molar enthalpy of adsorption, also known as the ‘isosteric heat
of adsorption’ (Qst). Qst is positive when adsorption occurs and heat is evolved. [11].
The differential enthalpies of adsorption can be calculated from a series of adsorption
isotherms at different temperatures. The difference between the temperature at which
the adsorption experiments were carried out should be small enough to justify the
assumption that isosteric heat of adsorption, Qst is independent of temperature [11].
Equation 6.5 relates the equilibrium pressure to the differential heat of
adsorption at which a certain amount is adsorbed on the surface of the adsorbent.
(6-64)
and therefore,
(6-65)
where ΔH is the differential molar enthalpy of adsorption (kJ mol-1), R is the gas
constant (J mol-1 K-1), T=temperature (K), [p]= equilibrium pressure (Pa) corresponding
to the amount adsorbed, Γ=constant amount adsorbed (mg mg-1)
148
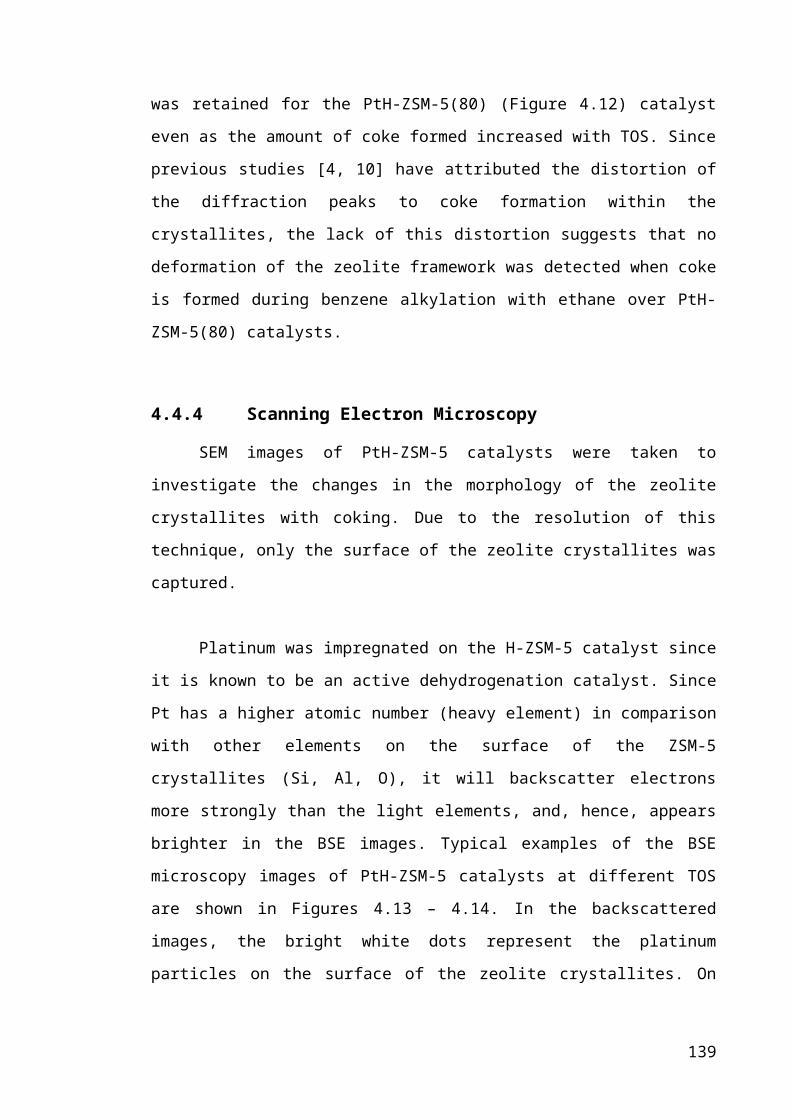
Integration of Equation 6.6 allows the calculation of ΔH from adsorption
isotherm obtained experimentally at two or more temperatures (assuming constant
temperature).
(6-66)
ΔH can be can be calculated by plotting the graph of as a function of
for the same amount adsorbed at all the different temperatures. The calculation for ΔH
(Equation 6.7) is applicable to only a particular amount adsorbed, therefore, the
calculation is repeated for different amount adsorbed in order to obtain the variation of
ΔH with loading.
6.4.3.3 Mass Transfer Coefficient
0 1 2 3 4 5 6 70.00
0.05
0.10
0.15
0.20
0.25
0.30
Spec
ific
Am
ount
Ads
orbe
d(m
g/m
g)
Renormalised Time, t (min)
Figure 6.75 – Mass up take curve (■) for pressure step from P/Po of 0.00172 to
0.00196 from ethane adsorption experiment on PtH-ZSM-5(30) sample after 48
hours on-stream.
The solid line (─) shown is a fit of the LDF model to the experimental data,
R2=0.9766
149
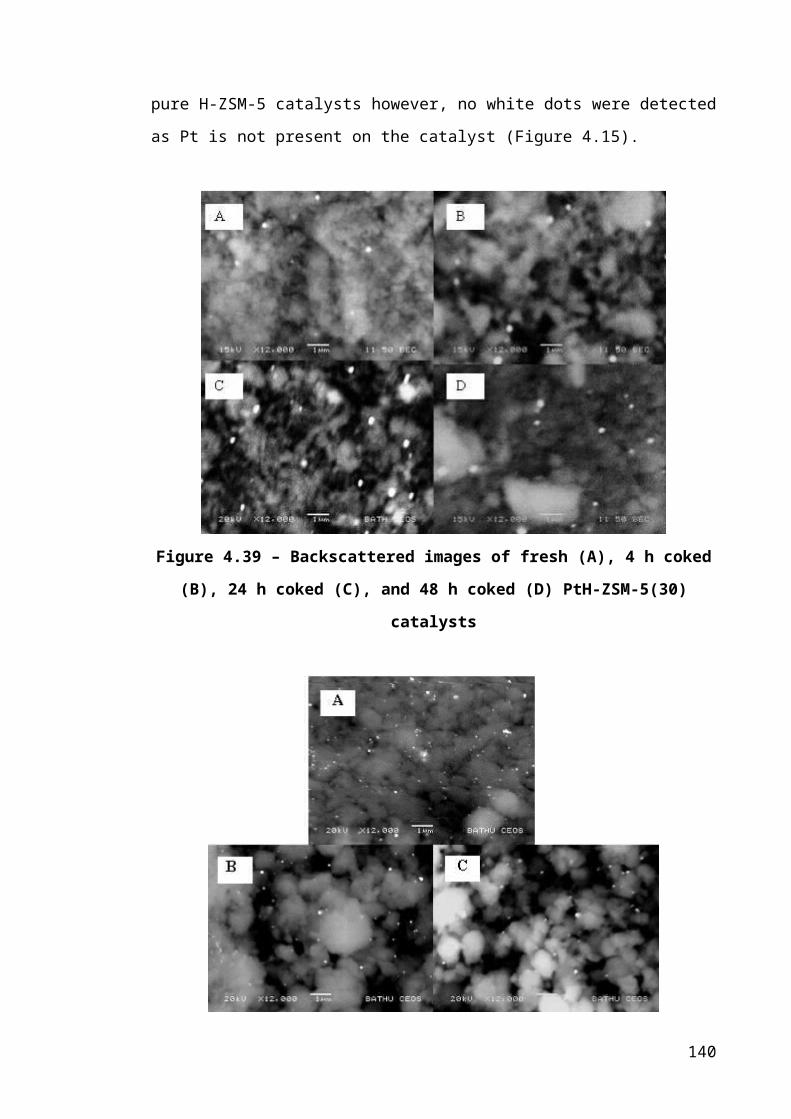
The uptake kinetics of gases on porous solids is usually used to determine the
adsorption rate/mass transport coefficient. The increment in mass uptake was due to the
small pressure steps introduced to the adsorption system. The data from the uptake
curves of each pressure step was fitted to the LDF model (Equation 6.2) to estimate the
values of M(∞) and k.
The data points from the isotherms were checked to ensure that it had reached
equilibrium by checking that the fitted parameter M(∞) from the LDF model agreed
with the mass uptake values in the final plateau of the uptake curves. A diagram to
illustrate the experimental data fit with the LDF model is as shown in Figure 6.2. The
equilibrium uptake, M(∞) calculated from LDF model is compared with the
experimental value. In general, even though the LDF fit only applies for M(t)/M(∞) >
0.5, it still gives a reasonable fit to the lower part of the curve as illustrated in Figure
6.2.
The mass transport coefficient was calculated by using the kinetic data that
corresponds to the beginning of the isotherm. This data obtained at the start of the
isotherm was easier to interpret due to the lesser effects of adsorbate-adsorbate
interaction. When diffusion within the porous solid is accompanied by adsorption, the
usual diffusion equation must be modified for this:
(6-67)
where H = constant of proportionality between the concentrations of the adsorbed phase
and the freely diffusing phase.
6.5 Results and Discussion
6.5.1 Ethane Adsorption Isotherms
The adsorption isotherms of ethane on PtH-ZSM-5 catalysts were measured at
10, 20 and 30 oC. Ethane adsorption isotherms at different adsorption temperatures for
the fresh PtH-ZSM-5(30) catalyst are shown in Figure 6.3. The shape of the isotherms
are of Type I, where a distinct plateau was observed at saturation, indicating that the
pores are in micropore region, i.e. < 2nm. Similar results have been reported previously
150
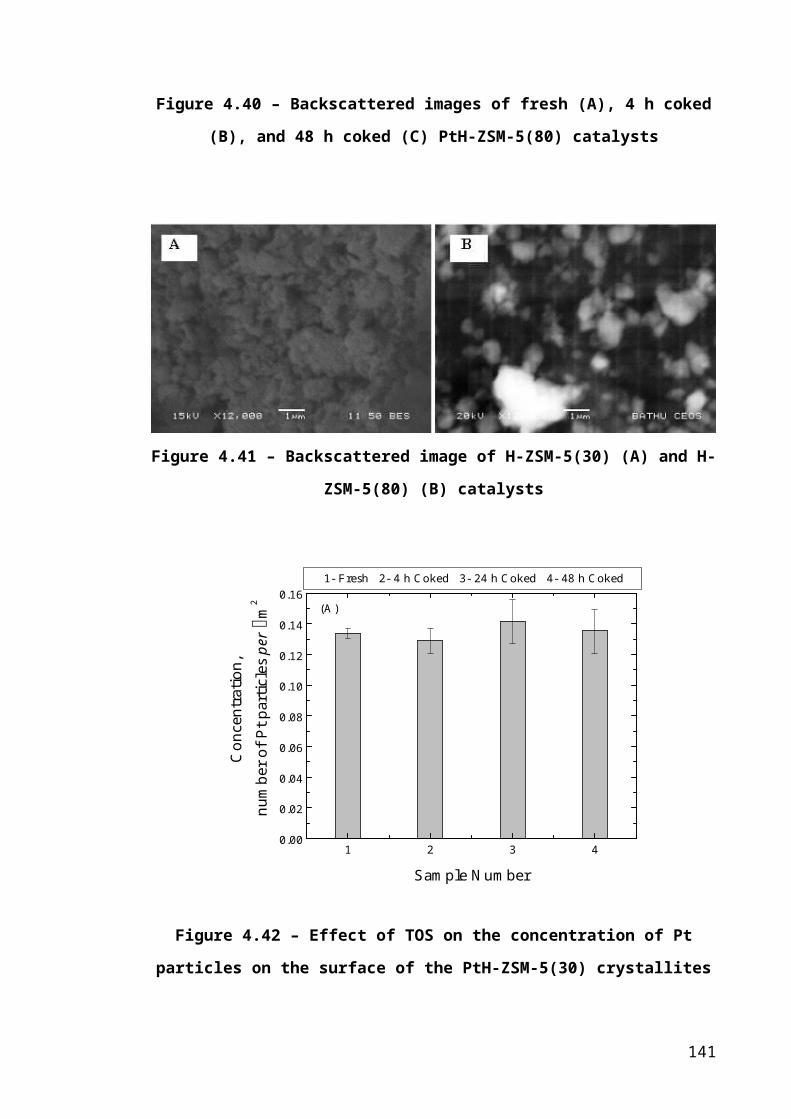
for the sorption of ethane in ZSM-5 sorbent [12-13]. The adsorption capacity of ethane
decreased as the temperature of sorption was increased. As adsorption is an exothermic
process, an increase in temperature shifts the equilibrium towards the region
unfavourable to adsorption because of the combination effects of the bombardment rate
of bulk molecules and increase in vibrational energy of the ethane molecules. Hence,
smaller amount of ethane molecules are adsorbed at equilibrium when the temperature
of adsorption is increased.
0 200 400 600 800 10000
2
4
6
8
10
12
14
Ren
orm
alis
ed A
mou
nt A
dsor
bed,
m
olec
ule
per u
nit c
ell
Pressure, mbar
Figure 6.76 – Ethane adsorption isotherms for fresh PtH-ZSM-5(30) catalyst at
10oC (-■-), 20 oC (-●-) and 30 oC (-▲-)
The experimental adsorption capacity, qexp of ethane on the fresh PtH-ZSM-
5(30) catalyst was compared with the theoretical sorption capacity, qtheo, evaluated by
Richards and Rees [10] (Table 6.2). The effective channel length calculated (Table 6.2)
for ethane in the PtH-ZSM-5(30) sample was comparable with the calculated lengths
evaluated by Richards and Rees [10]. It should be noted that the total sorption capacities
were evaluated at equilibrium pressures Pe which were well below the saturation vapour
pressure, Po of ethane. To further validate the experimental data obtained, the
experimental adsorption capacity of ethane was also compared with experimental data
151
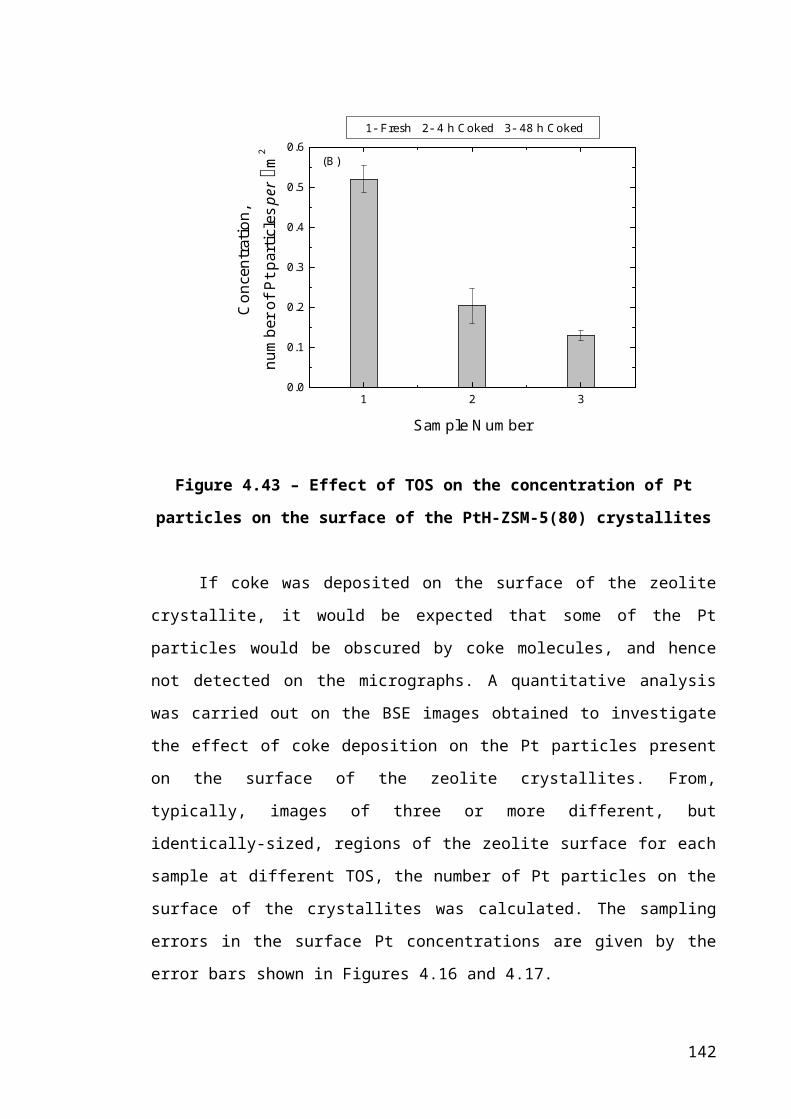
of Sun et al. [14]. It was found that, results obtained in this study were in good
agreement with previous finding of Sun et al. [14].
Table 6-13 – Sorption Capacities for ZSM-5/Silicalite-1
Adsorbate
Adsorbate
Length
(nm)
Theoretical Sorption
Capacity a,
qtheo
(molecules per unit
cell)
Experimental
Sorption
Capacity b, qexp
(molecules per
unit cell)
max Pe/Po
Effective
Channel
Length
(nm per unit
cell)2molec/int 1molec/int
Ethane 0.526 16.7 12.6 12.3 0.0198 5.57 a 6.00 b
a Adapted from reference [10] , b Based on average adsorption capacity of ethane
at 10, 20 and 30 oC
6.5.1.1 Effect of Coke on Adsorption Capacity of Ethane
The effect of coke deposition on the adsorption of the key reactant, ethane was
also studied, and is presented in Figure 6.4 for PtH-ZSM-5 (30) catalysts and Figure 6.5
for PtH-ZSM-5(80) catalysts. The total amount of ethane adsorbed was corrected for the
amount of coke formed, as described for nitrogen and argon adsorption. As with the
nitrogen and argon sorption results, the coke formed during the alkylation reaction
caused a decrease in the adsorption capacity of the bi-functional PtH-ZSM-5 catalysts to
ethane. The reduction in the adsorption capacity for ethane as a result of coke formation
is very similar to that observed for nitrogen and argon (discussed in Chapter 4).
152

0.000 0.005 0.010 0.015 0.020 0.0250
2
4
6
8
10
12
Ren
orm
alis
ed A
mou
nt A
dsor
bed,
mol
ecul
e pe
r uni
t cel
l
Relative Pressure, P/Po
Figure 6.77 – Ethane adsorption isotherms for fresh (-■-), 4 h (-●-), 24 h (-▲-) and
48 h (-▼-) coked PtH-ZSM-5(30) catalysts at 30 oC
0.000 0.005 0.010 0.015 0.0200
2
4
6
8
10
12
Ren
orm
alis
ed A
mou
nt A
dsor
bed,
mol
ecul
e pe
r uni
t cel
l
Relative Pressure, P/Po
Figure 6.78 – Ethane adsorption isotherms for fresh (-■-), 4 h (-●-), and, 48 h (-▼-)
coked PtH-ZSM-5(80) catalysts at 30 oC
153

At saturation, the total amount of ethane adsorbed for the fresh PtH-ZSM-5(30)
sample is 12.3 molecules per unit cell while the adsorption capacity for the uncoked
PtH-ZSM-5(80) catalyst is 12 molecules per unit cell, based on an average obtained
from three different adsorption temperatures. This value corresponds to the theoretical
value of 12.6 molecules per unit cell calculated based on adsorption of 1 molecule in the
intersection at 16 oC [10]. After 48 h on-stream, the coke content increases to 5.6 mass
%, decreasing ethane adsorption capacity in the PtH-ZSM-5(30) sample from 12.3
molecules per unit cell to 8.4 molecules per unit cell. A less significant decrease in
adsorption capacity was observed for the PtH-ZSM-5(80) catalyst after 48 h on-stream.
An increase of 2 mass % of coke content resulted in 12.5 % adsorption capacity loss of
the PtH-ZSM-5(80) catalyst.
The comparison of ethane adsorption capacity in terms of molecules per unit cell
and effective channel length per unit cell for both PtH-ZSM-5 catalysts with TOS is
shown in Table 6.3.
Table 6-14 – Variation of adsorption capacity of PtH-ZSM-5 with TOS
Time on
Stream
(h)
Experimental Adorption
Capacity, qexp
(molecules per unit cell)
Effective Channel Length
(nm per unit cell)
PtH-ZSM-5(30) PtH-ZSM-5(80) PtH-ZSM-5(30) PtH-ZSM-
5(80)0 12.3 12.0 6.49 6.29
4 11.2 10.8 5.86 5.70
24 10.5 - 5.53 -
48 8.4 10.5 4.42 5.49
154
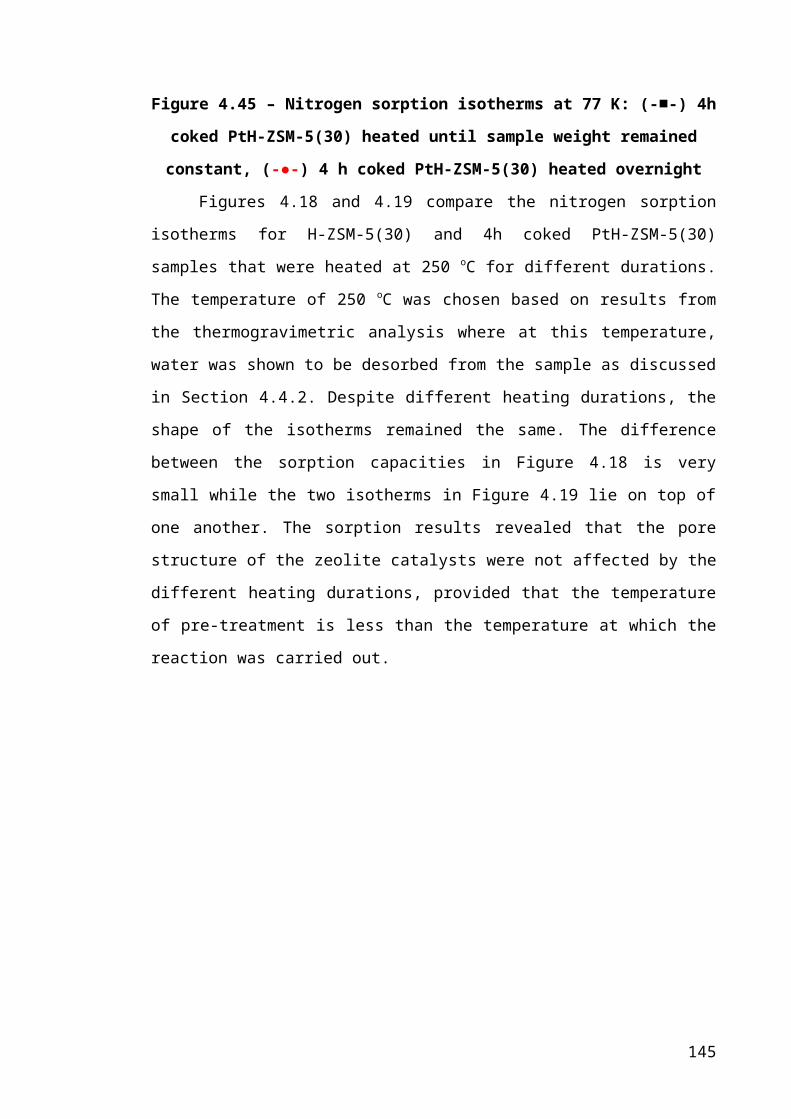
6.5.2 Isosteric Heat of Adsorption, Qst
0 1 2 3 4 5 6 7 8 9 10 11 120
10
20
30
40
50
60
70
Isos
teric
Hea
t of A
dsor
ptio
n, Q
st
(kJ m
ol-1)
Renormalised Amount Adsorbed,molecule per unit cell
Figure 6.79 – Variation of isosteric heat of sorption, Qst for fresh (-■-), 4 h coked
(-●-), 24 h coked (-▲-) and 48 h coked (-▼-) PtH-ZSM-5(30) catalyst
The Qst at different coverage of ethane was determined from the isotherms by
the Clausius-Clapeyron equation as described in Section 6.4.3.2. Qst calculated for
ethane adsorption is the sum of the interaction between zeolite pore walls and ethane
molecules, and also between ethane molecules. In ZSM-5 zeolites, the Qst is believed to
be dominated by sorbate-sorbent interaction because of the highly energetic interaction
between the alkane hydrogen atoms and the oxygen atoms of the channel walls [15].
The sorbate-sorbate interaction is restricted to only end methyl-methyl group
interactions in the narrow pore system [16] as described by Richard and Rees [10] for
the adsorption of n-alkanes in H-ZSM-5.
The variation of Qst of ethane for the fresh and coked PtH-ZSM-5(30) catalysts
is illustrated in Figure 6.6. Qst for the fresh catalyst remained constant at approximately
28 kJ mol-1 for ethane loading up to 8 molecules per unit cell. The constancy of the Qst
for ethane loading up to 8 molecules per unit cell indicated an energetic homogeneous
surface for the adsorption of ethane molecules. Based on previous findings, either
experimentally [10, 17-18] or by simulations [12-13, 19], Qst for ethane molecules on
155

ZSM-5/Silicalite was reported to be in the range of 28-45 kJ mol-1. Therefore, the
reported value coincides with the findings of other studies, verifying the experimental
data obtained.
A more pronounced variation in the initial Qst was observed with increasing coke
content. The initial Qst increased to ~34 kJ mol-1 for the 4 h and 24 h coked catalysts,
and then as TOS is increased to 48 h, the Qst decreased below the Qst for fresh catalyst.
For the 48 h coked sample, Qst increased to a maximum value of 23.5 kJ mol-1 at 50 %
of the maximum uptake of 8 molecules per unit cell. A further increase in the ethane
loading for this sample led to a decrease in the Qst due to the balance between the two
opposing interactions (attractive and repulsive) of the ethane molecules. The presence of
coke modifies the adsorption potential inside the crystallites. This causes a change in the
Qst with TOS for a given amount of adsorbed ethane.
Richards and Rees [10] proposed a packing arrangement for molecules adsorbed
within the ZSM-5 pores, based on the variation of Qst with coverage. The same
approach was applied in this study to predict the possible arrangement of ethane
molecules in the pore structure at equilibrium with the effect of coke being taken into
consideration. As adsorption first took place in the highest energy adsorption sites,
ethane molecules were initially adsorbed in the straight and zig-zag channels. Qst
remained constant initially for the fresh, 4 h and 24 h on-stream catalysts because the
ethane molecules can be positioned in the channel segments without interaction from
other ethane molecules.
Even though the ZSM-5 zeolite has been considered to be an energetically
homogeneous sorbent, the interaction energy for the ethane molecules in the channels
would be different from those at the intersections. As the amount adsorbed was
increased above 8 molecules per unit cell for the fresh sample, ethane molecules must
have adsorbed in sites within the channel intersections that had lower adsorbate-
adsorbent interactions but higher adsorbate-adsorbate interactions. The increasing net
Qst for the adsorption of the molecules in the intersections suggests that the adsorbate-
adsorbate interactions dominate in the channel intersections.
156

Due to the formation of dead-end pores with higher pore potential as a result of
coke deposition, as proven by the shift to smaller pore diameter in the PSD (Figure 4.37
in Chapter 4), Qst for the 4 h and 24 h coked PtH-ZSM-5(30) catalyst rose above the Qst
for the fresh sample. For the 48 h coked catalyst, Qst was found to increase with amount
adsorbed, with a peak/maximum at 4 molecules per unit cell, and then decreased. As the
ethane coverage was increased, the attractive adsorbate-adsorbate interactions led to
increased Qst until the molecular packing becames so tight that repulsive adsorbate-
adsorbate interactions increased significantly causing the Qst to fall.
6.5.3 Mass Transfer Coefficient (MTC)
The term mass transfer coefficient (MTC) has been used by Sircar and Hufton
[6] to characterise mass transfer in an adsorbent particle, and will be used in this study.
The kinetics data obtained from the ethane adsorption experiment were used to
determine the relationship between the MTC and the effect of coking. It can be seen
from Figure 6.2 that the LDF model fits perfectly the upper part of the uptake curve of
the experimental data. Fitting the LDF model to the upper part of the curve is better as it
is further away from potential disturbance caused by the pressure step change which is
not ideal [6]. In addition, at the lower part of the adsorption curve, the heat transfer
effect is more pronounced due to large amounts of ethane adsorbed in the pores of the
catalyst [6]. The large amount of heat released increases the MTC, k [6], thus giving rise
to inaccuracy in the value of k calculated.
In some cases, the LDF model does not fit perfectly to the experimental data.
This is due to the non ideality of the step shape during the pressure step causing the
system to not reach equilibrium. During the adsorption analysis, it is preferably to use
small pressure steps but in order to improve the signal-to-noise ratio in the data, larger
pressure steps are usually used [6]. It is therefore important to check that all the data
points reached equilibrium prior to using them for adsorption rate calculation.
157
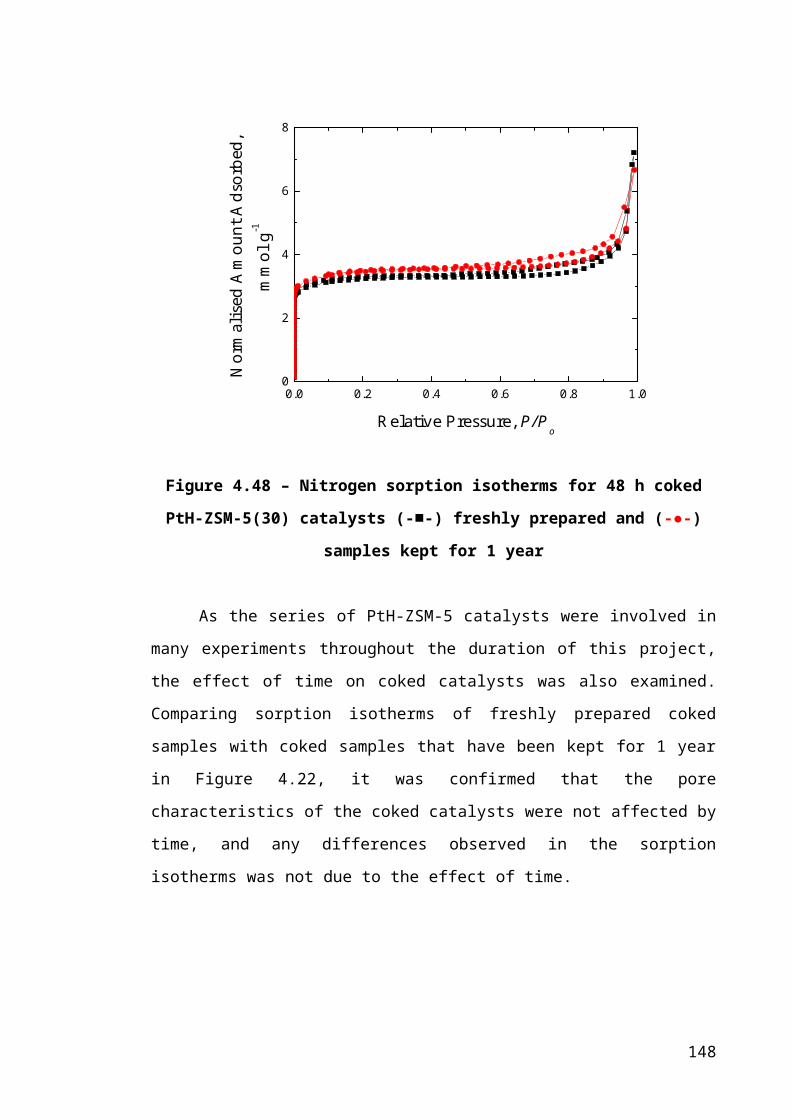
0.000 0.001 0.002 0.003 0.0040
1
2
3
4
5
6
7
Ren
orm
alis
ed A
mou
nt A
dsor
bed,
mol
ec/u
c
Relative Pressure, P/Po
Figure 6.80 – Ethane adsorption isotherm for PtH-ZSM-5(30) catalyst coked for 48
hours at 30 oC.
Also shown are a fit of points for P/Po up to 2E-04 to a linear plot (-□-)
(y = 0.2094+7.870E+3x, R2=0.9660), and a 6th order polynomial fit (-○-)
(y = 7.833E +14x6 + 5.758E+12x5 - 1.518E+11x4 + 9.051E+8x3 - 2.643E=6x2 +
5.008E+3x + 0.60273, R2=0.9998) to points with P/Po above 2E-04
The resistance to diffusion was enhanced as the loading of ethane on the surface
of the catalyst increases. To correct the calculated MTC in order to take into account of
diffusion with adsorption, the slope of the isotherm, H at that particular pressure point
needs to be calculated. The isotherms show that the amount adsorbed increases linearly
with pressure at the beginning of the isotherm, but deviates from linearity as pressure
increases. The initial part of the ethane adsorption isotherms were fitted to a straight
line while the upper part of the curve is fitted to a 6th order polynomial fit. The gradient
of the straight line gives Henry’s constant. For the upper part of the curve, the gradient
of a polynomial fit at a particular pressure point will be used to correct the calculated
mass transport coefficient from Equation 6.2. Example of fit of the straight line and
polynomial curve is shown in Figure 6.7.
158
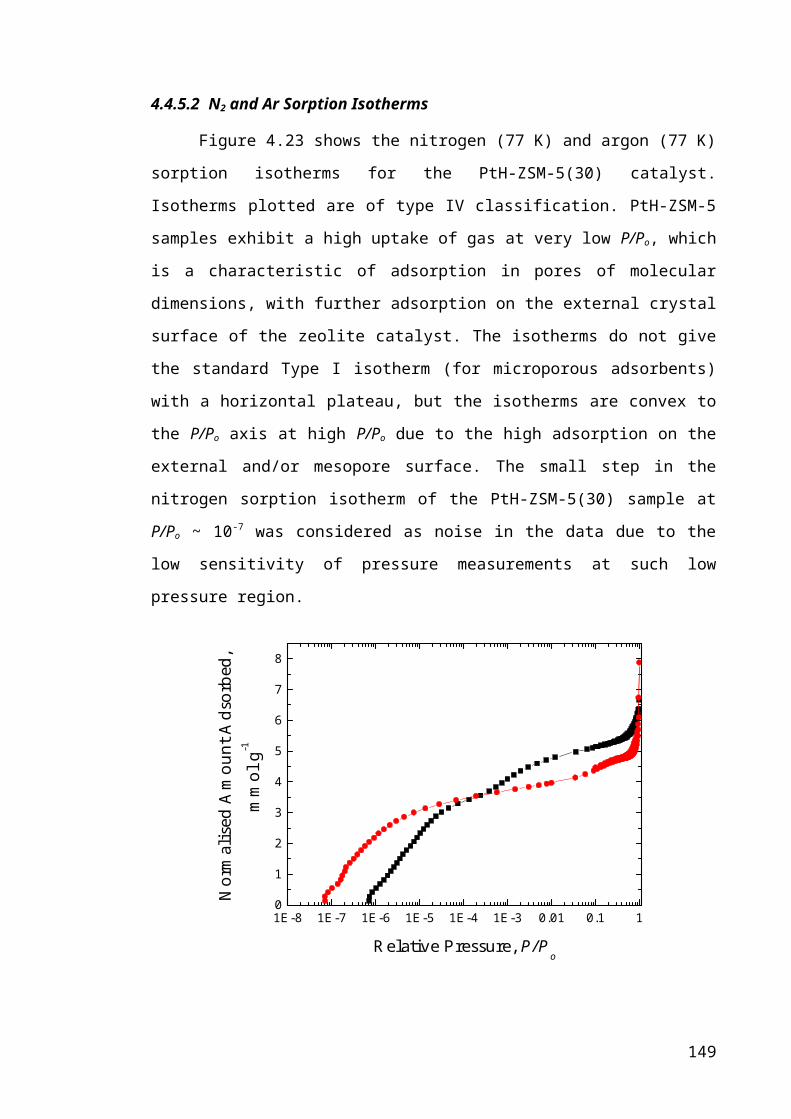
0 10 20 30 40 50
1.0x10⁻³
2.0x10⁻³
3.0x10⁻³
4.0x10⁻³
5.0x10⁻³
6.0x10⁻³
7.0x10⁻³
Mas
s Tra
nsfe
r Coe
ffici
ent,
ks-1
Time on Stream, h
Figure 6.81 – Variation of LDF mass transfer coefficients with TOS for PtH-ZSM-
5(30) (-■-) and PtH-ZSM-5(80) (-●-) at ethane loading of 6 molecules per unit cell
Figure 6.8 shows the change of the MTC with TOS, obtained from fitting the
LDF model. It can be seen that, at a constant amount of ethane adsorbed, an increase in
the MTC was observed with TOS for the PtH-ZSM-5(30) catalyst.
The diffusion of molecules on surfaces can be considered as a series of activated
hops between adsorption sites. If the diffusion is modelled as a random walk [20], then
diffusivity, D is given by:
(6-68)
where λ is the jump distance, τ is the correlation time and kD is the numerical factor
which depends on the dimensionality of the system. If the diffusion of molecules is an
activated process, in which the diffusivity varies with temperature, the diffusivity may
be correlated with an Arrhenius expression of the form of:
(6-69)
where Ao is the pre-exponential factor and ED is the activation energy for diffusion.
159
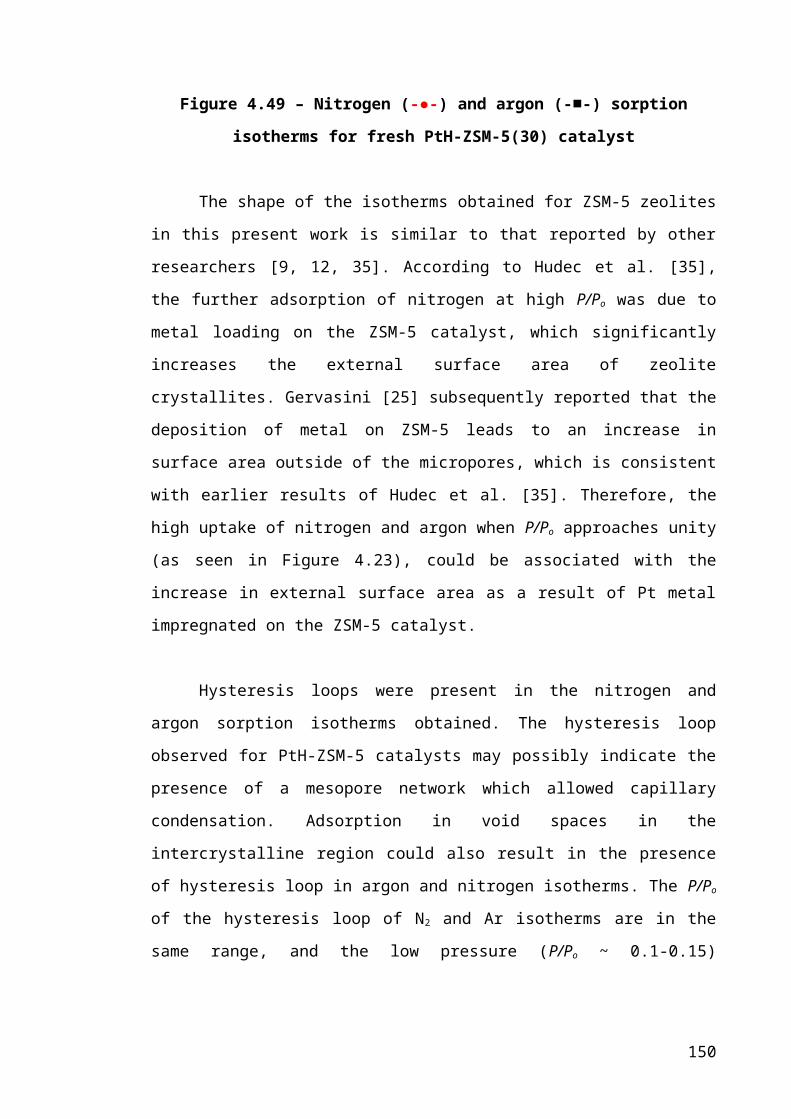
As the activation energy for the correlation time is a monotonically increasing
function of the heat of adsorption, Qst [20], the correlation time of diffusion should
increase from 0-24 h on-stream as the interaction between ethane molecules and the
pore walls is increased. This is supported by the increase in Qst for the coked PtH-MFI-
15 catalysts as described in Section 6.5.2. As a result of site blockage, or increasing
adsorption coverage, the jump length of the molecule is reduced due to intermolecular
collisions. Hence, the contribution of both the jump length and the correlation time
suggest that the diffusivity of the ethane molecules should decrease with TOS.
Since the diffusivity of ethane did not increase with coking, then the observation
of an increase in MTC (k =15D/a2) with coking (Figure 6.8) can only be explained by a
decrease in the length of the diffusion pathway, which is equivalent to an apparent
decrease in crystallite size of the zeolite catalyst. The decrease in the diffusion path
length but lack of impact on diffusivity can be explained by the preferential deposition
of coke towards the centre of the zeolite crystallites, thereby partially blocking the
internal pore structure of the zeolite catalysts [2, 21].
In contrast to the PtH-ZSM-5(30) catalyst, coke deposition up to 2 mass % did
not affect diffusion of ethane in the PtH-ZSM-5(80) catalyst. The MTC for the coked
PtH-ZSM-5(80) catalysts was the same as that in the fresh catalyst. After 48 h on-
stream, the PtH-ZSM-5(30) catalyst yielded a larger MTC as compared to the PtH-
ZSM-5(80) catalyst, at a specific amount of ethane adsorbed. Therefore, the diffusion
pathlength of the PtH-ZSM-5(80) catalyst remained long with TOS when compared to
the PtH-ZSM-5(30) catalyst, as demonstrated by the larger MTC for the PtH-ZSM-
5(30) catalyst.
6.6 Conclusions
The effect of coke formation on mass transport within PtH-ZSM-5 catalysts was
studied by ethane adsorption. The results have shown that coke formation decreased the
adsorption capacity for ethane in PtH-ZSM-5 catalysts. The variation of Qst of ethane
with loading suggested the possible arrangement of ethane molecules in the pore
network of the zeolite catalysts.
160
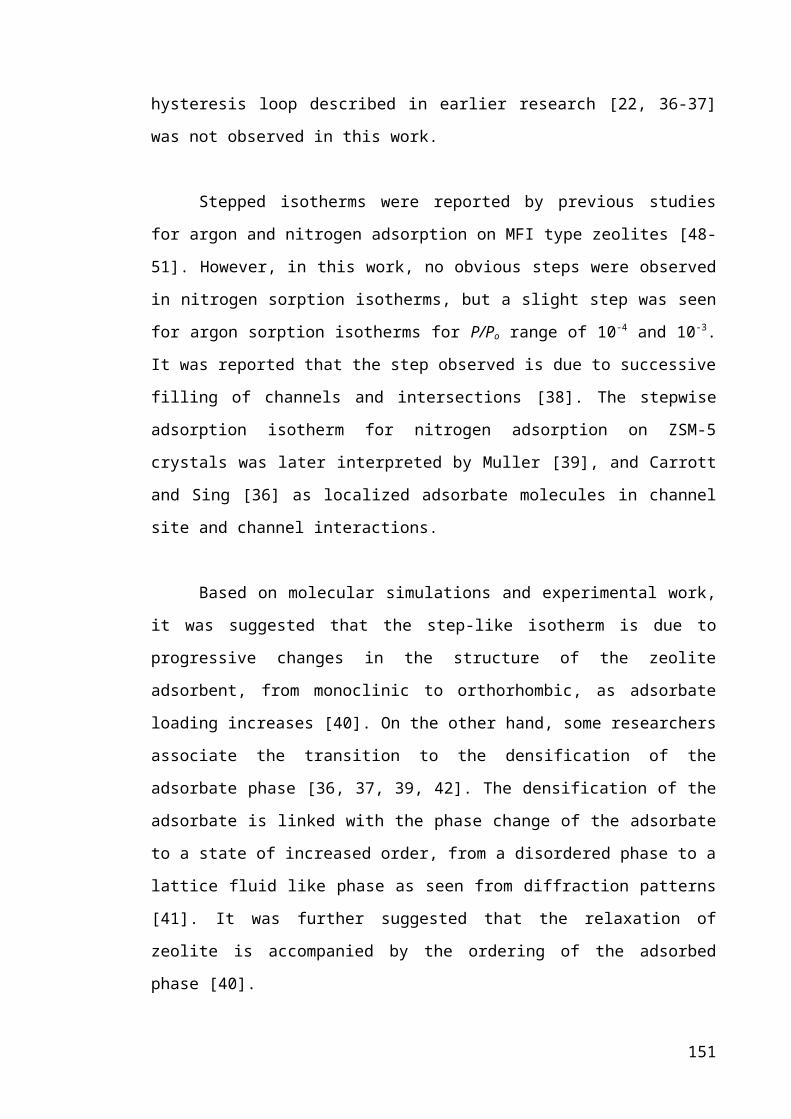
It was observed that, the mass transfer coefficients for ethane, corrected for the
slope of the equilibrium isotherm, showed an increase with TOS, at constant amount
adsorbed for the PtH-ZSM-5(30) catalysts. This result probably indicates a decrease in
diffusion length, rather than an increase in diffusivity. The reduction in the length of
diffusional pathway suggested that coke deposition preferentially starts to occur in the
center of the pores within the PtH-ZSM-5(30) crystallites.
6.7 References
[1] W.T. Mo, and J. Wei, Chemical Engineering Science 41 (1986) 703-710.
[2] D. Chen, H.P. Rebo, K. Moljord, and A. Holmen, Chemical Engineering
Science 51 (1996) 2687-2692.
[3] B. Paweewan, P.J. Barrie, and L.F. Gladden, Applied Catalysis A: General 167
(1998) 353-362.
[4] C.R. Reid, and K.M. Thomas, Langmuir 15 (1999) 3206-3218.
[5] E. Glueckauf, and J.I. Coates, Journal of Chemical Society (1947) 1315-1321.
[6] M.J. Watt-Smith, S.T. Kolaczkowski, S.P. Rigby, and J.A. Chudek, AIChE
Journal 52 (2006) 3278-3289.
[7] J. Karger, H. Pfeifer, J. Caro, M. Bulow, H. Schlodder, R. Mostowicz, and J.
Volter, Applied Catalysis 29 (1987) 21-30.
[8] Y. Schuurman, C. Delattre, I. Pitault, J.P. Reymond, and M. Forissier, Chemical
Engineering Science 60 (2005) 1007-1017.
[9] M.A. Uguina, D.P. Serrano, R. Van Grieken, and S. Venes, Applied Catalysis A:
General 99 (1993) 97-113.
[10] R.E. Richards, and L.V.C. Rees, Langmuir 3 (1987) 335-340.
[11] S.J. Gregg, and K.S.W. Sing, Adsorption, Surface Area and Porosity. London :
Academic Press, 1982.
[12] Z. Du, G. Manos, T.J.H. Vlugt, and B. Smit, AIChE Journal 44 (1998) 1756-
1764.
[13] W. Zhu, F. Kapteijn, and J.A. Moulijn, Physical Chemistry Chemical Physics 2
(2000) 1989-1995.
[14] M.S. Sun, D.B. Shah, H.H. Zu, and O. Talu, 102 (1998) 1466-1473.
[15] D.H. Olson, G.T. Kokotailo, S.L. Lawton, and W.M. Meier, Journal of Physical
Chemistry 85 (1981) 2238-2243.
161
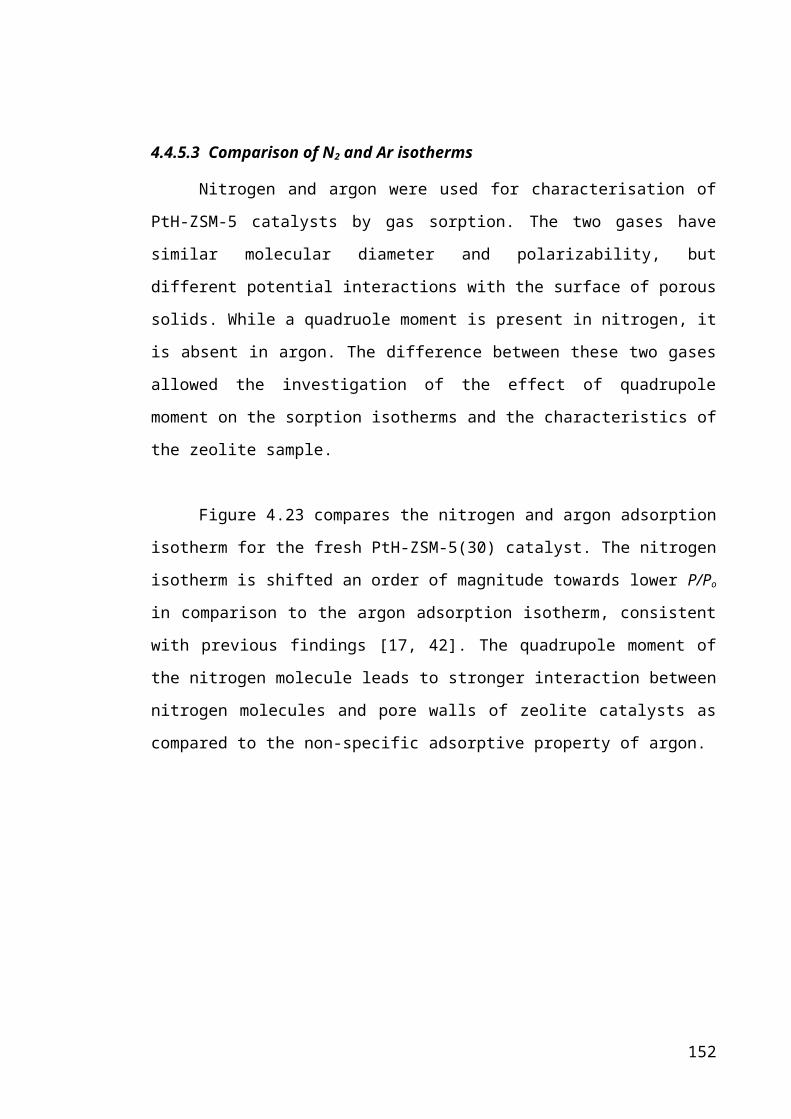
[16] H. Thamm, H. Stach, and W. Fiebig, Zeolites 3 (1983).
[17] V.R. Choudhary, and S. Mayadevi, Zeolites 17 (1996) 501-507.
[18] H. Thamm, Zeolites 7 (1987).
[19] M.D. Macedonia, and E.J. Maginn, Fluid Phase Equilibria 158-160 (1999) 19-
27.
[20] E.R. Gilliland, R.F. Baddour, G.P. Perkinson, and K.J. Sladek, Industrial &
Engineering Chemistry Research 13 (1974) 95-100.
[21] J.L. Sotelo, M.A. Uguina, J.L. Valverde, and D.P. Serrano, Applied Catalysis A:
General 114 (1994) 273-285.
162
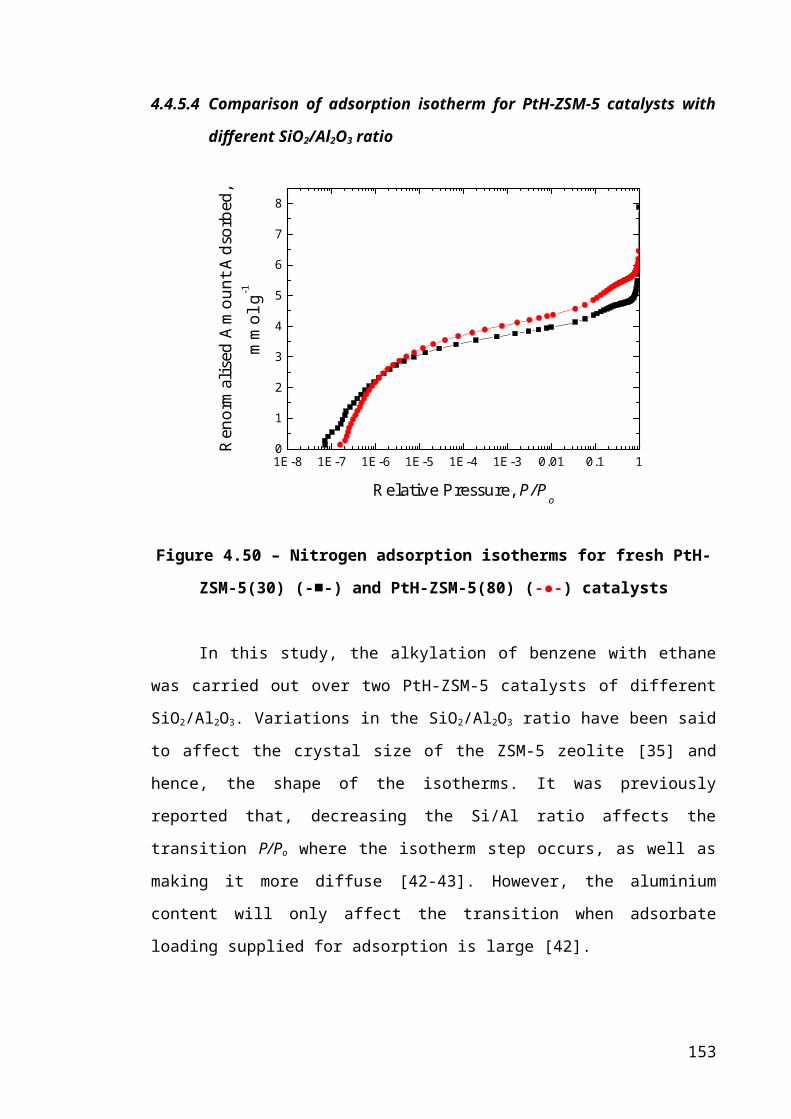
Chapter 7 : Investigation of the Cause of Coke Location
during Benzene Alkylation with Ethane
7.1 IntroductionResults described above from different characterisation techniques, combined
with Monte Carlo simulation, have indicated intra- or intercrystalline coke depositions,
during benzene alkylation with ethane over PtH-ZSM-5 catalysts with SiO2/Al2O3 ratios
of 30 and 80, respectively. Intracrystalline coke deposition was seen for the PtH-ZSM-
5(30) catalyst while coke was found on the surface of the PtH-ZSM-5(80) crystallites. It
is therefore the aim of this chapter to find the possible explanation for the different
locations of coke observed.
The Pt distribution differs for the two PtH-ZSM-5 catalysts, as seen from BSE
images in Chapter 4 (Figures 4.13 and 4.14). A higher concentration of Pt was found on
the surface of the PtH-ZSM-5(80) crystallites when compared with the PtH-ZSM-5(30)
sample. Since Pt metal act as active sites for reactions to take place, the difference in the
Pt location could possibly affect the location of coke formation. The effect of Pt
incorporation on the pore structure of the H-ZSM-5 catalysts will be shown using
nitrogen sorption results, while mass transport effects will be studied using pulsed field
gradient (PFG) NMR technique. In order to access the effect of microporosity in a
zeolite catalyst, self-diffusion and tortuosity of probe molecules imbibed in a pure
mesoporous silica pellet will also be investigated in this Chapter.
7.2 TheoryIn order to recognize the potential of gas sorption for pore structure
characterisation and pulsed field gradient (PFG) NMR for transport phenomena
investigation in porous solids, it is important to understand the basic principles of these
techniques. Since the theory of gas sorption has already been discussed in Chapter 4,
only the NMR theory will be described in this section.
163

7.2.1 Nuclear Magnetic Resonance (NMR) Theory
Nuclear magnetic resonance (NMR) has been widely applied for molecular
structure characterisation in different fields such as physics, biology and medical
science. However, the application of nuclear magnetic resonance (NMR) technique for
diffusion studies has become one of its main applications following the first report by
Tanner and Stejskal [1] who used PGSE NMR to measure diffusion in aqueous
solutions. NMR spectroscopy is based on the resonant absorption of radiofrequency
(RF) radiation by nuclei exposed to a magnetic field [2]. Molecules usually contain
nuclei which may be characterised by a nuclear spin quantum number, I, which may
take values greater than or equal to zero, and are multiples of ½. If I =0, then the
nucleus possesses no nuclear spin, and hence cannot exhibit nuclear magnetic
resonance. However, when I > 0, the nuclei possess a magnetic moment with a constant
magnitude and an orientation. In the presence of a magnetic field, Bo, the magnetic
moments align themselves relative to the field in a number of orientations (2I+1)
because the energy states involved are quantised.
Figure 7.82 – A spinning nucleus with a magnetic moment, μ (left) and a
Cartersian coordinate frame with the motion of nucleus represented as a vector
moving on the surface of a cone (right) (Adapted from ref [3])
As a result of the static magnetic field, a torque is imposed on the magnetic
moment, hence resulting in the moment tracing a circular path about the applied field
(Figure 7.1). The motion of the magnetic moment is termed the Larmor precession, and
the rate of precession is proportional to the applied magnetic field. The frequency of the
Larmor precession, ν is given by:
164

(7-70)
where γ is the magnetogyric ratio, and Bo is the applied magnetic field.
In this study, we only consider hydrogen nuclei, which have a spin quantum
number I = ½. These spins may adopt two different orientations with respect to the
static field, a parallel (the α-state), + ½ (↑) or antiparallel (the β-state), – ½ (↓). When no
magnetic field is present, the spins have the same energy level. However, when an
external magnetic field is applied, the spins move from a lower energy level to a higher
energy level, changing the population of the two spin states, hence resulting in a net
magnetization, Mo along the z-axis. [2] Since there is nothing to define a preferred
orientation for the spins in the transverse direction, there is no net magnetization in the
transverse (x-y) plane. By application of a 90o radiofrequency pulse of frequency γβ1/2π,
the magnetization precesses into the xy-plane. Therefore, applying the radiofrequency
field along the x-axis will drive the vector to the y-axis, and the magnetization vector is
now rotating in the xy-plane at the Larmor frequency. Electrical signals produced by the
rotating magnetization vector give rise to the NMR signal. As time passes, the
transverse magnetization vector shrinks, while simultaneously growing along the z-axis.
This process of returning to the equilibrium state is known as relaxation, and causes the
NMR signal to decay with time, producing the observed Free Induction Decay (FID).
The disappearance of the transverse magnetization is known as the spin-spin relaxation,
while the recovery of the magnetization in the z-axis is termed as longitudinal spin-spin
relaxation.
Figure 7.83 – NMR spin echo pulse sequence [4]
165
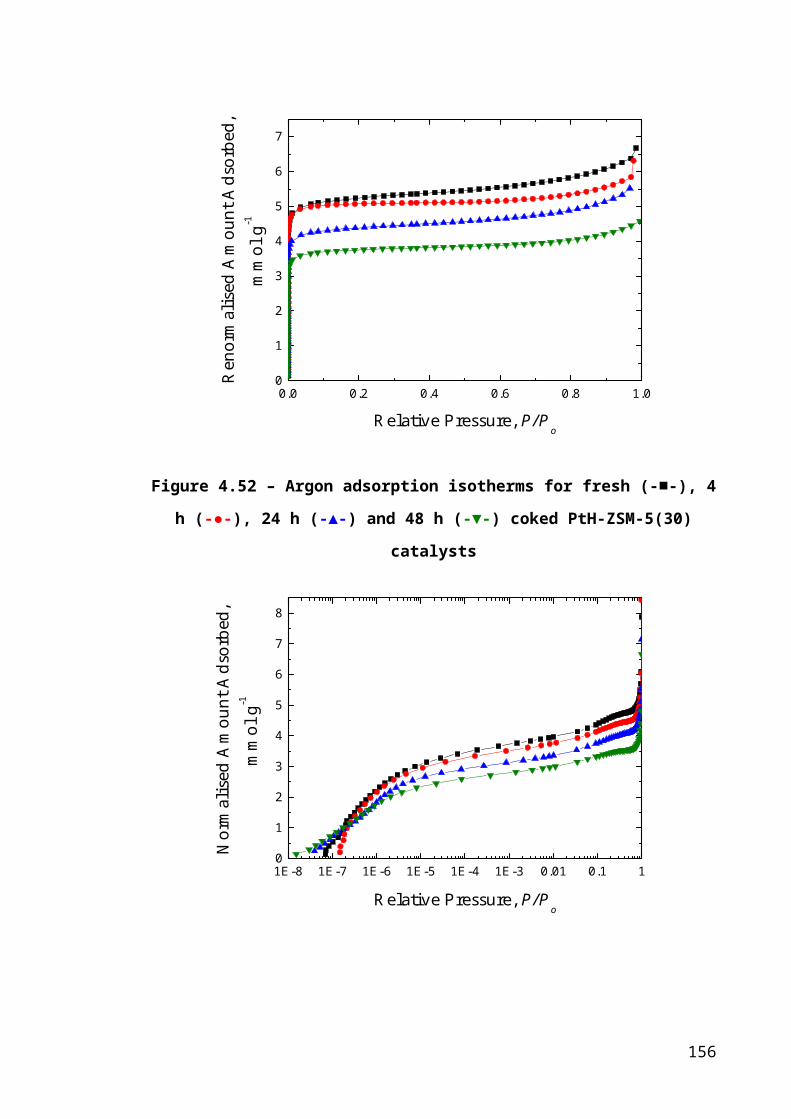
Figure 7.84 – Vector model representation of the spin echo pulse sequence [2]
During an NMR experiment, a set of radiofrequency pulses (pulse sequence) is
usually applied to produce a specific form of NMR signal. The spin echo pulse
sequence is illustrated in Figures 7.2 and 7.3. During a spin echo pulse sequence, a 90o
pulse is applied along the x-axis, creating transverse magnetization along the y-axis.
The nuclear spins begin to fan out because they have different Larmor frequencies,
since some of the spins precess at a higher rate compared to the others. After a time
period of td, a 180o pulse (along the y-axis) is applied to the sample. This 180o pulse
rotates the magnetization vectors of the fast and slow spins. Therefore, the fast spins are
now behind the slow spins, and the fan begins to close up again. Thus, the 180o pulse
causes the magnetization to rephase, and the resultant signal is called an echo.
166
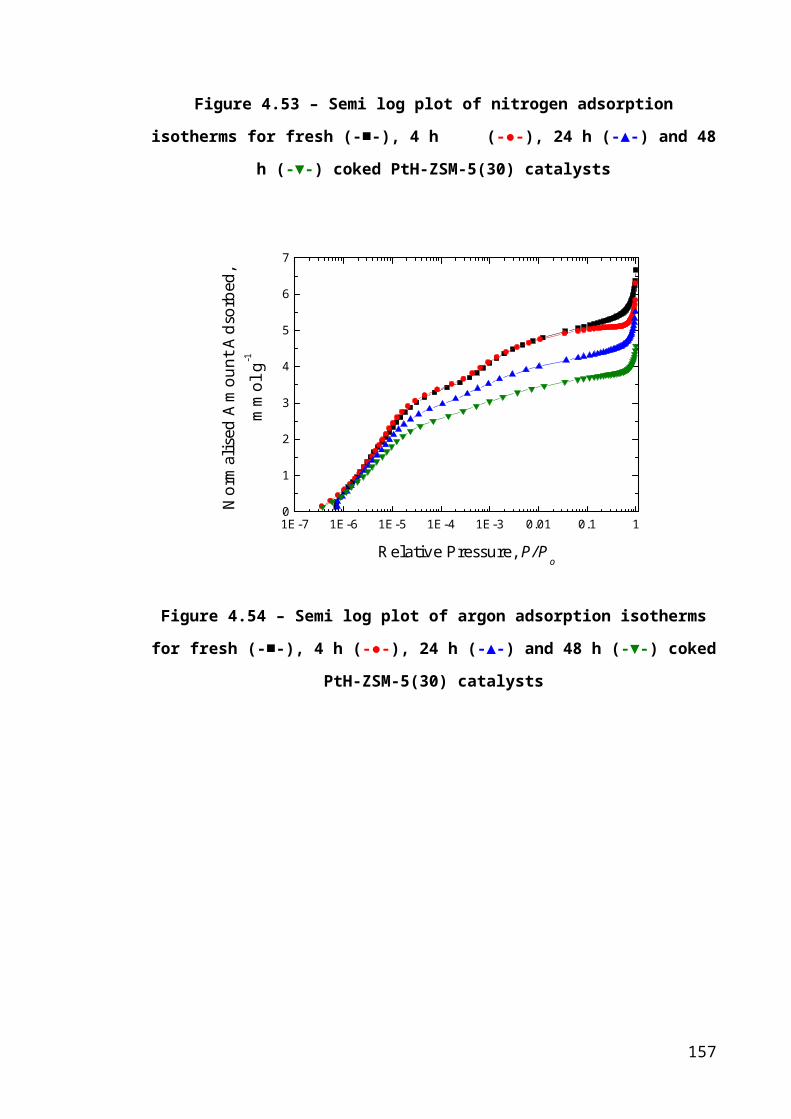
7.2.1.1 Pulsed Field Gradient (PFG) NMR Experiment
Figure 7.85 – NMR pulse sequence – pulsed gradient spin echo sequence where
pulsed field gradient, g is applied (Adapted from ref [4])
The pulsed-field gradient (PFG) spin echo is the most commonly used scheme
for the characterisation of diffusion in porous materials. The PFG spin echo sequence is
based on the spin echo sequence described earlier, with two gradient pulses of identical
magnitude, g and width, δ. The two pulsed gradients are applied after the 90o and 180o
pulses, with a separation time between pulses of ∆ (Figure 7.4). When pulsed gradients
are employed, the complete refocusing of the signal will only occur when the local field
experienced by a spin is identical during the two gradient pulses. If molecules diffuse
away from its initial position during the observation time, ∆, then the local field
experienced during the second PFG would not exactly match that of the first, and only
partial refocusing of the signal would occur [3]. Therefore, attenuation of the detected
signal would be observed, depending on how far the molecules have moved during the
time ∆, and by its diffusion coefficient. However, if the particles have not moved in
between the two pulses, the effect of both pulses is cancelled out.
The echo intensity obtained from the experiment varies with the diffusion time,
∆, length of the gradient pulse, δ, and the strength of the gradient pulses, g. It is usually
assumed that the displacements during the time interval, δ are negligibly small in
comparison with those during the diffusion time, ∆. The signal intensity, I for the PFG
spin echo experiment is given by:
167
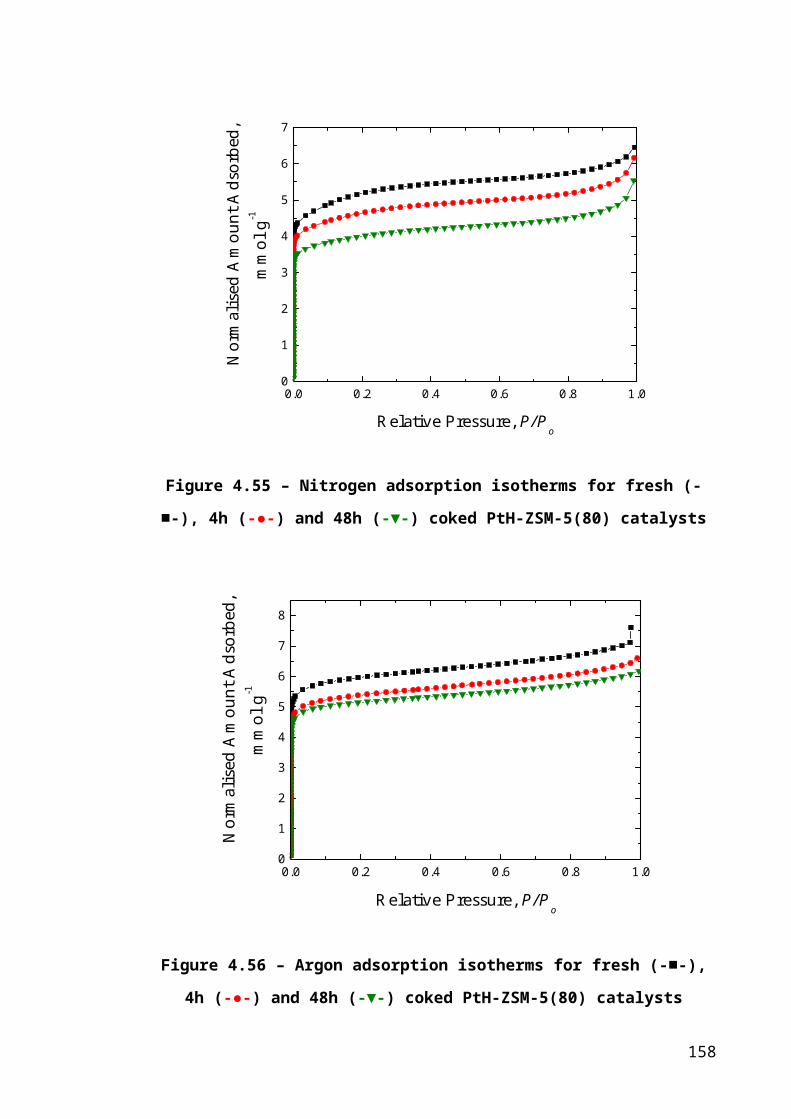
(7-71)
where I is the observed echo intensity, I0 is the echo intensity in the absence of
gradient pulses, DPFG is the self-diffusion coefficient, γ is the gyromagnetic ratio of 1H, g
is the applied gradient, δ is the gradient pulse duration, ∆ is the diffusion time, and τ is
the correction time for the phasing and dephasing between bipolar gradients. The plot of
ln (I/I0) vs yields the diffusion coefficient from the slope of the
linear plot obtained.
The diffusion coefficient calculated from the PFG NMR experiment, DPFG,
contains a contribution from the spin density which is related to the voidage [4], and is
related to the effective diffusion coefficient :
(7-72)
where Deff is the effective diffusion coefficient, and ε is the voidage of the
material. For diffusion of a liquid in a porous solid, the effective diffusion coefficient is
related to the molecular self-diffusion of bulk liquid, D, tortuosity, τp and voidage, ε:
(7-73)
Tortuosity of the pore network is a measure of the deviation from the linear path
that a diffusing molecule may experience. It describes the geometry of the flow paths
and defines the complexity of the porous medium. Therefore, the greater the tortuosity
measured, the smaller is the displacement of the spins during the diffusion time [4].
From Equation 7.3 and 7.4, the tortuosity of the catalyst can be determined by Equation
7.5.
(7-74)
where D is the molecular self-diffusion coefficient of the bulk liquid and DPFG is
the self-diffusivity.
168

During the diffusion time, ∆, the molecules diffuse from its initial position, and
its displacement from this initial position can be determined by the diffusion coefficient,
DPFG, measured from the NMR experiment. The distance travelled by the molecules
gives indication of the effect of the pore structure on the molecular diffusion within the
porous material. The relationship between the molecular mean squared displacement
and the self-diffusion coefficient is given by the Einstein equation:
(7-75)
where DPFG is the self-diffusivity, and is the mean squared displacement
In this study, two different cyclic hydrocarbon molecules were used to study the
transport properties of the two PtH-ZSM-5 zeolite catalysts. Cyclo-hexane (C6H12) and
cyclo-octane (C8H16) were chosen as probe molecules because C6H12 molecules can
adsorb within the crystallites of the ZSM-5 catalyst [5] while C8H16 molecules was
reported to be too large to enter the micropore channels of the ZSM-5 zeolites [5-6].
The two probe molecules have similar shape to benzene, the main reactant used in the
reaction studied in Chapter 3. Therefore, results gained from the PFG studies of these
molecules could give an indication of the transport resistance for benzene during the
alkylation reaction. In addition, C6H12 has been increasingly used as a substitute for
benzene due to the high toxicity level of benzene [7]. In the next section, the
experimental set-up and procedure will be described, followed by the discussion of
results obtained in this study.
7.3 Experimental Procedure
7.3.1 Nitrogen Sorption
Nitrogen sorption experiments were carried out using a Micromeritics ASAP
2020 volumetric apparatus at 77 K. The experimental procedure for the gas sorption
experiment was discussed in detailed in Chapter 4 Section 4.3.5.
169
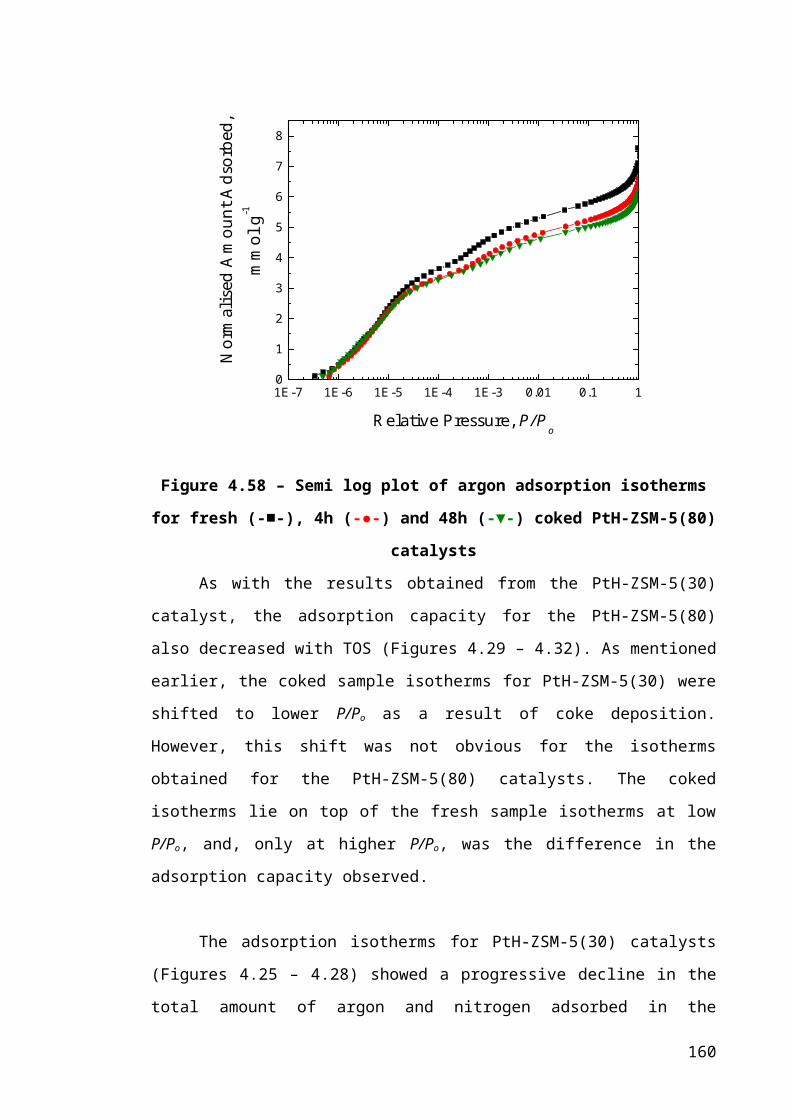
7.3.2 PFG NMR Experiments
7.3.2.1 Sample Preparation
Prior to exposing the catalyst to the hydrocarbon liquids, the zeolite catalysts
were first heated up to 250 oC under vacuum condition to remove any physisorbed
species. Then, the catalysts were immersed in the liquid for at least 24 hours. After
immersion, the catalysts were removed, and dabbed gently on pre-wetted tissue to
remove the excess liquid from the external surface, before placing the catalysts between
two susceptibility plugs within a 5 mm diameter NMR tube. A piece of tissue soaked in
the hydrocarbon liquid was placed at the top of the NMR tube to maintain the vapour
pressure and reduce evaporative loss from the catalysts.
Figure 7.86 – NMR experimental set-up for diffusion measurement
7.3.2.2 PFG Experiments
The PFG NMR experiments were performed on the Bruker Avance 400 MHz
spectrometer with static field strength of 9.4 T corresponding to a resonance frequency
of 400.13 MHz for 1H nuclei.
PFG experiments were conducted by varying the gradient strength, g in the
range of 0.674 to 32.030 G cm-1, while keeping diffusion time, ∆, gradient length, δ, and
bipolar correction delay, τ constant. Three different diffusion times, ∆ was used in this
170

study; 0.015 s, 0.025 s and 0.05 s. Each experiment had 8 data points, of 16 scans each.
Signal attenuation was used to calculate the diffusion coefficient, DPFG and tortuosities,
τp.
7.4 Results
7.4.1 Nitrogen Sorption
Figures 7.6 and 7.7 compare the nitrogen sorption isotherms of H-ZSM-5(30)
and H-ZSM-5(80) catalysts before and after Pt impregnation. Since the total mass of the
PtH-ZSM-5 sample includes the mass of H-ZSM-5 as well as the mass of Pt, it is
necessary to take into account the Pt content before comparing isotherms of H-ZSM-5
and PtH-ZSM-5 samples. Therefore, the total sorption capacity measured from gas
sorption experiments were renormalized to take into account of the mass of Pt on the
catalyst.
1E-7 1E-6 1E-5 1E-4 1E-3 0.01 0.1 10
1
2
3
4
5
6
7
8
9
10
11
Ren
orm
alis
ed A
mou
nt A
dsor
bed,
m
mol
g-1
Relative Pressure, P/Po
Figure 7.87 – Nitrogen sorption isotherms for H-ZSM-5(30) (-■-) and PtH-ZSM-
5(30) (-●-) catalysts
The nitrogen sorption isotherms in Figures 7.6 and 7.7 showed that after the
impregnation of Pt, the nitrogen sorption capacity of the PtH-ZSM-5 catalysts decreased
171

when compared with the H-ZSM-5 samples. In Figure 7.7, the changes in the shape of
the isotherms at very low relative pressure (P/Po ~ 10-6) may be due to the lower
experimental sensitivity at such low pressures, and hence was considered as noise. In
order to distinguish between the adsorption in the dual pore system of the zeolite
catalyst, the reversible regions of the adsorption isotherms of the H-ZSM-5 and PtH-
ZSM-5 catalysts were fitted to a two-component model comprising of Langmuir and
BET components, as described in Chapter 4. From Table 7.1, it can be seen that the
ratio of the Langmuir component adsorption capacity parameter showed little change
relative to the BET component, after Pt impregnation on the H-ZSM-5(80) catalyst.
Contrary to the results for the H-ZSM-5(80) catalyst, a more significant drop was
observed for the adsorption capacity ratio for the Langmuir component after the
incorporation of Pt on the H-ZSM-5(30) catalyst
1E-7 1E-6 1E-5 1E-4 1E-3 0.01 0.1 10
1
2
3
4
5
6
7
8
Ren
orm
alis
ed A
mou
nt A
dsor
bed,
m
mol
g-1
Relative Pressure, P/Po
Figure 7.88 – Nitrogen sorption isotherms for H-ZSM-5(80) (-■-) and PtH-ZSM-
5(80) (-●-) catalysts
Table 7-15 – Results of Langmuir and BET composite model fit to nitrogen
adsorption isotherms for H-ZSM-5 and PtH-ZSM-5 catalysts.
Notes: W/Wo is the ratio of the adsorption capacity parameter of the relevant
component, W, for the PtH-ZSM-5 sample, to the corresponding total value, Wo,
for the H-ZSM-5 catalyst
172

W/Wo H-ZSM-5(30) PtH-ZSM-5(30) H-ZSM-5(80) PtH-ZSM-5(80)
Langmuir 0.80 ± 0.02 0.73 ± 0.02 0.76 ± 0.03 0.73 ± 0.03
BET 0.20 ± 0.02 0.18 ± 0.02 0.24 ± 0.01 0.20 ± 0.01
7.4.2 PFG NMR Results
7.4.2.1 Determination of bulk diffusivity, DB of C6H12 and C8H16
0.0 0.2 0.4 0.6 0.8 1.0 1.2 1.4 1.6
-2.5
-2.0
-1.5
-1.0
-0.5
0.0
DB (C
6H
12) = 1.66 x 10⁻⁹ m2 s-1
DB (C
8H
16) = 5.84 x 10⁻¹⁰ m2 s-1
ln (I
/I o)
g222(D-/3-/2), (x109 s m-2)
Figure 7.89 – Comparison of log attenuation plot for bulk liquid C6H12 (-■-) and
C8H16 (-●-)
Figure 7.8 shows the log attenuation plot for bulk cyclo-hexane (C6H12) and
cyclo-octane (C8H16). The diffusion coefficient of the bulk liquids was determined from
the slope of the graph. The bulk diffusivity of C6H12 was found to be (1.66 ± 0.01) x
10-9 m2 s-1, while the bulk diffusivity of C8H16 was calculated to be (5.84 ± 0.01) x 10-
10 m2 s-1. Previous studies on the sorption of cyclic hydrocarbons found that the
diffusivities decrease with increase in the sorbate size/molecular diameter [8-10]. Since
C8H16 has a molecular diameter of 0.80 nm [11], and the diameter of C6H12 was reported
173

to be 0.60 nm [12], the difference in their molecular sizes (with C8H16 having a smaller
molecular diameter) can explain the lower diffusivity of C8H16 compared with C6H12.
7.4.2.2 Molecular size effect on tortuosity of a mesoporous silica pellet (C10)
The diffusivity of C6H12 and C8H16 when it was imbibed in an industrially
supplied sol gel silica pellet (labelled as C10 pellets) is shown in Table 7.2. The C10
pellets are 5 mm in diameter, with surface area of 280 m2 g-1 and BJH median pore size
of 10 nm. The PFG-NMR experiments on the C10 pellets were aimed to identify the
effect of molecular size of probe molecules on self-diffusion and tortuosity without the
influence of the micropore network that are present in zeolite catalysts discussed in the
next section.
The motion of a sorbed molecule is much slower than the bulk diffusion in
liquid when it is imbibed in a porous material. Due to the restrictions by the pore
structure experienced by the molecules, the diffusivity of C6H12 and C8H16 decreased
when compared with the bulk diffusivity measured. The fraction of reduction in the
diffusivity in comparison with the bulk diffusivity is known as the tortuosity factor, τp. It
is noted from Table 7.2 that the tortuosity for C8H16 is higher than for C6H12, possibly
due to the bigger molecular size of C8H16 molecule, hindering passage of the molecules
through the pore network of the C10 pellet. The results shown are consistent with the
previous work of Wood et al. [13] who reported that the tortuosity of pentane is lower
than that of heptane due to the smaller molecular size of pentane.
Table 7-16 – Comparison of bulk diffusion coefficient, DPFG of C6H12 and C8H16 in
C10 pellets at diffusion time, ∆ = 0.05 s
MoleculeDPFG
(m2 s-1)
Tortuosity,
τp
C6H12 (1.18 ± 0.01) x 10-9 1.41 ± 0.02
C8H16 (3.32 ± 0.01) x 10-10 1.74 ± 0.02
174
7.4.2.3 Comparison of the PFG NMR results for PtH-ZSM-5(30) and PtH-ZSM-
5(80) catalysts
The average distance travelled by the C6H12 and C8H16 molecules during the
different observation times was compared with the crystallite and particle sizes of the
PtH-ZSM-5 samples. Table 7.3 shows the root mean squared displacement (RMSD) in
PtH-ZSM-5(30) and PtH-ZSM-5(80) catalyst. The size of the PtH-ZSM-5 particles is
between 250-710 m (sieve fraction), while the thickness of the particles has an average
value of 400 m. The RMSD travelled by both the C6H12 and C8H16 molecules over the
different observation times employed in the PFG experiments is much smaller than the
smallest dimensions of the PtH-ZSM-5 particles (250 m), and larger than the size of
the crystallites (measured from SEM images). Therefore, the diffusing molecules are
moving through the void space in between the crystallites.
Table 7-17 – RMSD of C6H12 and C8H16 imbibed within PtH-ZSM-5 catalysts
Sample
Diffusion
Time, Δ
(s)
RMSD (m)
C6H12 C8H16
PtH-ZSM-5(30)
0.015 10.96 ± 0.10 7.24 ± 0.11
0.025 13.91 ± 0.44 9.17 ± 0.20
0.050 19.64 ± 0.70 12.94 ± 0.12
PtH-ZSM-5(80)
0.015 11.89 ± 0.11 6.79 ± 0.12
0.025 15.20 ± 0.33 8.63 ± 0.15
0.050 21.44 ± 0.45 12.14 ± 0.31
175

0.00 0.01 0.02 0.03 0.04 0.05 0.060.0
0.2
0.4
0.6
0.8
1.0
1.2
1.4
1.6
1.8
2.0
Diff
usio
n C
oeffi
cien
t, D
PFG
(x 1
0-9) m
2 s-1
Diffusion Time, , s
Figure 7.90 – Diffusion coefficient, DPFG of C6H12 imbibed in PtH-ZSM-5(30) (-■-)
and PtH-ZSM-5(80) (-▲-) catalysts as a function of diffusion time, ∆
0.00 0.01 0.02 0.03 0.04 0.05 0.060
1
2
3
4
5
6
7
Diff
usio
n C
oeffi
cien
t, D
PFG
(x 1
0-10 ) m
2 s-1
Diffusion Time, , s
Figure 7.91 – Diffusion coefficient, DPFG of C8H16 imbibed in PtH-ZSM-5(30) (-■-)
and PtH-ZSM-5(80) (-▲-) catalysts as a function of diffusion time, ∆
176
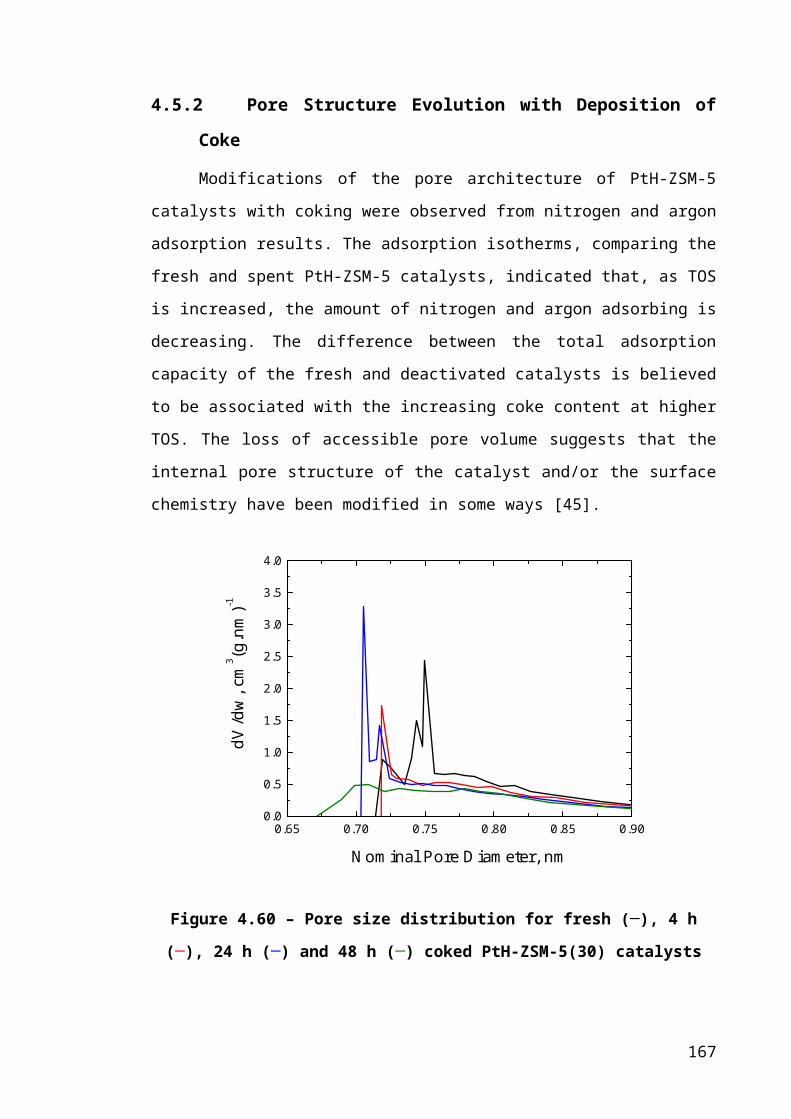
0.00 0.01 0.02 0.03 0.04 0.05 0.060.0
0.2
0.4
0.6
0.8
1.0
1.2
1.4
1.6
Tortu
osity
, p
Diffusion Time, , s
Figure 7.92 – Tortuosity, τp of PtH-ZSM-5(30) (-■-) and PtH-ZSM-5(80) (-▲-)
catalysts as a function of diffusion time, ∆ for C6H12 probe molecules
0.00 0.01 0.02 0.03 0.04 0.05 0.060.0
0.2
0.4
0.6
0.8
1.0
1.2
1.4
Tortu
osity
, p
Diffusion Time, , s
Figure 7.93 – Tortuosity, τp of PtH-ZSM-5(30) (-■-) and PtH-ZSM-5(80) (-▲-)
catalysts as a function of diffusion time, ∆ for C8H16 probe molecules
177
The variation of self diffusion coefficient, DPFG with diffusion time, Δ of C6H12
and C8H16 molecules when imbibed in the PtH-ZSM-5 samples are illustrated in Figures
7.9 and 7.10. The graphs show that the measured DPFG is independent of the diffusion
time, Δ. Therefore, the molecules do not encounter (surface) barriers with increasing
diffusion time.
Figures 7.11 and 7.12 compare the tortuosity, τp of PtH-ZSM-5(30) and PtH-
ZSM-5(80) catalysts measured by C6H12 and C8H16 molecules. When evaluating the
effect of molecular size on the diffusion within the PtH-ZSM-5(80) catalyst, the
diffusion path was found to be slightly more tortuous for the C8H16 molecules than for
the C6H12 molecules, consistent with the results shown in Table 7.2 for C10, a pure
mesoporous silica pellet. Contrary to the results obtained for the PtH-ZSM-5(80)
catalyst, the tortuosity of PtH-ZSM-5(30) catalyst was found to be higher when C6H12
was imbibed in the catalyst, as opposed to when C8H16 was probing the pore space of
the PtH-ZSM-5(30) sample.
7.4.3 Discussion
7.4.3.1 Effect of Pt impregnation on the pore structure of H-ZSM-5 catalysts
The adsorption capacity parameters obtained from the Langmuir-BET fit was
compared for the PtH-ZSM-5 catalyst of different SiO2/Al2O3 ratio. The change in the
ratios of the adsorption capacity parameters gives indication of the location of the metal
particle, either within or on the external surface of the crystallites. The decrease in
nitrogen sorption capacity in the mesopores, and the more significant reduction in the
BET component adsorption capacity parameter for the PtH-ZSM-5(80) catalyst when
compared with the Langmuir component, could be due to the deposition of Pt particles
on the surface of the zeolite crystallite. This result is consistent with the BSE images
shown in Chapter 4, which showed that more Pt particles were present on the surface of
the PtH-ZSM-5(80) crystallites. The Pt particles probably block the pore openings on
the external surface of the crystallite, hence hindering the access of nitrogen to the
interior of the crystallite.
While the adsorption capacity ratio for the BET component remained constant
before and after Pt impregnation on the H-ZSM-5(30) catalyst, the Langmuir
component adsorption capacity ratio decreased after Pt incorporation. This suggests
178

preferential deposition of Pt particles within the PtH-ZSM-(30) crystallite, as opposed
to surface metal deposition for the PtH-ZSM-5(80) catalyst.
7.4.3.2 Influence of Pt on the transport properties of PtH-ZSM-5 catalysts
As mentioned earlier, the C6H12 molecules can adsorb in the crystallites of the
ZSM-5 catalyst [5] while C8H16 molecules only probe the surface of the zeolite
crystallites [5-6] within the mesoporosity. However, the presence of the Pt particles on
the surface of the H-ZSM-5(80) crystallites could block the pore openings and hinder
the access/diffusion of C6H12 molecules into the crystallites. In that case, the C6H12
molecules only probe the pore space in the intercrystalline regions of the PtH-ZSM-
5(80) catalyst, similar to the C8H16 molecule. Since both C6H12 and C8H16 molecule are
diffusing in the same regions, the lower diffusivity measured for the C8H16 molecule
compared to the diffusivity of C6H12 can be explained by its larger molecular diameter
[8-10].
As for the PtH-ZSM-5(30) sample, the diffusion path was more tortuous for
C6H12 than it was for C8H16. Previous studies have shown that the SiO2/Al2O3 ratio does
not have a major influence on the heat of adsorption of hydrocarbons in a H-ZSM-5
catalyst [14-15]. Arik et al. [15] reported that the heat of adsorption increased by only
10 kJ mol-1 when the SiO2/Al2O3 ratio was increased from 24 to 800. Therefore, the
increase in the interaction of hydrocarbons with the pore walls can be assumed to be
insignificant when the SiO2/Al2O3 ratio of the PtH-ZSM-5 catalyst was varied from 30
to 80, in our experiments. In addition, Jentys et al. [16] found that the sorption of
benzene is controlled by the interaction of the molecule with the pore walls, and that the
localized interaction with the bridging hydroxyl group gives rise to only minor energetic
contributions. Hence, the tortuosity trend observed for the PtH-ZSM-5(30) catalyst can
not be due to the difference in the SiO2/Al2O3 ratio of the catalysts. In order for the
C6H12 molecules to experience an increase in tortuosity when probing the pore structure
of the PtH-ZSM-5(30), as compared to C8H16 molecules, the C6H12 molecules have to
interact stronger on the surface of the PtH-ZSM-5(30) catalyst. Therefore, only if the
impregnation of Pt metal with the surface of the PtH-ZSM-5(30) catalyst leads to an
enhanced specific interaction for the C6H12 molecule with the surface, and not for the
179

C8H16 molecule, then the effect of Pt impregnation can also be excluded as a possibility
for the tortuosity results observed.
For the above reasons, the higher tortuosity experienced by the C6H12 molecules
could only be explained by the molecular exchange between intra- and intercrystalline
void space of the PtH-ZSM-5(30) catalyst. The C6H12 molecules could adsorb within the
crystallites of a H-ZSM-5 catalyst since the Pt particles within the H-ZSM-5(30)
crystallites do not hinder the molecular exchange of C6H12 between the dual pore
systems of the PtH-ZSM-5(30) catalyst as they did for PtH-ZSM-5(80). The C6H12
molecules could possibly enter the zeolite crystallites, thereby experiencing a higher
restriction to diffusion due to more confined geometry in the micropore network. This
thus leads to a more tortuous path for the C6H12 molecules, when compared with the
tortuosity experienced by the C8H16 molecule that only probes the surface of the PtH-
ZSM-5(30) crystallites.
7.4.3.3 Analysis of the different location of coke deposition during benzene
alkylation with ethane over PtH-ZSM-5 catalysts
The first stage of the alkylation of benzene with ethane is the dehydrogenation
of ethane on metal sites. Therefore, the formation of ethene, the product of ethane
dehydrogenation could take place on the surface of the PtH-ZSM-5(80) catalyst since Pt
particles are present on the surface of the crystallite. The PFG results showed that the Pt
particles on the surface of the PtH-ZSM-5(80) sample hindered the accessibility of the
C6H12 molecules from going into the micropore network of the catalyst, but not for the
PtH-ZSM-5(30) catalyst since the Pt particles are predominantly located within the
crystallite for this sample. Therefore, ethene (formed from dehydrogenation of ethane)
and benzene, the main reactants for benzene alkylation, would experience more
difficulty to enter the micropore network of the PtH-ZSM-5(80) catalyst when
compared with PtH-ZSM-5(30). It has been reported that the formation of aromatics
could take place over with high metal oxide surface area, with little measurable
Brønsted acidity [16]. In addition, carbonaceous species formation catalysed by metal
surface has also been reported for catalytic systems without acidic support [17]. If this is
the case, ethene formed could possibly undergo oligomerization and aromatization to
180
form bulky aromatics, which could then lead to the formation of coke on the external
surface of the crystallite.
Since most Pt particles are located within the crystallites, and the pore openings
on the surface of the PtH-ZSM-5(30) was not obstructed by the Pt particles, ethane
molecules could diffuse into the crystallite, react on the metal surface to form ethene,
and further react with benzene to form ethylbenzene (EB). Side reactions such as
oligomerization, aromatization and isomerization could take place within the zeolite
crystallite to form coke precursors such as methyl-naphtalene, as proposed by Lukyanov
and Vazhnova [18]. Hence, coke formation takes place within the PtH-ZSM-5(30)
crystallite, supporting earlier results from gas sorption and diffraction experiments.
7.5 ConclusionNitrogen adsorption and PFG results have shown that, after the impregnation
process, most Pt particles are located within the micropore network for the PtH-ZSM-
5(30) catalyst, while most of the Pt particles are found on the surface of the PtH-ZSM-
5(80) crystallite. The preferential deposition of Pt particle on the surface of the PtH-
ZSM-5(80) catalyst was found to block access of C6H12 into the crystallite. As for the
PtH-ZSM-5(30) catalyst, molecular exchange of C6H12 with the two pore systems of the
catalyst resulted in a higher tortuosity experienced by the C6H12 molecule when
compared with the C8H16 molecule that only probes the intercrystalline region of the
catalyst.
Explanation for the different location coke deposition for the two PtH-ZSM-5
catalysts was proposed. The Pt particles on the surface of the PtH-ZSM-5(80) crystallite
made it more difficult for the reactants to penetrate into the crystallite. Hence, ethene,
the product of ethane dehydrogenation on the metal sites on the surface could possibly
undergo further reactions on the active sites present on the surface to form bulky
aromatics that could lead to coke formation. With Pt particles located within micropore
network of the PtH-ZSM-5(30) catalyst, ethane dehydrogenation and benzene alkylation
would take place in the crystallite. Side reactions that lead to the formation of large
aromatic products could initiate the formation of coke within the crystallite.
181
7.6 References[1] E.O. Stejskal, and J.E. Tanner, The Journal of Chemical Physics 42 (1965) 288-
292.
[2] P.W. Atkins, Atkins' Physical Chemistry Oxford University Press, Oxford, 2002.
[3] T.D.W. Claridge, High-Resolution NMR Techniques in Organic Chemistry.
Pergamon, Amsterdam;Oxford 1999, 382.
[4] M.P. Hollewand, and L.F. Gladden, Chemical Engineering Science 50 (1995)
309-326.
[5] Y. Traa, S. Sealy, and J. Weitkamp, in: H.G. Karge, and J. Weitkamp, (Eds.),
Characterization II, Springer, Berlin / Heidelberg. 103-154.
[6] F. Stallman, and J. Karger, Adsorption 5 (1999) 117-133.
[7] E. Browning, British Journal of Industrial Medicine 16 (1959) 23-39.
[8] H. Ban, J. Gui, L. Duan, X. Zhang, L. Song, and Z. Sun, Fluid Phase Equilibria
232 (2005) 149-158.
[9] D.M. Ruthven, and B.K. Kaul, Industrial & Engineering Chemistry Research 32
(1993) 2053-2057.
[10] C.L. Cavalcante, and D.M. Ruthven, Industrial & Engineering Chemistry
Research 34 (1995) 185-191.
[11] T. Makino, T. Nakamura, T. Sugahara, and K. Ohgaki, Fluid Phase Equilibria
218 (2004) 235-238.
[12] S. Mitra, V.S. Kamble, A.K. Tripathi, N.M. Gupta, and R. Mukhopadhyay,
PRAMANA - Journal of Physics 63 (2004) 443-448.
[13] J. Wood, and L.F. Gladden, Applied Catalysis A: General 249 (2003) 241-253.
[14] A.V. Ivanov, G.W. Graham, and M. Shelef, Applied Catalysis B: Environmental
21 (1999) 243-258.
[15] I.C. Arik, J.F. Denayer, and G.V. Baron, Microporous and Mesoporous
Materials 60 (2003) 111-124.
[16] K.M. Dooley, T.F. Guidry, and G.L. Price, Journal of Catalysis 157 (1995) 66-
75.
[17] M. Guisnet, and P. Magnoux, Applied Catalysis:A General 212 (2001) 83-96.
[18] D.B. Lukyanov, and T. Vazhnova, Journal of Catalysis 257 (2008) 382-389.
182
Chapter 8 : Conclusions and Future Work
8.1 ConclusionsA novel multi-technique approach has been shown, in this thesis, to be
successful in identifying the coking behaviour of two bifunctional Pt-H-ZSM-5
catalysts (SiO2/Al2O3 = 30 and 80) during benzene alkylation with ethane.
The following points summarise the main findings of the work in this thesis.
1. Activity of PtH-ZSM-5 catalysts
Benzene alkylation with ethane over two Pt-incorporated H-ZSM-5 catalysts
was carried out at 370oC. During the alkylation of benzene with ethane over the PtH-
ZSM-5(30) catalysts, the conversion of benzene and ethane decreased with TOS as a
result of catalyst deactivation. On the other hand, the PtH-ZSM-5(80) catalyst remained
stable during the reaction, even with increasing coke content, as determined by
thermogravimetric analysis. Due to the higher acidity of the PtH-ZSM-5(30) catalyst,
the alkylation of benzene with ethene was enhanced, hence drawing the ethane
dehydrogenation forward. As a result, the selectivity to ethene for the PtH-ZSM-5(30)
catalyst is lower than that observed for the PtH-ZSM-5(80) catalyst. Benzene
conversion over the PtH-ZSM-5(30) catalysts yields conversion higher than the
equilibrium conversion. This suggests that benzene was also converted to other side
products apart from the transformation of benzene into the desired product,
ethylbenzene (EB). When the reaction is carried out over PtH-ZSM-5(30) catalysts, it
was observed that the partially deactivated catalysts were more para-selective for DEB
and xylene isomers than the fresh catalysts. On the contrary, the selectivity of the DEB
isomers remained constant with time-on-stream (TOS) when the reaction was catalysed
by the PtH-ZSM-5(80) catalysts.
2. Pore Structure Modification of PtH-ZSM-5 Catalysts by Coking during Benzene
Alkylation with Ethane
Results from nitrogen, argon and ethane adsorption on the fresh and partially
deactivated PtH-ZSM-5 catalysts have illustrated the effect of coke on the catalyst’s
183
pore structure. The difference between the total adsorption capacity for nitrogen, argon
and ethane of the fresh and deactivated PtH-ZSM-5 catalysts is believed to be
associated with the increasing coke content as TOS increases. The nitrogen and argon
isotherm shift observed at low P/Po has indicated the effect of coke on the pore
architecture of the zeolite catalysts. In addition, the shift in the micropore size
distribution observed, in the case of the 4 h and 24 h coked PtH-ZSM-5(30) catalysts
suggested that more dead-end pores are formed as coke is deposited within the core of
the crystallites.
3. Location of Coke Deposition
Successful determination of the location of coke deposition during the alkylation
reaction of both the PtH-ZSM-5 catalysts has been obtained. Changes in the relative
position and intensities of XRD peaks for the PtH-ZSM-5(30) catalysts provided
evidence for intracrystalline coking, as opposed to the external location of the coke
formed during benzene alkylation over the PtH-ZSM-5(80) catalyst. The nitrogen and
argon adsorption data, fitted to a dual-component Langmuir-BET fit has shown to be
capable of differentiating coke deposition within the zeolite crystallites and in the
intercrystalline regions. The significant drop in the ratio of the BET component
adsorption capacity parameter suggested that the mesopores in-between the zeolite
crystallites were modified by coke for the PtH-ZSM-5(80) catalysts. The intracrystalline
coke deposition proposed by the XRD spectra for the PtH-ZSM-5(30) catalysts was
supported by the changes in the ratio of the Langmuir component adsorption capacity
parameter with TOS.
4. Simulation of accessibility and diffusion within PtH-ZSM-5 crystallites
The Monte Carlo simulations performed have successfully generated the
accessibility plot for a ZSM-5 type lattice. The percolation threshold, fc for a ZSM-5
lattice, assuming random distribution of coke in the channels and intersections was
found to be 0.65. Percolation analysis of the nitrogen and argon adsorption data
indicated that the random coke distribution inside the zeolite crystallites is incorrect for
the PtH-ZSM-5(30) catalyst. This was shown by the still high accessibility of the PtH-
ZSM-5(30) pore network to nitrogen and argon even when the percolation threshold for
random deposition of coke is reached.
184
The results from the self-diffusivity simulations showed that, the relationship
between the self-diffusivity and molecular occupancy is highly sensitive to the
connectivity of a lattice, with a more significant non-linearity effect on lattices with
lower connectivity. The intra-crystalline diffusivity was found to decrease with
increasing pore blockage, but declined rapidly when the percolation limit is reached.
5. Effect of coke formation on kinetics and thermodynamic of ethane adsorption
Analysis of the kinetics data from ethane adsorption experiments has identified
changes in the mass transfer coefficient (k =D/a2) with TOS, at a constant amount of
ethane adsorbed. The observation of an increase in the MTC with coking is accounted
for by a decrease in the length of the diffusion pathway, which is equivalent to an
apparent decrease in crystallite size of the zeolite catalysts. The decrease in the diffusion
path length but lack of impact on diffusivity is consistent with the preferential
deposition of coke towards the centre of the zeolite crystallites, thereby partially
blocking the internal pore structure of the zeolite catalysts.
6. The deactivation behaviour of PtH-ZSM-5 catalysts during benzene alkylation
with ethane
A direct correlation between the structural evolution of the zeolite pore structure
as a result of coke deposition, which alters the adsorption kinetics and transport
properties, and the product selectivity was achieved in this study.
a. PtH-ZSM-5(30)
When alkylation of benzene with ethane was carried out over the PtH-ZSM-
5(30) catalysts, the selectivity to para-DEB was decreased, while the selectivity to
meta-DEB was increased, with TOS. The formation of DEB is due to further alkylation
reaction of ethylbenzene with ethene on the acid sites of the zeolite catalyst. Due to the
steric constraints of the two ethyl groups, ortho-DEB was not observed in the product
distribution. This finding is rare in comparison with the typical effect of coking, which
would enhance the selectivity of para- isomers, as the effective channel size of the
catalyst is reduced, and the diffusion resistance increased, with coke deposition [1].
185
Kaeding [2] showed that, when the alkylation or disproportionation of
ethylbenzene was carried out over large crystals of ZSM-5 zeolites, the selectivity to
para-DEB isomer was enhanced as a result of increasing diffusional pathlength [2].
When the diffusion path length is increased, the DEB isomers would then have to travel
a long distance before they left the crystallites. Therefore, in a restricted pore network
like in the ZSM-5 type zeolite, the formation of para-DEB would be favoured.
Results from the accessibility study suggested that coke molecules were initially
formed in the core of the crystallites, and when the coke content was increased, these
coke molecules block the channels and intersections in such a way that the coke was
progressively building up from the middle of the structure, moving outwards to the
crystal surface, hence decreasing the diffusion length of the zeolite crystallites. The
increase in the MTC with TOS also indicated that the diffusion pathway of the zeolite
crystallites was decreased as a result of coking. Therefore, the observed increasing
selectivity to meta-DEB with TOS in this work could be due to the effect of coke,
decreasing the diffusion pathway within the zeolite crystallite. As a result, meta-DEB
did not isomerize to form para-DEB (Equation 8.1) in the pores of the zeolite catalyst.
C2H5
C2H5
C2H5
C2H5
C2H5
C2H5 (8-76)
As for the variation of the xylene isomers distribution with TOS, the deactivated
catalysts, which have smaller diffusion length, are always less para-selective than the
fresh Pt-modified H-ZSM-5(30) catalyst. The relationship between the xylene isomers
selectivity with TOS shows that the ortho-xylene selectivity was increasing at the
expense of the meta- + para- xylene selectivity. This result was consistent with previous
research on toluene alkylation with methanol by Sotelo et al. [3], who suggested that the
pore blockage by coke molecules lead to a decrease in the diffusion pathway length,
thus decreasing the para-selectivity of the xylene isomers.
b. PtH-ZSM-5(80)
As opposed to the effect of coke seen on the PtH-ZSM-5(30) catalysts, the
coking phenomenon had no effect on the shape selectivity reactions when the reaction
was carried out with the PtH-ZSM-5(80) catalysts. The selectivity to DEB isomers did
186

not change with TOS, as shown in Figure 3.18 in Chapter 3. It was proposed that the
deposition of coke within the zeolite crystallites and the reduction of the diffusion
length of the PtH-ZSM-5(30) catalyst were responsible for the changes in the selectivity
of different isomers with TOS.
For the PtH-ZSM-5(80) catalyst, no evidence of coke deposition in the internal
pore structure of the zeolite crystallites was found. The changes in the ratios of
adsorption capacity parameters, from the Langmuir-BET adsorption fits, with TOS
suggested that the deposition of coke on PtH-ZSM-5(80) catalyst was dominated by
pore blockage, where the entrance to the zeolite channels was blocked by coke forming
on the outside of zeolite crystallites. The diffraction spectra also indicated that no
deformation of the zeolite framework was detected with increasing coke content. In
addition, the diffusion pathlength of the PtH-ZSM-5(80) catalyst remained long with
TOS when compared to the PtH-ZSM-5(30) catalyst, as demonstrated by the larger
MTC for the PtH-ZSM-5(30) catalyst. As a result, no variations in the DEB isomers
with TOS were observed.
7. Spatial distribution of Pt metal on PtH-ZSM-5 catalysts
The spatial distribution of Pt particles has been successfully identified by
nitrogen adsorption and electron microscopy images. BSE images of the crystallite
surface indicated that the concentration of surface Pt particle was higher on the PtH-
ZSM-5(80) catalyst than on the PtH-ZSM-5(30) sample. The drop in the BET
component adsorption capacity parameter for the PtH-ZSM-5(80) catalyst when
compared with that of the H-ZSM-5(80) catalyst confirmed the location of Pt metal on
the crystallite surface, hence reducing the N2 adsorption capacity in the mesopore
region. The intracrystalline location of Pt particles for the PtH-ZSM-5(30) catalyst was
suggested by the significant drop in the ratio of the Langmuir component adsorption
capacity parameter, as compared to the BET component.
PFG-NMR results have shown the effect of Pt location on the diffusivities of
C6H12 and C8H16 probe molecules imbibed in the PtH-ZSM-5 catalysts. The Pt particles
on the surface of the PtH-ZSM-5(80) surface hindered the accessibility of C6H12
molecule into the crystallite. Therefore, similar to C8H16, C6H12 only probes the pore
space in between the PtH-ZSM-5(80) crystallites. As a result of intracrystalline
deposition of Pt metal, C6H12 can migrate between the two regions of the zeolite pore
187
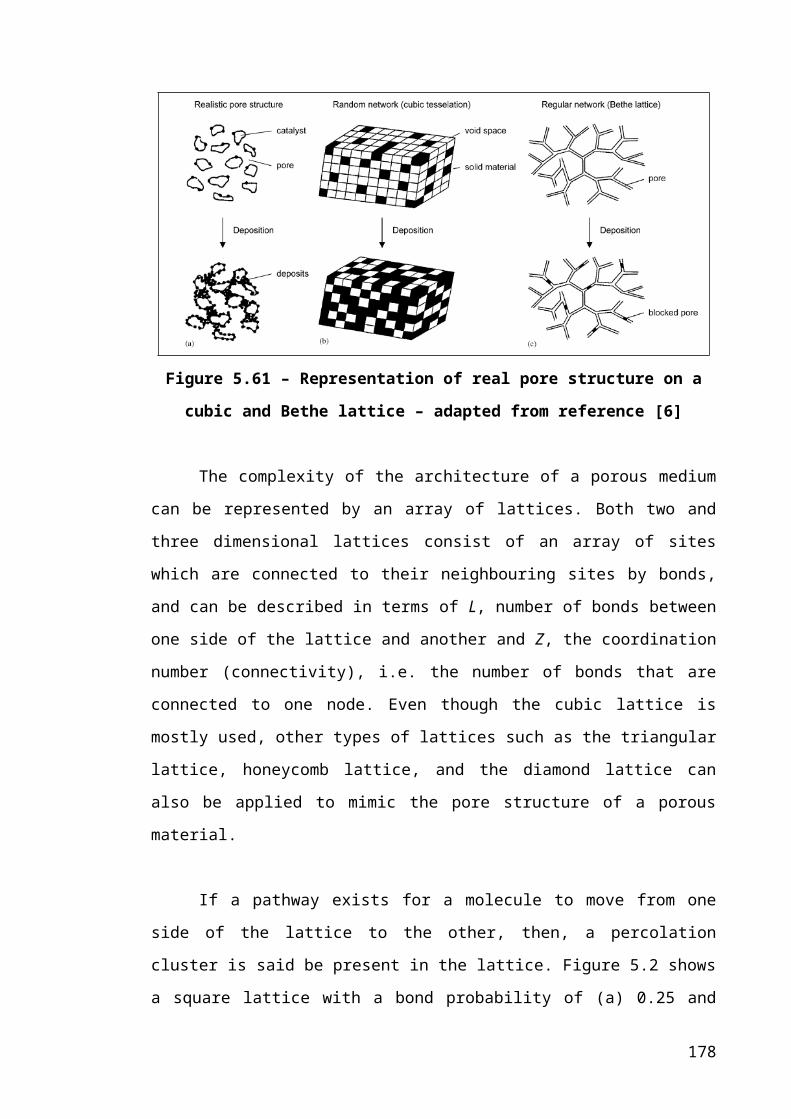
network as the Pt particles are not blocking access to the micropore network of the PtH-
ZSM-5(30) catalyst, as it did for the PtH-ZSM-5(80) sample. Molecular exchange of
C6H12 was indicated by the increase in tortuosity experienced by C6H12 molecules when
compared with C8H16 molecules.
8. Analysis of the different locations of coke deposition for the PtH-ZSM-5(30) and
PtH-ZSM-5(80) catalysts
A proposal to explain the different spatial distribution of coke observed during
benzene alkylation with ethane over the two PtH-ZSM-5 catalysts was put forward in
this study.
a. PtH-ZSM-5(30)
Intracrystalline coking phenomenon that took place when the reaction was
carried out over the PtH-ZSM-5(30) catalyst could be explained by the preferential
deposition of Pt metal within the zeolite crystallite. Ethane dehydrogenation proceeds
on the Pt sites within the crystallite to form ethene, which will then react with benzene
on the acid sites to form ethylbenzene. Further conversions over the active sites lead to
coke formation within the PtH-ZSM-5(30) crystallite.
b. PtH-ZSM-5(80)
As a result of the deposition of Pt particles on the crystallite surface, the
dehydrogenation of ethane and alkylation of benzene took place on the surface of the
crystallites when the reaction was carried out over the PtH-ZSM-5(80) catalysts. The Pt
particles block the pore openings on the external surface of the crystallite, making it
more difficult for ethene and benzene to penetrate into the micropore network. Hence,
further reactions such as oligomerization, alkylation, and aromatization proceed on the
surface of the crystallites. The formation of bulky aromatic molecules from these
reactions initiates the coking process in the intercrystalline region of the PtH-ZSM-
5(80) catalyst.
188
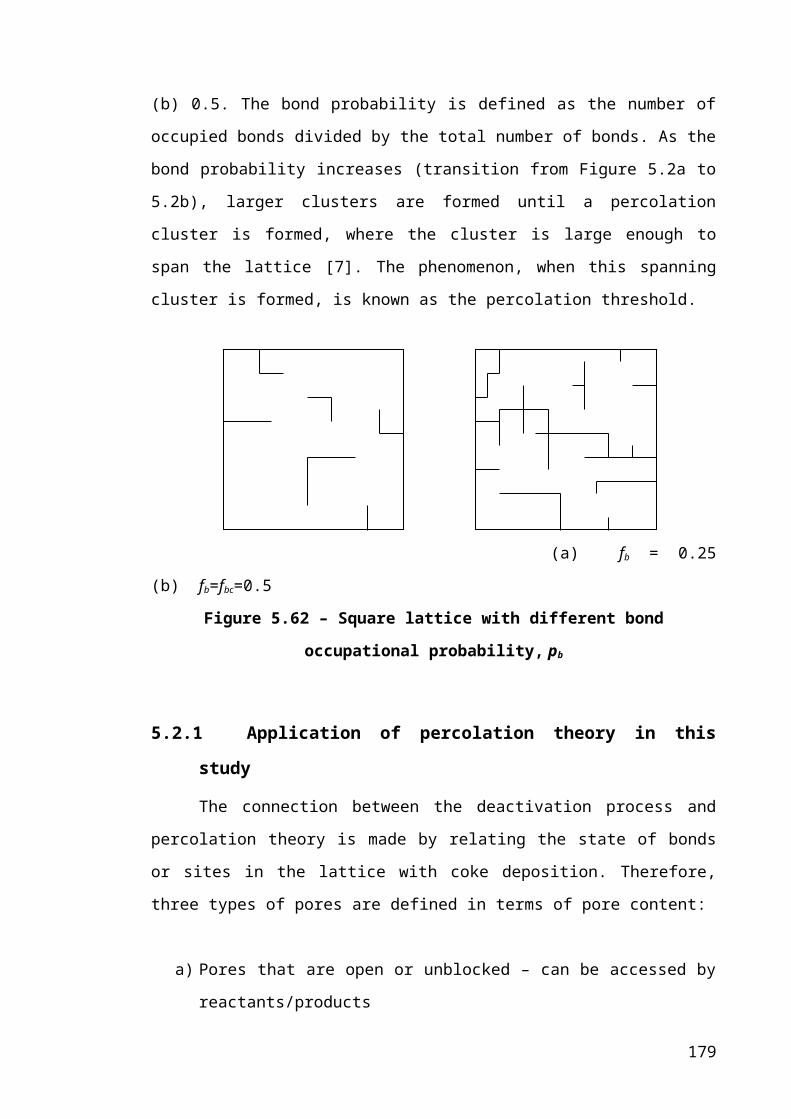
8.2 Future WorkThe combination of experimental techniques and simulation studies contained in
this work has been proven to yield valuable information on the deactivation mechanism
of a zeolite catalyst. In this section, the possible ideas for further developments in this
area are considered.
1. Effect of metal/acid balance in PtH-ZSM-5 catalysts on the alkylation of benzene
with ethane
In the current study, the metal loading was kept constant at 1 wt%, but the two
PtH-ZSM-5 catalysts have different acidity. The balance between the acid and metal site
density is an important factor that determines the reactivity of a bifunctional catalyst,
and the selectivity of the products. Hence, it would be useful to investigate the influence
of the metal/acid balance on the performance of the zeolite catalyst in the benzene
alkylation reaction.
a. Acidity measurement of PtH-ZSM-5 catalysts
The acidity of PtH-ZSM-5 catalysts can be measured by employing the FTIR
technique. However, in order to determine the distribution of acid sites on the external
and internal surface, suitable probe molecules have to be used. The acid sites located on
the external surface can be characterised by large probe molecule such as di-tert-butyl-
pyridine (DTBPy) [4], while ammonia and pyridine can be used to probe the total
acidity of the catalyst [5].
b. Pt distribution on the PtH-ZSM-5 catalysts
In order to determine the amount of interzeolite and intrazeolite Pt particles, a
combination of nonane pre-adsorption and H2 or CO chemisorption characterisation
method was proposed. The PtH-ZSM-5 samples will first be exposed to nonane, so that
the micropores are completely filled with nonane, and then followed by chemisorption
experiment. This method will allow the determination of interzeolite Pt particle since H2
or CO only interacts with Pt metal on the external surface of the zeolite crystallites.
2. Effect of coke formation on the acidic properties of PtH-ZSM-5 catalysts
189
The two PtH-ZSM-5 zeolites have different number of acid sites, with the PtH-
ZSM-5(30) catalyst having greater number of acid sites when compared with the PtH-
ZSM-5(80) catalyst. The number and strength of acid sites in a catalyst are important
parameters that can influence the activity and product selectivity in various hydrocarbon
transformation reactions [6]. By carrying out IR spectroscopy and calorimetric
measurements on the fresh and coked catalysts, the changes in the total acidity and acid
strength distribution as a function of TOS can be determined. In addition, the chemical
identity and nature of coke components can also be identified by the IR technique.
Analysis of the product distribution with the acidity properties of the catalyst could give
a better understanding of the catalyst deactivation phenomenon.
8.3 References[1] X. Lin, Y. Fan, G. Shi, H. Liu, and X. Bao, Energy and Fuels 21 (2007) 2517-
2524.
[2] W.W. Kaeding, Journal of Catalysis 95 (1985) 512-519.
[3] J.L. Sotelo, M.A. Uguina, J.L. Valverde, and D.P. Serrano, Applied Catalysis A:
General 114 (1994) 273-285.
[4] A. Corma, V. Fornes, L. Forni, F. Marquez, J. Martinez-Triguero, and D.
Moscotti, Journal of Catalysis 179 (1998) 451-458.
[5] R.W. Weber, J.C.Q. Fletcher, K.P. Moller, and C.T. O'Connor, Microporous
Materials 7 (1996) 15-25.
[6] S.K. Sahoo, N. Viswanadham, N. Ray, J.K. Gupta, and I.D. Singh, Applied
Catalysis A: General 205 (2001) 1-10.
190

Appendix
A1 – Gas Chromatogram (GC) Analysis
A1-1 – Typical chromatogram of chemical components detected by TCD
A1-2 – Typical chromatogram of chemical components detected by FID
i
ii
A2 – Thermodynamic Calculations
A2-1 – Benzene Alkylation with Ethane
Thermodynamics data at 298 K, Cp/R = a+bT+cT2+d/T2 (Yaw, 1992):
ComponentsEnthalpy,
∆H (J mol-1)
Entropy,
∆S
(J mol-1 K-1)
a b c d
Ethane -84000 229.2 1.131 0.0192 -5.6E-06 -
Benzene 82880 269.3 -0.206 0.0391 -1.3E-05 -
EB 29920 360.63 1.124 0.0554 -1.8E-05 -
Hydrogen 0 130.7 3.249 0.0004 - 8.3E-07
Ethene 29920 360.63 1.424 0.0144 -4.4E-06 -
The Gibbs free energy of reaction at 370oC
iii
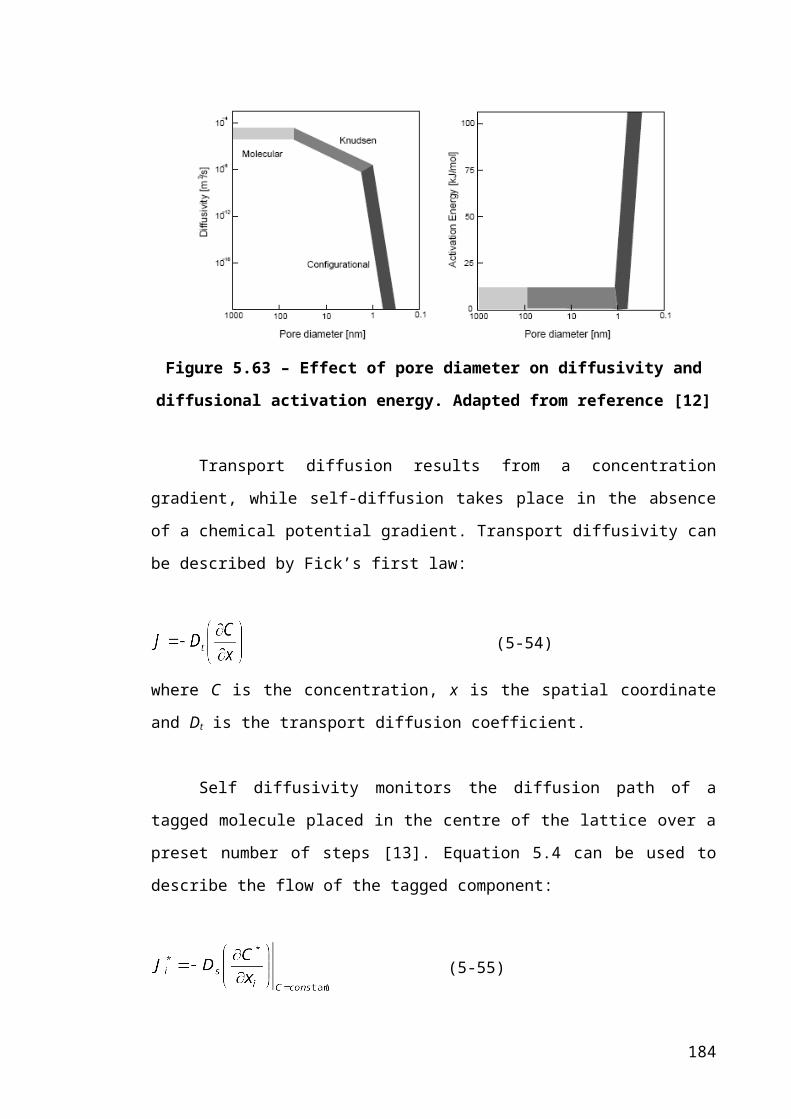
The equilibrium constant of reaction at 370oC
The equilibrium conversion of benzene
A2-2 – Ethane Dehydrogenation
iv
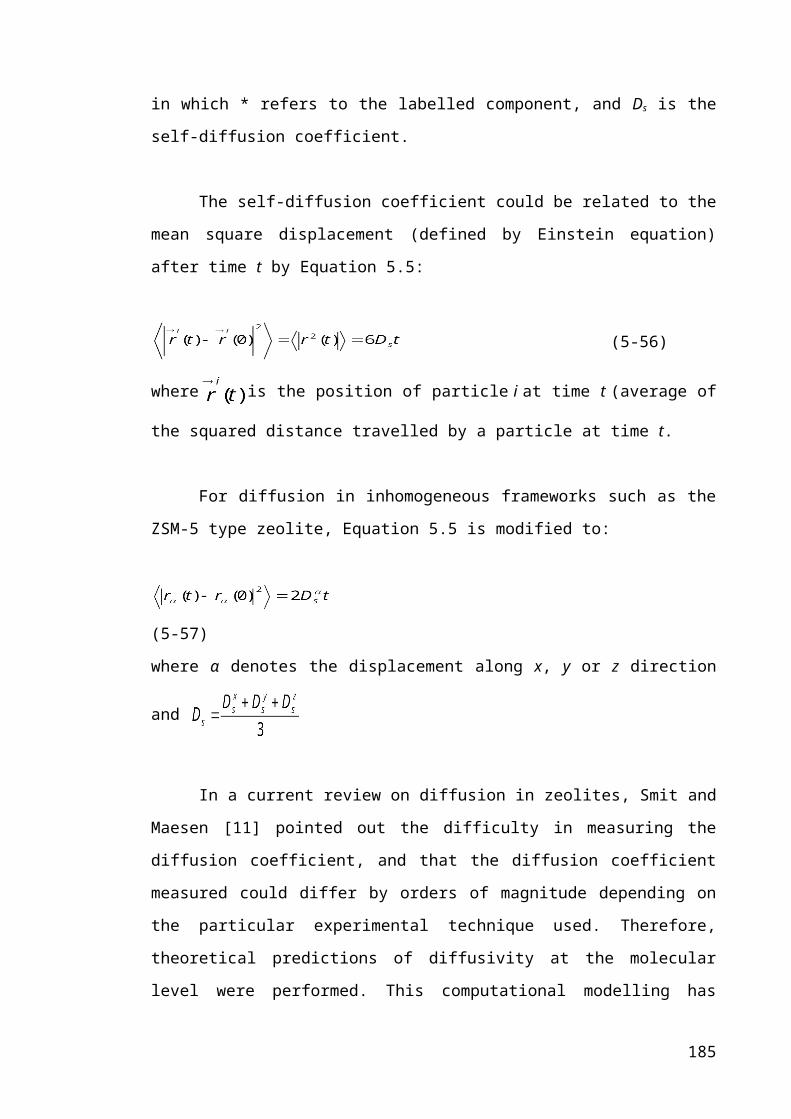
The Gibbs free energy of reaction at 370oC
The equilibrium constant of reaction at 370oC
The equilibrium conversion of ethane
v
A3 – Alkylation of Benzene with Ethane Experimental Data
A3-1 – Concentration of products (mol %) produced over PtH-ZSM-
5(30) catalyst at 370oC
Conversion of ethane-benzene over 1%PtHZSM5(30) catalyst at 370oC.
Feed: 90mol% ethane, 10mol% Benzene
Comments: cat. weight = 0.5002 g
Feed flowrate = Ethane 16 ml/min
Experiment 5.0000
5001.000
0
5002.000
0
5003.000
0
5004.000
0
5005.000
0
5006.000
0
5007.000
0
Temper.,oC 370 0 370 370 370 370 370 370
Tsat, oC 20.0 0.0 20.0 20.0 19.5 19.5 19.5 20.0
TOS, h 1.02 8.02 15.03 22.03 29.05 36.07 43.07 48.07
WHSV, h-1 3.10 3.02 3.02 3.04 3.06 3.06 3.06 3.02
Cont.time,h 0.3226 0.3311 0.3311 0.3289 0.3268 0.3268 0.3268 0.3311
Conv. C2 6.623 4.718 3.989 3.519 3.249 3.000 2.765 2.644
Conv Benz 20.470 18.685 18.089 16.078 14.862 14.241 14.730 13.765
S1(E+B=EB) 6.36 10.46 12.53 15.37 17.36 19.24 21.35 22.54
S2(B=EB) 37.19 51.89 59.66 67.34 71.97 75.54 78.73 80.35
S3(C2=) 0.83 1.30 1.70 2.00 2.21 2.83 2.75 2.81
S4 (H2) 16.13 21.60 22.71 25.00 26.64 29.11 30.22 31.92
Yield Et-Benz 7.612 9.695 10.793 10.827 10.696 10.758 11.597 11.061
H2 1.6616 1.5731 1.3949 1.3697 1.3460 1.3712 1.3166 1.3377
C1 5.9986 3.5477 2.8233 2.2996 1.9799 1.6594 1.4249 1.2795
C2 82.7555 86.1455 87.8619 87.8711 87.8311 87.9364 88.6850 88.3161
C2= 0.0850 0.0948 0.1042 0.1094 0.1118 0.1332 0.1196 0.1178
C3 0.7306 0.5517 0.4852 0.4109 0.3610 0.3157 0.2840 0.2537
C3= 0.0138 0.0111 0.0105 0.0094 0.0085 0.0075 0.0071 0.0062
i-C4 0.0182 0.0139 0.0123 0.0102 0.0091 0.0079 0.0071 0.0064
n-C4 0.0240 0.0195 0.0181 0.0163 0.0152 0.0142 0.0136 0.0129
trans -C4= 0.0012 0.0010 0.0009 0.0009 0.0008 0.0008 0.0008 0.0000
1-C4= 0.0000 0.0000 0.0000 0.0000 0.0000 0.0000 0.0000 0.0000
iso-C4= 0.0022 0.0018 0.0017 0.0016 0.0015 0.0014 0.0014 0.0013
cis-C4= 0.0000 0.0000 0.0000 0.0000 0.0000 0.0000 0.0000 0.0000
C5 0.0011 0.0008 0.0007 0.0000 0.0000 0.0000 0.0000 0.0000
16.1000 0.0000 0.0000 0.0000 0.0000 0.0000 0.0000 0.0000 0.0000
Benzene 6.9463 6.5707 5.9966 6.6509 7.1159 7.3528 6.9582 7.4929
Toluene 0.9164 0.5058 0.3510 0.2823 0.2244 0.1862 0.1539 0.1338
Et-Benzene 0.6552 0.7619 0.7694 0.8418 0.8774 0.9061 0.9303 0.9445
m/p Xylene 0.0496 0.0259 0.0181 0.0132 0.0101 0.0081 0.0071 0.0060
o-Xylene 0.0130 0.0073 0.0054 0.0038 0.0029 0.0024 0.0021 0.0017
vi
iPB 0.0066 0.0093 0.0108 0.0118 0.0130 0.0138 0.0148 0.0150
PB 0.0025 0.0020 0.0018 0.0016 0.0016 0.0014 0.0013 0.0011
Et-Toluene 0.0733 0.0760 0.0665 0.0495 0.0442 0.0388 0.0293 0.0311
A 0.0052 0.0037 0.0027 0.0017 0.0015 0.0008 0.0012 0.0005
B 0.0087 0.0117 0.0086 0.0066 0.0072 0.0058 0.0055 0.0051
1,3-DEB 0.0057 0.0093 0.0110 0.0101 0.0118 0.0127 0.0137 0.0140
1,4-DEB 0.0039 0.0052 0.0054 0.0049 0.0055 0.0060 0.0068 0.0069
1,2-DEB 0.0000 0.0000 0.0000 0.0000 0.0000 0.0000 0.0000 0.0000
C 0.0000 0.0085 0.0080 0.0000 0.0000 0.0000 0.0000 0.0000
TEB 0.0217 0.0417 0.0309 0.0228 0.0196 0.0173 0.0156 0.0158
SUM DEB 0.0096 0.0145 0.0164 0.0150 0.0172 0.0187 0.0206 0.0209
SUM Xyl 0.0626 0.0332 0.0235 0.0170 0.0130 0.0105 0.0092 0.0077
Total
100.000
0 100.0000 100.0000 100.0000 100.0000 100.0000 100.0000 100.0000
vii

A3-2 – Concentration of products (mol %) produced over PtH-ZSM-5(80)
catalyst at 370oC
Conversion of ethane-benzene over 1%PtHZSM5(80) catalyst at 370oC.
Feed: 90mol% ethane, 10mol% Benzene
Comments: cat. weight = 0.5002 g
Feed flowrate = Ethane 16 ml/min
Experiment 3.0000
3001.000
0
3002.000
0
3003.000
0
3004.000
0
3005.000
0
3006.000
0
3007.000
0
Temper.,oC 370 0 370 370 370 370 370 370
Tsat, oC 20.0 0.0 20.0 19.5 20.0 20.0 19.5 20.0
TOS, h 1.12 8.13 15.15 22.17 29.17 36.18 43.20 48.00
WHSV, h-1 3.10 3.30 3.30 3.20 3.12 3.16 3.18 3.14
Cont.time,h 0.3226 0.3030 0.3030 0.3125 0.3205 0.3165 0.3145 0.3185
Conv. C2 2.436 1.822 1.569 1.445 1.390 1.336 1.294 1.332
Conv Benz 10.473 11.035 10.728 10.320 10.472 10.270 10.149 10.045
S1(E+B=EB) 16.96 26.53 30.32 32.88 34.54 36.00 35.96 37.68
S2(B=EB) 73.28 83.84 87.52 90.18 91.20 92.42 93.19 93.86
S3(C2=) 3.77 4.81 5.32 5.53 5.81 6.02 6.16 5.93
S4 (H2) 31.12 41.43 46.36 49.18 50.65 51.33 52.78 52.20
Yield Et-Benz 7.675 9.252 9.390 9.307 9.551 9.491 9.458 9.429
H2 1.2039 1.2520 1.2597 1.2656 1.2629 1.2364 1.2571 1.2599
C1 1.2831 0.4978 0.2601 0.1487 0.0820 0.0433 0.0208 0.0100
C2 88.3534 89.1150 89.3214 89.1588 89.3171 89.2837 89.3740 88.8008
C2= 0.1458 0.1455 0.1444 0.1423 0.1449 0.1449 0.1466 0.1430
C3 0.3106 0.1510 0.0965 0.0677 0.0508 0.0394 0.0330 0.0285
C3= 0.0090 0.0047 0.0030 0.0021 0.0017 0.0013 0.0012 0.0000
i-C4 0.0061 0.0040 0.0031 0.0024 0.0019 0.0014 0.0011 0.0010
n-C4 0.0127 0.0098 0.0081 0.0064 0.0052 0.0039 0.0029 0.0022
trans -C4= 0.0009 0.0000 0.0000 0.0000 0.0000 0.0000 0.0000 0.0000
1-C4= 0.0000 0.0000 0.0000 0.0000 0.0000 0.0000 0.0000 0.0000
iso-C4= 0.0016 0.0012 0.0009 0.0000 0.0000 0.0000 0.0000 0.0000
cis-C4= 0.0000 0.0000 0.0000 0.0000 0.0000 0.0000 0.0000 0.0000
C5 0.0000 0.0000 0.0000 0.0000 0.0000 0.0000 0.0000 0.0000
16.1000 0.0000 0.0000 0.0000 0.0000 0.0000 0.0000 0.0000 0.0000
Benzene 7.7778 7.8627 7.9613 8.2677 8.1894 8.3076 8.2442 8.7855
Toluene 0.1755 0.0829 0.0542 0.0373 0.0260 0.0177 0.0120 0.0089
Et-Benzene 0.6561 0.8019 0.8240 0.8462 0.8612 0.8670 0.8565 0.9096
m/p Xylene 0.0038 0.0020 0.0015 0.0011 0.0009 0.0006 0.0005 0.0005
o-Xylene 0.0011 0.0006 0.0005 0.0000 0.0000 0.0000 0.0000 0.0000
iPB 0.0109 0.0173 0.0185 0.0193 0.0201 0.0203 0.0205 0.0215
PB 0.0018 0.0009 0.0005 0.0000 0.0000 0.0000 0.0000 0.0000
Et-Toluene 0.0187 0.0111 0.0112 0.0087 0.0079 0.0066 0.0039 0.0036
viii

A 0.0000 0.0000 0.0000 0.0000 0.0000 0.0000 0.0000 0.0000
B 0.0024 0.0019 0.0009 0.0000 0.0000 0.0000 0.0000 0.0000
1,3-DEB 0.0071 0.0112 0.0111 0.0115 0.0123 0.0120 0.0122 0.0122
1,4-DEB 0.0038 0.0053 0.0060 0.0052 0.0057 0.0062 0.0061 0.0064
1,2-DEB 0.0000 0.0007 0.0000 0.0000 0.0006 0.0000 0.0005 0.0005
C 0.0000 0.0000 0.0000 0.0000 0.0000 0.0000 0.0000 0.0000
TEB 0.0140 0.0207 0.0132 0.0092 0.0096 0.0077 0.0069 0.0060
SUM DEB 0.0109 0.0171 0.0171 0.0166 0.0187 0.0182 0.0187 0.0191
SUM Xyl 0.0049 0.0026 0.0019 0.0011 0.0009 0.0006 0.0005 0.0005
Total
100.000
0 100.0000 100.0000 100.0000 100.0000 100.0000 100.0000 100.0000
ix
A4 – Fortran Programming
The FORTRAN codes given in Appendix A4-1, A4-2, A4-3 and A4-4 were written as part
of the PhD thesis.
The accessibility and self-diffusivity study can be performed by following the steps given:
1. Generating a cubic lattice
a. Open the file PROGRAM Cubic_structure (A1-1)
b. Input the number of LATSIDE required
c. State the number of LATSIZE (LATSIZE=LATSIDE3)
d. Run PROGRAM Cubic_structure
e. The file generated will be stored in the same folder as the program file.
f. The output appears similar to the diagram shown :
2. Generating a ZSM-5 lattice
a. Open the file PROGRAM ZSM_5structure (A1-2)
b. Input the number of LATSIDE required
c. State the number of LATSIZE (LATSIZE=LATSIDE3)
d. Run PROGRAM ZSM_5structure
e. The file generated will be stored in the same folder as the program file.
f. The output appears similar to the diagram shown :
x
3. Accessibility Analysis
a. Open the file PROGRAM MC_ZSM_ACCESSIBILITY (A1-3)
b. Copy the cubic lattice or ZSM-5 lattice file generated (from Step 1 or 2) in
the same folder as the PROGRAM MC_ZSM_ACCESSIBILITY
c. Input LATSIDE, LATSIZE and number of COL and ROW based on the file
generated (cubic/ZSM-5) lattice.
d. Calculate the total volume of straight channel (VS), zig-zag channel (VZ)
and intersection (VI) for the ZSM-5 lattice generated.
e. Set the total volume of coke (VC), then calculate the amount of coke in the
straight channel (VCS), zig-zag channel (VCZ), and intersection (VCI)
based on the probability weighted by their volumes in the real zeolite.
f. Run PROGRAM MC_ZSM_ACCESSIBILITY
g. Repeat step (d) with different volumes of coke.
4. Random Walk
a. Open the file PROGRAM MC_CUBIC_DSELF (A1-4)
b. Copy the ZSM-5 lattice file generated (from Step 2) in the same folder as
the PROGRAM MC_ZSM_ACCESSIBILITY
c. Input the number of LATSIDE required
d. State the number of LATSIZE (LATSIZE=LATSIDE3)
xi

e. Set a value for INOM (between 20 – LATSIZE), and calculate THETA
(THETA=INOM/LATSIZE)
f. Run PROGRAM MC_CUBIC_DSELF
g. Repeat step (d) with different INOM to cover the range of 0≤THETA≤1
xii
A4-1 – Cubic Lattice Generation PROGRAM Cubic_structure
!adsorption sites taken to be on alpha and beta sites IMPLICIT NONE INTEGER I,IR,J,K,DJ,SLICE,ROW,E,W,S,N,U,D,ROW_S,
ROW_E,NM,WM,SM,EM,UM,DMINTEGER, PARAMETER :: LATSIZE=226981,LATSIDE=61,
LATSDX=61,LATSDY=61,LATSDZ=61INTEGER, DIMENSION(LATSIZE,8) :: NODEINTEGER, DIMENSION(0:LATSIZE) :: X,Y,YR,Z,PIXINTEGER, DIMENSION(250) :: CARTX,CARTY,CARTZ ! for a cubic lattice
!'(6I9)' FORMAT(6I9)
OPEN(870, FILE = 'cubic_bond_61')
! memory place holderWRITE(870,'(8I9)') 0,0,0,0,0,0,0,0
SLICE = 0 DO WHILE (SLICE<LATSDX)
SLICE= SLICE+1
! odd numbered slices (connection 1 - slice 1,3,5)
IF (MOD(SLICE,2) ==1) THEN
ROW = 0
DO WHILE (ROW<21) !(ROW<INT((LATSDX*LATSDY)/(2*LATSDX))) ! limit of number of rows per slice
ROW = ROW+1
IF ( ROW == 1) THEN ROW_S =LATSDX*LATSDY*(SLICE-1)+1 ROW_E = ROW_S + (LATSDX-1) ELSE ROW_S =ROW_S+2*LATSDX ROW_E = ROW_S + (LATSDX-1) END IF DO J = ROW_S,ROW_E,2
CALL CONNEX1(N,S,E,W,U,D,NM,SM,EM,WM,UM,DM,J,LATSIZE,LATSIDE)
WRITE(870,'(8I9)') J,NM,SM,EM,WM,DM,UM
END DO END DO END IF
IF (MOD(SLICE,2)==1) THEN
ROW=0
xiii

DO WHILE (ROW<21)
ROW=ROW+1
IF (ROW==1) THEN ROW_S=LATSDX*LATSDY*(SLICE-1)+2 ROW_E=ROW_S+(LATSDX-2)
ELSE ROW_S=ROW_S+(2*LATSDX) ROW_E=ROW_S+(LATSDX-2)
END IF
DO J=ROW_S,ROW_E,2
CALL CONNEX3(EM,WM,J,LATSIZE,LATSDX,LATSDY,LATSDX)
WRITE(870,'(8I9)') J,EM,WM,0,0,0,0
END DO END DO END IF
IF (MOD(SLICE,2)==1) THEN
ROW=0
DO WHILE (ROW<20)
ROW=ROW+1 IF (ROW==1) THEN ROW_S=LATSDX*LATSDY*(SLICE-1)+(LATSDX+1) ROW_E=ROW_S+(LATSDX-1) ELSE ROW_S=ROW_S+(2*LATSDX) ROW_E=ROW_S+(LATSDX-1) END IF
DO J=ROW_S,ROW_E,2
CALL CONNEX4(NM,SM,J,LATSIZE,LATSDX,LATSDY,LATSDX)
WRITE(870,'(8I9)') J,NM,SM,0,0,0,0
END DO END DO END IF
! even numbered slices (2,4,6)
IF (MOD(SLICE,2)==0.AND.SLICE<=LATSDX) THEN
ROW=0
DO WHILE (ROW<21) !(ROW<INT((LATSDX*LATSDY)/(2*LATSDX)))
ROW=ROW+1
xiv
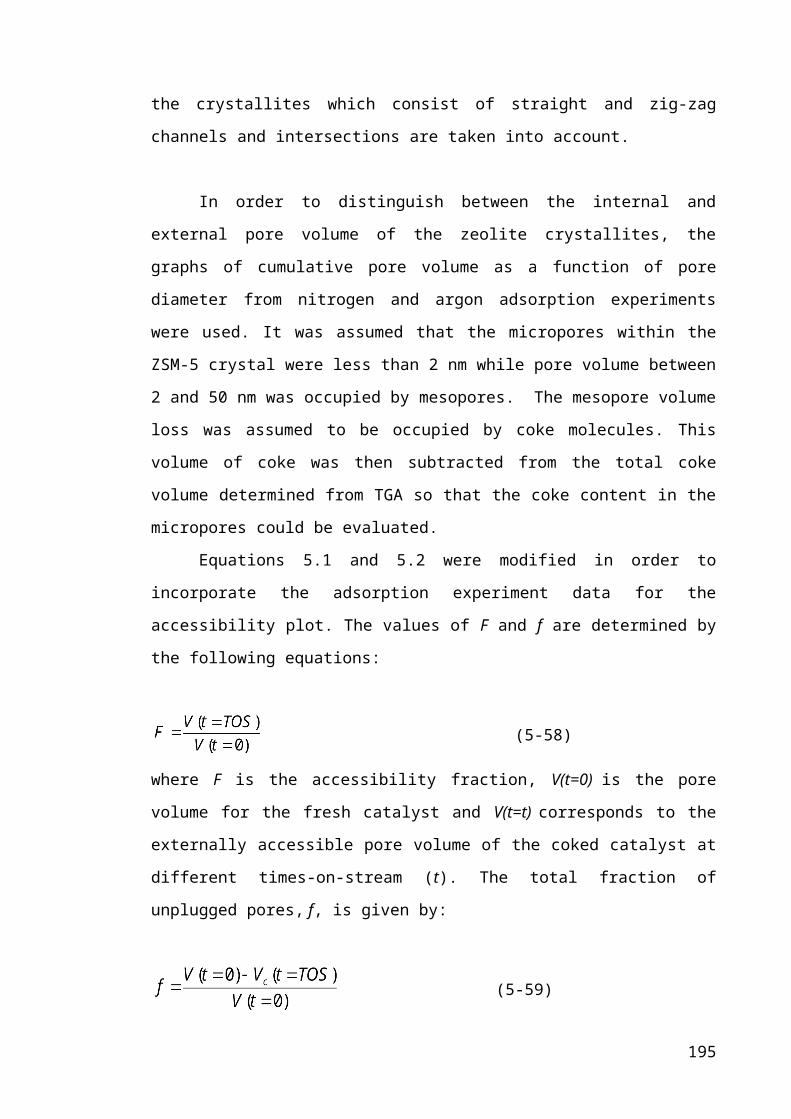
IF (ROW==1) THEN ROW_S =LATSDX*LATSDY*(SLICE-1)+1 ROW_E = ROW_S + (LATSDX-1) ELSE ROW_S =ROW_S+2*LATSDX ROW_E = ROW_S + (LATSDX-1) END IF DO J = ROW_S,ROW_E,2
CALL CONNEX2(U,D,UM,DM,J,LATSIZE,LATSDX,LATSDY,LATSDX)
!PRINT*, SLICE,J,DDM, UPM,0,0 WRITE(870,'(8I9)') J,DM,UM,0,0,0,0, END DO END DOEND IF
END DO
CONTAINS
SUBROUTINE CONNEX1(NO,SO,EA,WE,UP,DD,NOM,SOM,EAM,WEM,UPM,DDM,P,LZ,LD)INTEGER P,NO,EA,SO,WE,UP,DD,NOM,EAM,SOM,
WEM,UPM,DDM,LZ,LD! subroutine to determine neighbouring pixels
IF(MOD(P,(LD**2)).GT.(LD**2-LD)) THEN NO=0ELSE IF(MOD(P,(LD**2)).EQ.0) THEN NO=0ELSE NO=P+(2*LD)ENDIF
IF(MOD(P,(LD**2)).GT.(LD**2-LD)) THEN NOM=0ELSE IF(MOD(P,(LD**2)).EQ.0) THEN NOM=0ELSE NOM=P+(LD)ENDIF
IF ((MOD(P,LD)).EQ.0) THEN EA=0ELSE EA=P+2ENDIF
IF ((MOD(P,LD)).EQ.0) THEN EAM=0ELSE EAM=P+1 ENDIF
IF ((MOD(P,LD)).EQ.1) THEN WE=0
xv
ELSE WE=P-2 ENDIF
IF ((MOD(P,LD)).EQ.1) THEN WEM=0ELSE WEM=P-1 ENDIF
IF(((MOD(P,(LD**2))).LE.LD).AND.((MOD(P,(LD**2))).NE.0))THEN SO=0 ELSE SO=P-(2*LD)ENDIF
IF(((MOD(P,(LD**2))).LE.LD).AND.((MOD(P,(LD**2))).NE.0))THEN SOM=0 ELSE SOM=P-LDENDIF
IF(P.GT.(LZ-(LD**2))) THEN UP=0ELSE UP=P+(2*(LD**2))ENDIF
IF(P.GT.(LZ-(LD**2))) THEN UPM=0ELSE UPM=P+(LD**2)ENDIF
IF(P.LE.(LD**2)) THEN DD=0ELSE DD=P-(2*(LD**2))ENDIF
IF(P.LE.(LD**2)) THEN DDM=0ELSE DDM=P-(LD**2)ENDIF
END SUBROUTINE CONNEX1
! even numbered slices
SUBROUTINE CONNEX2(UP,DD,UPM,DDM,P,LZ,LDX,LDY,LDZ)INTEGER P,UP,DD,UPM,DDM,LZ,LDX,LDY,LDZ
IF(P.GT.(LZ-(2*LDX*LDY))) THEN
UP = 0 ! periodic boundary -topELSE UP=P+(2*LDX*LDY)ENDIF
IF(P.GT.(LZ-(LDX*LDY))) THEN
xvi

UPM = 0 ! periodic boundary -top ELSE UPM =P+(LDX*LDY)ENDIF
IF(P.LE.(2*LDX*LDY)) THEN DD= 0ELSE DD=P+(2*LDX*LDY)ENDIF
IF(P.LE.(LDX*LDY)) THEN DDM= 0ELSE DDM=P-(LDX*LDY)ENDIF
END SUBROUTINE CONNEX2
! mid points for the odd number slice
SUBROUTINE CONNEX3(EAM,WEM,P,LZ,LDX,LDY,LDZ)INTEGER P,EAM,WEM,LZ,LDX,LDY,LDZ
IF ((MOD(P,LDX)).EQ.0) THEN
EAM=0ELSE EAM=P+1 ENDIF
IF ((MOD(P,LDX)).EQ.1) THEN WEM=0ELSE WEM=P-1 ENDIF
END SUBROUTINE CONNEX3
SUBROUTINE CONNEX4(NOM,SOM,P,LZ,LDX,LDY,LDZ)
INTEGER P,NOM,SOM,LZ,LDX,LDY,LDZ IF(MOD(P,(LDX**2)).GT.(LDX**2-LDX)) THEN
NOM=0ELSE IF(MOD(P,(LDX**2)).EQ.0) THEN NOM=0ELSE NOM=P+(LDX)ENDIF
IF(((MOD(P,(LDX**2))).LE.LDX).AND.((MOD(P,(LDX**2))).NE.0))THEN SOM=0 ELSE SOM=P-LDXENDIFEND SUBROUTINE CONNEX4
END PROGRAM Cubic_structure
xvii
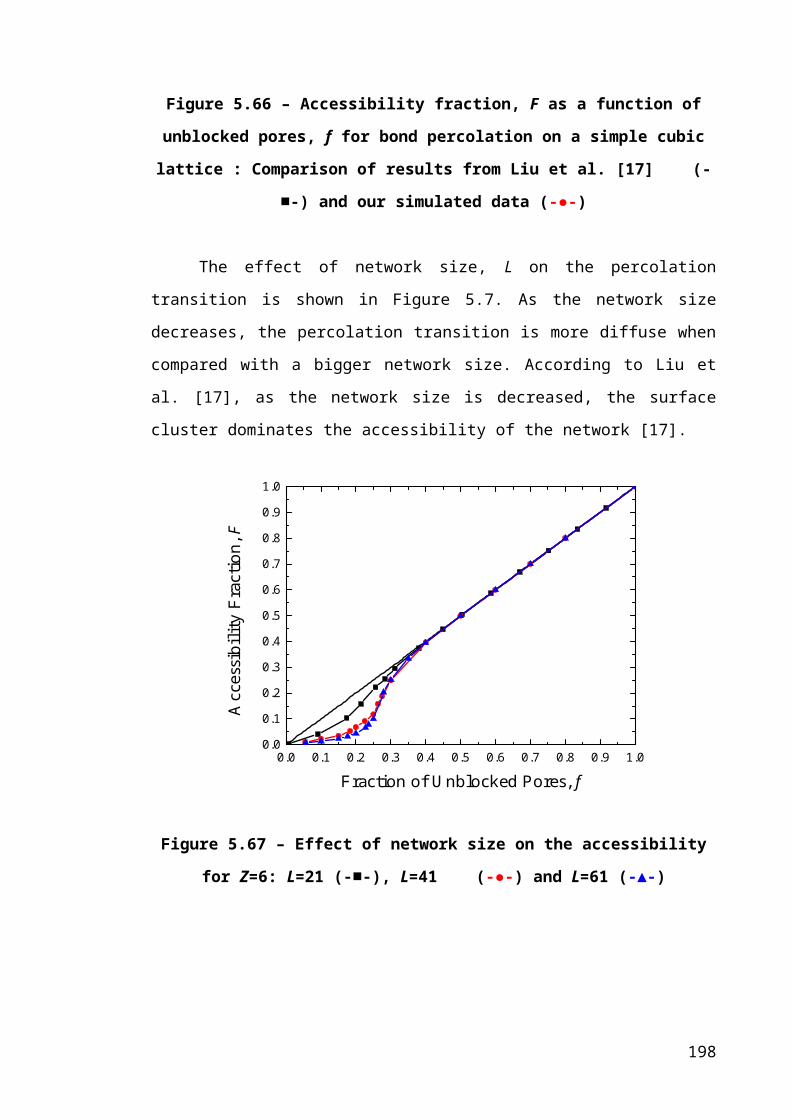
A4-2 – ZSM-5 Lattice Generation PROGRAM ZSM_5structure!adsorption sites taken to be on alpha and beta sites IMPLICIT NONE INTEGER I,IR,J,K,DJ,SLICE,ROW,NE,NW,SE,SW,UP,DD,
ROW_S,ROW_E,NEM,NWM,SEM,SWM,UPM,DDMINTEGER, PARAMETER :: LATSIZE=884736,LATSDX=96,
LATSDY=96,LATSDZ=96INTEGER, DIMENSION(884736,4) :: NODEINTEGER, DIMENSION(0:LATSIZE) :: X,Y,YR,Z,PIX
!'(6I9)' FORMAT(6I9)
OPEN(870, FILE = 'ZSM5_structure_96')
! memory place holder WRITE(870,'(6I9)') 0,0,0,0,0,0
SLICE = 0 DO WHILE (SLICE<LATSDX)
SLICE= SLICE+1
! odd numbered slices (connection 1 - slice 1,5,9)
IF (MOD(SLICE,4) ==1) THEN
ROW = 0 DO WHILE (ROW<INT((LATSDX*LATSDY)/(4*LATSDX))) ! limit of number of rows per slice
ROW = ROW+1
IF ( ROW == 1) THEN ROW_S =LATSDX*LATSDY*(SLICE-1)+1 ROW_E = ROW_S + (LATSDX-1) ELSE ROW_S =ROW_S+4*LATSDX ROW_E = ROW_S + (LATSDX-1) END IF DO J = ROW_S,ROW_E,4
CALL CONNEX1(NE,NEM,NW,NWM,UP,UPM,DD,DDM,J,LATSIZE,LATSDX,LATSDY,LATSDX)
IF(J.LE.(LATSDX*LATSDY)) THEN ! periodic boundary - base CALL CONNEX3(UP,UPM,DD,DDM,J,LATSIZE,LATSDX,LATSDY,LATSDX) END IF NODE(J,1) = NWM NODE(J,2) = NEM NODE(J,3) = DDM NODE(J,4) = UPM
!PRINT*, SLICE,J,NWM,NEM,DDM,UPM
xviii
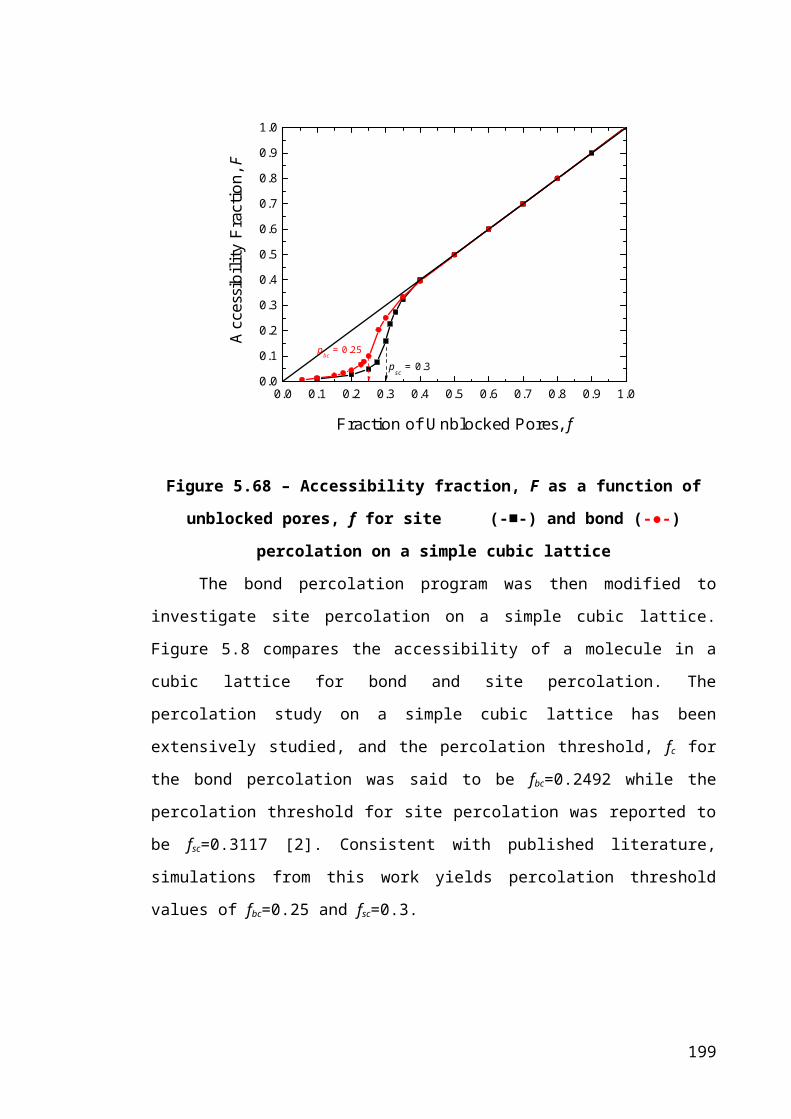
WRITE(870,'(6I9)') J,SLICE,NWM,NEM,DDM,UPM
END DO END DOEND IF
! odd numbered slices (connection 2 - slice 1,5,9) - neighbours for position NE/NW of P
! sites are actually determined as if they were SW/SE of J
IF (MOD(SLICE,4) ==1) THEN
ROW = 0
DO WHILE (ROW<INT((LATSDX*LATSDY)/(4*LATSDX)))
ROW = ROW+1
IF ( ROW == 1) THEN ROW_S =LATSDX*LATSDY*(SLICE-1)+ (2*LATSDX+3) ROW_E = ROW_S + (LATSDX-3) ELSE ROW_S =ROW_S+4*LATSDX ROW_E = ROW_S + (LATSDX-3)
END IF DO J = ROW_S,ROW_E,4
CALL
CONNEX2(SE,SEM,SW,SWM,UP,UPM,DD,DDM,J,LATSIZE,LATSDX,LATSDY,LATSDX)
IF(J.LE.(LATSDX*LATSDY)) THEN ! periodic boundary - base
CALL CONNEX3 (UP,UPM ,DD,DDM,J,LATSIZE,LATSDX,LATSDY,LATSDX)
END IF !PRINT*, SLICE,J,SWM,SEM,DDM,UPM
WRITE(870,'(6I9)') J,SLICE,SWM,SEM,DDM,UPM
END DO END DOEND IF
! zig zag channel sites neighbours
! NEM and SWM neighboursIF (MOD(SLICE,4) ==1) THEN
ROW = 0
DO WHILE (ROW<INT((LATSDX*LATSDY)/(4*LATSDX))) ! limit of number of rows per slice
ROW = ROW+1
IF ( ROW == 1) THEN ROW_S =LATSDX*LATSDY*(SLICE-1)+LATSDX+2 ROW_E = ROW_S + (LATSDX-2)
xix

ELSE ROW_S =ROW_S+4*LATSDX ROW_E = ROW_S + (LATSDX-2) END IF DO J = ROW_S,ROW_E,4 CALL CONNEX4(NEM,NWM,SEM,SWM,J,LATSIZE,LATSDX,LATSDY,LATSDX)
!PRINT*, SLICE,J,SWM,NEM,NWM,SEM WRITE(870,'(6I9)') J,SLICE,SWM,NEM,NWM,SEM
END DO END DOEND IF
! NWM and SEM neighbours IF (MOD(SLICE,4) ==1) THEN
ROW = 0
DO WHILE (ROW<INT((LATSDX*LATSDY)/(4*LATSDX))) ! limit of number of rows per slice
ROW = ROW+1
IF ( ROW == 1) THEN ROW_S =LATSDX*LATSDY*(SLICE-1)+LATSDX+4 ROW_E = ROW_S + (LATSDX-3) ELSE ROW_S =ROW_S+4*LATSDX ROW_E = ROW_S + (LATSDX-3) END IF DO J = ROW_S,ROW_E,4
CALL CONNEX5(NEM,NWM,SEM,SWM,J,LATSIZE,LATSDX,LATSDY,LATSDX) !PRINT*, SLICE,J,NWM,SEM,NEM,SWM
WRITE(870,'(6I9)') J,SLICE,NWM,SEM,NEM,SWM END DO
END DOEND IF
! odd numbered slices (connection 2 - slice 3,7)
IF (MOD(SLICE,4) ==3) THEN
ROW = 0
DO WHILE (ROW<INT((LATSDX*LATSDY)/(4*LATSDX)))
ROW = ROW+1
IF ( ROW == 1) THEN ROW_S =LATSDX*LATSDY*(SLICE-1)+1 ROW_E = ROW_S + (LATSDX-1) ELSE ROW_S =ROW_S+4*LATSDX
xx

ROW_E = ROW_S + (LATSDX-1) END IF DO J = ROW_S,ROW_E,4 CALL CONNEX2(SE,SEM,SW,SWM,UP,UPM,DD,DDM,J,LATSIZE,LATSDX,LATSDY,
LATSDX)
!PRINT*, SLICE,J,SWM,SEM,DDM,UPM WRITE(870,'(6I9)') J,SLICE,SWM,SEM,DDM,UPM
END DO END DOEND IF
! odd numbered slices (connection 2 - slice 3,7) - neighbours for position SE/SW of P
IF (MOD(SLICE,4) ==3) THEN
ROW = 0
DO WHILE (ROW<INT((LATSDX*LATSDY)/(4*LATSDX)))
ROW = ROW+1
IF ( ROW == 1) THEN ROW_S =LATSDX*LATSDY*(SLICE-1)+(2*LATSDX+3) ROW_E = ROW_S + (LATSDX-3) ELSE ROW_S =ROW_S+4*LATSDX ROW_E = ROW_S + (LATSDX-3) END IF DO J = ROW_S,ROW_E,4
CALL CONNEX1(NE,NEM,NW,NWM,UP,UPM,DD,DDM,J,LATSIZE,LATSDX,LATSDY,LATSDX)
!PRINT*, SLICE,J,NWM,NEM,DDM,UPM
WRITE(870,'(6I9)') J,SLICE,NWM,NEM,DDM,UPM
END DO END DOEND IF
! zig zag channel sites neighbours
! NWM and SEM neighboursIF (MOD(SLICE,4) ==3) THEN
ROW = 0
DO WHILE (ROW<INT((LATSDX*LATSDY)/(4*LATSDX)))
ROW = ROW+1
IF ( ROW ==1) THEN ROW_S =LATSDX*LATSDY*(SLICE-1)+(LATSDX*3+2) ROW_E = ROW_S + (LATSDX-1)
xxi
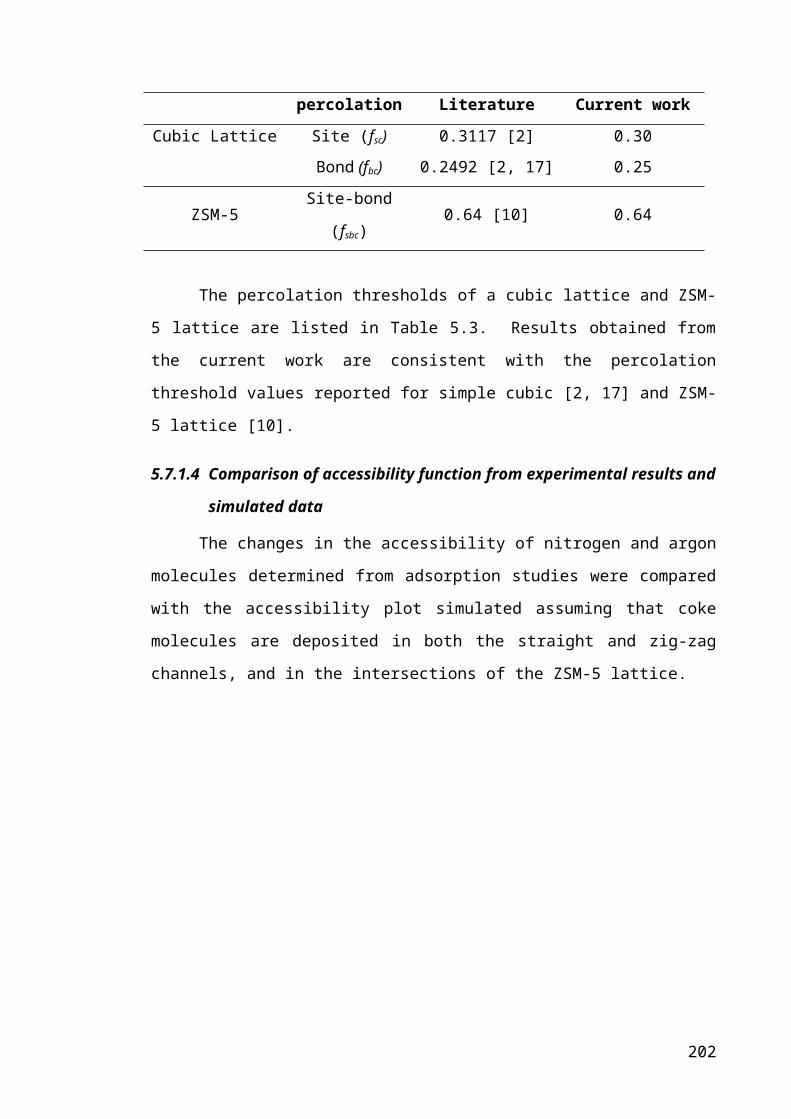
ELSE ROW_S =ROW_S+4*LATSDX ROW_E = ROW_S + (LATSDX-1) END IF DO J = ROW_S,ROW_E,4
CALL CONNEX5(NEM,NWM,SEM,SWM,J,LATSIZE,LATSDX,LATSDY,LATSDX) !PRINT*, SLICE,J,SEM,NWM,NEM,SWM
WRITE(870,'(6I9)') J,SLICE,NWM,SEM,NEM,SWM
END DO END DOEND IF
! NEM and SWM neighboursIF (MOD(SLICE,4) ==3) THEN
ROW = 0
DO WHILE (ROW<INT((LATSDX*LATSDY)/(4*LATSDX)))
ROW = ROW+1
IF ( ROW ==1) THEN ROW_S =LATSDX*LATSDY*(SLICE-1)+(LATSDX*3+4) ROW_E = ROW_S + (LATSDX-4) ELSE ROW_S =ROW_S+4*LATSDX ROW_E = ROW_S + (LATSDX-4) END IF DO J = ROW_S,ROW_E,4
CALL CONNEX4(NEM,NWM,SEM,SWM,J,LATSIZE,LATSDX,LATSDY,LATSDX)
!PRINT*, SLICE,J,SWM,NEM,NWM,SEMWRITE(870,'(6I9)') J,SLICE,SWM,NEM,NWM,SEM
END DO END DOEND IF
! even numbered slices - intermediates (up and down connection)
IF (MOD(SLICE,2) ==0 .AND. SLICE<=LATSDX) THEN
ROW = 0
DO WHILE (ROW<INT((LATSDX*LATSDY)/(4*LATSDX))) ROW = ROW+1
IF ( ROW == 1) THEN !ROW_S =LATSDX*LATSDY*(SLICE-1)+LATSDX+1 ROW_S =LATSDX*LATSDY*(SLICE-1)+1 ROW_E = ROW_S + (LATSDX-1) ELSE ROW_S =ROW_S+4*LATSDX
xxii
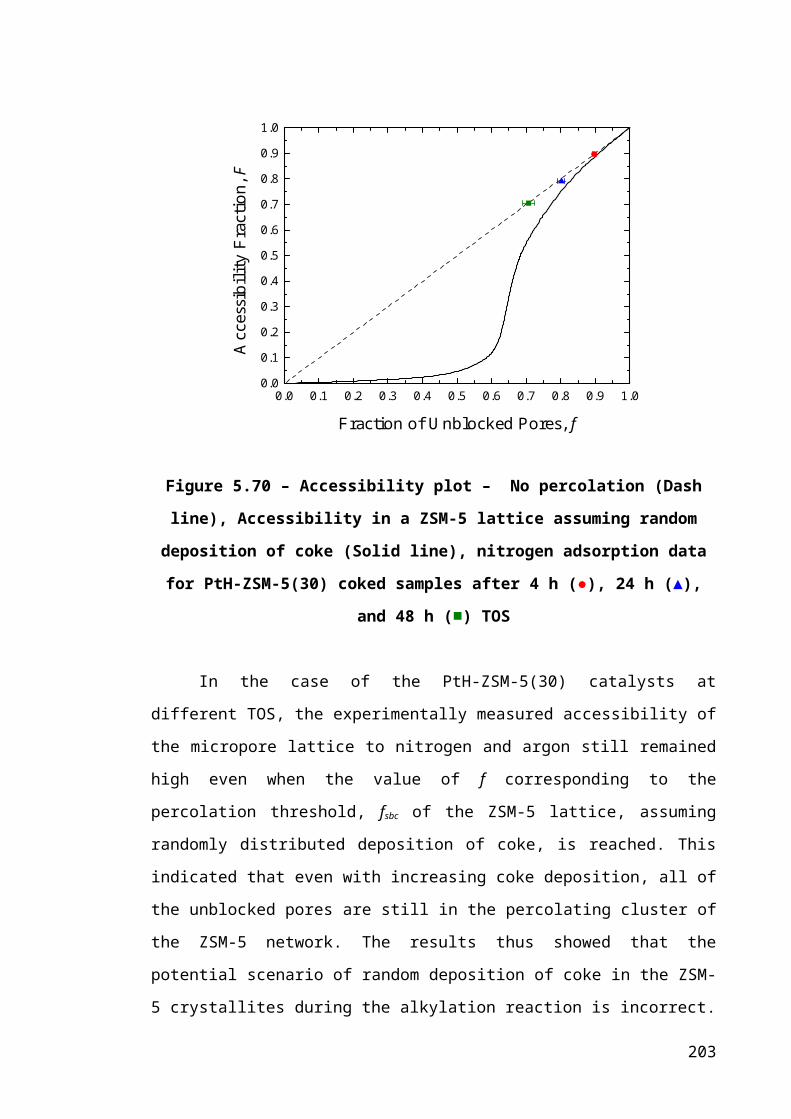
ROW_E = ROW_S + (LATSDX-1) END IF DO J = ROW_S,ROW_E,4
CALL CONNEX3(UP,UPM,DD,DDM,J,LATSIZE,LATSDX,LATSDY,LATSDX)
!PRINT*, SLICE,J,DDM, UPM,0,0 WRITE(870,'(6I9)') J,SLICE,DDM, UPM,0,0
END DO END DOEND IF
! even numbered slices - intermediates (up and down connection 4 NW/NE neighbours of P)
IF (MOD(SLICE,2) ==0 .AND. SLICE<=LATSDX) THEN
ROW = 0
DO WHILE (ROW<INT((LATSDX*LATSDY)/(4*LATSDX)))
ROW = ROW+1
IF ( ROW == 1) THEN ROW_S =LATSDX*LATSDY*(SLICE-1)+(2*LATSDX+3) ROW_E = ROW_S + (LATSDX-3) ELSE ROW_S =ROW_S+4*LATSDX ROW_E = ROW_S + (LATSDX-3) END IF DO J = ROW_S,ROW_E,4
CALL CONNEX3(UP,UPM,DD,DDM,J,LATSIZE,LATSDX,LATSDY,LATSDX) !PRINT*, SLICE,J,DDM, UPM,0,0
WRITE(870,'(6I9)') J,SLICE,DDM, UPM,0,0
END DO END DOEND IF
END DO
CLOSE(870) CONTAINS
SUBROUTINE CONNEX1(NNE,NNEM,NNW,NNWM,UUP,UUPM,DDD,DDDM,P,LZ,LDX,LDY,LDZ)
INTEGER NNE,NNEM,NNW,NNWM,UUP,UUPM,DDD,DDDM,P,LZ,LDX,LDY,LDZ INTEGER, DIMENSION(0:LATSIZE) :: PIXX
IF ((MOD(P,(LDX*LDY)))== 0) THEN NNW=0 !flag 4 appropriate periodic boundary ELSE IF ((MOD(P,LDX))== 1) THEN
xxiii
NNW= 0 !P+(2*LDY-1) !periodic boundary for the edge ELSE IF ((MOD(P,LDX))== 2) THEN
NNW=0 !flag 4 appropriate periodic boundary ELSE IF(MOD(P,(LDX*LDY))> (LDX*LDY-2*LDX)) THEN NNW=0ELSE IF((MOD(P,LDX)) /= 1) THEN NNW=P+2*LDY-2 ENDIF
IF ((MOD(P,(LDX*LDY)))== 0) THEN NNWM=0ELSE IF ((MOD(P,LDX))== 1) THEN NNWM=0 !P+(2*LDY-1) !edge 1 periodic boundaryELSE IF(MOD(P,(LDX*LDY))> (LDX*LDY-LDX)) THEN NNWM=0ELSE IF((MOD(P,LDX)) /= 1) THEN NNWM=P+LDY-1ENDIF
IF ((MOD(P,LDX))==0) THEN NNE= P-(2*LDY-1)ELSE IF(MOD(P,(LDX*LDY))> (LDX*LDY-2*LDX)) THEN NNE=0
ELSE IF ((MOD(P,LDX))==(LDX-1)) THEN NNE=0ELSE NNE=P+2*LDY+2ENDIF
IF ((MOD(P,LDX))==0) THEN NNEM=0ELSE IF(MOD(P,(LDX*LDY))> (LDX*LDY-LDX)) THEN NNEM=0ELSE NNEM=P+LDY+1ENDIF
IF(P.GT.(LZ-(2*LDX*LDY))) THEN UUP = 0ELSE UUP=P+(2*LDX*LDY)ENDIF
IF(P.GT.(LZ-(LDX*LDY))) THEN UUPM = 0ELSE UUPM =P+(LDX*LDY)ENDIF
IF(P.LE.(2*LDX*LDY)) THEN DDD= 0
ELSE DDD=P-(2*LDX*LDY)ENDIF
IF(P.LE.(LDX*LDY)) THEN DDDM= 0ELSE DDDM=P-(LDX*LDY)ENDIF
xxiv
END SUBROUTINE CONNEX1
SUBROUTINE CONNEX2(SSE,SSEM,SSW,SSWM,UUP,UUPM,DDD,DDDM,P,LZ,LDX,LDY,LDZ)
INTEGER SSE,SSEM,SSW,SSWM,UUP,UUPM,DDD,DDDM,P,LZ,LDX,LDY,LDZ INTEGER, DIMENSION(0:LATSIZE) :: PIXX
IF ((MOD(P,(LDX*LDY)))== 0) THEN SSW=P-2*LDY-2ELSE IF ((MOD(P,LDX))== 1) THEN SSW=0
ELSE IF ((MOD(P,LDX))== 2) THEN SSW=0
ELSE IF ((MOD(LDX*LDY-LDX+P,LDX*LDY))==0) THEN SSW=0
ELSE IF(MOD(P,(LDX*LDY))<= 2*LDX) THEN SSW=0ELSE SSW=P-2*LDY-2ENDIF
IF ((MOD(P,LDX))== 1 .AND. MOD(P,(LDX*LDY))==1) THEN SSWM= 0 !P+ (LDX*LDY-1) !periodic boundary for first point of odd # planes
ELSE IF ((MOD(P,LDX))== 1) THEN SSWM= 0 !P-1 !periodic boundary for edge 1
ELSE IF ((MOD(P,LDX))== 1) THEN SSWM=0
ELSE IF ((MOD(LDX*LDY-LDX+P,LDX*LDY))==0) THEN SSWM=0
ELSE IF(MOD(P,(LDX*LDY))<LDX) THENSSWM= 0 !P+ (LDX*LDY-(LDX+1)) !periodic boundary for edge 3ELSE SSWM=P-LDY-1ENDIF
IF ((MOD(P,LDX))==0) THEN SSE=0
ELSE IF ((MOD(P,LDX))==(LDX-1)) THEN SSE=0ELSE IF(MOD(P,(LDX*LDY))<=2*LDX) THEN SSE=0ELSE SSE=P-2*LDY+2ENDIF
IF ((MOD(P,LDX))==0) THEN SSEM=0ELSE IF(MOD(P,(LDX*LDY))<LDX) THEN SSEM= 0 !P+ (LDX*LDY-(LDX-1)) !periodic boundary for edge 3ELSE SSEM=P-LDY+1
xxv
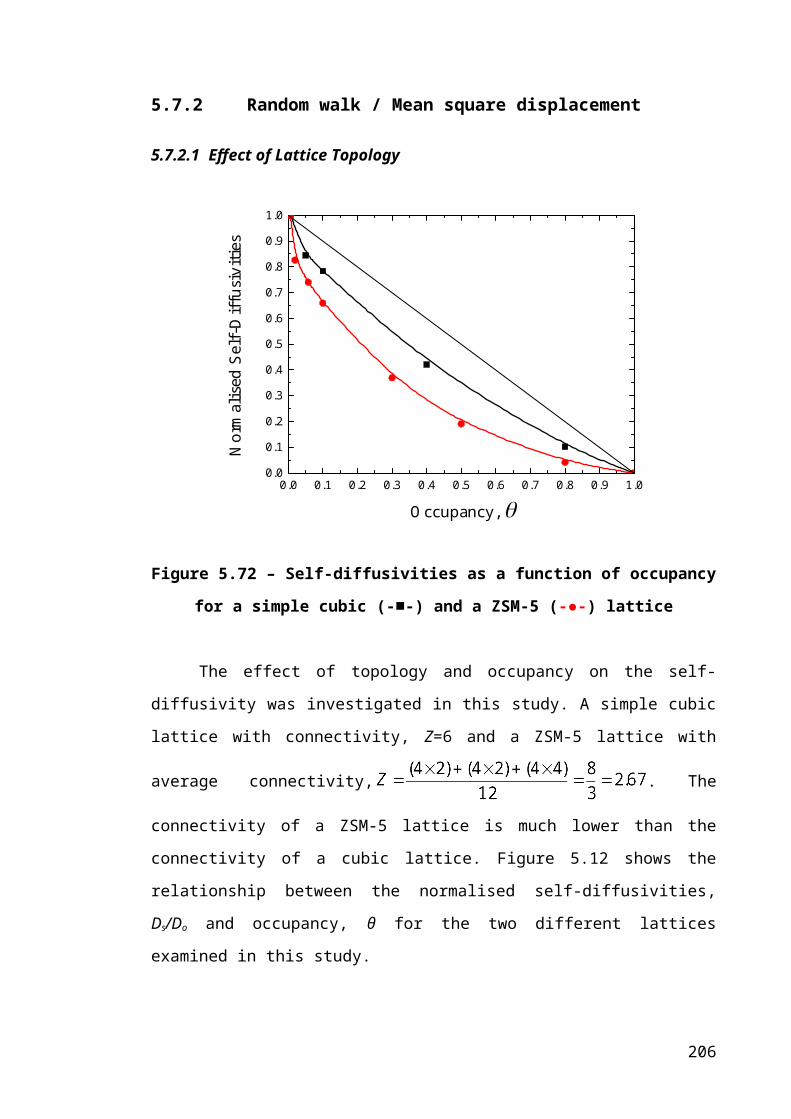
ENDIF
IF(P.GT.(LZ-(2*LDX*LDY))) THEN UUP = 0ELSE UUP=P+(2*LDX*LDY)ENDIF
IF(P.GT.(LZ-(LDX*LDY))) THEN UUPM = 0ELSE UUPM =P+(LDX*LDY)ENDIF
IF(P.LE.(2*LDX*LDY)) THEN DDD= 0ELSE DDD=P-(2*LDX*LDY)ENDIF
IF(P.LE.(LDX*LDY)) THEN DDDM= 0ELSE DDDM=P-(LDX*LDY)ENDIF
END SUBROUTINE CONNEX2
! straight channel sites neighbours SUBROUTINE CONNEX3(UUP,UUPM,DDD,DDDM,P,LZ,LDX,LDY,LDZ)
INTEGER UUP,UUPM,DDD,DDDM,P,LZ,LDX,LDY,LDZ INTEGER, DIMENSION(0:LATSIZE) :: PIXX
IF(P.GT.(LZ-(2*LDX*LDY))) THEN UUP = 0 !P-LDX*LDY*(LDX-1) ! periodic boundary -topELSE UUP=P+(2*LDX*LDY)ENDIF
IF(P.GT.(LZ-(LDX*LDY))) THEN UUPM = 0 !P-LDX*LDY*(LDX-1) ! periodic boundary -top ELSE UUPM =P+(LDX*LDY)ENDIF
IF(P.LE.(2*LDX*LDY)) THEN DDD= 0 !P+LDX*LDY*(LDX-1)ELSE DDD=P+(2*LDX*LDY)ENDIF
IF(P.LE.(LDX*LDY)) THEN DDDM= 0 !P+LDX*LDY*(LDX-1)ELSE DDDM=P-(LDX*LDY)ENDIF
END SUBROUTINE CONNEX3
xxvi
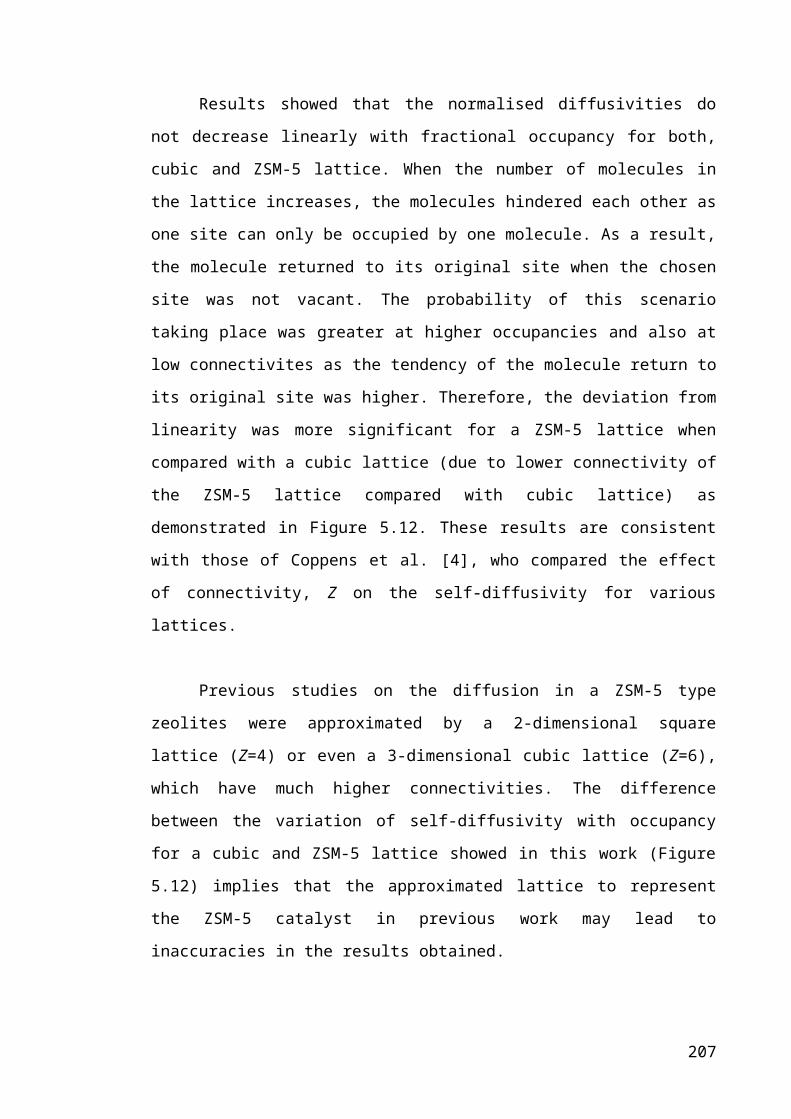
SUBROUTINE CONNEX4(NNEM,NNWM,SSEM,SSWM,P,LZ,LDX,LDY,LDZ)INTEGER NNEM,NNWM,SSEM,SSWM,P,LZ,LDX,LDY,LDZ
INTEGER, DIMENSION(0:LATSIZE) :: PIXX
NNWM = 0SSEM = 0
IF((MOD(P,(LDX*LDY)))==0 ) THEN NNEM= 0 !P-(LDX*LDY-1) !highest # in a slice periodic boundary
ELSE IF ((MOD(P,LDX))==0) THEN ! edge 2 periodic boundary !NNEM= P-(LDY*2-1) NNEM= 0 !P+1
ELSE IF((MOD(P,(LDX*LDY)))> (LDX*LDY-LDX)) THEN
NNEM= 0 !P-(LDX*LDY-(LDX+1)) !edge 4 periodic boundary
ELSE IF(MOD(P,(LDX*LDY))> (LDX*LDY-2*LDX)) THEN NNEM = 0ELSE NNEM=P+LDY+1ENDIF
IF ((MOD(P,LDX))== 1) THEN ! edge 1 periodic boundary SSWM = 0! P+(LDY*2-1)
ELSE SSWM=P-(LDY+1)ENDIF
END SUBROUTINE CONNEX4
SUBROUTINE CONNEX5(NNEM,NNWM,SSEM,SSWM,P,LZ,LDX,LDY,LDZ)INTEGER NNEM,NNWM,SSEM,SSWM,P,LZ,LDX,LDY,LDZ
INTEGER, DIMENSION(0:LATSIZE) :: PIXX
NNEM = 0SSWM = 0
IF((MOD(P,(LDX*LDY)))> (LDX*LDY-LDX)) THEN
NNWM= 0 !P-(LDX*LDY-(LDX-1)) !edge 4 periodic boundary ELSE NNWM=P+LDY-1ENDIF
IF ((MOD(P,LDX))==0) THEN ! edge 2 periodic boundary SSEM= 0! P-(2*LDY-1)
ELSE IF ((MOD(P,LDX))== 1) THEN SSEM = 0 !flag demand appropriate periodic boundary
ELSE SSEM=P-(LDY-1)ENDIF
END SUBROUTINE CONNEX5
xxvii
END PROGRAM ZSM_5structure
xxviii

A4-3 – ZSM-5 Accessibility Program PROGRAM MC_ZSM_ACCESSIBILITY IMPLICIT NONE INTEGER I,J,K,N,E,S,W,U,D,RAND,LPSTART,LPEND,LPCOUNT,RCOUNT,RLIM,OP,NP,H_DIR, N_DIR,LDX,LDY,LDZ,M,VI,VS,VZ,ICOUNT,SCOUNT,ZCOUNTINTEGER, PARAMETER :: COL=6,ROW=165888,LATSIZE=884736,LATSIDE=96,LDX=96,LDY=96INTEGER, DIMENSION(COL,ROW) :: NODE,SSTREAL SEED,VP, VC, VINT,VSTR,VZZ,VOPEN,VCI,VCS,VCZ
SEED = 0.986 !0.009547!0.9106!0.000047286275 VINT = 2.68E-22 !2.01E-22 VSTR = 1.09E-22 !8.198E-23 VZZ = 1.46E-22 !1.09E-22
VP = 2.89E-17 !VC = 8.45E-21 OPEN(900, FILE = 'ZSM5_structure_96') OPEN(910, FILE = 'cubic_results_12') OPEN(911, FILE = 'cubic_boundary') OPEN(912, FILE = 'cubic_lattice') OPEN(913, FILE = 'cubic_lattice_2') OPEN(914, FILE = 'percolation_results')
! read cubic lattice nodes and their neighbours READ(900,*) NODE
DO J=1,COL DO I=1, ROW !DO I=1,LATSIZE
SST(J,I) = 0 !SST(N_HOP,I) !PRINT*, J,I,SST(J,I)
!WRITE(910,*) J,I,SST(J,I) END DO
END DO
! random blocking of sites in the lattice
LPCOUNT = 0 RCOUNT = 0 ICOUNT = 0 SCOUNT = 0 ZCOUNT = 0 VCI = 4.767E-18 !1.39E-20 VCS = 1.943E-18 VCZ = 2.589E-18
DO WHILE (VCI.GT.0) !DO WHILE (LPCOUNT<=(10)) RCOUNT= RCOUNT+1
CALL RANDOM_POS(SEED)
LPSTART=1 LPEND=ROW
xxix
!IF ((SEED.LE.0.513).AND.(SEED.GT.0)) THEN
RAND = (1+INT(ROW*SEED)) !PRINT*, 'INTERSECTION' IF ((MOD(NODE(2,RAND),2)==1).AND.NODE(6,RAND)/=0) THEN
CALL MOL_BLOCK1 (LPSTART,LPEND,RAND,SST,VCI,NODE,VINT,LPCOUNT,ICOUNT) ! FOR INTERSECTIONS
END IF
END DO
DO WHILE (VCS.GT.0) RCOUNT= RCOUNT+1
CALL RANDOM_POS(SEED)
LPSTART=1 LPEND=ROW
!ELSE IF ((SEED.LE.0.722).AND.(SEED.GT.0.513)) THEN
RAND = (1+INT(ROW*SEED)) !PRINT*, 'STRAIGHT'
IF ((MOD(NODE(2,RAND),2)==0).AND.NODE(5,RAND)==0.AND.NODE(6,RAND)==0) THEN CALL MOL_BLOCK2 (LPSTART,LPEND,RAND,SST,VCS,NODE,VSTR,LPCOUNT,SCOUNT) ! FOR STRAIGHT CHANNELS
END IF
END DO
DO WHILE (VCZ.GT.0) RCOUNT= RCOUNT+1
CALL RANDOM_POS(SEED)
LPSTART=1 LPEND=ROW !ELSE IF ((SEED.LE.1).AND.(SEED.GT.0.722)) THEN
RAND = (1+INT(ROW*SEED))
IF ((MOD(NODE(2,RAND),2)==1).AND.NODE(5,RAND)==0.AND.NODE(6,RAND)==0) THEN CALL MOL_BLOCK3 (LPSTART,LPEND,RAND,SST,VCZ,NODE,VZZ,LPCOUNT,ZCOUNT) ! FOR ZIG-ZAG CHANNELS
END IF
!END IF
END DO
! calculate f, fraction of unplugged pores - without percolation effects
xxx
VC= 9.3E-18 VP = 2.89E-17
VOPEN=VP-VC PRINT*, VP, VC, VOPEN !set boundaries of adsorbate molecules
DO I= 1, ROW IF ((MOD(NODE(1,I),LDX)==1).AND.SST(1,I)==0.AND.MOD(NODE(2,I),2)==1) THEN SST (1,I)=2 ELSE IF ((MOD(NODE(1,I),(LDX*LDY))<LDX).AND.SST(1,I)==0.AND.MOD(NODE(2,I),2)==1) THEN SST (1,I) =2
ELSE IF ((MOD(NODE(1,I),(LDX*LDY))>(LDX*LDY-LDX)).AND.SST(1,I)==0.AND.MOD(NODE(2,I),2)==1) THEN SST (1,I) =2 END IF !PRINT*, I, NODE(1,I), SST(1,I) WRITE (911,*) I, SST(1,I), NODE(1,I) END DO
! set neighbours to the right sst DO I=1,ROW
IF (SST(1,I)==2) THEN
CALL ADJ_SITES(N,E,S,W,I,NODE,SST)
WRITE (912,*) I, NODE(1,I),SST(1,I),SST(3,I),SST(4,I),SST(5,I),SST(6,I)
ELSE
CALL ADJ_SITES(N,E,S,W,I,NODE,SST) WRITE (912,*) I, NODE(1,I),SST(1,I),SST(3,I),SST(4,I),SST(5,I),SST(6,I)
END IF
END DO
! move molecules inwards
RCOUNT=0 DO WHILE (RCOUNT.LE.90)
DO I=1,ROW
!PRINT*, I,SST(1,I),SST(2,I),SST(3,I),SST(4,I),SST(5,I)
!CALL ADJ_SITES2(N,E,S,W,U,D,I,NODE,SST)
IF (SST(1,I)==0) THEN
CALL ADJ_SITES2(N,E,S,W,I,NODE,SST)
xxxi

ELSE IF (SST(1,I)==2) THEN
CALL ADJ_SITES3(N,E,S,W,I,NODE,SST)
END IF
END DO
RCOUNT=RCOUNT+1 PRINT*, RCOUNT END DO DO I=1,ROW
IF (SST(1,I)==2) THEN
CALL ADJ_SITES(N,E,S,W,I,NODE,SST)
ELSE IF (SST(1,I)==0) THEN
CALL ADJ_SITES(N,E,S,W,I,NODE,SST)
END IF WRITE (913,*) I, NODE(1,I),SST(1,I),SST(3,I),SST(4,I),SST(5,I),SST(6,I) END DO
!taking into account percolation effect
VI=0 VS=0 VZ=0 DO I=1,ROW
IF (SST(1,I)==2) THEN
IF (MOD(NODE(1,I),2)==1.AND.NODE(6,I)/=0) THEN VI=VI+1
ELSE IF (MOD(NODE(1,I),2)==0.AND.NODE(5,I)==0.AND.NODE(6,I)==0) THEN
VS=VS+1
ELSE IF (MOD(NODE(1,I),2)==1.AND.NODE(5,I)==0.AND.NODE(6,I)==0) THEN
VZ=VZ+1
END IF
END IF
END DO
PRINT*, VOPEN, VI, VS, VZ WRITE(914,*) VOPEN, VI, VS, VZ
xxxii

CONTAINS
SUBROUTINE RANDOM_POS (X)
INTEGER IX, K,J,M REAL X,IRAND,RM
DATA K,J,M,RM / 5702,3612,566927,566927.0/ IX=INT(X*RM) IRAND=MOD(J*IX+K,M) X=(REAL(IRAND)+0.5)/RM
END SUBROUTINE RANDOM_POS
SUBROUTINE MOL_BLOCK1 (LS,LE,RD,ST,VCI,DNODE,VINT,LC,IC)
INTEGER LS,LE,RD,LC,ND,ICINTEGER, DIMENSION(ROW) :: RINTEGER, DIMENSION(COL,ROW) :: STINTEGER, DIMENSION(COL,ROW),INTENT(IN) :: DNODE REAL VCI, VINT
!random placement of molecules in lattice DO I=LS,LE R(I) = RD
!PRINT*, RD ! occupied sites cannot be recounted IF ( ST(1,I)==0 .AND.I== R(I)) THEN ST(1,I) = 1
VCI=VCI-VINT
END IF
END DO
END SUBROUTINE MOL_BLOCK1
SUBROUTINE MOL_BLOCK2 (LS,LE,RD,ST,VCS,DNODE,VSTR,LC,SC)
INTEGER LS,LE,RD,LC,ND,SCINTEGER, DIMENSION(ROW) :: RINTEGER, DIMENSION(COL,ROW) :: STINTEGER, DIMENSION(COL,ROW),INTENT(IN) :: DNODE REAL VCS, VSTR
!random placement of molecules in lattice DO I=LS,LE R(I) = RD ! occupied sites cannot be recounted IF ( ST(1,I)==0 .AND.I== R(I)) THEN !IF ( ST(1,I)==0 .AND.I== R(I).AND.
(MOD(DNODE(2,RD),2)==0).AND.DNODE(5,RD)==0.AND.DNODE(6,RD)==0) THEN ST(1,I) = 1
VCS=VCS-VSTR
END IF
END DO
END SUBROUTINE MOL_BLOCK2
xxxiii
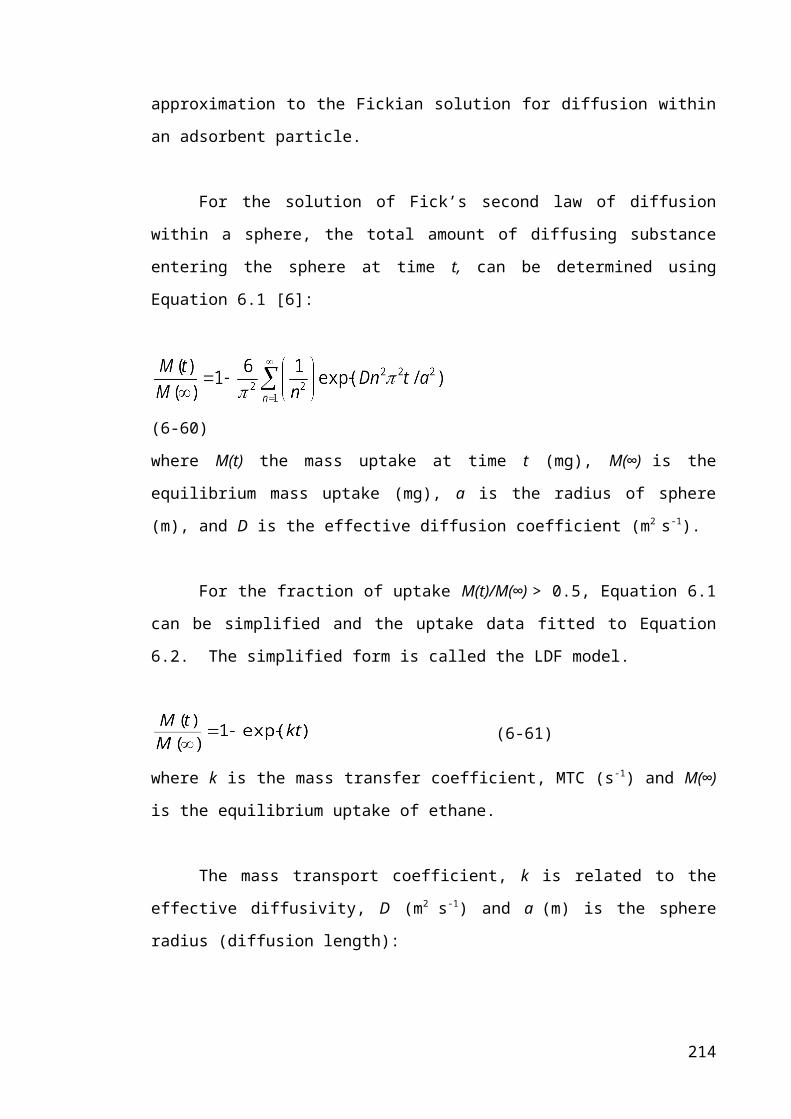
SUBROUTINE MOL_BLOCK3 (LS,LE,RD,ST,VCZ,DNODE,VZZ,LC,ZC)
INTEGER LS,LE,RD,LC,ND,ZCINTEGER, DIMENSION(ROW) :: RINTEGER, DIMENSION(COL,ROW) :: STINTEGER, DIMENSION(COL,ROW),INTENT(IN) :: DNODE REAL VCZ, VZZ
!random placement of molecules in lattice DO I=LS,LE R(I) = RD
! occupied sites cannot be recounted IF (ST(1,I)==0 .AND.I== R(I)) THEN !IF (ST(1,I)==0 .AND.I==R(I).AND.
(MOD(DNODE(2,RD),2)==1).AND.DNODE(5,RD)==0.AND.DNODE(6,RD)==0) THEN
ST(1,I) = 1 VCZ=VCZ-VZZ
END IF
END DO
END SUBROUTINE MOL_BLOCK3 SUBROUTINE ADJ_SITES(NO,EA,SO,WE,J,DNODE,ST) INTEGER I,J,K,NO,EA,SO,WEINTEGER, DIMENSION(COL,ROW) :: ST INTEGER, DIMENSION(COL,ROW),INTENT(IN) :: DNODE
! search for site location in ZSM5 structure array LOOP1: DO I=1,ROW IF (DNODE(3,J)==DNODE(1,I)) THEN WE = I IF (SST(1,I)==2) THEN ST(3,J)=2
ELSE IF (ST(1,I)==1) THEN ST(3,J)=1 IF (ST(3,J) ==2) EXIT LOOP1 ! 2 map once to array memory
ELSE WE = 0
END IF END IF END DO LOOP1
LOOP2: DO I=1,ROW IF ( DNODE(4,J)==DNODE(1,I)) THEN EA = I IF (ST(1,I)==2) THEN
xxxiv

ST(4,J)=2
ELSE IF (ST(1,I)==1) THEN ST(4,J)=1 IF (ST(4,J) ==2) EXIT LOOP2 ! 2 map once to array memory
ELSE EA = 0 END IF END IF END DO LOOP2
LOOP3: DO I=1,ROW IF ( DNODE(5,J)==DNODE(1,I)) THEN SO = I IF (ST(1,I)==2) THEN ST(5,J)=2
ELSE IF (ST(1,I)==1) THEN ST(5,J)=1
IF (ST(5,J) ==2) EXIT LOOP3 ! 2 map once to array memory
ELSE SO = 0
END IF END IF END DO LOOP3 LOOP4: DO I=1,ROW IF ( DNODE(6,J)==DNODE(1,I)) THEN NO = I IF (ST(1,I)==2) THEN ST(6,J)=2
ELSE IF (ST(1,I)==1) THEN ST(6,J)=1
IF (ST(6,J) ==2) EXIT LOOP4 ! 2 map once to array memory
ELSE NO = 0
END IF END IF END DO LOOP4
END SUBROUTINE ADJ_SITES
SUBROUTINE ADJ_SITES2(NO,EA,SO,WE,J,DNODE,ST)
xxxv
INTEGER I,J,K,NO,EA,SO,WEINTEGER, DIMENSION(COL,ROW) :: ST INTEGER, DIMENSION(COL,ROW),INTENT(IN) :: DNODE
! search for site location in ZSM5 structure array LOOP1: DO I=1,ROW IF (DNODE(3,J)==DNODE(1,I)) THEN WE = I IF (SST(1,I)==2) THEN ST(1,J)=2 ST(3,J)=2
IF (ST(3,J) ==2) EXIT LOOP1 ! 2 map once to array memory ELSE WE = 0
END IF END IF END DO LOOP1
LOOP2: DO I=1,ROW IF ( DNODE(4,J)==DNODE(1,I)) THEN EA = I IF (ST(1,I)==2) THEN ST(1,J)=2 ST(4,J)=2
IF (ST(4,J) ==2) EXIT LOOP2 ! 2 map once to array memory
ELSE EA = 0
END IF END IF END DO LOOP2
LOOP3: DO I=1,ROW IF ( DNODE(5,J)==DNODE(1,I)) THEN SO = I IF (ST(1,I)==2) THEN ST(1,J)=2 ST(5,J)=2
IF (ST(5,J) ==2) EXIT LOOP3 ! 2 map once to array memory
ELSE SO = 0
END IF END IF
xxxvi
END DO LOOP3 LOOP4: DO I=1,ROW IF ( DNODE(6,J)==DNODE(1,I)) THEN NO = I IF (ST(1,I)==2) THEN ST(1,J)=2 ST(6,J)=2
IF (ST(6,J) ==2) EXIT LOOP4 ! 2 map once to array memory
ELSE NO = 0
END IF END IF END DO LOOP4
END SUBROUTINE ADJ_SITES2
SUBROUTINE ADJ_SITES3(NO,EA,SO,WE,J,DNODE,ST)
INTEGER I,J,K,NO,EA,SO,WEINTEGER, DIMENSION(COL,ROW) :: ST INTEGER, DIMENSION(COL,ROW),INTENT(IN) :: DNODE
! search for site location in ZSM5 structure array LOOP1: DO I=1,ROW IF (DNODE(3,J)==DNODE(1,I)) THEN WE = I IF (ST(1,I)==0) THEN ST(1,I)=2 ST(3,J)=2
ELSE IF (ST(1,I)==2) THEN ST(3,J)=2 IF (ST(3,J) ==2) EXIT LOOP1 ! 2 map once to array memory
ELSE WE = 0
END IF END IF END DO LOOP1
LOOP2: DO I=1,ROW IF ( DNODE(4,J)==DNODE(1,I)) THEN EA = I IF (ST(1,I)==0) THEN ST(1,I)=2
xxxvii

ST(4,J)=2
ELSE IF (ST(1,I)==2) THEN ST(4,J)=2
IF (ST(4,J) ==2) EXIT LOOP2 ! 2 map once to array memory
ELSE EA = 0
END IF END IF
END DO LOOP2
LOOP3: DO I=1,ROW IF ( DNODE(5,J)==DNODE(1,I)) THEN SO = I IF (ST(1,I)==0) THEN ST(1,I)=2 ST(5,J)=2
ELSE IF (ST(1,I)==2) THEN ST(5,J)=2
IF (ST(5,J) ==2) EXIT LOOP3 ! 2 map once to array memory
ELSE SO = 0
END IF END IF END DO LOOP3
LOOP4: DO I=1,ROW IF ( DNODE(6,J)==DNODE(1,I)) THEN NO = I IF (ST(1,I)==0) THEN ST(1,I)=2 ST(6,J)=2
ELSE IF (ST(1,I)==2) THEN ST(6,J)=2
IF (ST(6,J) ==2) EXIT LOOP4 ! 2 map once to array memory
ELSE NO = 0
END IF END IF END DO LOOP4
xxxviii
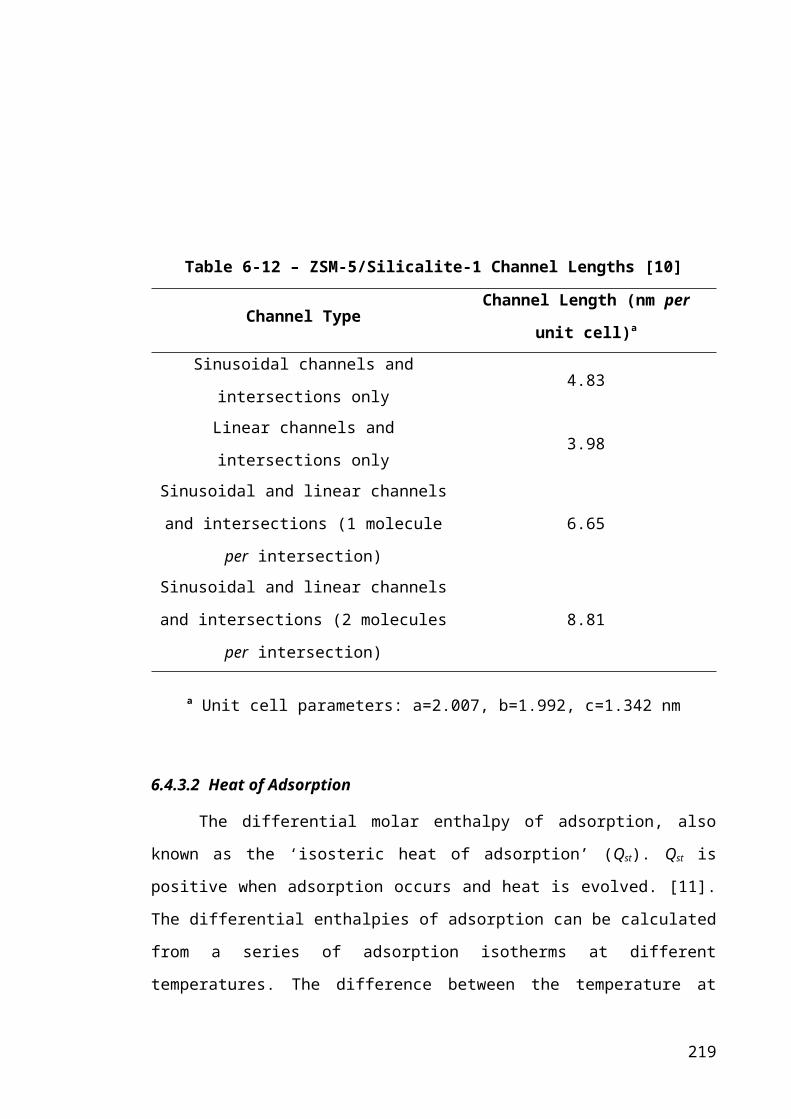
END SUBROUTINE ADJ_SITES3
END PROGRAM MC_ZSM_ACCESSIBILITY
xxxix

A4-4 – ZSM-5 Random Walk PROGRAM MC_CUBIC_DSELF IMPLICIT NONE
! program acquires CUBIC nodes and uses MC simulations to evaluate ! self diffusivity peridic boundaries apply on all edges
! interface to system clock for reseeding random number generationINTERFACE
SUBROUTINE HOP_DIR4 (SEED,N_DIR,RAND) INTEGER RAND,N_DIR REAL SEED END SUBROUTINE
END INTERFACE
INTEGER I,J,K,N,E,S,W,U,D,INOM,RAND,LPSTART,LPEND,LPCOUNT,RCOUNT,RLIM,OP,NP,H_DIR,N_DIR,N_HOP,NH,HOPS,HOPCOUNT,XG,YG,ZG,COG,R1,R2,R3,OPR,cycount,R4,R5,R6,cylim2,COUNT,SITES,MINTEGER, PARAMETER :: COL=6,ROW=2592,LATSIZE=13824,LATSIDE=24,MAX_HOP= 1000000INTEGER, DIMENSION(COL,ROW) :: NODE,SSTINTEGER, DIMENSION(ROW) ::XC,YC,ZC,XOG,YOG,ZOGINTEGER, DIMENSION(2,ROW) :: XCT,YCT,ZCTINTEGER, DIMENSION(3,ROW) :: STT,STTNODEINTEGER, DIMENSION(ROW) ::IMAGE_X,IMAGE_Y,IMAGE_ZREAL THETA,DNOM,SEED,INSEED,TAU,JRATE1,TIME_A,TIME_X,DELT1,r2t,r2tx,r2ty,r2tz,SEED1,P,JRATE2,DELT2,T REAL, DIMENSION(ROW) :: x0,y0,z0,XD,YD,ZD
INOM= 1296DNOM=INOMSITES=1728 ! number of sites in the latticeP=0.36 ! fraction of sites blockedM=P*SITESTAU = 1 !3E+9T=0.5
N_HOP=1HOPCOUNT=0
RCOUNT=0RLIM= 30000INSEED= 0.942SEED = INSEEDTHETA=DNOM/LATSIZECOG = 1246 !158 !(LATSIZE+1)/2 1246 ! coordinates origin R1=450R2=2598R3=9872
TIME_X=0 TIME_A=0 OP=0 cycount=0 R4=451 R5=1974 R6=6947
500 FORMAT(15I5)510 FORMAT (I5,T10,I10,T30,E15.6,T54,E15.6,T76,E15.6, T98, E15.6,T120,E15.6,T142,E15.6,T164)
xl

520 FORMAT (I5,T10,I10,T30,D15.6,T54,D15.6,T76,D15.6, T98, D15.6,T120,D15.6,T142,D15.6)
OPEN(100, FILE = 'RANDOM_NUMBER') OPEN(110, FILE = 'RANDOM_NUMBER2') OPEN(200, FILE = 'rand_numbers', POSITION= 'APPEND') OPEN(210, FILE = 'rand_numbers1', POSITION= 'APPEND') OPEN(211, FILE = 'rand_numbers2', POSITION= 'APPEND') OPEN(212, FILE = 'rand_numbers3', POSITION= 'APPEND') OPEN(213, FILE = 'rand_numbers4', POSITION= 'APPEND') OPEN(214, FILE = 'rand_numbers5', POSITION= 'APPEND')
OPEN(900, FILE = 'ZSM5_structure_24') OPEN(910, FILE = 'results_12')
OPEN(911, FILE = 'results_12a') OPEN(912, FILE = 'results_12b') OPEN(920, FILE = 'mean2displacement_12_a', POSITION='APPEND') OPEN(930, FILE = 'mean2displacement_12_b', POSITION='APPEND') OPEN(950, FILE = 'mean2displacement_12_c', POSITION='APPEND') OPEN(960, FILE = 'mean2displacement_12_d', POSITION='APPEND') OPEN(970, FILE = 'mean2displacement_12_e', POSITION='APPEND') OPEN(980, FILE = 'mean2displacement_12_f', POSITION='APPEND') OPEN(990, FILE = 'mean2displacement_12_g', POSITION='APPEND') OPEN(1000, FILE = 'mean2displacement_12_h', POSITION='APPEND') OPEN(1100, FILE = 'mean2displacement_12_i', POSITION='APPEND') OPEN(1200, FILE = 'mean2displacement_12_j', POSITION='APPEND') OPEN(1300, FILE = 'mean2displacement_12', POSITION='APPEND')
! read cubic lattice nodes and their neighbours READ(900,*) NODE
DO J=1,COL DO I=1, ROW !DO I=1,LATSIZE
SST(J,I) = 0 !SST(N_HOP,I) !PRINT*, J,I,SST(J,I)
!WRITE(910,*) SST(J,I) END DO
END DO
DO J = 1,3 DO I=1,ROW !DO I=1,LATSIZE
STT(J,I) = 0 !SST(N_HOP,I) END DO END DO
! random allocation of molecules in the lattice LPCOUNT =1 RCOUNT = 0 DO WHILE (LPCOUNT<=INOM) RCOUNT = RCOUNT + 1 CALL RANDOM_POS(SEED) RAND = (1+INT(ROW*SEED)) CALL ADJ_SITES(N,E,S,W,RAND,NODE,SST) LPSTART = 1 LPEND = ROW !LATSIZE
CALL MOL_ADD(LPSTART,LPEND,RAND,SST,LPCOUNT,W,E,S,N) END DO
xli
DO I=1,ROW IF (SST(1,I)==1) THEN END IF END DO
! random blocking of sites in the lattice
LPCOUNT = 1 RCOUNT = 0
DO WHILE (LPCOUNT<=(P*SITES)) RCOUNT= RCOUNT+1
CALL RANDOM_POS(SEED)
RAND = (1+INT(ROW*SEED))
LPSTART=1 LPEND=ROW
CALL MOL_BLOCK (LPSTART,LPEND,RAND,SST,LPCOUNT,NODE)
END DO !DO J=1,1 DO I=1,ROW IF (SST(1,I)==2) THEN END IF END DO DO I=1,ROW !DO I=1,LATSIZE IF ( SST(1,I)==1) THEN STT(2,I)=I ! tag 4 hopping molecule END IF STT(1,I) = STT(2,I) ! initial state STTNODE(1,I)=NODE(1,I) STTNODE(2,I)=NODE(1,I) ! current which becomes previous position after a hop STTNODE(3,I)=NODE(1,I) ! new hop position SST(2,I)=SST(1,I) !PRINT*, I,SST(1,I),SST(2,I) !WRITE(910,*) I,NODE(1,I),SST(1,I), SST(2,I)
END DO DO I=1,ROW
CALL ADJ_SITES(N,E,S,W,I,NODE,SST) IF (SST(1,I)==1) THEN IF (S==0.AND.N==0) THEN !PRINT*, I,SST(1,W),SST(1,E) ELSE !PRINT*, I,SST(1,W),SST(1,E),SST(1,S),SST(1,N) END IF END IF END DO
xlii

! establishing origin of the coordinate system CALL xyz_cordinates(N_HOP,STTNODE,XC,YC,ZC)
XG = XC(COG) YG = YC(COG) ZG = ZC(COG) !PRINT*, M PRINT*, 247,N_HOP,STTNODE(1,COG),XC(COG),YC(COG),ZC(COG)
DO I=1,ROW
STTNODE(3,I)=0 ! reset new hop position END DO
! random search of molecule 2 hop HOPMOLECULE: DO WHILE (N_HOP<=MAX_HOP-1) RCOUNT = RCOUNT+1 HOPCOUNT=HOPCOUNT+1 CALL RANDOM_POS2(HOPCOUNT,R1,R2,R3,ROW,RAND,cycount,N_HOP) IF (MOD(HOPCOUNT,RLIM)==0) THEN N_DIR = ROW ! initiate the seed from the current time CALL HOP_DIR4(SEED,N_DIR,RAND) RCOUNT=0 !PRINT*, SEED, RAND END IF ! REPLACE J WITH A NUMBER OF AN OCCUPIED SITE eg 45,111,265,323 etc J = RAND ! ( memory access between 0-LATSIZE) IF ( STT(2,J)/=0 ) THEN CALL ADJ_SITES(N,E,S,W,J,NODE,SST) !random serach of hop direction !using a different random generation routine HOPCOUNT=HOPCOUNT+1 IF (S==0.AND.N==0) THEN N_DIR=2 ELSE N_DIR=4 END IF CALL RANDOM_POS2(HOPCOUNT,R1,R2,R3,N_DIR,RAND,cycount, N_HOP) H_DIR = RAND CALL RANDOM_POS(SEED) JRATE1 = 1/(TAU*INOM) DELT1=-(JRATE1)*LOG(SEED) JRATE2 = 1/(TAU*INOM*T) ! T=FOR BLOCKED SITE DELT2=-(JRATE2)*LOG(SEED) IF(N_HOP>=10001) THEN IF (S==0.AND.N==0) THEN IF (SST(2,W)==2.OR.SST(2,E)==2) THEN
xliii

TIME_X = TIME_X + DELT2 ELSE TIME_X = TIME_X + DELT1 END IF ELSE IF (W/=0.AND.E/=0.AND.S/=0.AND.N/=0) THEN IF(SST(2,W)==2.OR.SST(2,E)==2.OR.SST(2,S)==2.OR.SST(2,N)==2) THEN TIME_X = TIME_X + DELT2 ELSE TIME_X = TIME_X + DELT1 END IF END IF END IF IF (RCOUNT <=10) THEN END IF
! determination of the site a molecule hops to ! molecule bounces back if hop site is occupied
!W= NODE(3,J)!SW/NW !E= NODE(4,J)!SE/NE !S= NODE(5,J)!D !N= NODE(6,J)!U
IF (MOD(NODE(2,J),2)==1.AND.H_DIR==1.AND.W /=0.AND.SST(2,W)==0.AND.STT(2,W)==0)THEN DO I=1,ROW IF (STT(2,I)/=0) THEN ! new occupancy set to previous STT(3,I) = STT(2,I) END IF END DO SST(2,W) = 1 SST(2,J) = 0 OP = STT(2,J) OPR = NODE(1,J) STT(3,W) = OP STT(3,J) = 0 N_HOP = N_HOP+1 ! only successful hops counted NP = NODE(3,J) STTNODE(3,OP)= NP !PRINT*, N_HOP,H_DIR,J,NP, OP,STTNODE(3,OP) ELSE IF(MOD(NODE(2,J),2)==1.AND.H_DIR==2.AND.E /=0.AND.SST(2,E)==0.AND.STT(2,E)==0)THEN DO I=1,ROW IF (STT(2,I)/=0) THEN ! new occupancy set to previous STT(3,I) = STT(2,I) END IF END DO SST(2,E) = 1 SST(2,J) = 0 OP = STT(2,J) OPR = NODE(1,J) !ACTUAL POSITION IN ZSM5 GRID STT(3,E) = OP STT(3,J) = 0 NP = NODE(4,J)
xliv
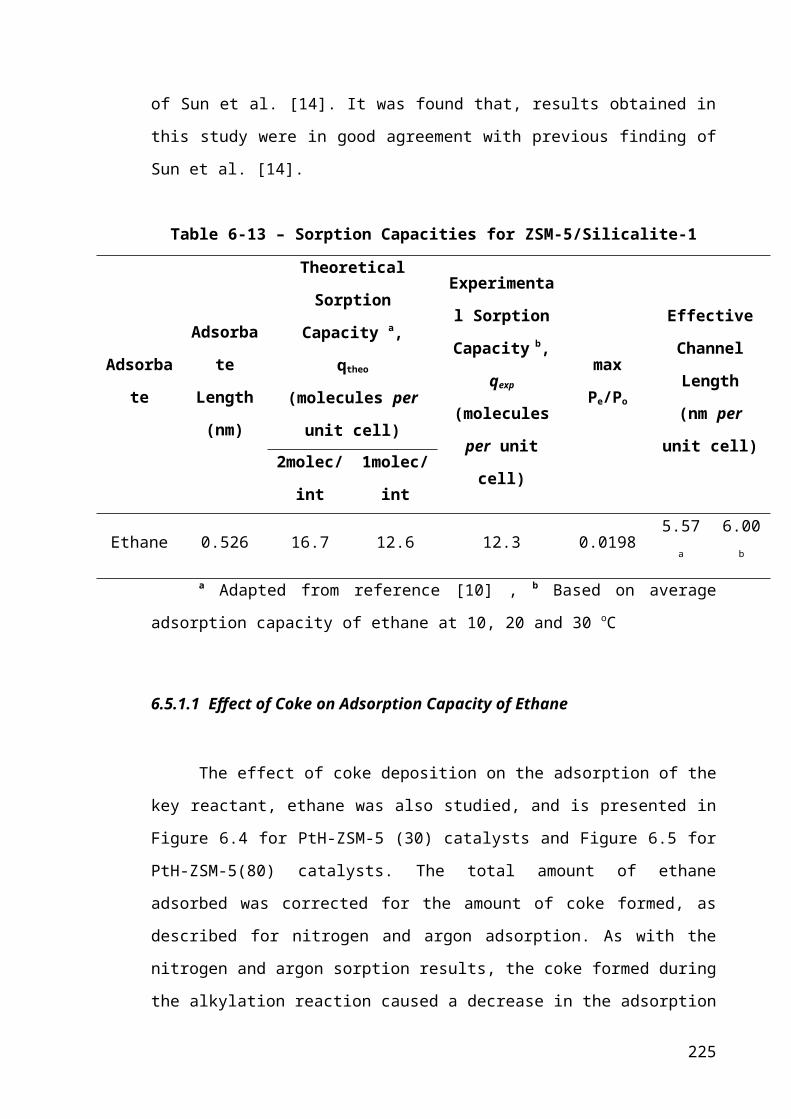
N_HOP = N_HOP+1 STTNODE(3,OP)= NP !PRINT*, N_HOP,H_DIR,J,NP, OP,STTNODE(3,OP) ELSE IF(MOD(NODE(2,J),2)==1.AND.H_DIR==3.AND.S /=0.AND.SST(2,S)==0.AND.STT(2,S)==0)THEN DO I=1,ROW IF (STT(2,I)/=0) THEN ! new occupancy set to previous STT(3,I) = STT(2,I) END IF END DO SST(2,S) = 1 SST(2,J) = 0 OP = STT(2,J) OPR = NODE(1,J) STT(3,S) = OP STT(3,J) = 0 NP = NODE(5,J) N_HOP = N_HOP+1 STTNODE(3,OP)= NP !PRINT*, N_HOP,H_DIR,J,NP, OP ,STTNODE(3,OP) ELSE IF(MOD(NODE(2,J),2)==1.AND.H_DIR==4.AND.N /=0.AND.SST(2,N)==0.AND.STT(2,N)==0)THEN DO I=1,ROW IF (STT(2,I)/=0) THEN ! new occupancy set to previous STT(3,I) = STT(2,I) END IF END DO SST(2,N) = 1 SST(2,J) = 0 OP = STT(2,J) OPR = NODE(1,J) STT(3,N) = OP STT(3,J) = 0 NP = NODE(6,J) N_HOP = N_HOP+1 STTNODE(3,OP)= NP !PRINT*, N_HOP,H_DIR,J,NP, OP,STTNODE(3,OP) ELSE IF(MOD(NODE(2,J),2)==0.AND.H_DIR==1.AND.W/=0.AND.SST(2,W)==0.AND.STT(2,W)==0)THEN DO I=1,ROW IF (STT(2,I)/=0) THEN ! new occupancy set to previous STT(3,I) = STT(2,I) END IF END DO SST(2,W) = 1 SST(2,J) = 0 OP = STT(2,J) OPR = NODE(1,J) STT(3,W) = OP STT(3,J) = 0 NP = NODE(3,J)
xlv

N_HOP = N_HOP+1 STTNODE(3,OP)= NP ELSE IF(MOD(NODE(2,J),2)==0.AND.H_DIR==2.AND.E /=0.AND.SST(2,E)==0.AND.STT(2,E)==0)THEN !ELSE IF(H_DIR==6.AND.U /=0.AND.STT(2,U)==0)THEN !PRINT*, N_HOP,H_DIR,J,SST(2,J),SST(2,E) DO I=1,ROW IF (STT(2,I)/=0) THEN ! new occupancy set to previous STT(3,I) = STT(2,I) END IF END DO SST(2,E) = 1 SST(2,J) = 0 OP = STT(2,J) OPR = NODE(1,J) STT(3,E) = OP STT(3,J) = 0 NP = NODE(4,J) N_HOP = N_HOP+1 STTNODE(3,OP)= NP !PRINT*, N_HOP,H_DIR,J,NP, OP,STTNODE(3,OP) END IF
! reset values of boundary overlap DO I=1,ROW IMAGE_X(I)=0 IMAGE_Y(I)=0 IMAGE_Z(I)=0 END DO IF ( OP/=0) THEN ! accounts 4 high occupancy when STT=1 but cannot hop NEWPOSITION: DO I=1,ROW IF (STT(1,I)/=0 .AND. STT(2,I)/=0 .AND. STT(3,I)==0) THEN ! particle did hop ! search new position of particle DO J=1,ROW IF (STT(3,J)==OP) THEN STTNODE(3,OP)= NP !PRINT*, OP,J END IF END DO ELSE IF (STT(2,I)/=0 .AND. STT(2,I)==STT(3,I)) THEN NH = STT(3,I) DO J=1,ROW IF (STT(3,J)==NH) THEN STTNODE(3,NH)= NODE(1,J) ! search 4 particles which did not hop END IF END DO
END IF
xlvi
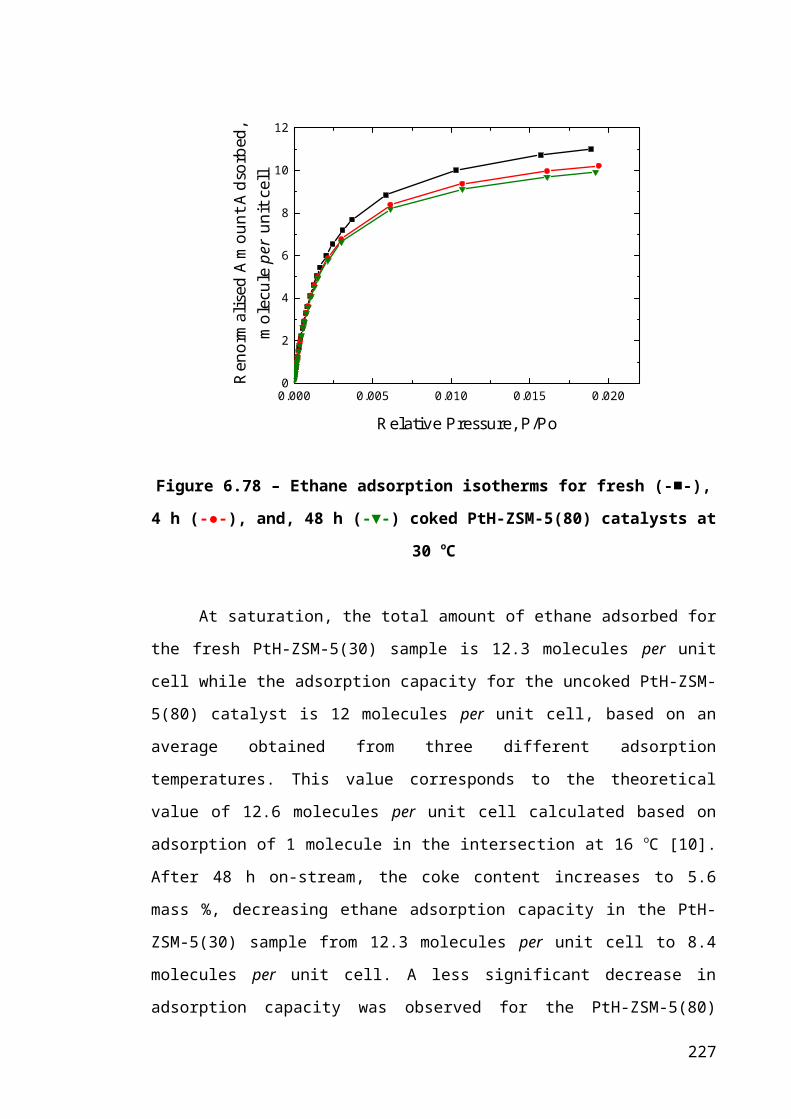
! flag whenever a molecule passes the boundary IF(MOD(STTNODE(2,OP),LATSIDE)==1 .AND. MOD(STTNODE(3,OP),LATSIDE)==0) THEN IMAGE_X(OP)=-1ELSE IF(MOD(STTNODE(2,OP),LATSIDE)==0 .AND. MOD(STTNODE(3,OP),LATSIDE)==1) THEN IMAGE_X(OP)=1 ELSE IF (STTNODE(3,OP)-STTNODE(2,OP)==1.AND.MOD(STTNODE(2,OP),LATSIDE)==0 &.AND.MOD(STTNODE(3,OP),LATSIDE)==1) THEN IMAGE_Y(OP)=1
ELSE IF (STTNODE(3,OP)-STTNODE(2,OP)==(LATSIDE*2-1).AND.MOD(STTNODE(2,OP),LATSIDE)==1 &.AND.MOD(STTNODE(3,OP),LATSIDE)==0) THEN IMAGE_Y(OP)=1 ELSE IF (STTNODE(2,OP)-STTNODE(3,OP)==1.AND.MOD(STTNODE(2,OP),LATSIDE)==1 &.AND.MOD(STTNODE(3,OP),LATSIDE)==0) THEN IMAGE_Y(OP)=-1 ELSE IF (STTNODE(2,OP)-STTNODE(3,OP)==(LATSIDE*2-1).AND.MOD(STTNODE(2,OP),LATSIDE)==0 &.AND.MOD(STTNODE(3,OP),LATSIDE)==1) THEN IMAGE_Y(OP)=-1
ELSE IF (STTNODE(2,OP)-STTNODE(3,OP)==(LATSIDE**2-(LATSIDE-1)) & .AND.MOD(STTNODE(2,OP),LATSIDE**2)<(LATSIDE**2)&.AND.MOD(STTNODE(2,OP),LATSIDE**2)>(LATSIDE**2-.AND.MOD(STTNODE(3,OP),LATSIDE**2)>0 &.AND.MOD(STTNODE(3,OP),LATSIDE**2)<=LATSIDE) THEN
IMAGE_Y(OP)=1
ELSE IF (STTNODE(2,OP)-STTNODE(3,OP)==(LATSIDE**2-(LATSIDE+1)) &.AND.MOD(STTNODE(2,OP),LATSIDE**2)<(LATSIDE**2)&.AND.MOD(STTNODE(2,OP),LATSIDE**2)>(LATSIDE**2-(LATSIDE-1)) &.AND.MOD(STTNODE(3,OP),LATSIDE**2)>0 &.AND.MOD(STTNODE(3,OP),LATSIDE**2)<=LATSIDE) THEN IMAGE_Y(OP)=1
ELSE IF (STTNODE(3,OP)-STTNODE(2,OP)==(LATSIDE**2-(LATSIDE-1)) & .AND.MOD(STTNODE(3,OP),LATSIDE**2)<(LATSIDE**2)&.AND.MOD(STTNODE(3,OP),LATSIDE**2)>(LATSIDE**2-(LATSIDE-1)) &.AND.MOD(STTNODE(2,OP),LATSIDE**2)>0 &.AND.MOD(STTNODE(2,OP),LATSIDE**2)<=LATSIDE) THEN IMAGE_Y(OP)=-1
ELSE IF (STTNODE(3,OP)-STTNODE(2,OP)==(LATSIDE**2-(LATSIDE+1)) & .AND.MOD(STTNODE(3,OP),LATSIDE**2)<(LATSIDE**2)&.AND.MOD(STTNODE(3,OP),LATSIDE**2)>(LATSIDE**2-(LATSIDE-1)) &.AND.MOD(STTNODE(2,OP),LATSIDE**2)>0 &.AND.MOD(STTNODE(2,OP),LATSIDE**2)<=LATSIDE) THEN IMAGE_Y(OP)=-1
ELSE IF (STTNODE(2,OP)-STTNODE(3,OP)==(LATSIDE**2-(LATSIDE-2))&.AND.MOD(STTNODE(2,OP),LATSIDE**2)==0 &.AND.MOD(STTNODE(3,OP),LATSIDE**2)<=LATSIDE) THEN IMAGE_Y(OP)=-1
ELSE IF (STTNODE(3,OP)-STTNODE(2,OP)==(LATSIDE**2-(LATSIDE-2))&
xlvii
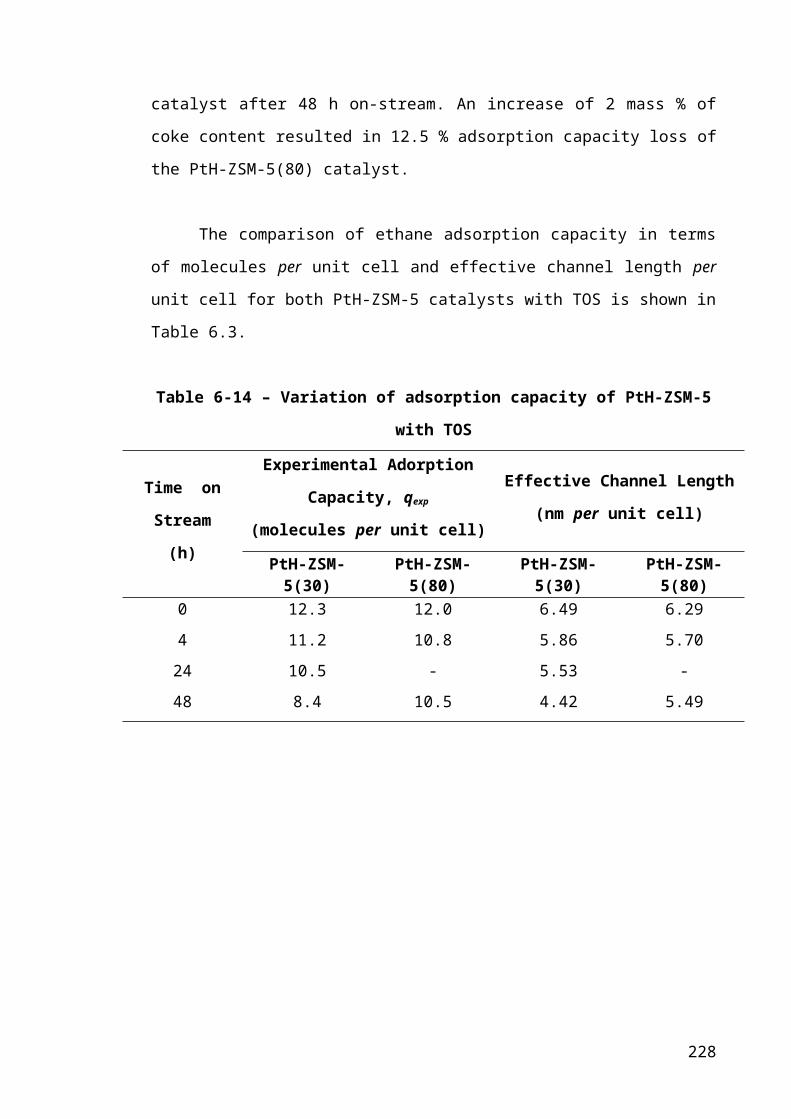
.AND.MOD(STTNODE(3,OP),LATSIDE**2)==0 &
.AND.MOD(STTNODE(2,OP),LATSIDE**2)<=LATSIDE) THEN IMAGE_Y(OP)=1 ELSE IF (STTNODE(3,OP)<=(LATSIDE**2) .AND.STTNODE(2,OP)>(LATSIZE-(LATSIDE**2))) THEN IMAGE_Z(OP)= 1 ELSE IF (STTNODE(3,OP)>(LATSIZE-(LATSIDE**2)) .AND. STTNODE(2,OP)<=(LATSIDE**2)) THEN IMAGE_Z(OP)=-1 END IF
END DO NEWPOSITION
! determining the mean2 displacement CALL xyz_cordinates(N_HOP,STTNODE,XC,YC,ZC ) XYZ_DIS: DO I=1,ROW
IF (N_HOP==10000) THEN XCT(1,I) = 0!XC(I)-XG YCT(1,I) = 0!YC(I)-YG ZCT(1,I) = 0!ZC(I)-ZG XCT(2,I) = 0!XC(I)-XG YCT(2,I) = 0!YC(I)-YG ZCT(2,I) = 0!ZC(I)-ZG END IF IF(N_HOP>=10001) THEN XOG(I) = XC(I)-XG YOG(I) = YC(I)-YG ZOG(I) = ZC(I)-ZG ! coordinates value at time = 0 IF(N_HOP==10001) THEN x0(I) = XOG(I) y0(I) = YOG(I) z0(I) = ZOG(I) XD(I)= 0!XOG(I) YD(I)= 0!YOG(I) ZD(I)= 0!ZOG(I) END IF IF ( MOD(N_HOP,2)/=0) THEN XCT(1,I) = XOG(I) YCT(1,I) = YOG(I) ZCT(1,I) = ZOG(I) ELSE IF(MOD(N_HOP,2)==0) THEN XCT(2,I) = XOG(I) YCT(2,I) = YOG(I) ZCT(2,I) = ZOG(I) END IF
! molecule did not hop IF (STT(2,I)/=0 .AND. STT(2,I)==STT(3,I)) THEN XD(I) = XD(I)
xlviii
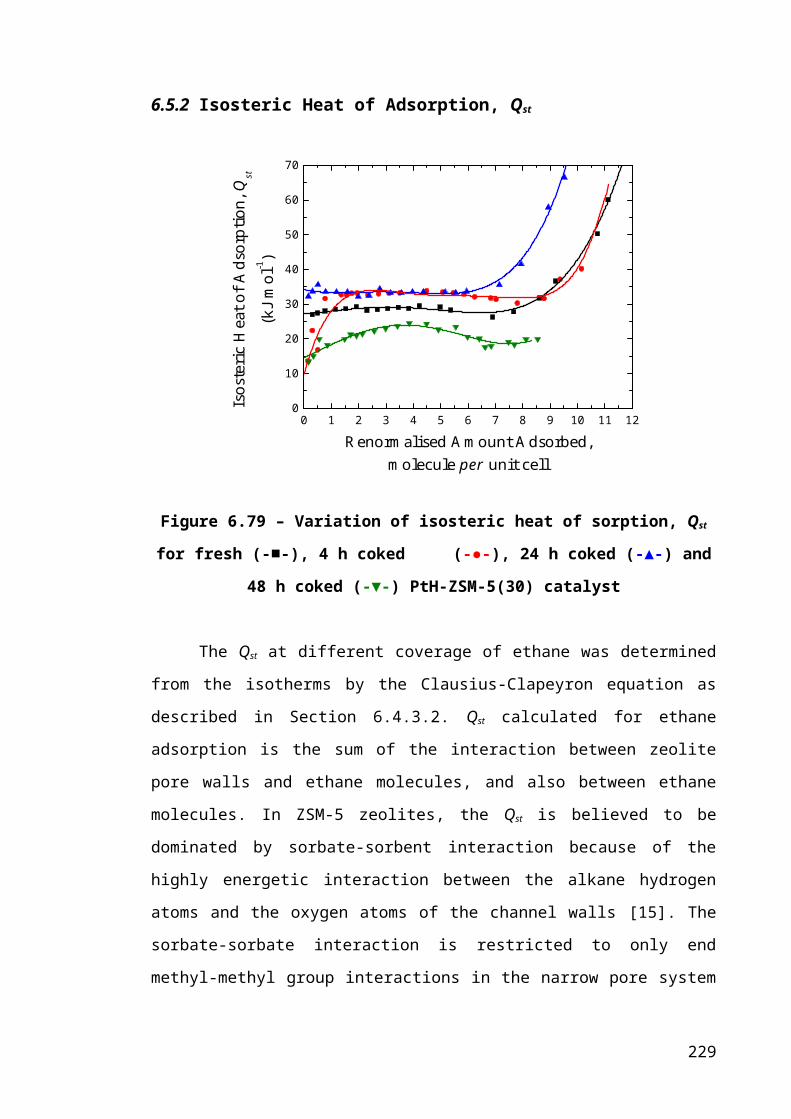
YD(I) = YD(I) ZD(I) = ZD(I) ! molecule hopped over the boundary to the east(+) ELSE IF(IMAGE_X(I)==1)THEN IF (N_HOP==10001) THEN XD(I)=x0(I) ELSE XD(I) = XD(I)+1 END IF ! molecule hopped over boundaries to the west(-) ELSE IF(IMAGE_X(I)==-1)THEN IF (N_HOP==10001) THEN XD(I)=x0(I) ELSE XD(I) = XD(I)-1 END IF
! molecule did not overlap boundary ELSE IF(IMAGE_X(I)==0)THEN IF (XCT(2,I)==XCT(1,I)) THEN XD(I)=XD(I) ! swap current positions ELSE IF ( MOD(N_HOP,2)/=0) THEN XD(I) = XD(I)+(XCT(1,I)-XCT(2,I)) ELSE IF(MOD(N_HOP,2)==0) THEN XD(I) = XD(I)+(XCT(2,I)-XCT(1,I)) END IF END IF
! molecule hopped over the boundary to the north(+) IF(IMAGE_Y(I)==1)THEN IF (N_HOP==10001) THEN YD(I)=y0(I) ELSE YD(I) = YD(I)+1 END IF
! molecule hopped over boundaries to the south(-) ELSE IF(IMAGE_Y(I)==-1)THEN IF (N_HOP==10001) THEN YD(I)=y0(I) ELSE YD(I) = YD(I)-1 END IF
! molecule did not overlap boundary ELSE IF(IMAGE_Y(I)==0)THEN IF (YCT(2,I)==YCT(1,I)) THEN YD(I)=YD(I) ! swap current positions ELSE IF ( MOD(N_HOP,2)/=0) THEN YD(I) = YD(I)+(YCT(1,I)-YCT(2,I)) ELSE IF(MOD(N_HOP,2)==0) THEN YD(I) = YD(I)+(YCT(2,I)-YCT(1,I)) END IF END IF
xlix
! molecule hopped over the boundary upwards(+) IF(IMAGE_Z(I)==1)THEN !IF (N_HOP==MAX_HOP/3) THEN IF (N_HOP==10001) THEN ZD(I)=z0(I) ELSE ZD(I) = ZD(I)+1 END IF ! molecule hopped over the boundary downwards(-) ELSE IF(IMAGE_Z(I)==-1)THEN !IF (N_HOP==MAX_HOP/3) THEN IF (N_HOP==10001) THEN ZD(I)=z0(I) ELSE ZD(I) = ZD(I)-1 END IF ! molecule did not overlap boundary ELSE IF(IMAGE_Z(I)==0)THEN IF (ZCT(2,I)==ZCT(1,I)) THEN ZD(I)=ZD(I) ! swap current positions ELSE IF ( MOD(N_HOP,2)/=0) THEN ZD(I) = ZD(I)+(ZCT(1,I)-ZCT(2,I)) ELSE IF(MOD(N_HOP,2)==0) THEN ZD(I) = ZD(I)+(ZCT(2,I)-ZCT(1,I)) END IF END IF
END IF END DO XYZ_DIS IF(N_HOP>=10001) THEN r2tx=0 r2ty=0 r2tz=0 r2t=0 DISPLACEMENT: DO I =1,ROW IF (STTNODE(3,I)/=0) THEN r2tx= r2tx + (XD(I)-x0(I))**2 r2ty= r2ty + (YD(I)-y0(I))**2 r2tz= r2tz + (ZD(I)-z0(I))**2 r2t= r2t+(XD(I)-x0(I))**2+(YD(I)-y0(I))**2+(ZD(I)-z0(I))**2 END IF END DO DISPLACEMENT IF(N_HOP>=10001) THEN IF (MOD(N_HOP,10000)==0) THENWRITE(1300,510)INOM,N_HOP,TIME_X,TIME_A,r2tx,r2ty,r2tz,r2t!,STTNODE(2,OP) PRINT*, N_HOP,r2tx,r2ty,r2tz,r2t!,H_DIR END IF END IF IF (N_HOP<=MAX_HOP/10) THEN !IF (N_HOP<=10000000) THEN ! IF (MOD(N_HOP,1000)==0) THEN
l
WRITE(920,510) INOM,N_HOP,TIME_X,TIME_A,r2tx,r2ty,r2tz,r2t END IF END IF IF ((N_HOP.LE.(2*MAX_HOP/10)).AND.(N_HOP.GT.(MAX_HOP/10))) THEN IF (MOD(N_HOP,1000)==0) THENWRITE(930,510) INOM,N_HOP,TIME_X,TIME_A,r2tx,r2ty,r2tz,r2t END IF END IF IF((N_HOP.LE.(3*MAX_HOP/10)).AND.(N_HOP.GT.(2*MAX_HOP/10))) THEN IF (MOD(N_HOP,1000)==0) THENWRITE(950,510) INOM,N_HOP,TIME_X,TIME_A,r2tx,r2ty,r2tz,r2t END IF END IF IF((N_HOP.LE.(4*MAX_HOP/10)).AND.(N_HOP.GT.(3*MAX_HOP/10))) THEN IF (MOD(N_HOP,1000)==0) THENWRITE(960,510) INOM,N_HOP,TIME_X,TIME_A,r2tx,r2ty,r2tz,r2t END IF END IF IF((N_HOP.LE.(5*MAX_HOP/10)).AND.(N_HOP.GT.(4*MAX_HOP/10))) THEN IF (MOD(N_HOP,1000)==0) THENWRITE(970,510) INOM,N_HOP,TIME_X,TIME_A,r2tx,r2ty,r2tz,r2t END IF END IF IF((N_HOP.LE.(7*MAX_HOP/10)).AND.(N_HOP.GT.(6*MAX_HOP/10))) THEN IF (MOD(N_HOP,1000)==0) THENWRITE(990,510) INOM,N_HOP,TIME_X,TIME_A,r2tx,r2ty,r2tz,r2t END IF END IF IF((N_HOP.LE.(8*MAX_HOP/10)).AND.(N_HOP.GT.(7*MAX_HOP/10))) THEN IF (MOD(N_HOP,1000)==0) THENWRITE(1000,510) INOM,N_HOP,TIME_X,TIME_A,r2tx,r2ty,r2tz,r2t END IF END IF IF((N_HOP.LE.(9*MAX_HOP/10)).AND.(N_HOP.GT.(8*MAX_HOP/10))) THEN IF (MOD(N_HOP,1000)==0) THENWRITE(1100,510) INOM,N_HOP,TIME_X,TIME_A,r2tx,r2ty,r2tz,r2t END IF END IF
IF((N_HOP.LE.(10*MAX_HOP/10)).AND.(N_HOP.GT.(9*MAX_HOP/10))) THEN IF (MOD(N_HOP,1000)==0) THENWRITE(1200,510) INOM,N_HOP,TIME_X,TIME_A,r2tx,r2ty,r2tz,r2t END IF END IF END IF ! swap particle's position before next hop attempt SWAP: DO I =1,ROW STT(2,I)=STT(3,I) STTNODE(2,I)=STTNODE(3,I) END DO SWAP
li
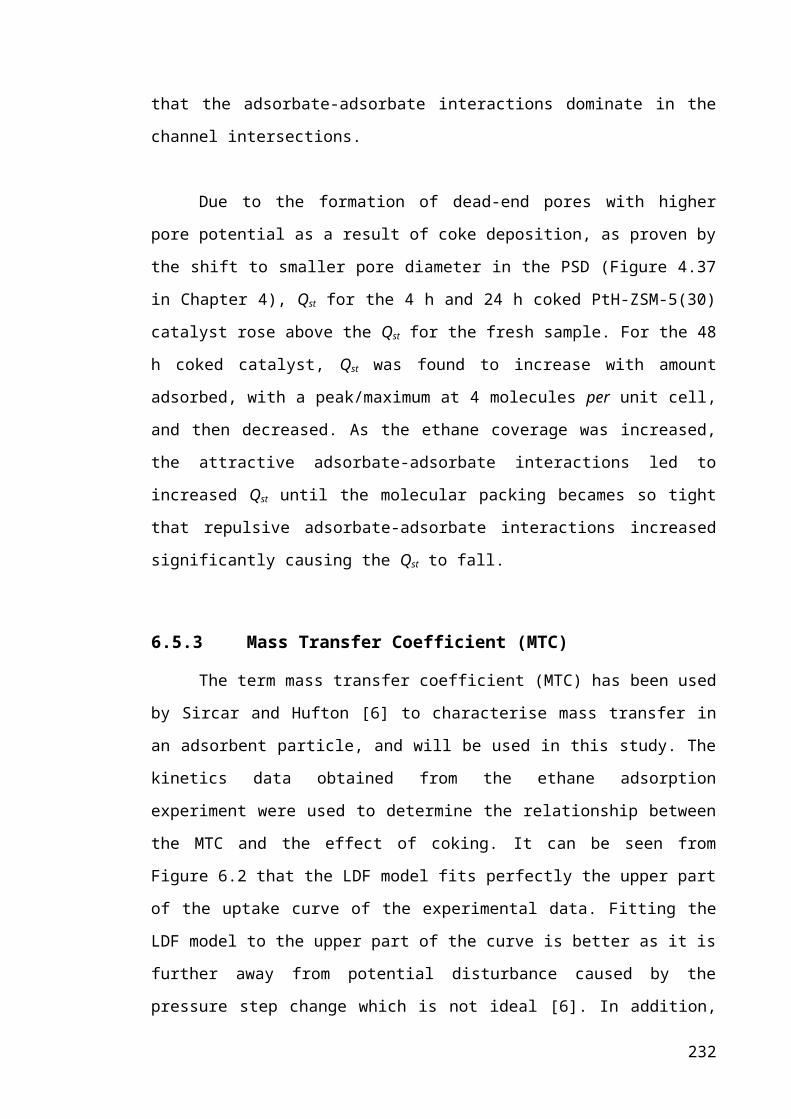
OP = 0 ! reset value of hopping particle END IF END IF CALL RANDOM_POS(SEED) JRATE1 = 1/(TAU*INOM) DELT1=-(JRATE1)*LOG(SEED) IF(N_HOP>=10001) THEN TIME_A = TIME_A + DELT1 ! time incremented 4 all hops END IF
IF (N_HOP==MAX_HOP/10) THEN CLOSE (920) END IF
IF (N_HOP==2*MAX_HOP/10) THEN CLOSE (930) END IF
IF (N_HOP==3*MAX_HOP/10) THEN CLOSE (950) END IF IF (N_HOP==4*MAX_HOP/10) THEN CLOSE (960) END IF IF (N_HOP==5*MAX_HOP/10) THEN CLOSE (970) END IF IF (N_HOP==7*MAX_HOP/10) THEN CLOSE (990) END IF IF (N_HOP==8*MAX_HOP/10) THEN CLOSE (1000) END IF IF (N_HOP==9*MAX_HOP/10) THEN CLOSE (1100) END IF IF (N_HOP==10*MAX_HOP/10) THEN CLOSE (1200) END IF
END DO HOPMOLECULE PRINT*, TIME_X,TIME_A, HOPCOUNT
CONTAINS
SUBROUTINE RANDOM_POS (X)
INTEGER IX, K,J,M REAL X,IRAND,RM
DATA K,J,M,RM / 5702,3612,566927,566927.0/
lii
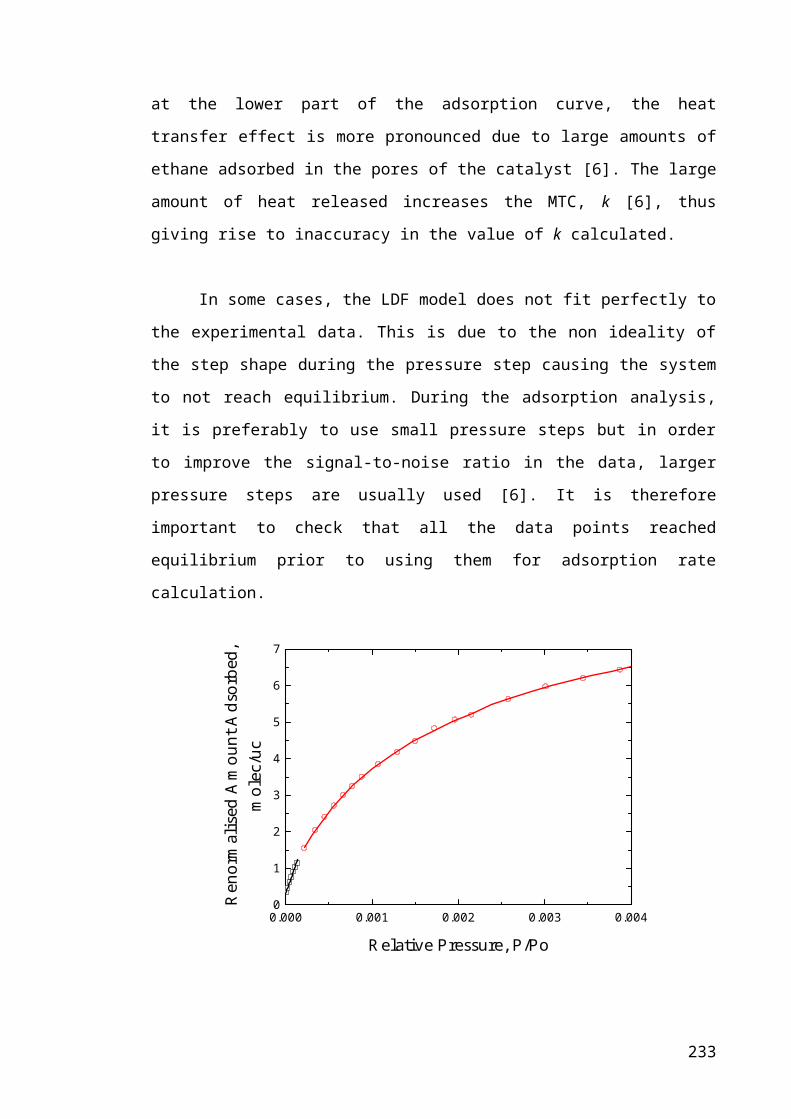
IX=INT(X*RM) IRAND=MOD(J*IX+K,M) X=(REAL(IRAND)+0.5)/RM
END SUBROUTINE RANDOM_POS
SUBROUTINE RANDOM_POS2 (dcount,i1, i2, i3,d_dir,hd,cycount,nhop) IMPLICIT NONEINTEGER :: b,i1, i2, i3, i,dcount,cylim,d_dir,hd,cycount,nhopINTEGER, PARAMETER :: dp = SELECTED_REAL_KIND(14, 60)INTEGER, SAVE :: s1 = 1234, s2 = -4567, s3 = 7890REAL (dp) :: random_numb cylim=3E+7 IF(dcount==cylim)THEN s1=450 s2=2598 s3=9872 dcount=0 cycount=cycount+1 PRINT*, 'GENERATOR RESEEDED',cycount WRITE(100,*) 'GENERATOR RESEEDED',cycount,nhop
END IF IF (IAND(s1,-2) == 0) s1 = i1 - 1023 IF (IAND(s2,-8) == 0) s2 = i2 - 1023 IF (IAND(s3,-16) == 0) s3 = i3 - 1023
b = ISHFT( IEOR( ISHFT(s1,13), s1), -19) s1 = IEOR( ISHFT( IAND(s1,-2), 12), b) b = ISHFT( IEOR( ISHFT(s2,2), s2), -25) s2 = IEOR( ISHFT( IAND(s2,-8), 4), b) b = ISHFT( IEOR( ISHFT(s3,3), s3), -11) s3 = IEOR( ISHFT( IAND(s3,-16), 17), b) random_numb = IEOR( IEOR(s1,s2), s3) * 2.3283064365E-10_dp + 0.5_dp
hd = 1+INT(d_dir*random_numb) END SUBROUTINE RANDOM_POS2
SUBROUTINE MOL_ADD (LS,LE,RD,ST,LC,W,E,S,N) INTEGER LS,LE,RD,LC,W,E,S,NINTEGER, DIMENSION(ROW) :: RINTEGER, DIMENSION(COL,ROW) :: ST
! random placement of molecules in lattice DO I=LS,LE R(I) = RD
! occupied sites cannot be recounted IF ( ST(1,I)==0 .AND.I== R(I)) THEN IF (N==0.AND.S==0) THEN IF (ST(1,W)/=2.AND.ST(1,E)/=2) THEN
ST(1,I) = 1 LC = LC +1
liii

END IF ELSE IF (ST(1,W)/=2.AND.ST(1,E)/=2.AND.ST(1,N)/=2.AND.ST(1,S)/=2) THEN ST(1,I) = 1
LC = LC +1 END IF END IF
END DO
END SUBROUTINE MOL_ADD
SUBROUTINE xyz_cordinates(DHOP,DNODE,CARTX,CARTY,CARTZ)
INTEGER I,DI,IR,LATSDX,LATSDY,DHOPINTEGER, DIMENSION(ROW) :: X,Y,YR,Z INTEGER, DIMENSION(ROW),INTENT(OUT)::CARTX,CARTY,CARTZ INTEGER, DIMENSION(3,ROW),INTENT(IN) :: DNODE
LATSDX= LATSIDELATSDY= LATSIDE
! determine the cartesian coordinates of the nodesDO I=1,ROW
X(I)=MOD(DNODE(3,I),LATSDX*LATSDY) X(I)=MOD(X(I),LATSDX)
IF(X(I).NE.0) THEN CARTX(I)=X(I) ELSE CARTX(I)=LATSDX ENDIF
Y(I)=MOD(DNODE(3,I),LATSDX*LATSDY) YR(I)=Y(I) Y(I)=INT(YR(I)/LATSDX) IF(MOD(DNODE(3,I),LATSDX)==0.AND.MOD(DNODE(3,I),LATSDX*LATSDY)/=0)
THEN ! edge 2 CARTY(I)=Y(I) ELSE IF(MOD(DNODE(3,I),LATSDX*LATSDY).NE.0) THEN CARTY(I)=Y(I)+1 ELSE IF(MOD(DNODE(3,I),LATSDX*LATSDY)==0) THEN CARTY(I)=LATSDY ELSE CARTY(I)=Y(I) ENDIF
IR=DNODE(3,I) Z(I)=INT(IR/(LATSDX*LATSDY)) CARTZ(I)=Z(I) IF(MOD(DNODE(3,I),LATSDX*LATSDY).NE.0) THEN
CARTZ(I)=CARTZ(I)+1 ENDIF
END DO END SUBROUTINE xyz_cordinates
SUBROUTINE ADJ_SITES(NO,EA,SO,WE,J,DNODE,ST) INTEGER I,J,K,NO,EA,SO,WE
liv
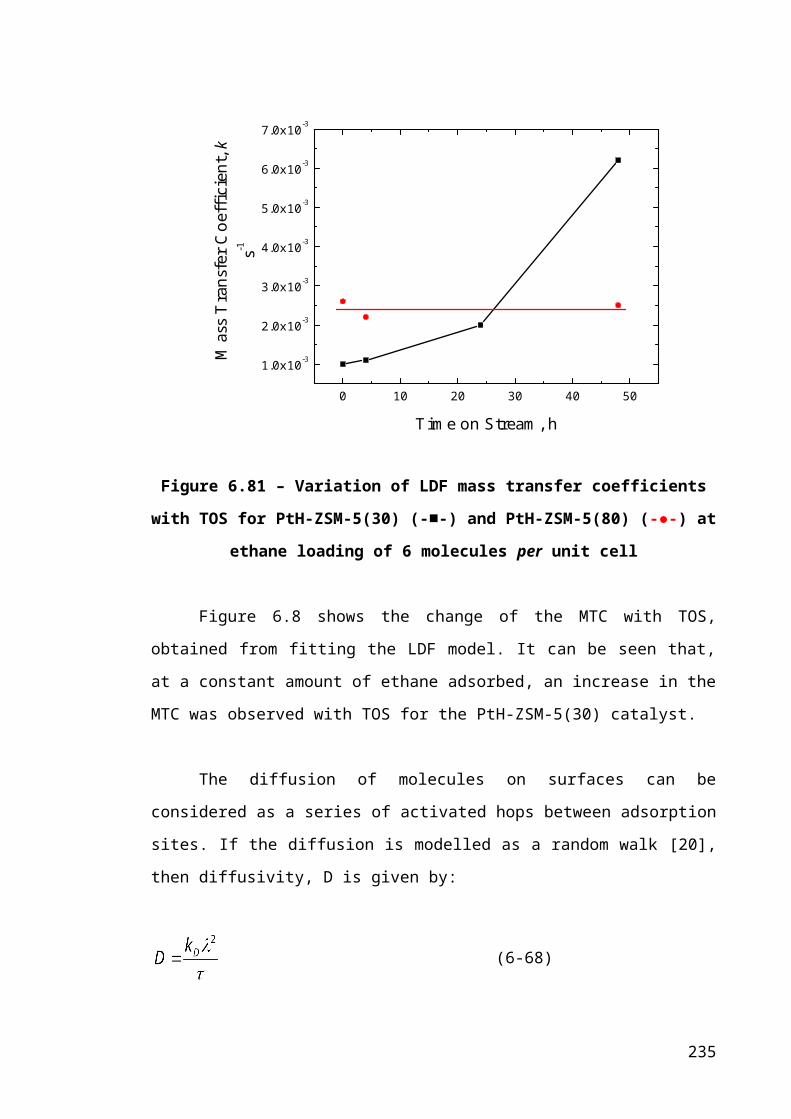
INTEGER, DIMENSION(COL,ROW) :: ST INTEGER, DIMENSION(COL,ROW),INTENT(IN) :: DNODE
! search for site location in ZSM5 structure array
LOOP1: DO I=1,ROW IF (DNODE(3,J)==DNODE(1,I)) THEN
WE = IST(3,I)=1
IF (ST(3,I) ==1) EXIT LOOP1 ! 2 map oncce to array memoryELSE WE = 0 END IF
END DO LOOP1
LOOP2: DO I=1,ROW IF ( DNODE(4,J)==DNODE(1,I)) THEN
EA = IST(4,I)=1
IF (ST(4,I) ==1) EXIT LOOP2 ! 2 map once to array memoryELSE EA = 0END IF
END DO LOOP2
LOOP3: DO I=1,ROW IF ( DNODE(5,J)==DNODE(1,I)) THEN
SO = IST(5,I)=1
IF (ST(5,I) ==1) EXIT LOOP3 ! 2 map once to array memoryELSE SO = 0END IF
END DO LOOP3
LOOP4: DO I=1,ROW IF ( DNODE(6,J)==DNODE(1,I)) THEN
NO = IST(6,I)=1
IF (ST(6,I) ==1) EXIT LOOP4 ! 2 map once to array memoryELSE NO = 0END IF
END DO LOOP4 END SUBROUTINE ADJ_SITES
SUBROUTINE RANDOM_POS3 (i1, i2, i3,d_dir,hd) IMPLICIT NONEINTEGER :: b,i1, i2, i3, i,dcount,cylim,d_dir,hd,cycount,nhopINTEGER, PARAMETER :: dp = SELECTED_REAL_KIND(14, 60)INTEGER, SAVE :: s1 = 2345, s2 = -6789, s3 = 1035REAL (dp) :: random_numb
cylim=3E+7
lv

IF (IAND(s1,-2) == 0) s1 = i1 - 1023IF (IAND(s2,-8) == 0) s2 = i2 - 1023IF (IAND(s3,-16) == 0) s3 = i3 - 1023
b = ISHFT( IEOR( ISHFT(s1,13), s1), -19)s1 = IEOR( ISHFT( IAND(s1,-2), 12), b)b = ISHFT( IEOR( ISHFT(s2,2), s2), -25)s2 = IEOR( ISHFT( IAND(s2,-8), 4), b)b = ISHFT( IEOR( ISHFT(s3,3), s3), -11)s3 = IEOR( ISHFT( IAND(s3,-16), 17), b)random_numb = IEOR( IEOR(s1,s2), s3) * 2.3283064365E-10_dp + 0.5_dp
hd = 1+INT(d_dir*random_numb) !PRINT*, hd,cycount
END SUBROUTINE RANDOM_POS3
SUBROUTINE MOL_BLOCK (LS,LE,RD,ST,LC,DNODE) INTEGER LS,LE,RD,LC,NDINTEGER, DIMENSION(ROW) :: RINTEGER, DIMENSION(COL,ROW) :: STINTEGER, DIMENSION(COL,ROW),INTENT(IN) :: DNODE
!random placement of molecules in lattice DO I=LS,LE R(I) = RD
! occupied sites cannot be recounted IF ( ST(1,I)==0 .AND.I== R(I)) THEN
ST(1,I) = 2 LC = LC +1
END IF END DOEND SUBROUTINE MOL_BLOCK
END PROGRAM MC_CUBIC_DSELF
! PROGRAM HOP_DIR4 SUBROUTINE HOP_DIR4 (SEED,D_DIR,RAND4) INTEGER COUNT,INCR,D_DIR,RAND4INTEGER, DIMENSION(1) :: SEED1 REAL SEED
INCR=1 OPEN(940, FILE = 'hop_numbers', POSITION= 'APPEND')
CALL SYSTEM_CLOCK(COUNT)SEED1 = COUNTCALL RANDOM_SEED( PUT = SEED1)RAND4= 1+INT(D_DIR*SEED)
!WRITE(940,*) RAND4!PRINT*, RAND4
INCR =INCR+1 END SUBROUTINE HOP_DIR4
lvi