chapter 1 the facts to be explained. copyright © 2005 pearson addison-wesley. all rights reserved....
Post on 22-Dec-2015
214 views
TRANSCRIPT

Chapter 1
The Facts to Be Explained

Copyright © 2005 Pearson Addison-Wesley. All rights reserved. 1-2
About Our Author…
Copyright © 2005 Pearson Addison-Wesley. All rights reserved. 1-3
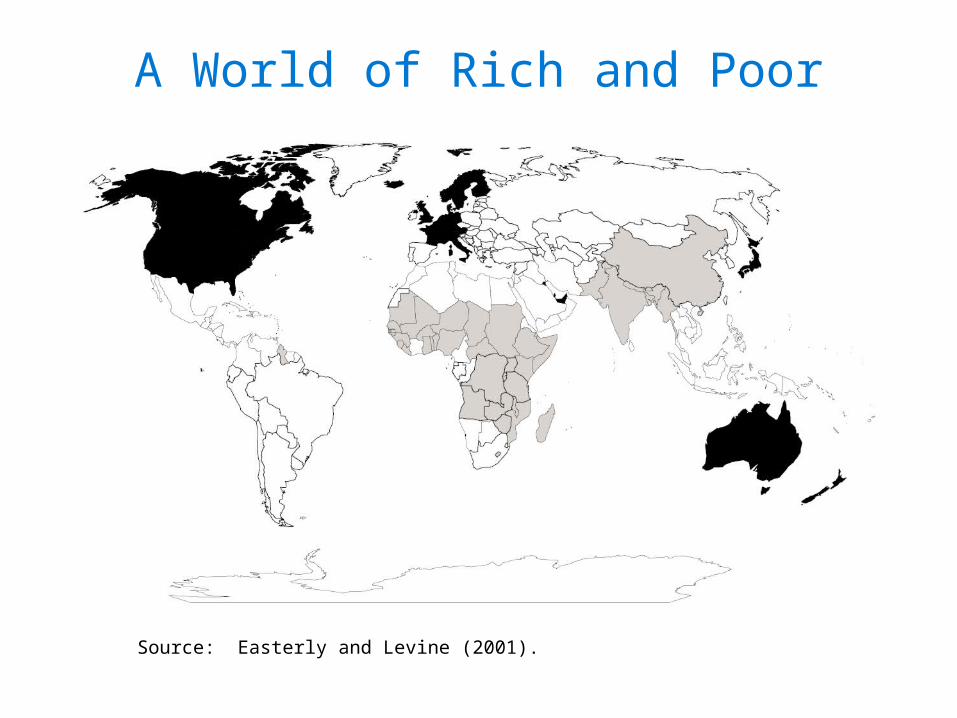
A World of Rich and Poor
Source: Easterly and Levine (2001).
Copyright © 2005 Pearson Addison-Wesley. All rights reserved. 1-4
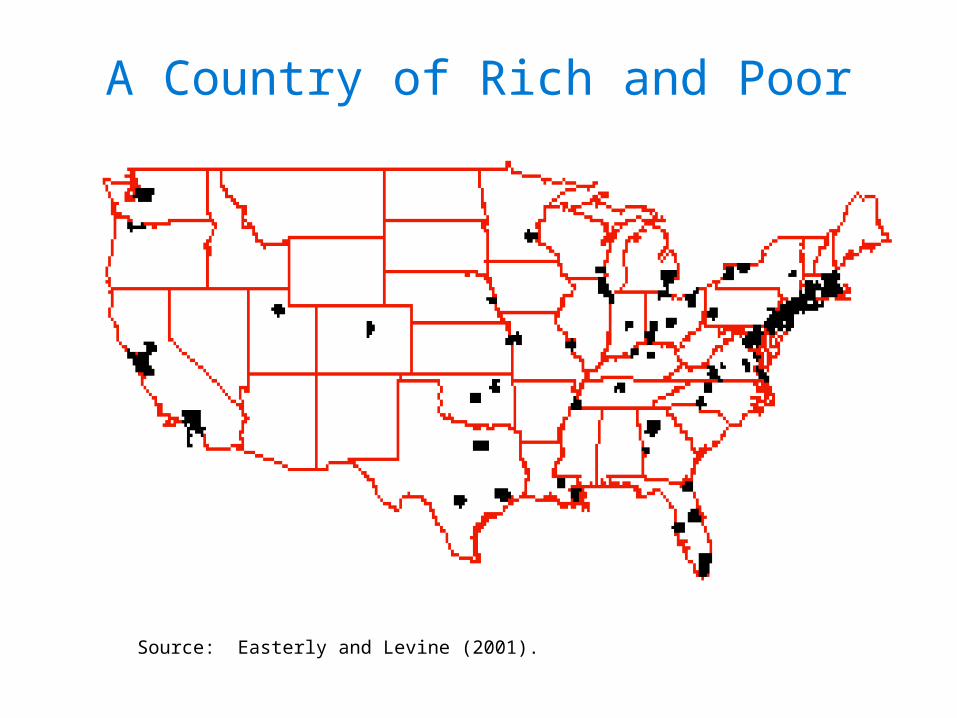
A Country of Rich and Poor
Source: Easterly and Levine (2001).

Copyright © 2005 Pearson Addison-Wesley. All rights reserved. 1-5
A Country of Rich and Poor
Source: Easterly and Levine (2001).

Copyright © 2005 Pearson Addison-Wesley. All rights reserved. 1-6
Our Neighborhood of Rich and Poor
Source: Easterly and Levine (2001).

Copyright © 2005 Pearson Addison-Wesley. All rights reserved. 1-7
Copyright © 2005 Pearson Addison-Wesley. All rights reserved. 1-8
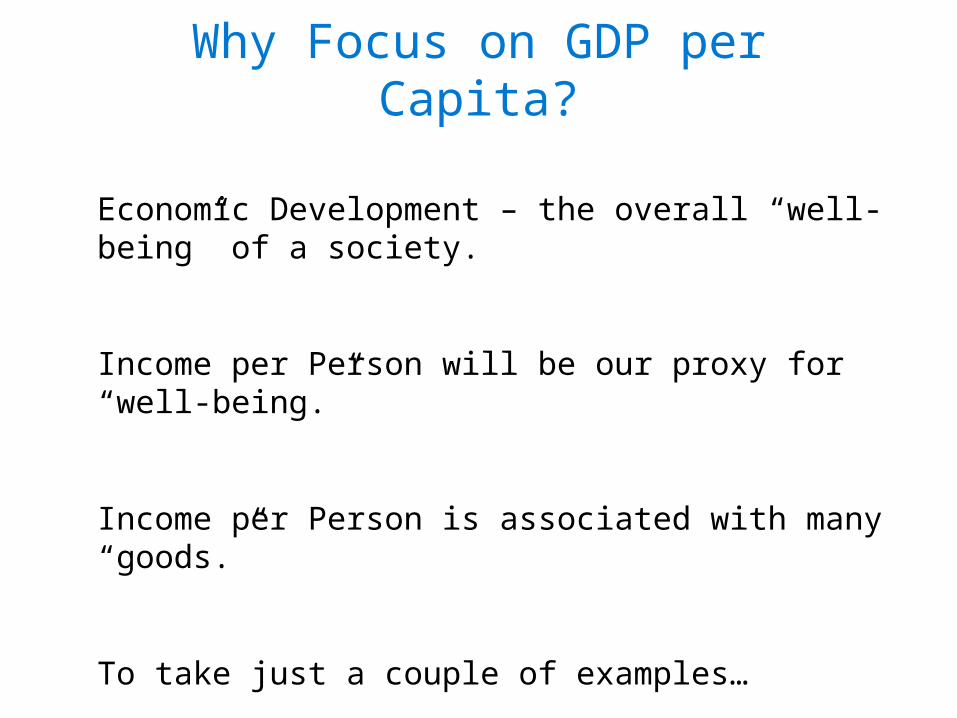
Why Focus on GDP per Capita?
Economic Development – the overall “well-being” of a society.
Income per Person will be our proxy for “well-being.”
Income per Person is associated with many “goods.”
To take just a couple of examples…

Copyright © 2005 Pearson Addison-Wesley. All rights reserved. 1-9
Annual number of deaths to infants under age 1 per 1,000 live births
81
99
133
93
21
89
52
7
22
48
World Africa Asia Latin Americaand the
Caribbean
MoreDeveloped
Regions
1970-1975 2005-2010
Trends in Infant Mortality, by Region
Source: UN, World Population Prospects: The 2004 Revision (medium scenario), 2005.

Copyright © 2005 Pearson Addison-Wesley. All rights reserved. 1-10
Population Living on Less Than US $2 per Day
2002Percent
50
7875
41
23 20
World South Asia Sub-SaharanAfrica
East Asia and thePacific
Latin Americaand the
Caribbean
Middle Eastand North
Africa
Source: World Bank, World Development Indicators 2006.

Copyright © 2005 Pearson Addison-Wesley. All rights reserved. 1-11
A More Holistic Measure of Living Levels – the Human Development Index
• Income Index = log(GDP per cap) – log(100)log (40,000) – log(100)
• Life Exp Index = life exp - 2585 – 25
• Educ Index = (2/3) * (adult literacy/100) + (1/3) * (school enrollment/100)
Does this statistic do a better job at measuring “development?”
HDI = 1/3 (Income Index) + 1/3 (life expectancy index) + 1/3 (education index)

Copyright © 2005 Pearson Addison-Wesley. All rights reserved. 1-12
HDI vs. Income
Income vs. HDI
0.000
0.200
0.400
0.600
0.800
1.000
1.200
0 10000 20000 30000 40000 50000 60000 70000
GDP per Capita (PPP US $ 2003)
HD
I Val
ue,
200
3
Source: Human Development Report (2005).

Copyright © 2005 Pearson Addison-Wesley. All rights reserved. 1-13
What About Happiness?Subjective well-being rankings of 82 societies
(based on combined Happiness and Life Satisfaction scores) HIGH MEDIUM HIGH MEDIUM-LOW LOW Puerto Rico 4.67 Mexico 4.32 Denmark 4.24 Ireland 4.16 Iceland 4.15 Switzerland 4.00 N. Ireland 3.97 Colombia 3.94 Netherlands 3.86 Canada 3.76 Austria 3.69 El Salvador 3.67 Venezuela 3.58 Luxembourg 3.52 U.S. 3.47 Australia 3.46 New Zealand 3.39 Sweden 3.36 Nigeria 3.32 Norway 3.25 Belgium 3.23 Finland 3.23
Saudi Arabia 3.01 Singapore 3.00 Britain 2.92 W. Germany 2.67 France 2.61 Argentina 2.61 Vietnam 2.59 Chile 2.53 Philippines 2.32 Taiwan 2.25 Domin.Rep. 2.25 Brazil 2.23 Spain 2.13 Israel 2.08 Italy 2.06 E. Germany 2.02 Slovenia 2.02 Uruguay 2.02 Portugal 1.99 Japan 1.96 Czech Rep 1.94
S. Africa 1.86 Croatia 1.55 Greece 1.45 Peru 1.32 China 1.20 S. Korea 1.12 Iran 0.93 Poland 0.84 Turkey 0.84 Bosnia 0.82 Morocco .74 Uganda 0.67 Algeria 0.57 Bangladesh 0.54 Egypt 0.52 Hungary 0.41 Slovakia 0.40 Jordan 0.39
Estonia 0.24 Serbia 0.21 Tanzania 0.13 Azerbaijan 0.13 Montenegro 0.06 India 0.03 Lithuania -0.07 Macedonia -0.14 Pakistan -0.30 Latvia -0.70 Albania -0.86 Bulgaria -0.87 Belarus -0.92 Georgia -1.11 Romania -1.30 Moldova -1.63 Russia -1.75 Armenia -1.80 Ukraine -1.81 Zimbabwe -1.88 Indonesia -2.40

Copyright © 2005 Pearson Addison-Wesley. All rights reserved. 1-14
Can You “Buy” Happiness?
Income vs Happiness
-3
-2
-1
0
1
2
3
4
5
6
0 10,000 20,000 30,000 40,000 50,000 60,000
GDP per capita
We
ll-B
ein
g S
core

Copyright © 2005 Pearson Addison-Wesley. All rights reserved. 1-15

Copyright © 2005 Pearson Addison-Wesley. All rights reserved. 1-16

Copyright © 2005 Pearson Addison-Wesley. All rights reserved. 1-17

Copyright © 2005 Pearson Addison-Wesley. All rights reserved. 1-18

Copyright © 2005 Pearson Addison-Wesley. All rights reserved. 1-19

Copyright © 2005 Pearson Addison-Wesley. All rights reserved. 1-20
Convergence vs. Divergence
• Japan’s story implies that countries initally poor “converged” to living standards of the rich. True in general?

Copyright © 2005 Pearson Addison-Wesley. All rights reserved. 1-21
Are Poor Countries Catching Up?
☻ ☻ ☻
0 2,000
1.0
3.0
Per capita income in 1870 (1975 dollars)
Gro
wth
rat
e (%
)
Growth Rates vs. Per Capita Income for Currently Developed Countries, 1870-1979
☻
● ● ● ●
● ● ● ●
●
●
●
☻
Source: Barrow and Sala-i-Martin (1995).

Copyright © 2005 Pearson Addison-Wesley. All rights reserved. 1-22
GDP per Cap Relative to the U.S., 1960 vs. 1988 (log scale)
Income Relative to U.S., 1960
Inco
me
Rel
ativ
e to
U.S
., 19
88

Copyright © 2005 Pearson Addison-Wesley. All rights reserved. 1-23

Copyright © 2005 Pearson Addison-Wesley. All rights reserved. 1-24
Growth Before 1820
• Growth was glacial (on average, 0.01% before 1500, 0.04% 1500 – 1700, 0.07% 1700 – 1820)…. – “Ups and downs certainly. Visitations of plague, famine, and
war. Golden intervals. But no progressive, violent change.”
• Income differences between countries were very small.
• After 1820. some countries grew a lot, while others were left behind.

Copyright © 2005 Pearson Addison-Wesley. All rights reserved. 1-25

Copyright © 2005 Pearson Addison-Wesley. All rights reserved. 1-26
World Economic History in One Picture
Source: Clark (2005).

Copyright © 2005 Pearson Addison-Wesley. All rights reserved. 1-27

Copyright © 2005 Pearson Addison-Wesley. All rights reserved. 1-28
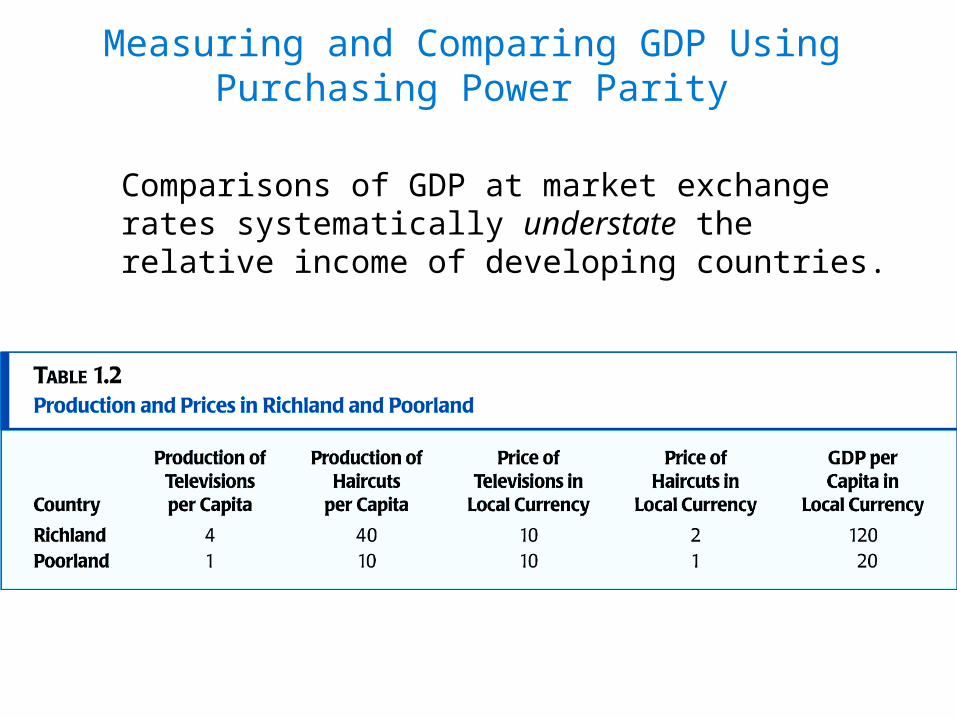
Measuring and Comparing GDP Using Purchasing Power Parity
• Three Big Issues with Income – measuring it, comparing it over time, and comparing it across countries.– Measuring: Counting up all goods and services,
multiply by respective prices, and add ‘em up.
– Comparing Over Time: Due to inflation, need a base year to construct a price index (price of a basket of goods at one year)
– Comparing Over Countries: Since countries use different currencies, why not just use official exchange rates?
• Exchange rates very volatile
• While traded goods tend to have same price, non-traded goods tend to be much cheaper in developing countries.
Copyright © 2005 Pearson Addison-Wesley. All rights reserved. 1-29
Measuring and Comparing GDP Using Purchasing Power Parity
Comparisons of GDP at market exchange rates systematically understate the relative income of developing countries.

Copyright © 2005 Pearson Addison-Wesley. All rights reserved. 1-30

Copyright © 2005 Pearson Addison-Wesley. All rights reserved. 1-31
Problem from Book, pg. 26
Country Computers Ice Cream Price of Computers in
Local Currency
Price of Ice Cream in Local
Currency
U. S. 12 4 2 dollars 4 dollars
China 3 1 1 yuan 1 yuan
Computers can be traded, ice cream can not.
a) Calculate the level of GDP per capita in each country, measured in its own currency.
b) Calculate the market exchange rate between the currencies of the two countries.
c) What is the ratio of GDP per capita in the U.S. to GDP per capita in China, using the market exchange rate?
d) Calculate the purchasing power parity exchange rate between the two currencies (Hint: calculate the cost of a “basket” of goods for each country).
e) What is the ratio of GDP per capita in the U.S. to GDP per capita in China, using the PPP exchange rate?

Copyright © 2005 Pearson Addison-Wesley. All rights reserved. 1-32
Model vs Reality
• In models, we assume what is exogenous and what is not.
• With some relationships, this is clear (rain fall and crop height).
• With most economic relationships, it is not (living standards, education, health, etc…).
• Economics is a science because we can test these theories with data.

Copyright © 2005 Pearson Addison-Wesley. All rights reserved. 1-33
General Issues with Economic Data
• Interesting things are often unmeasurable (utility, social capital,…)
• Comparison often difficult – countries collect info in different forms.
• Biases of official agencies
• Data is almost always observational, not experimental

Copyright © 2005 Pearson Addison-Wesley. All rights reserved. 1-34
Correlation vs. Causation
• Determining if x and y move together is easy
• Corr coef: Σ (x – meanx) (y - meany)______
sqrt ( (x – meanx)2) sqrt ( (x – meanx)2)
• Determining if x causes y is much harder

Copyright © 2005 Pearson Addison-Wesley. All rights reserved. 1-35
Examples
1) Every time I eat chocolate, it gives me acne.
2) Recent studies have proven that watching too much violence on television leads to people being violent in real life.
3) Researchers at the Aabo Akademi found that Finns who speak the language of their Nordic neighbors were up to 25 percent less likely to fall ill than those who do not.
4) Most drug use occurs among the poor - this is because poverty causes people to engage in risky behavior, like abusing narcotics.
5) Morality in this nation has worsened at the same time that adherence to traditional Christian beliefs has declined. Obviously, the latter has caused the former, so encouraging Christianity will ensure a return to traditional moral standards.

Copyright © 2005 Pearson Addison-Wesley. All rights reserved. 1-36

Copyright © 2005 Pearson Addison-Wesley. All rights reserved. 1-37

Copyright © 2005 Pearson Addison-Wesley. All rights reserved. 1-38