chapter-1 introduction - shodhganga : a reservoir of...
TRANSCRIPT

1
CHAPTER-1
INTRODUCTION
1.1 INTRODUCTION
This research work is designed to examine the tools and techniques of technical and
fundamental analyses which are helpful to understand the nature of stock market and
individual stocks and applicable to decision-making about buying and selling of
securities in the Indian capital market. The report of the study has been divided into
seven chapters. The present chapter by way of introduction is devoted to the
discussion of the research problem, the delineation of the concepts of investment,
investment process, security analysis, fundamental analysis, technical analysis, risk
return analysis and efficient market theory and other concepts related to the stock
market and etc.
Investing in various types of financial assets is an interesting activity that attracts
people from all walks of life irrespective of their occupation, economic status,
education and family background. When a person has more money than he requires
for current consumption, he would be coined as a potential investor. The investor
who is having extra cash could invest it in securities or in any other assets like gold,
silver, or real estate or could simply deposit it in his bank account. The companies
that have extra income may like to invest their money in the extension of existing
firm or undertake new venture. All of other activities in a broader sense mean
investment. Investment is the employment of the funds on assets with the aim of
earning income or capital appreciation. Investment has two attributes namely time
and risk. Present consumption is sacrificed to get a return in the future. The sacrifice
that has to be born is certain but the return in the future may be uncertain. This
attribute of investment indicates that risk factor. The risk is undertaken with a view
to reap some return from the investment. For a layman, investment means some
monetary commitment.
A person’s commitment to buy a flat or house or car for his personal use
may be an investment from his point of view.
To the economist, investment is the net addition made to the nation’s capital
stock that consists of goods and services used in the production process.

2
Financial investment is the allocation of money to assets that are expected to
yield some gain over a period of time. It is an exchange of financial claims
such as stocks and bond for money.
“In very simple words, when an individual, a company, any institution or a
group of these park money to earn yield in future it is called investment.”
1.2 CLASSIFICATION OF INVESTMENT
An investment is classified into three categories:
(a) Investment in Real Assets,
(b) Investment in Financial Assets,
(c) Investment in Commodity Assets.
Investment in Real Assets: - Real assets refer to tangible assets, which are in the
form of land, building, furniture, gold, silver, diamonds etc. These assets have a
physical value appearance. They may be marketable or non- marketable. They may
also have the feature of being movable or non-movable. These assets are used to
produce goods and services.
Investment in Financial Assets: - Shares, bonds, bills, debentures, derivatives are
some of the financial assets. These assets represent acclaim on the income generated
by real assets of some other parties. These can be easily traded, as they are
marketable and transferable. These are popularly called paper securities.
Investment in Commodity Assets: - Commodities are new form of investment in
India. Commodity assets consist of wheat, sugar, potatoes, rubber, coffee, and other
grains. Importers and exporters invest in commodities to diversify their portfolios.
Traders hedge or transact in commodities to make gains. A National Commodity and
Derivatives Exchange Ltd. (NCDEX) has been set up in India in 2003 as a public
limited company to transact in commodities.
1.3 INVESTMENT PROCESS:
Investment process involves a series of activities leading to purchase securities or
other investment alternatives. Investment process is generally described in five
stages. These stages are investment policy, security analysis, valuation of securities,
construction of portfolio and, evaluation.
3
1. Investment Policy: The investor before proceeding into investment formulates
the policy for the systematic functioning. The essential ingredients of the policy are:
(a) Investible Fund
(b) Investment Objectives
(c) Knowledge about the alternatives and markets
2. Security Analysis:- The process of analyzing the individual securities and market
as a whole and estimating the risk and return expected from each of the investments
with a view to indentifying undervalued securities for buying and overvalued
securities for selling is both an art and a science and is what is called security
analysis. After formulating the investment policy, the securities to be bought have to
scrutinize through:
(a) Fundamental Analysis
(b)Technical Analysis
(c) Risk and Return Analysis
(d) Efficient Market Hypothesis
3. Valuation of Securities: The third step is perhaps much consideration of the
valuation of investments. Investment value, in general, is taken to be the present
worth to the owners of benefits from investments. The investor has to bear in mind
the value of these investments. An appropriate set of weights has to be applied with
use of forecasted benefits to estimate the value of the investment assets. Comparison
of the value with the current market price of the assets allows a determination of the
relative attractiveness of the asset. Each asset must be valued on its individual merit.
4. Construction of Portfolio: A portfolio is a combination of securities. The
portfolio is constructed in such a manner as to meet the investor‟s goals and
objectives. The investors should decide how best to reach the goals with the
securities available. The investors try to attain maximum return with minimum risk.
Towards this end he diversifies his portfolio and allocates funds among the
securities.

4
5. Valuation: The portfolio has to be managed efficiently. The efficient
management calls for evaluation of the portfolio. This process consists of appraisal
and revision.
1.4 SECURITY ANALYSIS
Security analysis refers to the analysis of trading securities. It analyses the share
price returns and the risk involved in the investment. Every investment involves the
risk and the expected return is related to the risk. The security analysis will help in
understanding the behavior of security prices and the market.
Security analysis refers to the analysis of securities from the point of view of their
prices, returns and risks. The analysis of risk and return related to the securities will
help in understanding the behavior of security prices, market and decision making
for investment. If the analysis includes scrip it is called microanalysis of a company.
If it is an analysis of a market with various securities it is known as macro picture of
the behavior of the market. The entire process of estimating return and risk of a
security is known as security analysis.
The traditional investment analysis when applied to securities emphasizes the
projection of prices and dividends are known as security analysis. It involves the
potential price of a share and dividend stream is forecasted, then discounted back to
the present value. Such value is called as “Intrinsic Value”. Then the intrinsic value
is compared with the securities market price. If the current market price is lower
than the intrinsic value, then purchase is recommended. Alternatively, if the current
market price is higher than the intrinsic value, a sale is recommended. Further, the
security analysis is built around the idea that investors are concerned with two
principal properties inherent in securities, the return that can be expected from
holding a security and risk that the return achieved will be less than the return that
was expected.
Generally, the investors are interested primarily in selling a security for more than
they pay for it. The investor hopes to achieve a higher reward than simply placing
the money in a savings account. An investor who seeks reward that exceeds those
available on savings account forces the real risk. There is no return without risk. The
process of estimating return and risk for individual securities is known as “Security

5
Analysis”. Security analysis is the essence of the valuation of financial instruments.
The value of financial asset depends upon return and risk. The universal fact is that
everyone must recognize the risk component in investment decision.
1.4.1 OBJECTIVES OF SECURITY ANALYSIS
The following are the objectives of Security Analysis:
(i) To estimate the risk and return related to a security
(ii) To find out the intrinsic value of the security with a view to make a
buy/sell decision.
(iii) To identify the undervalued securities to buy or overvalued securities to
sell.
(iv) To analyze the stock market trends to understand the market pattern and
behavior.
(v) To forecast the future earnings and dividends along with the price of the
securities.
(vi) To find out the key determinants of intrinsic value.
(vii) To analyse and point out the position of economy industry and the
company with a view to select the best possible company for investment.
1.4.2 APPROACHES TO SECURITIES ANALYSIS
The Security analysis aims at identifying undervalued securities to buy and
overvalued securities to sell. It involves the entire process of estimating return and
risk for an individual security.
It is deeply rooted in fundamental concepts to measure the risk and return of a
security. It emphasizes on the return and risk estimates rather than mere price and
dividend estimates. However, the return and risk estimates are depended on share
prices and accompanying dividend stream.
Any forecast of security must necessarily consider the prospects of the economy.
The economic sets greatly influence the prospects of certain industries as well as the
psychological aspect of the investing public.

6
The approaches for securities analysis are broadly grouped into the following
categories.
(i) Fundamental Analysis.
(ii) Technical Analysis.
(iii) Risk and Return.
(iv) Efficient market hypothesis.
1.5 FUNDAMENTAL ANALYSIS
A fundamental analysis is a time honored, value based approach depending upon a
careful assessment of the fundamentals of an economy, industry and company. The
fundamental analysis studies the general economic situation, makes an evaluation of
an industry and finally does an in depth analysis, both financial and non-financial of
the company. In the fundamental analysis an attempt is made to analyse various
fundamentals or basic factors that affect the risk-return of the securities.
In the fundamental analysis the security analyst or prospective investor is primarily
interested in analysing factors such as economic influences, industry factors and
pertinent company information -such as product demand, earnings, dividends and
management in order to calculate an intrinsic value for the firm‟s securities. The
investor makes an investment by comparing the intrinsic value with the current
market price of a security.
The intrinsic value is the present value of future dividends and capital appreciation
computed at an appropriate discount rate to reflect the riskiness of the share. The
intrinsic value is also known as the fundamental value. Based on the fundamental
value the investor will make a decision to buy or sell a share, by comparing the
market price of the shares. If the intrinsic value of a share is higher than- the market
price the share is to be bought before the market corrects its mistake by increasing
the price of the security On the other hand, if the market price is higher than the
intrinsic value, sell that security This is because the price may be reduced once
investors realize and start selling such share.

7
PHASES OF FUNDAMENTAL ANALYSIS
1.5.1 ECONOMIC ANALYSIS
Economic factors play a major role in any investment decision, which is made for
making a gain and better return. Economic analysis and forecasting company
performance and return is necessary for making investments. In the economic
analysis the investor has to analyze economic factors to forecast of the economy in
order to identify the likely growth of the economy and its trend. Further, the
investors will identity those industry groups which will be in the coming years and
he will be selecting such industry in order to choose the companies in such an
industrial group. The economic analysis enables the investor to develop a sound
economic understanding and to be able to interpret the impact of the important
economic indicators on stock markets. The economic analysis helps to understand
the state of the economy of the country at macro level. The analysis of the stat of the
economy at macro level incorporates how the economy has performed in the past
and how it is performing in the present and how it is expected to perform in the
future.
The performance of a company depends on the state of the economy. If the economy
is in recession the performance of companies will be bad. If the economy is
booming, incomes are rising and demand is increasing, the company‟s performance
in general may be prosperous. The Indian economy is depending upon the
agriculture. Agriculture is the profession for 70% of the population and it contributes
nearly 35% of the output to the economy Therefore it is most important for the
assessment and forecast of industrial performance. If the monsoon is favourable and
agricultural income is good the demand for industrial goods and ser ices will be
favourable and industry may get increased sales revenue and profits.
India has mixed economy. The public sector plays a vital role in the economy. The
central government is the biggest investor and spender. The investment made in the
public sector and expenditure level is the performance of the Indian economy. The
Indian economy has been influenced by many factors such as government budgets,
taxation external debt of the government etc. These factors will influence increased
demand and income levels of the public. The changes in taxation policies have an
impact on the industry and the corporate sector.

8
The monetary policy of the government depends on the government‟s budget policy.
The central government borrows money from the public; credit policy of the RBI
shows a major impact on the industrial growth. The growth of the industry mainly
depends upon the demand and supply for goods in the country. The monetary and
budget policy will influence the price level and interest rates. The interest rates in
the free market and the degree of inflation do have a major influence on the
economy and the performance of tire industries. A low level of inflation is very
useful for business sector but higher degree of inflation will dismantle the business
plans, lead to escalations and squeeze profit margins. All these factors adversely
affect the performance of industry and companies.
The general level of business conditions influences the demand for industrial
products and the performance of the industry. The business cycles in the economy
may cause fluctuations depending upon the state of the economy. Performance of
agriculture sector, availability of energy and other infrastructure outputs, imported
inputs and other factors do influence the costs and profit margins of the corporate
sector.
The economic policies of the government is the most important factor for the Indian
economy The stability of the policies, good performance of the economy in general
will influence the company‟s performance in particular. The stability of the
government is the basic foundation for economic policies of the country. The
uncertainties in the political system of the country will show greater impact on the
economic system. The political uncertainties will show adverse changes in the
government policy and also affect the industrial development. The central
government policies relating to various projects, foreign direct investment foreign
collaborations; foreign investment, price and controls, listing requirements on stock
exchanges and other factors do affect the performance of companies. The balance of
payment position, the, foreign exchange rate may show an impact on the economy
and the securities market. All the above factors may influence the economy, which
in turn show impact on the corporate sector‟s performance.
The economic analysis involves the analysing of the following factors:
1. Economic growth
2. Population

9
3. Monsoon and agricultural production
4. Industrial production
5. Natural resources and availability of raw material
6. Inflation
7. Interest rate
8. Foreign exchange reserves
9. Balance of payment position
10. Budgetary deficit
11. Public debt and foreign debt
12. Domestic savings and capital output rate
13. Employment
14. Taxation policy
15. Infrastructure facilities
16. Government policy
17. Political stability
18. International development
19. Capital formation
20. Savings pattern
21. Research and technological development
22. Economic indicators
23. Economic reforms
24. Foreign direct investment
1.5.2 INDUSTRY ANALYSIS
The second phase of fundament analysis consists of a detailed analysis of specific
industry; its characteristics, past record, present state and future prospects. The
purpose of the industry analysis is to identify the industries with a potential for
future growth and to invest in equity share of companies selected from such
industries. An industry is a homogeneous group of companies. Industry broadly
covers all the economic activities happening in a country. A broad concept of
industry would include factors of production, transportation, trading activity and
public utilities.

10
The industrial growth of the nation leads to the development of a nation. Industries
are to be considered as community interest. Industry consisting of products on
process oriented units. There are a number of industries. The industries can be
divided according to the nature of their function. For ex. Automobile industry, steel
industry etc.
The production of commodity is known as manufacturing sector. The manufacturing
sector competes with the agricu1ture transportation and public utilities. A
combination of different industries output, a service sector output is known as Gross
National Product (GNP). Each industry is broken down into its logical product
classes. The growth of an industry begins with a major technological change. The
change in technology results in rapid industrial growth.
The growth of many industries tends to reduce the impact of cost reduction. The
cost reduction tends to limit the continued growth of a market. The technological
innovation can reduce cost of production substantially An industry growing at a
rapid rate, faster than the national economy will eventually have its - growth
dampened. A decrease in population growth may lead to a decrease in the rate of
growth of industrial sector.
The growth of many industries is divided into 3 stages. They are as follows:
(I) The pioneering stage
(II) The expansion stage
(III) The stagnation stage
1.5.3 COMPANY ANALYSIS
Company analysis is a study of the variables that influence the future of a firm both
quantitatively and qualitatively. It is a method of assessing the competitive position
of a firm, its earnings and profitability, the efficiency with which it operates it
financial and its future earnings per share The basic purpose of the company analysis
is to know the intrinsic value of a share of a company which depends on the
financial performance of a company over a period of time. The terms which are in
the same industry are compared to one another to find Out which one is the best
performer to identify the potential company for investment based on its financial
position. The company analysis is the most important factor for investment and

11
entering into the stock market. The following factors will help in analysis of
particular scrip.
a) Marketability
b) Accounting system
c) Profitability
d) Dividend policy
e) Capital structure
f) Financial analysis
g) Operating efficiency
h) Management capability.
(a) The most important factor for selection of a particular company‟s share is its
marketability. The earnings of the company influence the marketability. The share of
the company in the industry, growth and stability of its sales determine the earnings.
Company, which has a strong competitive position, will provide more earnings. The
sales are also dependent on two other major factors such as the operating efficiency
of the company and the input costs.
(b) Accounting system is another important element in analysis of the
company‟s financial position. There is a chance of faulty interpretation of company
earnings due to inconsistent accounting policies. The accounting variations are
observed for recording costs, expenses and other items, which may change the
earnings to a great extent. The accounting policies may also highly influence the
inventory pricing, methods of changing depreciation, tax and non-operating income.
All these factors show an impact on corporate earnings.
(c) Profitability is the barometer for measuring a company‟s performance.
Investing in a company‟s security indicates the right to future earnings of that
company. Therefore the investor is interested in earnings stability of the company.
Generally, the investors select those companies that have stable and growing sales.
There is a strong relationship between sales and earnings. The profitability of the
company can be analysed with the help of gross profit margin, net profit margin,
earning power, return on equity and earning per share ratios. The increasing trend in

12
gross profit margin will indicate the increase in operating income due to a reduction
in operating expenses. Net profit margin is the most powerful tool in selecting a
particular company‟s scrip. It is the net profit after tax as percentage of sales. The
reduction in corporate tax will enhance the net profit margin and this in turn will
influence the intrinsic value of a share The earning power is the net profit to total
assets Return on equity is the important ratio to determine the per share return.
Earnings per share are the ratio of profit after taxes to number of equity shares. It
gives the per share earning available to the equity shareholders. Earning per share
indicates the amount of surpluses and reserves that the company has generated and
retained from its profits over the years.
(d) Dividend policy of the company also influences the value of a share. Some
companies will have a stable dividend policy with higher rate of dividend in the
future.
(e) Capital structure is another important factor in determining the value of a
share. The return on the equity holder‟s investment can he influenced by financial
leverage. The company can use debt funds instead of using total equity funds. The
debt equity ratio can be used to analyse the leverage position. A high proportion of
preference share capital in the capital structure tends to create thick equity position.
The preference shares should be utilized only when it enhances the financial strength
and earnings of the company. The debt component in capital structure of the
company plays an important role in long-term financing. The debt funds will have
lower rate of cost of financing: The interest paid on debt funds is deductible from the
profit and reduces the tax liabilities. The use of debt funds due to leverage effect, the
equity shareholders earnings may be maximized.
(f) Financial solvency will examine solvency and the liquidity position of the
company. The analysis contains a number of parameters. It will enable the company
to know about the performance and efficiency of the company in various aspects.
(g) Operating efficiency will reflect the growth of sales volume and increased
operating profits. The operating efficiency can be determined from the utilisation of
the plant capacity If the operating efficiency is higher then there will be an increase
in earnings per share. The future earnings of a company depend upon the ability of

13
the management to invest its funds wisely. The capital expenditure of a company
will increase the production capacity and in turn the sales.
(h) Management capability is the most important factor in determining the future
of the company. The company management should have dynamism, abilities,
competency, talent, skills, courage and leadership qualities. Excellent management
is paramount to investment success. The quality of the management is the key for
successful performance. The ability of the management is the most important
element. The management shall have managerial and technical capabilities to run the
enterprise efficiently. The management must have the financial 9 for the smooth
functioning of the production.
Financial Ratios: - A ratio is an arithmetical relationship between two figures.
Financial ratio analysis is a study of ratios between various items in financial
statements. Financial ratios have been classified in several ways. Financial ratios are
calculated from the balance sheet and profit and loss account. Ratios summarize the
data for easy understanding, comparison and interpretation. For our purpose, we
divide them into five broad categories as follows:
1. Liquidity Ratios:- Liquidity refers to the ability of a firm to meet its obligations
in the short run, usually one year. Liquidity ratios are generally based on the
relationship between current assets and current liabilities. The important liquidity
ratios are:
(a) Current Ratio
(b) Acid-test Ratio
(c) Cash Ratio
2. Leverage Ratios: - Financial leverage refers to the use of debt finance. While
debt capital is a cheaper source of finance, it is also a riskier source of finance.
Leverage ratios help in assessing the risk arising from use of debt capital. The
important leverage ratios are:
(a) Debt-equity Ratio
(b) Debt-asset Ratio
(c) Interest Coverage Ratio

14
(d) Fixed Charges Coverage Ratio
(e) Debt Services Coverage Ratio
3. Turnover Ratios: - Turnover ratios, also referred to as activity ratios or assets
management ratios, measure how efficiently the assets are employed by a firm.
These ratios are based on the relationship between the level of activity, represented
by sales or cost of goods sold, and the level of various assets.
(a) Inventory Turnover
(b) Debtors Turnover
(c) Average Collection Period
(d) Creditor Turnover
(e) Average Payment Period
(f) Fixed Assets Turnover
(g) Total Assets Turnover
4. Profitability Ratios: - Profitability reflects the final result of business operations.
There are two types of profitability ratios: profit margin ratios and rate of return
ratios. Profit margin ratios show relationship between profit and sales. Since profit
can be measured at different stages, there are several measures of profit margin. Rate
of return ratios reflect the relationship between profit and investment.
(a) Gross Profit Margin Ratio:- The gross profit margin ratio is defined as:
= ×100
Gross profit is defined as the difference between net sales and cost of goods sold.
This ratio shows the margin left after meeting manufacturing costs. It measures the
efficiency of production as well as pricing.
(b) Net Profit Margin Ratio:- The net profit margin ratio is defined as:
= ×100
15
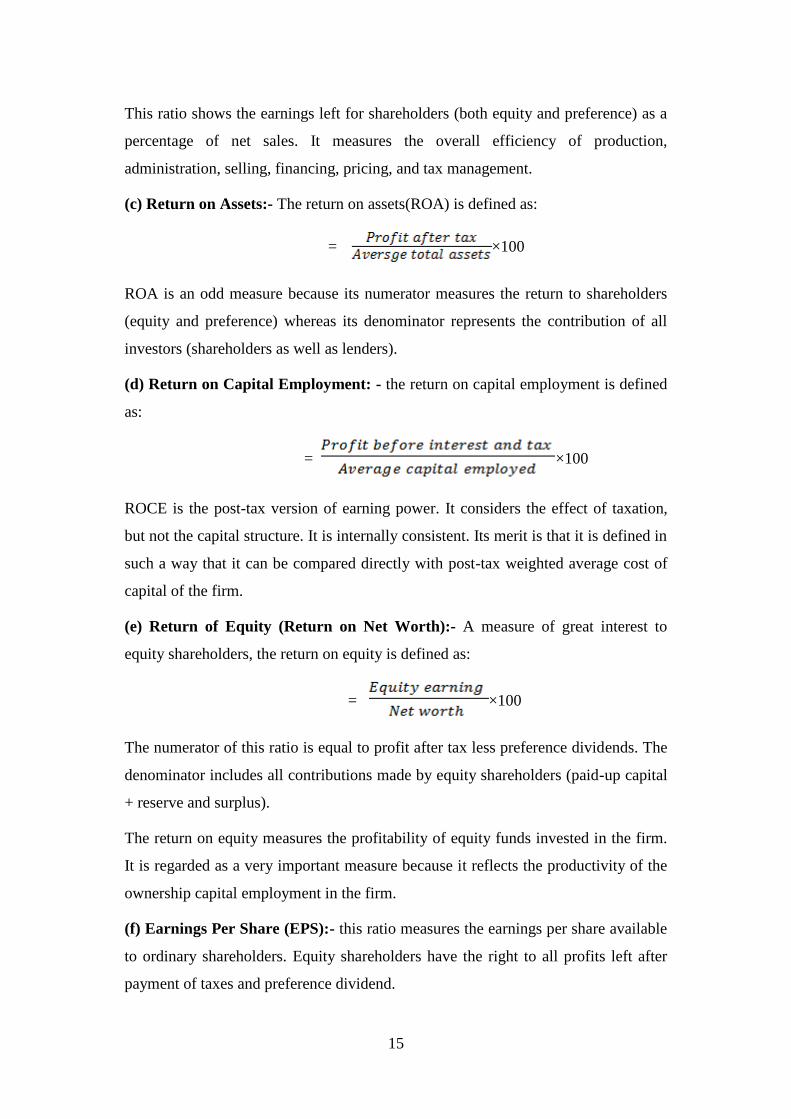
This ratio shows the earnings left for shareholders (both equity and preference) as a
percentage of net sales. It measures the overall efficiency of production,
administration, selling, financing, pricing, and tax management.
(c) Return on Assets:- The return on assets(ROA) is defined as:
= ×100
ROA is an odd measure because its numerator measures the return to shareholders
(equity and preference) whereas its denominator represents the contribution of all
investors (shareholders as well as lenders).
(d) Return on Capital Employment: - the return on capital employment is defined
as:
= ×100
ROCE is the post-tax version of earning power. It considers the effect of taxation,
but not the capital structure. It is internally consistent. Its merit is that it is defined in
such a way that it can be compared directly with post-tax weighted average cost of
capital of the firm.
(e) Return of Equity (Return on Net Worth):- A measure of great interest to
equity shareholders, the return on equity is defined as:
= ×100
The numerator of this ratio is equal to profit after tax less preference dividends. The
denominator includes all contributions made by equity shareholders (paid-up capital
+ reserve and surplus).
The return on equity measures the profitability of equity funds invested in the firm.
It is regarded as a very important measure because it reflects the productivity of the
ownership capital employment in the firm.
(f) Earnings Per Share (EPS):- this ratio measures the earnings per share available
to ordinary shareholders. Equity shareholders have the right to all profits left after
payment of taxes and preference dividend.

16
=
This ratio is quite significant. EPS affects the market value of shares. It is an
indicator of dividend paying capacity of the firm.
(g) Dividend Per Share (DPS):- All the profits after tax and preference dividend
available for equity shareholders are not distributed among them as dividend. Rather
a part of it is related in business.
=
5. Valuation Ratios: - Valuation ratios indicate how the equity stock of the
company is assessed in the capital market. Since the market value of equity reflects
the combined influence of risk and return, valuation ratios are the most
comprehensive measures of a firm‟s performance. The important valuation ratios
are:
(a) Price-to-Earning RATIO (PER):- indicates how much are investors willing to
pay per a monetary unit of earnings. Perhaps the most popular financial statistic in
stock market discussion, the P/E ratio is defined as:
=
The PER indicator estimate the number of years during which the investment can be
recovered assuming that the entire profit is distributed as dividend. The P/E ratio is a
summary measure which primarily reflect the following factors; growth prospectus,
shareholder orientation, corporate image, and degree of liquidity.
Investors can do the interpretation of the PER indicator as follows:
A relatively low PER indicates a cheap share, therefore adequate to be
purchased.
A relatively high PER indicates an expensive share that can also be
overvalued.
(b) Market Value to Book Value Ratio (P/B Ratio):- Is the ratio of the company‟s
current share price compared to the book value per share. It is another important

17
ratio because it indicates the value conferred by financial markets to a company‟s
management. It is calculated with the formula:
=
If PBR is less than one, it reflects a safe investment in the company, because
it says that the book value is a “support” level of the market price.
If PBR is above one, i.e. the book value is lower than the market price, it
might be an indication that the shares are overvalued.
1.6 TECHNICAL ANALYSIS
The word “Technical” implies a study of market itself and not of the various
external factors which affect the market. According to technical analysis, all relevant
factors, whatever that may be, get reflected in the volume of the stock exchange
transaction and the level of share prices, or more generally by the market. Technical
analysis is the study of market information.
Technical analysis attempts to predict future stock prices by analysing past stock
prices. In effect, it asserts that tomorrow‟s stock prices are influenced by today‟s
price. Technical analysis is very appealing ascertain, because it eliminates the need
to perform fundamental analysis.
It is the analysis of share prices and the traded volume to predict the near future
price movement. It is 90 percent psychological and 10 percent logical, which means
market is driven by psychology of investors in 90 percent times and, 10 percent of
the times logical factors affect the market. Technical analysis is based on the belief
that history repeats itself, which means price patterns and traded volume again and
again over a period of time. This repetition of price and volume helps in predicting
near future price movements.
Technical analysis refers the process of identifying trend reversals at an earlier stage
to formulate the buying and selling strategy. With the help of several indicators they
analyse the relationship between price volume and supply demand for the overall
market and the individual stock. Volume is favorable on the upswing i.e. the number

18
Of shares traded is greater than before and on the downside the number of shares
traded dwindles. If it is the other way round, trend reversals can be expected.
1.6.1 ASSUMPTIONS OF TECHNICAL ANALYSIS
The technical analysis is based on the following assumptions:-
i. The individual scrip act likes a barometer. A small event is usually discounted
in advance with price movements.
ii. The market price is determined mainly by interaction of demand and supply
of security.
iii. There are both rational and irrational factors, which surround the share supply
and demand.
iv. Change in trends is caused by shifts in the demand and supply position shares.
v. An upward trend in prices of scrip denotes a balance buying, a downward
trend is an indicative of extreme supply, and analysis is the technician‟s main
challenge.
vi. The upward or downward trend of prices of stocks in the market depends up
on the sentiment, psychology and emotions of operators or traders.
vii. Some chart patterns trend to repeat them.
viii. The present trends are influenced by the past trends.
1.6.2 TECHNIQUES/TOOLS OR INDICATORS OF TECHNICAL
ANALYSIS: Generally, we include following tools and techniques in technical
analysis. These indicators analysed the data and provide the trend analysis. The main
indicators of „Technical Analysis‟ are:
1. Dow theory
2. Charts
3. Support and Resistance level
4. Moving Average
5. Odd lot trading.

19
6. Short selling Theory
7. Volume of trade
8. Fibonacci Number
9. Stochastics
10. Ralph Nelson Elliott Wave Theory
11. Oscillators and etc.
1. DOW THEORY
This theory is developed by Dow to explain the movement of indices of Dow Jones
Averages in 1984. He developed the theory on the basis of certain hypothesis which
is as follows:
a) No single buyer can affect (influence) the market price behavior. However, a
single investor can affect the daily price movement by buying or selling of huge
quantum of particular security.
b) The market discounts everything.
c) Dow Theory explain that it is not a tool of beating the market but it is a way of
understanding the market.
Explanation of Dow Theory
Dow describes the stock prices as moving in trends like the movement of water. He
postulates three types of price movement like:
a) Primary or major Trends (like the tide in ocean)
b) Secondary or Intermediary trends (resemble Waves)
c) Short run movement (like the ripples)
a) Primary Trend
The price trend may be either increasing or decreasing. When a market exhibits the
increasing, trend, it is called bull market. The bull market shows the three clear cut
peaks. Each peak is higher than previous peak and this price rise is accompanied by
heavy trading volume.

20
b) Secondary Trend
Secondary trend moves against the main trend and leads to correction. In the bull
market, the secondary trend is result of falling 33% to 66% of earlier rise. Secondary
trend carries of earlier rise. Secondary trend carries the price upward and corrects
the main trend.
c) Minor Trends
Minor trends are just like the small fluctuations (like ripples) in the market. They are
simply the daily price fluctuations. Minor trend tries to correct the secondary price
movement. It is better for investor to concentrate on primary or secondary trends
than minor trends.
2. CHARTS
Technical analysis has a huge quantum of information in terms of intraday traded
prices and opening and closing day prices, the data is represented mostly in term of
charts, Chart plot the price information well and several other observations.
Charts have the strength of condensing information into a pattern that is easy to
understand and grasp rather than numbers of statements. Charts patterns provide a
framework to analyze the position of the market in terms of single share or a
consolidation of the market position. More importantly, chart patterns and hence.
Technical analysts can help determine who is dominating the market at a specific
time. This information can help investors to understand the market and achieve their
investment goals. Chart pattern analysis can be used to make short term or long term
forecasts. The data can be intraday, weekly or monthly and the patterns can be as
short as one day or as long as many years. The charts also have the following uses:
Spot the current trends for buying and selling
Indicate the probable future action of market by projection.
Shows post historic performance.
Indicates the important areas of support and resistance.
The most commonly used charts are:
a. Line charts/Line and Volume Charts.
b. Bar Charts.

21
c. Point and Figure charts
d. Candle stick charts
a) Line chart
The line chart connects the prices over a time period and is more useful for
identifying long term trends. It has a line that connects the closing price against
time.
b) Bar chart
The bar chart gives the chartist information on price changes at a time. In this, the
high, low, open, close share price or index level is plotted against time.
c) Point and figure chart
The point and figure chart shows only the price changes. It eliminates noise of
detail, foisting only on trends. The two distinct marks of cross/round indicate
respectively a rise/fall in a price range.
d) Candlestick chart
Candlestick charts plot information similar to bar charts but could reveal an extra
intuitive interpretation. Candlesticks are shown as a vertical rectangle with wicks at
both ends. When the closing price is higher than opening, the rectangle is
transparent, and in the reverse case, it is black.
Two basic facts (tenets) of technical analysis are that prices exhibit trends and
history repeats themselves. An uptrend (bullish market) indicates that the forces of
demand (bulls) are in control, leading to an increase in the share prices and a
downtrend (bearish market) indicates that the forces of supply (hears) are in control,
causing a decline in the share prices.
3. SUPPORT AND RESISTANCE LEVEL
Anybody who is interested in technical analysis should know the support and
resistance level. A support level exists at a price where considerable demand for that
stock is expected to prevent further fall in the price level. The fall in the price may
be halted for the time being or it may result even in price reversal, at the support
level, if the demand for particular scrip is expected.

22
In the resistance level, the supply of scrip would be greater than the demand and
further rise in price is prevented. The selling pressure is greater and the increase in
price is halted for the time being.
Support and resistance level usually occur whenever the turnover of a large number
of shares tend to be concentrated at several price, levels.
When the stock touches a certain level and then drops, this is called resistance level
and if the stock reaches down to certain level and then rises there exists a support.
We can understand it numerically by following example: If a scrip price hovers
around Rs. 150 for some weeks then it may rise and reach Rs. 210. The scrip keeps
on falling back to around its original price Rs. 150 and halts. Then it moves upward.
In this case Rs. 150 becomes the support level. At this point the scrip is cheap and
investors buy it and demand makes the price move upward. Whereas Rs, 210
becomes the resistance level, the price is high and there would be selling pressure
resulting in the decline of the price.
4. MOVING AVERAGE METHOD
An average is the sum of price of a share over some weekly periods divided by the
number of weeks. This point is marked on the latest date for which a price bar has
been plotted. This process is repeated for the previous data. The point thus obtained
are connected together to give the moving average line. A moving average is a
simple presentation of historical data. The data relating is the most important
element in moving average. The each data point is the arithmetic average of the
previous data. A 15 day‟s moving average measures the average over the previous
15 days trading.
5. FIBONACCI NUMBERS:
Leonardo Fibonacci was a mathematician who was born in Italy around the year
1170. Fibonacci while studying the great Pyramid of Gizeh in Egypt discovered the
relationship between numbers that are now referred to Fibonacci numbers. Fibonacci
numbers are a sequence of numbers in which each successive number is the sum of
two previous numbers 1, 1, 2, 3, 5, 8, 13, 21, 34, 55, 89, 144, 233 etc.

23
These numbers possess an intriguing number of interrelationships, such as the fact
that any given number is approximately 1.618 times the preceding number and any
given number is approximately 0.618 times the following number.
There are four popular Fibonacci studies arcs, fans, retracements and time zones,
1. Fibonacci Arcs.
2. Fibonacci Fans.
3. Fibonacci Retrocements.
4. Fibonacci Time Zones.
The interpretation of these studies involves anticipating changes in trends as prices
near the lines created by Fibonacci studies. The moving averages are used to study
the movement of the market as well as the individual scrip price. The moving
average indicates the underlying trend in the scrip. The period of average determines
the period of the trend that is being identified. For identifying short term trend, 10
day to 30 day moving averages are used. In the case of medium term trend 50 day to
125 day are adopted. 200 day moving average is used to identify long term trend.
6. ODD LOT TRADING
Shares are generally sold in a lot of hundred. Shares, sold in smaller lots, fewer than
100 are called odd lot. Such buyers and sellers are called odd lotters. Odd lot
purchases to odd lot sales (Purchase % Sales) is odd lot index. The increase in odd
lot purchase results in an increase in the index. Relatively more selling leads to fall
in the index. It is generally considered that the professional investors are more
informed and stronger than the odd lotters. When the professional investors
dominate the market, the stock market is technically strong. If the odd lotters
dominate the market, the market is considered to be technically weak. The notion
behind is that odd lot purchase is concentrated at the top of the market cycle and
selling at the bottom.
7. VOLUME OF TRADE
Volume of trade is influenced by the behavior of price. Dow gave special emphasis
on volume. Volume expands along with the bull market and narrows down in the
bear market. If the volume falls with rise in price or vice versa, it is a matter of

24
concern for the investor and the trend may not persist for a longer time. Technical
analyst used volume as an excellent method of confirming the trend. The market is
said to be bullish when small volume of trade and large volume of trade follow the
fall in price and the rise in price.
Large volume with rise in price leads to bull market. If the volume decline for five
consecutive days, then it will continue for another four days and the same is true in
increasing volume.
8. SHORT SALES
Short selling is a technical indicator known as short interest. Short sales refer to the
selling of shares that are not owned. The bears are the short sellers who sell now in
the hope of purchasing at a lower price in the future to make profits. The short
sellers have to cover up their positions. Short positions of scrips are published in the
business newspapers. When the demand for a particular share increases, the
outstanding short positions also increase and it indicates future rise of prices. These
indications cannot be exactly correct, but they show the general situations.
ingdaily trad Average
positioninterest Short RatioInterest Short
This interest tells us that the how much period is required to fulfill the short term
interest. It is at high level when it crosses the two. Short selling theory is not a
certain indicator; it is only a general or normal approach. Technical investor or
analyst assumes that it is an unnatural technique which short term investors find
impossible to understand.
9. STOCHASTICS
The stochastic process has an indefinite progression of jointly distributed random
variables. The stochastic oscillator compares where a share‟s price closed relative to
its trading range over the last n-time periods.
Basically, it is oversold technical indicator. If a share or index is identified as
„oversold”, there exists the possibility that buyers will enter the market, driving the
price upward. On the other hand, if a share is “Over bought”, the sellers will over
power buyers to drive the price lower. In trending markets, stochastic oscillator can
stay over bought or oversold. In a strong up trending market the stochastic oscillator

25
can stay over bought while in a strong down trending market the measure can
maintain its oversold condition. From a timing perspective, stochastic oscillator
works best in non trending or consolidating market. The stochastic oscillator
compares a share‟s closing price level to its range over a specified period time.
Generally speaking, prices tend to close near their highs in up trending markets and
near their lows in down trending markets.
The stochastic indicator is plotted as two lines:
The “Percent D”, % D Line
The “Percent K”, % K Line
The % K is more sensitive of the oscillators, but it is the % D line that carries greater
weight and gives major signals. Both these values range from 0 to 100. Values
above said are considered strong and suggest prices are closing near their highs.
Value below 20 indicate prices are closing their lows and are indicative of weakness.
It is usually estimated that % k will change direction before % D. However, when
the % D line changes directions prior to the % K line a slow and steady reversal is
often indicated when both % K and % D lines change direction and the faster % K
changes direction to retest a crossing of the % D line, but does not cross it, a
confirmation of the stability of the prior reversal is made.
Formula of % K parameter of the stochastic or “raw stochastic” is
100periods%K lowLowest - periods%K high Highest
periods%K lowlowest - price closingParameter%K
The formula can be restated as follows % K= 100x[(CL-Ln)]/[(Hn-Ln)]
Where CL= The current day‟s close
Ln= The lowest point over the past n days
Hn= The highest point over the past n days.
N= the number of days, typically five or more.
A moving average of % K is then calculated using the number of time
periods (n days) used in the % K computations. This moving average is called % D.
% D represents a smoothing of % K and is an- day moving average of% K.
26
The formula for % D sometimes can be computed as follows:
% D= 100x (Hn/Ln)
L= The lowest low for the n-day period.
H= The highest high for the same n- day period.
The fast stochastic (% K) and (% D) are plotted on some chart.
10. RALPH NELSON ELLIOTT WAVE THEORY
Technical analysis is based on Ralph Nelson Elliott Wave Theory/Principal. The
basis of this theory was developed from the observation that rhythmic regularity had
been the law of the nature- whether of tide, whether, of life it has the capacity of
repeating itself indefinitely.
The Elliott wave principle is a form of technical analysis that attempts to forecast
trends in the financial markets and other collective activities. It is named after
(Ralph Nelson Elliott (1871-1948), an accountant who developed the concept in the
1930s: he proposed that market prices unfold in specific patterns.
Elliott published his view of market behavior in the book “The Wave Principle
(1938)”, in a series of articles in „Financial World‟ magazine in 1939.
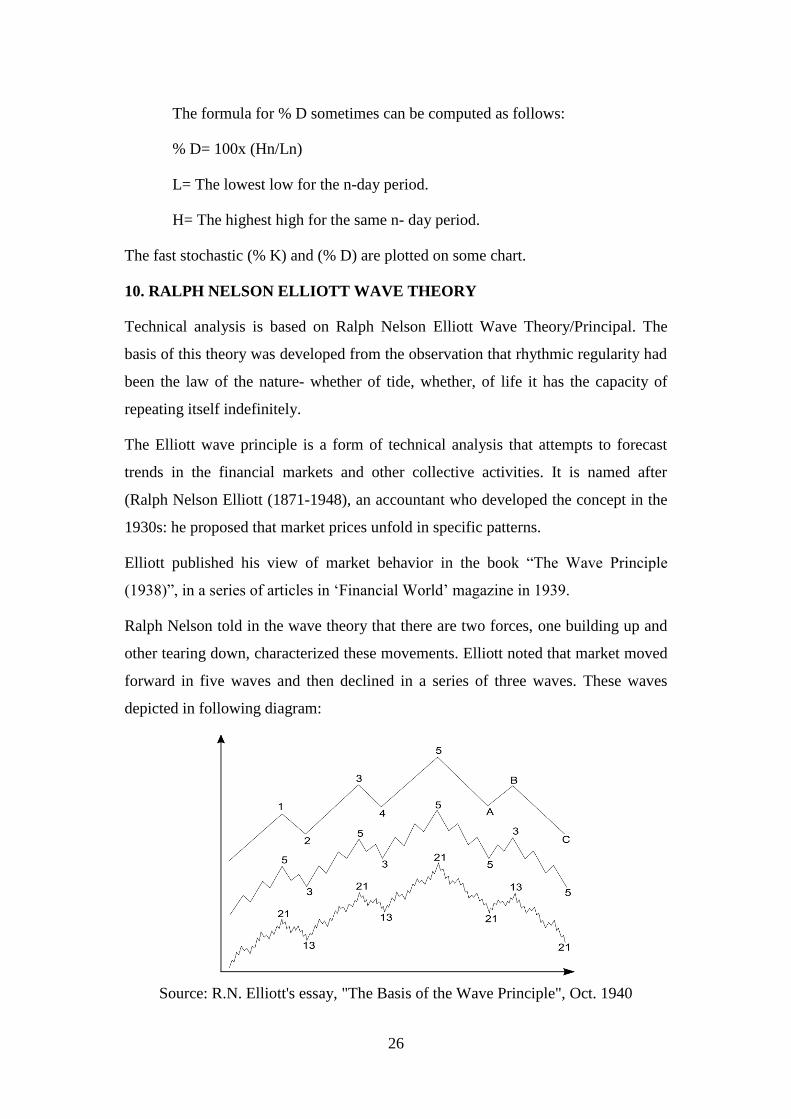
Ralph Nelson told in the wave theory that there are two forces, one building up and
other tearing down, characterized these movements. Elliott noted that market moved
forward in five waves and then declined in a series of three waves. These waves
depicted in following diagram:
Source: R.N. Elliott's essay, "The Basis of the Wave Principle", Oct. 1940

27
Ralph Nelson Elliott developed the „Elliott Wave Principle in 1930s by discovering
that stock markets, though to behave in a somewhat chaotic manner, in fact, did not.
They did, however, trade in what he called repetitive cycles, which he discovered
were the emotions of investors, caused by outside influences or predetermining
psychology of the masses at the time.
He had started that the upward and downward swings of mass psychology always
showed up in the same repetitive patterns, which were then divided into patterns he
termed „waves‟, The theory, is somewhat based upon the „Dow theory‟.
Chartists believed that due to this fractal nature of the markets, Elliott was able to
breakdown and analyse markets in much greater detail. Fractal has mathematical
structures which on an even smaller scale indefinitely repeat themselves.
Price movements can be divided into trends on one hand and corrections on
sideways movements on the other hand. Trend shows the main direction of prices,
while corrections move against the trend. In Elliott terminology these arc called
(impulsive waves) and corrective waves.
Elliott‟s model says that market prices alternate between five waves and three waves
at all degree of trend. As these waves develop, the larger price pattern, unfold in
self-similar fractal geometry. Within dominant trend waves 1, 3 and 5 are „motive‟
waves and each motive wave itself subdivided in five waves. Waves 2 and 4 are
corrective waves, and subdivided in three waves. In a bear market the dominant
trend is downward, so the pattern is reversed five waves down and three up.
Motive wave always moves with the trend, while corrective waves move against it.
Degree: The pattern link to form five and three wave structures of increasing size or
“degree” the complete motive pattern includes 89 waves, followed by a completed
corrective pattern of 55 waves.
Each degree of the pattern in a financial market has a name. Practitioners use
symbols for each wave to indicate both function and degree- numbers for motive
waves, letters for corrective waves (shown in the highest of the three idealized
cycles) degrees are relative, they are defined by form, not by size duration.
The classification of a wave at any particular degree can vary, though practitioners
generally agree on the standard order or degree:-

28
Grand Super Cycle : Multi-decade to multi-century.
Sup Cycle : A few year to few decades
Cycle : A year to few years
Primary : A few months to a couple of years
Intermediate : Weeks to months
Minor : Weeks
Minute : Hours
Sub-Minute : Minutes
Behavioral characteristics and wave “Signature”
Elliott Wave analysts (or Elliotticians) hold that it is not necessary to look at a price
chart to judge where a market is in its wave pattern. Each wave has its own
“Signature” which often reflects the psychology of the moment. For understanding
how and why the waves develop is key to the application of the wave principle -
understanding the characteristics of wave pattern:-
These wave characteristics assume a bull market in equities. The characteristics
apply in reverse in bear market.
FIVE WAVE PATTERN (DOMINANT TREND)
Wave 1: Wave one is rarely obvious at its inception. When the first wave of a new
bull market begins, the fundamental news is almost universally negative. The
previous trend is considered still strongly in force. Fundamental analysts continue to
revise their earnings estimates lower; the economy probably does not look strong.
Volume might increase a bit as prices rise, but not enough to alert many technical
analysts.
Wave 2: Wave two corrects wave one, but can never extend beyond the starting
point of wave one. Typically, the news is still bad. As prices retest the prior low,
bearish sentiment quickly builds, and “the crowd” haughtily reminds all that the bear
market is still deeply ensconced. Still, some positive signs appear for those who are
looking: volume should be lower during wave two then during wave one.

29
Wave 3: wave three is usually the largest and most powerful wave in trend
(although some research suggests that in commonality markets, wave five is largest).
The news is now positive a fundamental analysts start to raise earnings estimates.
Prices rise quickly, corrections are short- lived and shallow.
As wave -3 (three) starts the news is probably still bearish and most market players
remain negative; but by wave three‟s midpoint, “the crowd” will often join the new
bullish trend.
Wave 4: - Wave four is typically clearly corrective. Prices may meander sideways
for an extended period. This is a good place to buy a pull back if you understand the
potential ahead for wave-5. Still, the most distinguishing feature of 4th
wave is that
they often prove very difficult to count.
Wave 5:- Wave five is the final leg in the direction of dominant trend. The news is
almost universally positive and everyone is bullish. Unfortunately, this is when
many average investors finally buy in, right before the top. Volume is lower in wave
five than in wave three (and many momentum indicators start to show divergences
(prices reach a new peak) At the end of a major bull market, bears may very well be
ridiculed (recall how forecasts for a top in the stock market during 2000 were
received).
THREE WAVE PATTERN (CORRECTIVE TREND)
Wave A: corrections are typically harder to identify than impulse moves. In wave A
of a bear market, the fundamental news is usually still positive. Most analysts see
the drop as a correction in a still -active bull market. Some technical indicators that
accompany wave A include increased volume, rising implied volatility in the options
markets, and possibly a turn higher in open interest in related futures markets.
Wave B: Prices reverse higher, which many see as a resumption of the now long -
gone bull market. Those familiar with classical technical analysis may see the peak
as the right shoulder of a head and shoulders reversal pattern. The volume during
wave-B is lower than wave A.
Wave C: prices move impulsively lower five waves. Volume picks up, and by the
third leg of wave-C, almost everyone realizes that a bear market is firmly
entrenched. Wave- C is typically at least as large as wave-A.

30
11. OSCILLATORS
The researcher is taking base „Oscillators‟ for showing the trends of selected
companies. The Oscillators indicate the market momentum or scrip momentum.
Oscillator shows the share price movement across a reference point from one
extreme to another. The momentum indicates:
Over bought and oversold conditions of the scrip or the market.
Signaling the possible trend reversal
Rise or decline in the momentum.
Oscillation means a movement of certain item again on the same path with the same
frequency, like that of a pendulum in a wall clock. Oscillators indicate trend
reversals that have to be confirmed with the price movement of the scrip. Changes in
the price should be correlated to changes in the momentum, and only buy and sell
signals can be generated. Actions have to be taken only when the price and
momentum agree with each other. With the daily, weekly or monthly closing prices
oscillators are built. For short term trading weekly prices are useful.
These Oscillators are fine tools to predict future movements much before such
movement take place, and thus leave a sufficient time gap to take decision on the
basis of these.
The prominent oscillators are following trend analysis of selected companies under
study with their monthly average closing stock prices.
Moving Average convergence and divergence (MACD)
Rate of change (ROC)
Relative strength Index (RSI)
MOVING AVERAGE CONVERGENCE AND DIVERGENCE (MACD)
It is used to predict movements in the market. An analyst is generally in a dilemma
whether to use long term moving average or short term moving average. The
solution for such type of dilemma is MACD. MACD is the difference between short
term moving average and long term moving average. This difference helps in
identifying, whether prices in the recent past have moved upward or downward as

31
compared to longer period movement. With the help of MACD line various signals
can be generated;
MACD = short period moving average - long period moving average
Simple buy and sell signals can be generated with the help of MACD, when MACD
is in a positive zone it indicates buying as share prices are likely to move upward in
the future.
On the contrary, when MACD is in negative zone it indicates down ward
(southward) movement of the market in the near future and one should sell the
shares.
Advanced signals with the help of MACD
Whenever the MACD is above zero mark line, it indicates the signal of
bullish market for the scrip.
Whenever the MACD is above zero mark line, but declining it is early
warning signal of a bearish market.
Whenever the MACD is below zero mark line, it indicates the signal of
bearish market for the scrip.
Whenever the MACD is below zero mark line, but rising it is early warning
signal of a bullish market ahead.
Whenever MACD forms a peak at the top it give signals that the market will
soon turn bearish, i.e. it represents overbought situation.
Whenever MACD reaches its bottom it signifies oversold situation i.e. that is
the market will start becoming bullish.
RATE OF CHANGE (ROC)
Rate of change indicator or the ROC measures the rate of change between the
current price and the price „n‟ number of days in the past. ROC helps to fine out the
overbought and oversold positions in scrip. It is also useful in identifying the trend
reversal. Closing prices are used to calculate the ROC.
The researcher also takes monthly closing prices for ROC.

32
ago Monthsn Price
PriceCurrent ROC
Advance signals with the help of ROC
When ROC is at the peak, it signifies the overbought market.
When ROC is above „one‟ mark and increasing, it signifies the bullish trend
in the market for the scrip.
When ROC is above „one‟ mark and declining, it signifies the bearish trend
in the market for the scrip.
When ROC is at the bottom, it signifies the oversold market.
RELATIVE STRENGTH INDEX (RSI)
RSI was developed by Wills Wilder. It is one of the most powerful much before
such movement takes place. RSI is an oscillator used to identify the inherent
technical strength arid weakness of particular scrip of market. Under RSI gains and
losses of the prices over the immediate previous days‟ price for a certain period is
calculated. With the help of the formulae RSI value is calculated and plotted on the
graph to identify over bought and oversold market. Market always moves south
ward after an overbought situation and it moves northward after an oversold
situation.
When RSI value is at or above 70 levels and moving upward it indicates that market
is likely to reach the peak due to overbought situation. On the contrary to this when
RSI value is at or below 30 levels, it indicates an oversold situation and market is
likely to bottom out. In between 50 level of RSI is used to generate confirm and safe
signals. Market always moves southward after an overbought situation and it moves
northward after an oversold situation.
RS1
100-100 RSI ofn Calculatio
declines daysn of Average
advance daysn of Average RS Where
Benchmark theis 50 Value
Signals

33
Value 70 is used to identify overbought market.
Value 30 is used to identify oversold market,
Generating Signals with the help of RSI
When RSI crosses 50 mark it signifies a bullish market ahead for the scrip.
When RSI crosses 70 mark from downward it signifies the overbought
market.
When RSI declines after touching the peak, it signifies the bearish market
ahead.
When RSI crosses 30 mark from upward it signifies the oversold market.
1.7 RISK AND RETURN ANALYSIS
Now we have discussed investment, investment involves risk and return analysis.
First we will discuss here what is risk and its measurement after that we shall
discuss return on investment.
Security analysis involves valuation of expected risk and return of securities. The
first three motives of this is (a) income (b) capital appreciation. (c) a positive hedge
against inflation income refers the expected return and last two motives refers the
risk involved in investment. These risk are due to uncertainly of returns, regularity
of returns, safety of funds, marketability or lack of it, etc.
Return: Return is the primary motivating force that drives investment. It represents
the reward for undertaking investment. Since the game of investing about returns
(after allotting the risk), measurement of realized (historical) returns is necessary to
asses how well the investment manager has done. In addition, historical returns are
often used as an important input in estimating future (prospective) returns.
The return of an investment consists of two components:
Current Return: the first component that often comes to mind when one is thinking
about return is the periodic cash flow (income), such as dividend or interest,
generated by the investment. Current return is measured as the periodic income in
relation to the beginning price of the investment.

34
Capital Return: the second component of return is reflected in the price change
called the capital return- it is simply the price appreciation (0r depreciation)
dividend by the beginning price of the assets. For assets like equity stocks, the
capital return is predominant.
Total Return= Current Return + Capital Return
The current return can be zero or positive, whereas the capital return can be
negative, zero, or positive.
Risk
Risk is any investment. This risk may relate to loss or delay in repay of the principal
capital or loss on non-payment of interest and variability of returns. Risk may be
defined as where future outcomes are known of all alternatives and there is
possibility of loss called risk.
Risk may be defined, according to dictionary, “existence of volatility in the
occurances of expected incident is called risk. Higher the unpredictability greater is
the risk.”
Components of Risk
There are two types of components found of risk:
1. Systematic risk
2. Unsystematic risk
Total Risk = (Systematic risk + Unsystematic risk)
( + )
A) Systematic Risk ( )
Systematic risk refers to the portion of the total variability of return caused by
common factors affecting the prices of all securities in market like through
economic, political and social factors. We can call it non-diversified risk.
Components of systematic risk
1. Market Risk: It arises from change in market conditions or market
movements.

35
2. Interest Rate Risk: It arises from change in rate of interest. Interest rate also
fluctuates.
3. Purchasing Power Risk (Inflation Risk): Inflation in the economy also
influences the risk inherent in investment. The change in inflation rate also
change the consumption pattern hence investment returns carry on additional
risk.
4. Trade cycle Risk: These types of risk arises or create by the change in trade
cycle or phase of trade cycle or business conditions and also change in
monsoons for agricultural based economy of India.
5. Political Risk: It can arises due to change in government or its policy shown
in fiscal and budgetary aspects etc. through change in tax rates and administration
regulations
B) Unsystematic Risk
Unsystematic risk which refers to the portion of the total variability of the return
caused due to unique factors relation to that firm and industry through such factors
as management failure, labor strikes raw material scarcity etc. These types risks are
known as diversified risks. These are explained below:
1) Business risk
The ability of company to earn operational income is represented by the business
risk. When a company fails to earn through its operations then we can understand
that it is business risk.
2) Financial Risk
It can arise due to heavy interest burden or inefficient capital management.
3) Management Risk
It can arise due to inefficiency of managers etc.
1.8 EFFICIENT MARKET THEORY/EFFICIENT MARKET
HYPOTHESIS
Efficient market theory states that the share price fluctuations are random and do not
follow any regular pattern. Meanwhile technical analysts see meaningful patterns in

36
their charts. This raises the question as to whether the intrinsic value of shares has
any meanings. Are they related to the security prices? Efficient market theory
describes the explanation of above discussed questions.
The basic concepts of efficient market hypothesis are market efficiency, operational
efficiency, liquidity traders and information traders. The efficient market theory
comprises the random-walk theory. Random-Walk theory was proposed by a France
mathematician named Louis Bachelier. He says that security price fluctuations were
random. In 1953, Mowrice Kendall in his paper reported that stock price series is a
wandering one. They appeared to be random; each successive change is independent
of the previous one. In 1970, Fama stated that efficient markets fully reflect the
available information. Fama suggested that efficient market hypothesis (EMH) can
be divided into three categories. They are „Weak Form”, the “Semi-strong for”, and
the “Strong form”.
The level of information being considered in the market is the basis for this
segregation.
Weak form of EMH
The type of information used in weak form of EMH is the historical prices. EMH
explains that current prices reflect all information found in the past prices and trade
volumes.
Traded volumes, future prices can‟t be predicted by analyzing the prices from the
past. The weak form of EMH can be understood through „filter rule‟.
Semi strong form of EMH
The semi strong from of the EMI-I states that the security price adjusts rapidly to all
publicly available information. In the semi strongly efficient markets, security prices
fully reflect all publicly available information. The prices not only reflect the past
price data, but also available information regarding the earnings of corporate,
dividend, bonus issue, mergers, acquisitions and so on.
Strong form of EMH
The strong form of EMH states that all information is fully reflected on security
prices. It represents an extreme hypothesis which most observes do not expect it to

37
be literally true. The strong form of efficient market hypothesis maintains that not
only publicly available information is useless to the investor or analyst but all
information is useless.
1.9 FINANCIAL MARKET
A market wherein financial instruments such as financial plains, assets and
securities are traded is known as a financial market. If an investor wants to invest his
money in the financial assets/paper securities, the financial market provides a market
to buy and sell paper securities. In other words, financial market is a market for
creation and exchange of financial assets. Financial markets play a pivotal role in
allocating resources in an economy by performing some important function:
I. Financial markets facilitate price discovery. The continual interaction among
numerous buyers and sellers who through financial markets helps in
establishing the prices of financial assets. Well organized financial markets
seem to be remarkably efficient in price discovery,
II. Financial markets provide liquidity to financial assets,
III. Financial markets considerably reduce the cost of transacting.
Financial market can be classified into two major parts like, Money market and
Capital market.
(A) Money Market:- Money market refers to a market for short-term funds, short-
term money and financial assets. It can also be termed as a mechanism or a system
from which the borrowers manage to obtain short-term funds and the creditors for
their money. The money market is a system for dealing in short-term funds. Short-
term refers to the period up to one year. The RBI, commercial banks, financial
institutions and the corporate sectors are the players of this market who deals in
money and near money items. Still the RBI occupies an important and strategic
position as it influences the availability of the credit and decides the cost of the
credit.
(B) Capital Market: - Capital Market is the market for borrowing and lending long
term capital funds required by business enterprise. It is the market where new
securities are created and existing securities are traded for long-term finance. The

38
market where long-term funds are borrowed and lent is known as a capital market,
the primary purpose being directing the flow of savings into long-term investment.
1.9.1 TYPES OF CAPITAL MARKET:
(a) Primary Market (New Issue Market)
(b) Secondary Market (Stock Exchange)
(a) Primary Market (New Issue Market): The primary market deals in new
securities, that is, securities which were not previously available and are offered to
the investors for first time. Capital formation occurs in the primary market as it
supplies additional funds to the corporate directly. The issue may be by new
company or existing company. Primary market is the market where securities are
issued for first time. It performs triple-function origination, underwriting and
distribution of securities to the investors.
(b) Secondary Market (Stock Exchange): The stock exchange is a market for
existing securities, that is, those already issued and granted. A stock exchange
represents any body of individuals, whether incorporated or not, constituted for the
purpose of assisting, regulating for controlling the business of buying, selling or
dealing in securities. It serves as a specialist market place for facilitating transactions
in existing corporate securities at prices that are “fair and equitable”.
1.10 THE BOMBAY STOCK EXCHANGE
The Indian stock market is one of the oldest markets in Asian Markets. Its history
dates back to two centuries when the record of securities dealing in India was
meager and obscure. The East India Company was dominant institutions in those
days and business in its loan securities was transacted towards the close of the
eighteenth century.
By the 1830s, business in corporate stock and share in bank and cotton presses took
place in Bombay through the trading list was broader in 1839, there were only half a
dozen brokers recognized by bank and merchants.
39
In 1860-61, the American civil war broke out and cotton supply from the United
State of America and Europe was stopped. This resulted in the “share mania” for
cotton trading in India. The number of brokers increased to between 200 to 250.
At the same time, broker found a place in Dalal Streat, Bombay, where they could
conveniently assemble and transact business. In 1875,318 peoples formally
established the “Native Share and Stock Brokers Association”. In 1895, the
associations acquired premises in the same street; it was inaugurated in 1899 as the
Bombay Stock Exchange.
In 1956, the BSE became the first stock exchange to be recognized by Indian
Government under Securities Contracts Regulation Act. The Bombay Stock
Exchange developed the BSE SENSEX in 1986, giving the BSE a means to measure
overall performance of the exchange. In 2000, the BSE used this index to open its
derivatives market, trading Sensex future contacts. The development of Sensex
option along with equity derivatives followed in 2001 and 2002, expanding the
BSE‟s trading platform. Historically an open-cry floor trading exchange, the
Bombay Stock Exchange switched to an electronic trading system in 1995.
1.11 THE BSE SENSITIVE INDEX (SENSEX):
Bombay Stock Exchange developed the BSE SENSEX in 1986, giving the BSE a
means to measure overall performance of the exchange. The BSE Sensitive Index
has long been known as the barometer of the daily temperature of the daily
temperature of all Indian bourses. The BSE 30 is stock market index and based on
free-float market capitalization weight. Sensex consists 30, well established and
financially sound companies listed on Bombay Stock Exchange. Since September 1,
2003, SENSEX is being calculated using a free-float market capitalization
methodology. The "free-float market capitalization-weighted" methodology is a
widely followed index construction methodology on which majority of global equity
indices are based; all major index providers like MSCI, FTSE, STOXX, S&P and
Dow Jones use the free-float methodology. The base year of Sensex is 1978-79. The
base value of the Sensex is taken 100 on April 1, 1979. In 1978-79 stock market
contained only private sector companies and they were mostly geared to commodity
production. Hence, a sample of 30 was drawn from them. With the passage of time

40
more and more companies private as well as public came in to the market. The
companies in the basket of Sensex are representative of various industrial sectors of
the economy.
1.11.1 SENSEX - SCRIP SELECTION CRITERIA
1. Equities of companies listed on Bombay Stock Exchange Ltd. (excluding
companies classified in Z group, listed mutual funds, scrips suspended on the
last day of the month prior to review date, scrips objected by the Surveillance
department of the Exchange and those that are traded under permitted
category) shall be considered eligible.
2. Listing History: The scrip should have a listing history of at least three
months at BSE. An exception may be granted to one month, if the average
free-float market capitalization of a newly listed company ranks in the top 10
of all companies listed at BSE. In the event that a company is listed on
account of a merger / demerger / amalgamation, a minimum listing history is
not required.
3. The scrip should have been traded on each and every trading day in the last
three months at BSE. Exceptions can be made for extreme reasons like scrip
suspension etc.
4. Companies that have reported revenue in the latest four quarters from its
core activity are considered eligible.
5. From the list of constituents selected through Steps 1-4, the top 75
companies based on free-float market capitalisation (avg. 3 months) are
selected as well as any additional companies that are in the top 75 based on
full market capitalization (avg. 3 months).
6. The filtered list of constituents selected through Step 5 (which can be greater
than 75 companies) is then ranked on absolute turnover (avg. 3 months).
7. Any company in the filtered, sorted list created in Step 6 that has
Cumulative Turnover of >98%, are excluded, so long as the remaining list
has more than 30 scrips.

41
8. The filtered list calculated in Step 7 is then sorted by free float market
capitalization. Any company having a weight within this filtered constituent
list of <0.50% shall be excluded.
9. All remaining companies will be sorted on sector and sub-sorted in the
descending order of rank on free-float market capitalization.
10. Industry/Sector Representation: Scrip selection will generally attempt to
maintain index sectoral weights that are broadly in-line with the overall
market.
11. Track Record: In the opinion of BSE index committee, all companies
included within the Sensex should have an acceptable track record.