chapter 1 introduction - murdoch...
TRANSCRIPT
1
Chapter 1
INTRODUCTION
1.0 Background
The major concern of educators is how to enhance the outcome of education.
Effective education media used to assist teaching have been constantly sought by the
researchers in educational technology. Virtual Reality (VR) has been identified as
one of them. One of the reasons that VR is being used in educational settings is
because it provides interactive and complex three-dimensional (3-D) structures in a
highly realistic manner and gives the users a sense of “being there” (Ausburn &
Ausburn, 2004; Ausburn & Ausburn, 2008; Ausburn et al., 2009; Chuah, Chen, &
Teh, 2008; Inoue, 2007; Lee & Wong, 2008). VR can range from fully immersive
environments where the users interact with the virtual world with complex head-
mounted devices (HMDs), voice activation and body suits, to non-immersive
desktop environments that are based on realistic PC imagery (Ausburn & Ausburn,
2004; Ausburn & Ausburn, 2008, Ausburn et al., 2009; Beier, 2004). VR technology
is believed to be able to help learners to learn better in a less traditional and less
structured learning environment.
With VR technology, an open learning environment is possible where learners are
given relevant information and resources to support their learning. Furthermore,
learners can control their own learning, identify the learning goals and construct their

2
own knowledge and meanings, thus learning is more student-centered (Cradler,
1997; Hannafin et al., 2008).
Proponents of the VR-based learning environment suggest that VR can help to
improve the learning outcomes by engaging students in authentic learning. Many
associate VR with science fiction, high-tech industries and computer games but very
few with education (Strangman & Hall, 2003). However, not only has VR been used
as an educational tool for some time in applied fields such as aviation and medical
imaging, it has begun to edge its way into the primary and secondary classrooms
(Strangman & Hall, 2003). Furthermore, VR on the Internet, which can be accessed
using Virtual Reality Modeling Language (VRML) and eXtensible 3D Graphic
(X3D), has changed the potential of web-based learning (Ieronutti & Chittaro, 2007).
With the development and maturity of the Web3D technology, it is possible to
provide a shared-virtual environment to support and enable collaborative learning
through synchronous and/or asynchronous communication (Chen & Teh, 2000;
Zhang & Yang, 2009).
VR is a cutting edge technology that allows learners to explore and manipulate 3-D
interactive environments (Chen et al., 2004; Strangman & Hall, 2003). The benefits
of using VR technology in the teaching and learning process have increasingly
gained recognition from researchers and instructional designers (Chen et al., 2004).
Pantelidis (1995) has listed some reasons to use VR in education. Among them are
that VR provides motivation to learn; VR allows observation from multiple
perspectives, which encourages diverse ways of thinking; VR allows learners to
3
proceed through an experience at their own pace; and VR encourages active
participation (Pantelidis, 1995).
Although VR has been recognized as an alternative tool in education, the need for
expensive HMDs, gloves, suits and high-end computer systems has somehow
restricted its use in schools or colleges. However, a rapid fall in computer prices, a
huge leap in the processing power of personal computers, the availability of
broadband computer access and the proliferation of the World Wide Web has
unleashed new opportunities for educators to use non-immersive VR that runs on a
desktop computer as an alternative or a supplement to the traditional way of teaching
(Lee, Wong, & Fung, 2009a; McArdle, Monahan, & Mangina, 2004; McLellan,
2004; Yang & Heh, 2007). This non-immersive or desktop VR system can be
explored using conventional input devices such as a keyboard and mouse without
any additional costly peripheral devices (Chen et al. 2004; Inoue, 2007). This
relatively low cost VR system has become increasingly prevalent (Fox, Arena &
Bailenson, 2009). According to Youngblut (1998), such non-immersive technology
is much more mature and ubiquitously used in many different application areas as
compared with the immersive technology. Non-immersive desktop VR is very
accessible. It can be easily distributed via the World Wide Web and on compact disc
(Allen et al., 2002). In fact, it is the most widely used form of VR in use today
(Allen at al., 2002; Fox et al., 2009).
Recent research has shown an encouraging array of positive learning outcomes with
VR. Findings include positive effects on students’ learning of geometry topics (Song

4
& Lee, 2002), better learning in geosciences (Li et al., 2002), a useful training
system for astronaut 3-D navigation (Aoki et al., 2008), better spatial understanding
of architectural spaces (Youngblut, 1998), and more accurate and complete
understanding of engineering concepts (Bell & Fogler, 1995). With 3-D impression
of objects and their structures, depth cues are available for learners to construct a
mental model of the objects and its component (Huk, 2006). Depth cues can be
incorporated into static pictures and dynamic representations of a VR program.
Viewing dynamic and 3-D animations is assumed to have a positive effect on
changing and improving students’ incomplete mental models (Huk, 2006; Wu &
Shah, 2004). Apart from these, research findings have also shown that learners enjoy
their VR educational experiences and see the potential of VR in instruction (Barnett,
Yamagata-Lynch, Keating, Barab, & Hay, 2005).
Although these new and emerging technologies have significant potential to improve
student learning, Barnett et al. (2005) point out the need to examine the aspects of
this technology that are best leveraged for improving students’ understanding of
mathematical and scientific concepts. Furthermore, as with any other instructional
media, VR should not be seen as a panacea that will work for all kinds of learning
problems, despite the positive findings of some research (Chen, 2005; Sanchez,
Barreiro, & Maojo, 2000; Strangmen & Hall, 2003).
1.1 Problem Statement
VR is hypothesized to be an excellent educational tool because it offers the
opportunity to visualize, explore, manipulate and interact with objects within a

5
computer generated environment (Crumpton & Harden, 1997), which allows for
discovery and self-paced learning. A more student-centered approach of instruction
is possible with the use of VR. Nevertheless, VR is just an educational tool which
can be used to support learning and it might not work for all kinds of learning. In
spite of the positive findings of some research, it would be premature to make broad
recommendations regarding the use of VR for curriculum enhancement (Strangman
& Hall, 2003), and it should not be used indiscriminately in any educational program
(Sanchez et al., 2000). Furthermore, there have been few studies that compare the
effectiveness of VR against non-VR teaching practices to support the use of VR in
learning (Crosier, Cobb, & Wilson, 2000; Youngblut, 1998). There have also been
few studies that investigated the effects of individual differences in VR-based
learning (Crosier et al., 2000).
According to Gustafson (2002), the low cost 3-D visualizations and walk-around VR
will revolutionize how people of all ages learn and work. These technologies have
the potential to facilitate the acquisition of higher-order thinking and problem
solving skills (Rieber, 1996). However, they too believe that there is much research
and development that needs to be done. These issues include:
• Investigate how the attributes of VR technology are able to support and
enhance learning in a way that the conventional instructional methods are not
able to, and find whether the use of VR can improve the intended
performance and understanding.
• Investigate the impact of VR on learners with different aptitudes.

6
VR is a learning tool that can support learning as suggested by Jonassen, Peck, &
Wilson (1999) who stated that technologies can support and facilitate learning.
Moreover, VR can support the constructivist learning model that assumes individuals
learn better when they discover things by themselves and when they can control the
pace of learning to construct new knowledge (Chen & Teh, 2000; Chen & Toh,
2005, Sung & Ou, 2002). However, if VR technology is to be used to support
meaningful and constructivist learning, then the relevant constructs and their
relationships that help to achieve this goal need to be examined. To investigate how
the attribute of VR technology is able to support and enhance learning in a learning
environment that supports the constructivist learning model, the pedagogical benefits
of VR as a learning tool need to be examined in a more comprehensive way.
This study focuses on non-immersive desktop VR although there are different types
of VR. Though some work on factors that influence the learning outcomes has been
done for the immersive VR environment, a broad framework that identities the
theoretical constructs and their causal relationships in this domain has yet to be
developed for a desktop VR-based learning environment. Relevant constructs or
factors such as student characteristics, interaction experience, and learning
experience that could affect the learning outcomes should be considered. Relevant
constructs and their relationships need to be examined for the effective use of VR in
education because all these constructs play an important role in shaping the learning
outcomes (Salzman, Dede, Loftin, & Chen, 1999; Wan, Fang, & Neufeld, 2007).
Strangman and Hall (2003) also mentioned that factors influencing computer
simulations have not been extensively or systematically examined. Moreover, there

7
is limited research in the exploration of VR-based learning that addresses the issue of
‘How can VR technology enhance learning outcomes?’ rather than just ‘Does VR
technology influence learning outcomes?’
Furthermore, there is a lack of greater depth of research in VR-based learning that
investigates the influence of psychological factors on learning. It is a challenge and
an outstanding task to study the right and applicable use of VR in education
(Sanchez et al., 2000). There is still limited research that addresses the questions
posed by Sanchez et al. (2000): How are VR systems capable of improving the
quality of student learning? What kinds of student require this technology?
According to Ausburn & Ausburn (2008), there are not many studies that explore
and explain the effects of desktop VR in terms of theoretical perspectives and
models. Indeed, there have been limited attempts to introduce theoretical frameworks
and models that consider explicitly the use of desktop VR in education that can help
desktop VR practitioners to understand how this technology enhances learning
outcomes. This study aims to fill this gap.
In addition, work in VR has focused primarily on refining and improving the
technology and developing applications (McLellan, 2004, p. 474). More VR
research is needed to investigate the emotional and cognitive dimension of human
experience in the virtual world rather than just technical issues such as providing
sensory immersion (McLellan, 2004). Research in VR and education is a relatively
young field (Adamo-Villani & Wilbur, 2007; Inoue, 2007). More research is needed
to justify the benefits of using VR for learning and to investigate VR for different

8
applications of learning (Inoue, 2007; McLellan, 2004). Ausburn and Ausburn
(2008, p. 60) mentioned that “research on the effectiveness of desktop VR has as yet
been minimal, and still falls far short of establishing empirical support for
instructional uses of desktop environments.” Moreover, it is this PC-based
technology that makes VR more accessible to educators in schools and colleges, both
technically and economically (Ausburn & Ausburn, 2008; Strangman & Hall 2003;
Youngblut, 1998). Thus, this research articulates a research agenda specific to
desktop VR and education. The issues investigated include: (1) the learning
effectiveness of a desktop VR compared to a traditional learning environment; (2)
the impact of desktop VR on learners with different aptitudes; and (3) how desktop
VR enhances learning outcomes in a learning environment that supports
constructivist learning.
1.2 Purpose of the Study
In view of the fact that effective learning is the ultimate aim of new technology in
teaching and learning, it is crucial to perform educational effectiveness evaluation.
Hence, the purpose of this study is to investigate the learning effectiveness of a
desktop VR-based learning environment and to develop a theoretical model for
evaluating how desktop VR enhances learning outcomes that could guide future
developmental efforts. A critical step towards achieving an informed design of a
VR-based learning environment is the investigation of the interplay among VR
affordances and other factors such as the student characteristics, the interaction
experiences and learning experiences (Salzman et al., 1999). By understanding how
these factors work together to shape learning, instructional designers will be better

9
able to target learning and visualization problems with the appropriate affordances
and to maximize the benefits of VR technology (Salzman et al., 1999, p. 42). Thus,
this study aims to do more in-depth research by investigating the various relevant
constructs and their relationships that play a vital role in enhancing the learning
outcomes in a desktop VR-based learning environment, besides investigating “Does
desktop VR influence the learning outcomes?” If desktop VR can facilitate learning,
then it is vital to investigate the interaction and learning experiences of the learners
unique to the desktop VR-based learning environment. As mentioned by Jones et al.
(1996, p. 9), “in judging the effectiveness of computer-assisted learning (CAL), one
important problem will be to determine the extent to which desired outcomes are
attained and establish the causal link between CAL and the learning that has taken
place.” Emphasis is on the process and experience when learning with CAL rather
than the product.
A desktop VR system is used for the VR-based learning environment in this study. It
is a highly interactive 3-D computer generated program in a multimedia
environment, which is implemented on a conventional personal computer without
introducing any additional peripheral devices such as head-mounted displays, gloves,
suits and high-end computer systems (Chen et al. 2004; Inoue, 2007). Users can
navigate and manipulate the virtual object in the virtual world and the interaction can
be observed by the users in real time.
10
The research questions addressed in this study are:
1) Is there any difference in the learning outcomes (performance achievement,
perceived learning effectiveness and satisfaction) between desktop VR-based
learning (VR mode) and conventional classroom learning practice (Non-VR
mode)?
2) What are the effects of learners’ aptitudes (spatial ability and learning style)
on learning?
3) Is there a difference in the learning outcomes for high and low spatial ability
learners in the VR mode?
4) Is there a difference in the overall improvement in performance for high and
low spatial ability learners in the VR mode?
5) Is there a difference in the learning outcomes for accommodator learners and
assimilator learners in the VR mode?
6) Is there a difference in the overall improvement in performance for
accommodator learners and assimilator learners in the VR mode?
7) What are the relevant constructs that play an important role in a desktop VR-
based learning environment?
8) How do these constructs interrelate to enhance the VR-based learning
effectiveness?
1.3 Research Objectives
The specific objectives of this study are thus:
1) to compare the learning effectiveness between desktop VR-based learning
and conventional classroom teaching practice;

11
2) to investigate the moderating effect of student characteristics on the learning
mode with respect to learning outcomes;
3) to investigate the difference in the learning outcomes for students with
different characteristics in the VR mode;
4) to investigate the difference in the overall improvement in performance for
students with different characteristics in the VR mode;
5) to identify the relevant constructs in a desktop VR-based learning
environment; and
6) to determine the relationships of the relevant constructs that influence the
learning outcomes in a desktop VR-based learning environment.
1.4 Research Approaches
A research framework as shown in Figure 1.1 is first proposed to guide the
evaluation of the desktop VR-based learning environment as compared to the
conventional classroom learning method. Based on the model of Salzman et al.
(1999) and technology-mediated learning models, a conceptual framework as shown
in Figure 1.2 is developed for the purpose of evaluating how desktop VR enhances
the learning outcomes. The target population is senior high school science students
aged between 15 and 17 years old. An evaluation that employs a quasi-experimental
design is conducted to investigate the learning effectiveness of a desktop VR-based
learning environment. Through a survey with objective and subjective
measurements, the investigation on how desktop VR enhances the learning outcomes
is further conducted.

12
Figure 1.1: Research framework for determining the effects of a desktop VR-based learning environment and aptitude-by-treatment interaction research
Figure 1.2: Conceptual framework for outcomes and their causal relationships
in a desktop VR-based learning environment
Independent Variable Learning Mode VR Mode —VR-based learning environment Non-VR Mode—Conventional classroom learning method
Moderator variables (Student Characteristics) -Spatial Abilities -Learning Styles
Dependent Variables (Learning Outcomes) -Performance Achievement (Posttest Score) -Perceived Learning Effectiveness -Satisfaction
Independent Variable (VR Features) -Representational Fidelity -Immediacy of Control
Mediator Variables (Learning Experience- Psychological Factors) -Presence -Motivation -Cognitive Benefits -Control & Active Learning -Reflective Thinking
Dependent Variables (Learning Outcomes) -Performance Achievement -Perceived Learning Effectiveness -Satisfaction
Mediator Variables (Interaction Experience - Usability) -Perceived Usefulness -Perceived Ease of Use
Moderator Variables (Student Characteristics) -Spatial Abilities -Learning Styles

13
1.5 Significance of Research
The findings of this research would help to verify the learning effectiveness of
desktop VR-based learning. For years, student-centered learning has been advocated
by educators to improve the learning experience and learning outcomes. VR has the
potential to empower student-centered learning, but until its impact on students is
studied, it cannot be fully recognized as a curriculum enhancement. Furthermore,
VR-based learning has been heralded as providing instruction that accommodates
learners’ individual difference, such as learning styles and spatial abilities. While
intuitively appealing, empirical research has not confirmed or rejected this
assumption. Nor is there compelling evidence to suggest that learners with different
learning styles and spatial abilities benefit equally from a desktop VR-based learning
environment. Thus, the aptitude-by-treatment interaction (ATI) research conducted
in this study would illustrate the effect of a desktop VR-based learning environment
and a traditional teaching practice on learning for learners with different spatial
abilities and learning styles.
The understanding of how these individual differences interact with different
learning environments could help the instructors to identify instructional treatments
that facilitate individualized learning, and also to provide evidence that VR could
accommodate learners’ individual differences. Furthermore, the findings are
important to educational administrators and educational planners at the federal, state,
county, city and school levels because the effectiveness and successfulness of VR as
an educational tool could have important implications for course planning, budgets,

14
purchasing of computer hardware and software and also supporting software
development.
While the interest in using VR in education is growing rapidly, a broad framework
and model that identify the theoretical constructs and relationships in this domain for
a desktop VR-based learning environment have yet to be developed and realized.
This research aims to fill this gap. Relevant constructs and their relationships need
to be examined for the effective use of VR in education. All these constructs play an
important role in shaping the learning process and learning outcomes (Salzman et al.,
1999; Wan et al., 2007).
Through this research, an initial theoretical model of the determinants of learning
effectiveness in a desktop VR-based learning environment is contributed. It should
bring VR practitioners one step closer to understanding how VR can be used to
support and enhance learning. The model shows that the link between VR
affordances and learning occurs within a web of other relationships. The research
findings will help to identify if authentic learning with multiple representations will
enhance learning; which VR features are prominent; which characteristics of the
learners require careful attention; and which facets of the constructs play a
substantial role in shaping learning outcomes (e.g. which psychological factors play
a more significant role in influencing the learning outcomes). In other words, this
research not only focuses on “Does VR technology influence learning outcomes?”
but also “How does VR technology enhance learning outcomes?” This theoretical

15
model is relevant for instructors, instructional designers and software developers
who are interested in providing students with VR technology for the future.
Educators are constantly looking for new, innovative and, most importantly,
effective ways to improve the learning experience of their students (Kaser, 1996).
Thus, it is important for instructional designers and VR software developers to know
which learning experiences play a substantial role in shaping students’ learning. For
the concept of the psychological factors (e.g. presence and motivation) to be useful
and applicable in practical situations, it is thus important to understand the results or
consequences of the psychological factors in a desktop VR-based learning
environment. The findings on the psychological aspect of learning experiences in
this study would be beneficial to instructional designers and VR software developers
as they would leverage the VR features to enhance the desired learning experiences
that play a significant role in improving the learning outcomes.
The findings on the prominence of the VR features would enable the VR software
developers to best leverage the VR affordance for learning. An interesting, appealing
and engaging learning environment is made possible with the attributes of VR.
However, such a learning environment might not be well accepted by all learners.
Indeed, according to Dalgarno et al., (2002), a virtual environment with a high
degree of fidelity and immediacy of control that is modeled on a real world scenario
will not necessarily facilitate learning, and thus may not be accepted by learners. The
interaction experience with the learning environment could play a vital role in
addressing this issue.

16
With regard to the interaction experience, this study will look into the usability
aspect in terms of the perceived usefulness and perceived ease of use of the VR
program based on the technology acceptance model (TAM) theorized by Davis
(1989). It is believed that the beliefs and attitudes toward technology are the
determinants of whether the technology will be accepted and thus influence the
learning experiences and outcomes. The structural equation modeling (SEM)
analysis on the interrelationships among VR affordances, interaction experience,
learning experience and learning outcomes might enlighten VR software developers
about the importance of considering interaction experience while designing and
developing a VR-based learning environment.
The SEM analysis on the influence of student characteristics, such as spatial abilities
and learning styles, in a VR-based learning environment would help to determine if
VR could accommodate individual differences, that is, be able to support learners
with different characteristics or if it benefits a certain group of learners. These
findings would further enhance the benefit of using VR for learning. With such
information, instructors could use VR to facilitate individualized learning.
To summarize, the results from this study could contribute to the limited literature on
the theoretical frameworks and models for using desktop VR in learning. It is hoped
that the results of this study could create awareness on the potentials and/or
weaknesses of the current VR technology for use in teaching and learning. This
research will make a significant contribution in enlightening educators and VR
practitioners to the potential of desktop VR technology to support and enhance
17
learning. Furthermore, through this research, a broad framework that identities the
theoretical constructs and their relationship is developed and an initial theoretical
model of the determinants of learning effectiveness in a desktop VR-based learning
environment is contributed. The framework and model can be used as guidelines in
the development of desktop VR-based learning environments.
1.6 Outline of the Thesis
This thesis is presented in eight chapters. Figure 1.3 is a visual overview of the
thesis. The thesis initially explores the potential of VR for educational purposes and
the overall research questions addressed in this research in Chapter 1.
Chapter 2 reviews the relevant literature on VR-based learning. It explains what VR
is, the types of VR and their application in instructional settings and how VR could
support the constructivist learning model. Related theories and models that form the
theoretical foundation of a desktop VR-based learning environment are also
reviewed.
Chapter 3 discusses the research framework to measure the effectiveness of a VR-
based learning environment as compared to a conventional classroom learning
practice, and the moderating effects of student characteristics on learning. It also
elaborates the development of the conceptual framework, model and hypotheses for
evaluating how desktop VR enhances the learning outcomes.

18
Figure 1.3: Overview of thesis
Chapter 4 provides a detailed description of the research methodology. It describes
the research design, population and sample, instrument development, software, data
collection procedures and data analysis techniques. Furthermore, it explains the
Does, and how does, desktop VR
influence the learning outcomes?
Chapter 1: Introduction Chapter 2: Literature Review
Approaches to determine ‘‘Does, and how does, desktop VR influence the learning outcomes?”
Chapter 3: Framework Chapter 4: Methodology
VR-based learning versus conventional learning; VR and individual differences
Theoretical model of how desktop VR enhances the learning outcomes
Outcomes, contributions and future directions
Chapter 5: Results
Chapter 7: Discussion Chapter 8: Conclusions
Further investigation
Chapter 6: Results

19
approach of using SEM to determine the fit of the hypothesized model. Finally, it
presents the results of the pilot study.
Chapter 5 presents the results of this study. Chapter 5 focuses on the answers to
‘‘Does VR influence the learning outcomes?’’ The effects of a VR-based learning
environment on the learning outcomes as compared to the conventional classroom
learning method are reported. The results of the ATI research are presented, as well
as the influence of individual differences on the VR learning mode.
Chapter 6 also presents the results of this study. However, it focuses on the answers
to ‘‘How does VR enhance the learning outcomes?’’ This chapter provides the
characteristics of the sample, the results of the measurement models and the
structural model.
Chapter 7 discusses the results of this study. It first discusses the results of the
learning effectiveness of a desktop VR-based learning environment and the ATI
research and their implications. It then discusses the results of the model evaluation
of how desktop VR enhances the learning outcomes, and their implications.
The final chapter, Chapter 8, provides a summary of the research and its
contributions. Limitations of the research and future directions are explained as well
as the implications of this study.

20
Chapter 2
LITERATURE REVIEW
2.0 Overview
The purpose of the literature review is to set the foundation for the specific
objectives of this study as described in Section 1.3. In a nutshell, this study aims to
determine the learning effectiveness of a desktop VR-based learning environment
and how a desktop VR-based learning environment could enhance the learning
outcomes. This chapter explains what VR is and the different types of VR. It then
provides a description of VR application in instructional settings and is followed by
the learning model supported by VR, that is, the constructivist learning model. Next,
the role of aptitude-by-treatment interaction with respect to learners’ spatial abilities
and learning styles is discussed. Finally, the related models and frameworks that
form the theoretical foundation of how a desktop VR-based learning environment
could enhance the learning outcomes are presented.
2.1 What is VR?
VR can be described as a 3-D synthetic environment that allows users to interact
intuitively in real time with the virtual world and provides a feeling of immersion for
the users (Allen et al., 2002; Auld, 1995; Ausburn & Ausburn, 2004; Ausburn &
Ausburn, 2008; Beier, 2004; Burdea & Coiffet, 2003; Pan et al., 2006; Roussou,
2004; Strangman & Hall, 2003). VR can range from simple environments presented
on a desktop computer to fully immersive multisensory environments (Auld, 1995;
21
Ausburn & Ausburn, 2004; Ausburn & Ausburn, 2008; Inoue, 2007; Strangman &
Hall, 2003). The power of VR lies in its possibility to simulate real or imaginary
environments, it can be represented with text or with graphic, and there is an implicit
element of interaction between the users and the computer-generated world (Allen et
al., 2002; Auld, 1995; Burdea & Coiffet, 2003). In the VR world, one or many
people can interact with the computer-generated environments in the way that they
would interact with the real-world equivalents (Allen et al., 2002). The degree of
interaction that users have in the VR world depends on the engineering within the
world itself and the hardware that they use to interact with it (Allen et al., 2002).
Interactivity contributes to the feeling of immersion that the user experiences (Allen
et al., 2002; Burdea & Coiffet, 2003). The level of immersion is dependent upon the
devices that are used and the kind of interactivity that is designed into the virtual
world (Allen et al., 2002). In fact, interactivity and immersion are the core elements
of VR that set it apart from other two- and three-dimensional graphics media (Allen
et al., 2002; Burdea & Coiffet, 2003; Jayaram, 1997).
In brief, what makes VR an impressive tool for learning is, in addition to
multimedia, VR allows learners to immerse in a 3-D environment and feel ‘in the
middle of another environment’ that closely resembles reality (Chen et al., 2004;
Inoue, 1999, 2007). As stated by Inoue (2007, p. 2), “In the VR world, the users
believe that what they are doing is real, even though it is an artificially simulated
phenomenon.” With other computer-based learning, learners are often distanced
from the environments and objects.
22
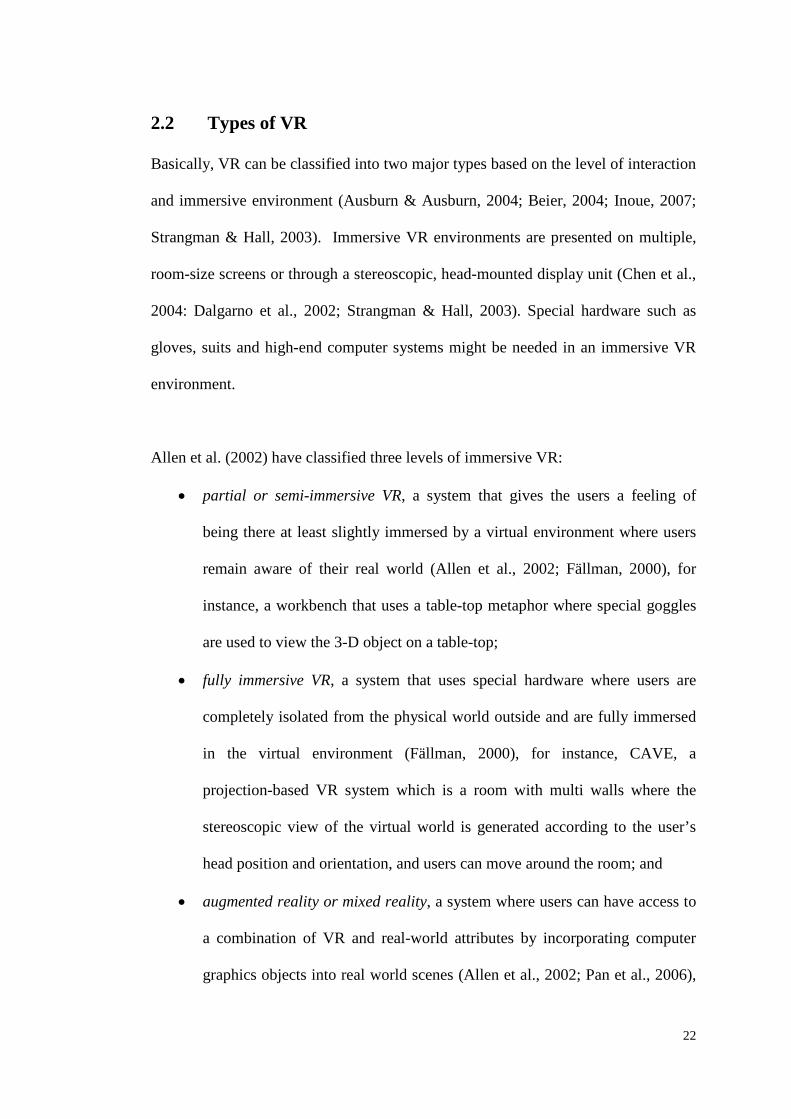
2.2 Types of VR
Basically, VR can be classified into two major types based on the level of interaction
and immersive environment (Ausburn & Ausburn, 2004; Beier, 2004; Inoue, 2007;
Strangman & Hall, 2003). Immersive VR environments are presented on multiple,
room-size screens or through a stereoscopic, head-mounted display unit (Chen et al.,
2004: Dalgarno et al., 2002; Strangman & Hall, 2003). Special hardware such as
gloves, suits and high-end computer systems might be needed in an immersive VR
environment.
Allen et al. (2002) have classified three levels of immersive VR:
• partial or semi-immersive VR, a system that gives the users a feeling of
being there at least slightly immersed by a virtual environment where users
remain aware of their real world (Allen et al., 2002; Fällman, 2000), for
instance, a workbench that uses a table-top metaphor where special goggles
are used to view the 3-D object on a table-top;
• fully immersive VR, a system that uses special hardware where users are
completely isolated from the physical world outside and are fully immersed
in the virtual environment (Fällman, 2000), for instance, CAVE, a
projection-based VR system which is a room with multi walls where the
stereoscopic view of the virtual world is generated according to the user’s
head position and orientation, and users can move around the room; and
• augmented reality or mixed reality, a system where users can have access to
a combination of VR and real-world attributes by incorporating computer
graphics objects into real world scenes (Allen et al., 2002; Pan et al., 2006),

23
for instance, where a user dissects a virtual dummy frog using a head-
mounted device and a real scalpel.
On the other hand, in a non-immersive virtual environment, computer simulation is
presented on a conventional personal computer and users can interact with the
computer images with a keyboard, mouse, joystick or touch screen (Chen et al.,
2004; Inoue, 2007; Neale & Nichols, 2001; Strangman & Hall, 2003). This type of
VR is known as non-immersive or desktop VR (Aoki et al., 2008; Ausburn &
Ausburn, 2004; Chen et al., 2004; Inoue, 2007; Youngblut, 1998). According to
Inoue (2007, p. 2), although the user is not technically immersed in desktop VR, it is
considered as a VR system because it is comparable to viewing a real world through
a window. Allen et al. (2002) mentioned that desktop VR relies on interactive
features built into the virtual world to provide a degree of immersion for users.
Desktop VR may be considered less immersive; however, Dalgarno et al. (2002)
argued that “the sense of presence or immersion in a 3-D environment occurs as a
consequence of the fidelity of representation and the high degree of interaction or
user control, rather than just a unique attribute of the environment.”
Silva, Cardoso, Mendes, Takahashi & Martins (2006) have classified two types of
VR based on the level of interaction and the complexity of the ambience: VR online
and VR offline. With VR offline, more complex simulation and perfect modeling of
objects in terms of textures, materials and animations are possible. However, for VR
online, there are more limitations in their multimedia aspects because care needs to
be taken for the size of files transmitted through the Internet. VR online and VR

24
offline as discussed by Silva et al. (2006) are in some ways parallel to immersive and
non-immersive VR respectively.
Due to the high cost of immersive VR systems and the inherent problems associated
with them, such as motion sickness, desktop VR provides an alternative to
immersive VR systems because it retains the benefits of real time visualization and
interaction within a virtual world (Chen et al., 2004; Chuah et al., 2008; Crosier et
al., 2000).
2.3 Virtual Reality Applications in Instructional Settings
VR is becoming increasingly popular for a variety of applications in today’s society.
It has become a well-suited medium for use in schools and colleges for science and
mathematics subjects as well as arts and humanities studies (Burdea & Coiffet, 2003;
Dalgarno et al., 2002; Roussou, 2004). This is due to the ability of VR to engage
learners in the exploration, construction and manipulation of virtual objects,
structures and metaphorical representations of ideas (Dalgarno, Bishop, Adlong, &
Bedgood Jr, 2009, p. 853). Strangman and Hall (2003) have also mentioned that VR
technology could make what is abstract and intangible become concrete and
manipulable, and this facilitates learning.
The virtual world used in learning could be of two types: a virtual world that mimics
the real world scenario (e.g. a virtual museum is created to study the history, art and
heritage of a place, or a virtual scene shows how bacteria enters the human body) or
computer simulation with 3-D geometric objects in an interactive multimedia

25
environment (e.g. ripping and unfolding a cube or generating a bottle design from a
2-D diagram) (Lee & Wong, 2008). These simulations could take many forms,
ranging from computer renderings of 3-D geometric shapes to highly interactive,
computerized laboratory experiments (Strangman & Hall, 2003).
There are quite a number of research reports mentioning VR computer simulations to
be an effective approach for improving students’ learning in both non-immersive and
immersive virtual environments as discussed below.
A. Non-Immersive VR Applications
Song and Lee (2002) from the Korea National University have used a web-based VR
to teach middle school geometry classes in Korea. The Virtual Reality Modeling
Language-based 3-D illustration technique was used to provide VR figures and
solids for geometric subject in the middle school. The client-server environment was
used where the students were allowed to access and explore the geometric objects on
the teachers’ server via the World Wide Web. Two-dimensional (2-D) objects or
drawings from the textbooks were modeled and implemented in 3-D with the VRML
format. By using VRML browsers, students were not only able to access specific
figures but also to observe the figures from many different angles. Thus, students
could vividly observe and ‘feel’ the figures as if they were real objects. The test
results showed that the application of VRML-based 3-D objects had a positive effect
on students’ learning of geometric topics, if the visual experience was crucial.

26
Kim, Park, Lee, Yuk, & Lee (2001) have created a computer-based VR simulation,
the Virtual Reality Physics Simulation (VRPS) that helps students to learn physics
concepts such as wave propagation, ray optics, and relative velocity at the level of
high school or college physics. The VRPS provides a sensory-rich interactive
learning environment which enhances students’ understanding by providing a degree
of reality which is unable to be achieved in a traditional 2-D interface (Kim et al.,
2001). Realistic hands-on experimentation is made possible for the students and
physical phenomena can be viewed in many different perspectives in a VR
laboratory. Their study findings showed that the students were more satisfied with
their instruction through the use of VRPS and they understood the subject matter
better. This implies that VRPS is a useful teaching tool for highly interactive
visualization of abstract concepts in physics education (Kim et al., 2001).
Dalgarno et al. (2009) have developed a 3-D simulated virtual environment called
the Virtual Chemistry Laboratory using VRML as a tool to help prepare distance
university chemistry students for their on-campus laboratory sessions. The Virtual
Chemistry Laboratory is provided to students on CD-ROM. It is a tool to help
prepare students to gain familiarity with the real laboratory environment and to
undertake laboratory tasks. Studies were conducted to test the degree to which
learning about the laboratory and its apparatus using the virtual laboratory was
equivalent to face-to-face learning in the actual laboratory. There was no significant
difference in the apparatus identification test, the view position test and the apparatus
location test between the virtual laboratory group and the real laboratory group. The

27
study results indicated that the Virtual Chemistry Laboratory is an effective tool for
gaining familiarity with the laboratory environment.
B. Immersive VR Applications
Construct3D is a 3-D geometric construction tool based on the collaborative
augmented reality system “Studierstube” developed by Kaufmann, Schmalstieg and
Wagner (2000). The setup uses a stereoscopic HMD and a Personal Interaction Panel
(PIP), a two-handed 3-D interaction tool. It is used in mathematics and geometry
education at high school and university level. Complex 3-D objects and scenes are
provided by Construct3D to enhance, enrich and complement the mental pictures
that students form in their mind when working with 3-D objects (Kaufmann et al.,
2000). Thus, complex spatial problems and relationships can be comprehended better
and faster than with traditional methods (Kaufmann et al., 2000).
ScienceSpace project consists of three immersive virtual environments for science
instruction: NewtonWorld, MaxwellWorld and PaulingWorld. The VR features that
are central to the design of ScienceSpace learning environments are: immersive 3-D
representation; multiple perspectives and frames of reference; and multisensory cues
(Salzman & Loftin, 1996). In NewtonWorld, learners can become a ball that is
moving along an alley to learn Newton’s laws of motion. Multisensory cues are
used to direct users’ attention to important variables such as mass, velocity and
energy (Salzman et al., 1999). In MaxwellWorld, learners can build and explore
electric fields. They can directly experience the field by becoming a test charge and
be propelled through the field by the electric forces (Salzman & Loftin, 1996). In

28
PaulingWorld, learners explore the atoms and bonds of a simple and complex
molecule for a lesson in chemistry (Salzman et al., 1999). The evaluation with
respect to usability and learnability of all three virtual learning environments were
conducted. From the ScienceSpace research, there was substantial evidence to
suggest that multiple viewpoints and frames of reference, multimodal interaction and
multisensory cues had enhanced the learning experience and had assisted learners in
developing correct mental models of the abstract and complex material.
NICE (Narrative-based, Immersive, Constructionist/Collaborative Environments) is
one of the first educational VR applications designed and developed for CAVE by
the Electronic Visualization Lab (EVL) at the University of Illinois at Chicago.
NICE is a system that supports real-time distributed collaboration. The children can
collaboratively construct, plant and tend a healthy virtual garden, learn about
gardening and work together (Allison & Hodges, 2000). They can also modify the
parameters of the ecosystem to see how it affects the health of the garden.
The Virtual Gorilla Exhibit was developed at the Georgia Institute of Technology for
Zoo Atlanta to educate students about gorillas, their lifestyle and their plight as an
endangered species (Allison & Hodges, 2000). Students can adopt the role of the
gorilla and experience how a gorilla would react to various stimuli and events
(Allison & Hodges, 2000). They can explore areas that were usually off limits to
casual visitors. The positive reactions from the students imply that it is possible to
use VR as a more general educational tool to teach middle school students the
29
concepts about gorilla behaviors and social interactions which they do not seem to be
learning just by visiting the zoo (Allison & Hodges, 2000).
Liu, Cheok, Lim and Theng (2007) have created a mixed reality classroom. Two
systems were developed: the solar system and the plant system. In the solar system,
users sit around an operation table and use a head-mounted device to view the virtual
solar system. Cups are used for the interactions between the users and the virtual
objects. For instance, users can use the cup to pick up part of the earth to observe its
inner structure. As for the plant system, four topics regarding plants were created:
Reproductive, Seeds Dispersal, Seeds Germination and Photosynthesis. For example,
in seeds germination, users have to set the right conditions to see a bug growing. The
preliminary study conducted by Liu et al. (2007, p. 65) indicated that the
participants’ intention to use mixed reality for learning was influenced directly by
perceived usefulness and indirectly through perceived ease of use and social
influence.
In spite of the positive learning effects, VR might not work for all kinds of learning
and it should not be used indiscriminately in any educational program (Sanchez et
al., 2000). Research by Song and Lee (2002) found that there was no significant
difference in the scores for non-visual aid critical questions in the VRML-based class
(using networked VRML material) and the traditional class (chalk and blackboard).
This implies that VR may not be useful in a geometry class when visual aids are not
crucial. In the study of Crosier et al (2000), comparison was made between desktop
VR (virtual laboratory) and traditional teaching methods (using video and

30
blackboard) for teaching radioactivity to secondary school students aged between 15
and 16 years old. No obvious benefits were found for the use of VR over traditional
teaching methods in terms of test scores and attitude rating.
Research in VR and education is a relatively young field (Adamo-Villani & Wilbur,
2007; Inoue, 2007). Thus, more VR research is needed to establish the empirical
support for using VR for instructional purposes (Inoue, 2007; McLellan, 2004). In
this study, desktop VR is used to determine not only the answer to “Does VR bring
benefits to the learners?”, but also to “How does it benefit the learners in a secondary
classroom setting?”
2.4 VR and the Constructivist Learning Model
One of the objectives of this study is to examine the learning effectiveness of a
desktop VR-based learning environment, which is a student-centered approach that
follows the constructivist learning model as compared to the traditional learning
method, which is a teacher-centered approach that follows the objectivist learning
model. Objectivists believe knowledge exists outside the human mind (Moallem,
2001; Roblyer, 2003). Learning happens when this knowledge is transmitted to
people and they store it in their minds (Roblyer, 2003, p. 53). Constructivists, on the
other hand, believe that knowledge is constructed by humans in their mind by
participating in certain experiences and does not exist outside of their mind
(Jonassen, 1994; Jonassen et al., 1999; Martens, Bastiaens, & Kirschner, 2007;
Reigeluth, 1999; Roblyer, 2003). Table 2.1 shows the differences between the
constructivist and traditional learning methods.

31
VR is capable of affording constructivist learning because it provides a highly
interactive environment in which learners are active participants in a computer-
generated world (Kim et al., 2001). As mentioned above, constructivism is a
philosophy of learning that believes learners construct their own knowledge and
reality. Constructivist learning is student-centric and focuses on meeting the
learners’ needs and helping the learners to construct and build on their own new
knowledge based on their prior experiences and knowledge (Mergel, 1998; Roblyer,
2003). Learners actively participate in the learning activities to construct meaningful
tasks and to achieve meaningful learning. Constructivists believe knowledge and
reality are constructed either socially or by individuals (Jonassen, 1994).
Table 2.1: Constructivist versus traditional learning methods (Adapted from Jonassen et al., 1999)
Constructivist Traditional Knowledge Constructed, emergent, situated in
action or experience, distributed Transmitted, external to knower, objective, stable, fixed, decontextualized
Reality Product of mind External to the knower Meaning Reflects perceptions and
understanding of experiences Reflects external world
Learning Knowledge construction, interpreting world, constructing meaning, authentic-experiential, articulation-reflection, process-oriented
Knowledge transmission, reflecting what teacher knows, well structured, abstract-symbolic, encoding-retention-retrieval, product-oriented
Instruction Reflecting multiple perspectives, diversity, modeling, coaching, exploration
Simplify knowledge, lecturing, instructor derived and controlled, tutoring
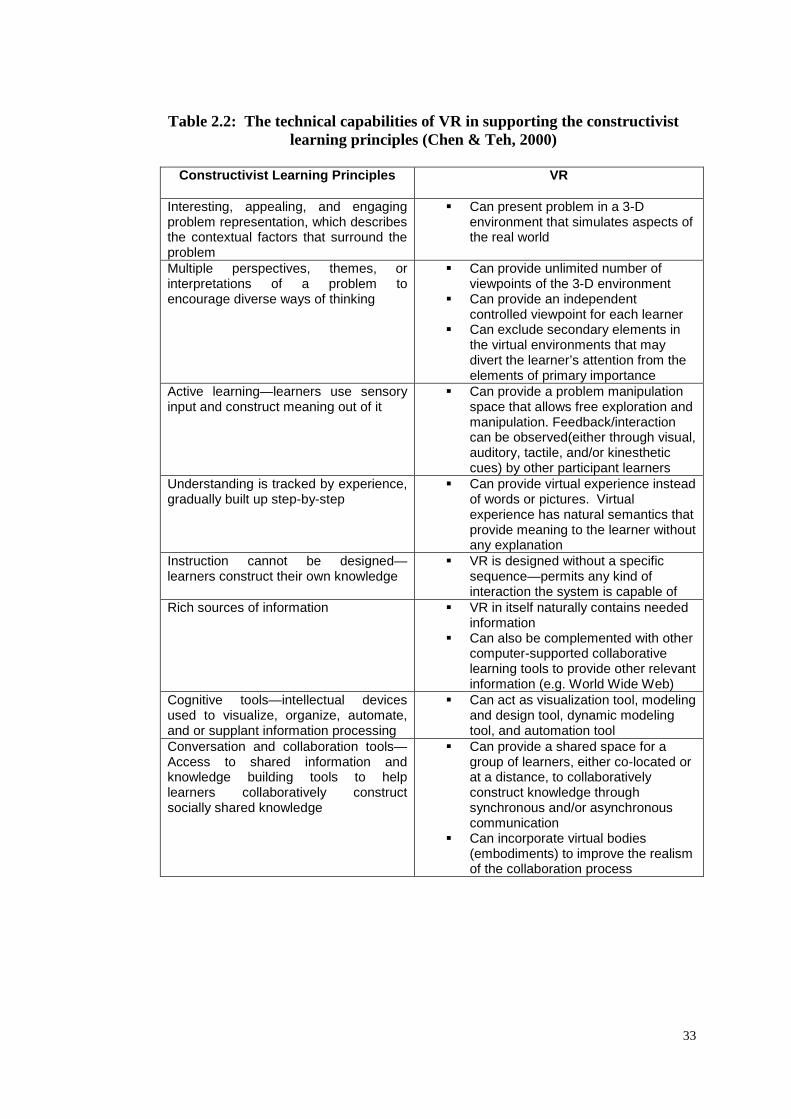
Chen and Teh (2000) have pointed out how the various capabilities of VR
technology can support the constructivist learning principles as presented in Table
2.2. The constructivist learning principles pointed out by Chen and Teh (2000) are
congruent with those posited by Dalgarno (1998) which focus on active learning and

32
learner control over content, sequence and learning strategy to construct one’s own
knowledge; authentic, contextual and discovery activity to encourage diverse ways
of thinking and to apply what is learned in realistic contexts; interesting, appealing
and engaging problem representation to provide intrinsic motivation; and articulation
and discussion to share knowledge built.
The VR program used in this study is consistent with the constructivist-oriented
approach of learning. In the learning environment, students are active learners and
have control over content, sequence and pace of learning. They explore the authentic
learning environment and construct their own knowledge. Moreover, they need to
reflect upon their understanding of the new knowledge to engage in the learning
activities and to complete the lab report. The virtual experiment would enhance their
procedural knowledge, and this new knowledge and skills can be put forward into
practice in realistic contexts. In fact, the 3-D simulations in the VR-based learning
environment is consistent with the endogenous interpretation of constructivism,
which emphasizes learners’ discovery of knowledge through their interaction with
the learning environment rather than from direct instruction (Dalgarno, 2002).
33
Table 2.2: The technical capabilities of VR in supporting the constructivist learning principles (Chen & Teh, 2000)
Constructivist Learning Principles VR
Interesting, appealing, and engaging problem representation, which describes the contextual factors that surround the problem
Can present problem in a 3-D environment that simulates aspects of the real world
Multiple perspectives, themes, or interpretations of a problem to encourage diverse ways of thinking
Can provide unlimited number of viewpoints of the 3-D environment
Can provide an independent controlled viewpoint for each learner
Can exclude secondary elements in the virtual environments that may divert the learner’s attention from the elements of primary importance
Active learning—learners use sensory input and construct meaning out of it
Can provide a problem manipulation space that allows free exploration and manipulation. Feedback/interaction can be observed(either through visual, auditory, tactile, and/or kinesthetic cues) by other participant learners
Understanding is tracked by experience, gradually built up step-by-step
Can provide virtual experience instead of words or pictures. Virtual experience has natural semantics that provide meaning to the learner without any explanation
Instruction cannot be designed—learners construct their own knowledge
VR is designed without a specific sequence—permits any kind of interaction the system is capable of
Rich sources of information VR in itself naturally contains needed information
Can also be complemented with other computer-supported collaborative learning tools to provide other relevant information (e.g. World Wide Web)
Cognitive tools—intellectual devices used to visualize, organize, automate, and or supplant information processing
Can act as visualization tool, modeling and design tool, dynamic modeling tool, and automation tool
Conversation and collaboration tools—Access to shared information and knowledge building tools to help learners collaboratively construct socially shared knowledge
Can provide a shared space for a group of learners, either co-located or at a distance, to collaboratively construct knowledge through synchronous and/or asynchronous communication
Can incorporate virtual bodies (embodiments) to improve the realism of the collaboration process

34
2.5 Aptitude-by-Treatment Interactions (ATI)
Ausburn and Ausburn (2004) have called for the application of the ATI model in
new studies on VR in education because the ATI model is more multi-factor in
concept. In this model, the interest is not on the effect of an instructional method, if
it works or is better, but on the interactions between various instructional methods
and learners’ aptitudes or characteristics. Interaction between aptitude and treatment
occurs when the effect of treatment differs depending on the level of aptitude
measure. Such a research model will enlighten educators for what purposes and for
whom an instructional method may be effective (Ausburn & Ausburn, 2004).
In essence, ATI research investigates the effect of individual differences on learning
outcomes from different forms of treatment or instruction (Cronbach & Snow, 1969).
The concept of ATI begins when Cronbach (1957) uses a correlational approach to
relate individual differences and achievement to different experimental treatments
(Jonassen & Grabowski, 1993, p. 23). Aptitudes refer to any of the personological
variables such as mental abilities, personality, or cognitive styles, whereas treatment
comprises the structural and presentational properties of instructional methods
(Jonassen & Grabowski, 1993).
Two types of interaction are possible: disordinal interaction and ordinal interaction
(Jonassen & Grabowski, 1993). Figure 2.1 shows disordinal interaction. Learners
with low scores on the aptitude measure perform poorly on the instructional outcome
measure under treatment A. However, learners with similar scores on the aptitude
measure do better on the outcome measure under treatment B. Conversely, learners

35
with high scores on the aptitude measure perform poorly in treatment B but better in
treatment A. The regression slopes are different and they are intersected (Jonassen &
Grabowski, 1993).
Figure 2.1: Disordinal interaction
On the other hand, in ordinal interaction, one treatment produces better results for all
learners within the range of aptitude studied as shown in Figure 2.2. The two slopes
are different and do not intersect (Jonassen & Grabowski, 1993; Tobias, 1980). This
means that all learners within the range of aptitude studied perform better under
treatment B. The learners with high scores on the aptitude measure perform better
than the learners with low scores on the aptitude measure for both treatments.
Figure 2.2: Ordinal interaction
A
B
High
High
Low
Low
Achi
evem
ent
Aptitude
A
B High
High
Low
Low
Achi
evem
ent
Aptitude

36
Results from ATI research can serve as a guide on how to adapt instruction to
different learners. ATI research is conducted in this study to investigate the
interaction between aptitudes (spatial ability and learning style) and learning modes
(VR mode and Non-VR mode) on the learning outcomes.
2.5.1 Spatial Ability and VR
Spatial ability refers to a group of cognitive functions and aptitudes that is crucial in
solving problems that involve manipulating and processing visuo-spatial information
(Bodner & Guay, 1997; Hannafin et al., 2008; Lajoie, 2008; Rafi et al., 2005),
because it is the mental process used to perceive, store, recall, create, edit and
communicate spatial images (Linn & Petersen, 1985). Gardner (1993) stated that
spatial ability is one of the seven major components in multiple intelligences. He
defined spatial intelligence as the ability to think in pictures and images, to perceive,
transform, and recreate different aspects of the visuo-spatial world, whilst some of
the overt spatial behaviors, identified by Durlach et al. (2000), include the behavior
exhibited in exploring a space, searching for some items in a space, planning or
following a route in a space, selecting and recognizing landmarks in a space,
constructing or interpreting maps of a space, imagining how a space and objects in it
would appear from different viewpoints.
Though a number of spatial abilities have been identified, a consensus concerning
various factors of spatial ability has not been reached (Black, 2005; Rafi et al.,
2005). According to Michael, Guildford, Fruchter, and Zimmerman (1957), there are
two major spatial factors: spatial orientation and spatial visualization. Ekstrom,
37
French, Harman, and Dermen (1976) defined spatial orientation as a measure of the
ability to remain unconfused by changes in the orientation of visual stimuli, and
therefore it involves only a mental rotation of configuration. McGee (1979) defined
spatial visualization as a measure of the ability to mentally restructure or manipulate
the components of the visual stimulus and involves recognizing, retaining, and
recalling configurations when the figure or parts are moved.
Research findings show that appropriate computer technologies can be used to
improve spatial ability. Due to its interactive and animated features, VR serves as a
promising technology to increase students’ spatial ability (Mohler, 1999). McLellan
(1998) stated that “VR is a superb vehicle for enhancing and possibly improving
spatial ability, because its interactive nature is aimed at extending and enhancing
human cognitive abilities.” However, there is a concern as to whether learner
characteristics might influence VR-based learning. Norman (1994) mentioned that
the positive impact of computer-based technology in education depends on the
individual ability of users. While some computer-based technologies may serve to
benefit some learners, at the same time they may also serve to handicap others
(Norman, 1994).
It is believed that spatial visualization ability is the primary cognitive factor that
causes the differences in performance and has an impact on comprehension of 3-D
computer visualization (Huk, 2006; Keehner, Montello, Hegarty, & Cohen, 2004;
Norman, 1994). Students with different spatial visualization ability will benefit
differently when learning with interactive 3-D animations or simulations (Hays,

38
1996; Huk, 2006; Mayer & Sims, 1994; Wu & Shah, 2004), which depends on their
ability to extract relevant information and then reconstruct or incorporate the
information into their existing mental models. Thus, it is inappropriate to think that
the mere application of VR technology in education will benefit everyone equally in
relation to spatial ability (Lee et al., 2009a). Owing to this, more research is needed
to qualify and quantify the impact of the use of VR for learning.
2.5.2 Learning Style and VR
People learn in different ways according to their preferred learning style (Kolb,
1984). According to Cassidy (2004, p. 420), the manner in which individuals choose
to or are inclined to approach a learning situation has an impact on performance and
achievement of the learning outcomes. Kolb (1984) defined learning style as one’s
preferred methods of perceiving and processing information based on the
experiential learning theory. The theory of experiential learning propagates learning
through experience and by experience (Müller & Ferreira, 2005). It is through the
transformation of experience that knowledge is created. Kolb (1976) divided the
learning process cycle into four learning modes: concrete experience (CE), reflective
observation (RO), abstract conceptualization (AC), and active experimentation (AE)
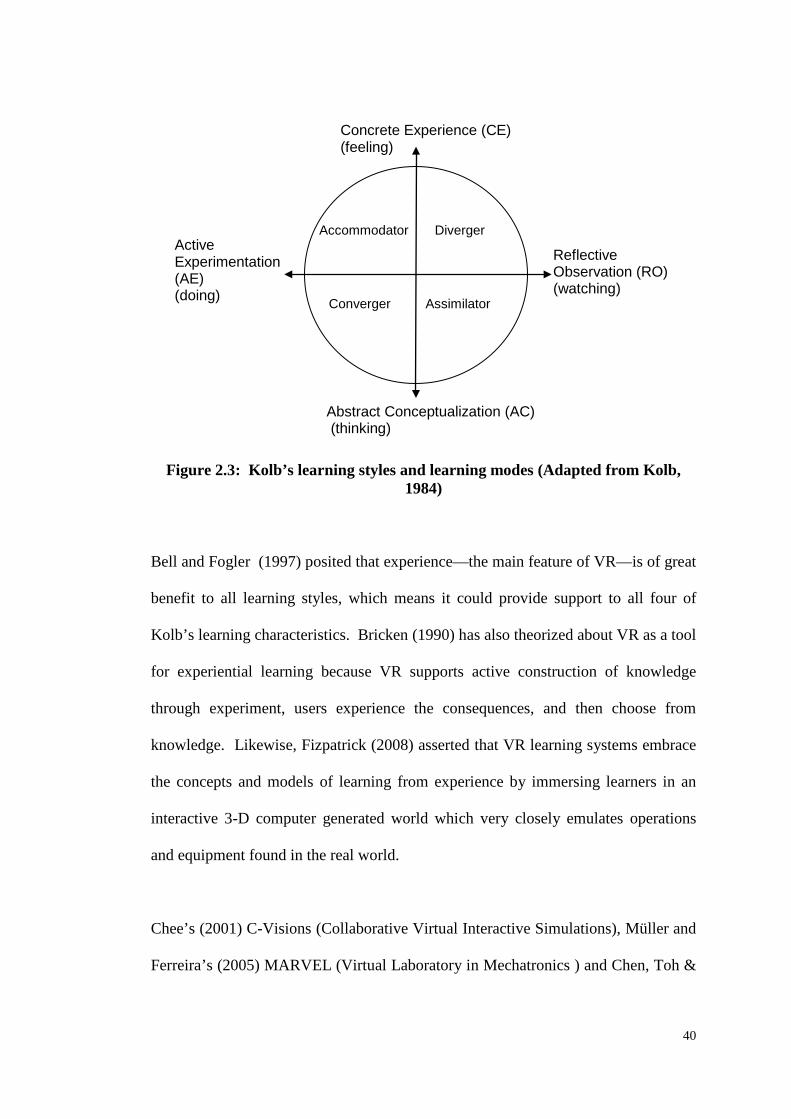
as shown in Figure 2.3. The four-stage model articulates that learning is an iterative
process that generally begins with a concrete experience, which is followed by
reflecting upon what has been observed in these experiences, then to assimilate and
integrate conclusions into a theory by abstract conceptualization, and finally to test
and apply new theories in new situations. Each individual is most likely to feel most
comfortable in one of these four learning modes based on his or her preference along
39
two primary dimensions: the concrete-abstract dimension and the active-reflective
dimension (Kolb, 1984). That is, in perceiving or taking in new information, people
characteristically choose between a concrete (feeling) or an abstract (thinking)
approach; in processing what they take in, they tend to choose between an active
(doing) or a reflective (watching) approach (Kolb, 1984). By plotting the preference
along these two primary learning dimension continua, Kolb (1984) identified four
types of learning styles: accommodator, assimilator, diverger and converger.
Accommodators prefer CE and AE. They like doing and experiencing things. They
are risk-takers, tend to solve problems in an intuitive, trial-and-error manner, and
rely on others for information.
Divergers prefer CE and RO. They learn by feeling and watching. They are
imaginative, good at seeing things from different perspectives, creative, emotional,
sensitive to people, and have a broad cultural interest.
Assimilators prefer RO and AC. They learn by watching and thinking. They are
more concerned with abstract concepts and ideas, good at putting information into a
logical form, excel in inductive reasoning, and are less interested in people and
prefer to work alone.
Convergers prefer AE and AC. They learn by doing and thinking. They tend to be a
problem solver and decision maker, good at finding practical uses for ideas and
theories, are generally deductive in their thinking, and are relatively unemotional.
40
Figure 2.3: Kolb’s learning styles and learning modes (Adapted from Kolb,
1984)
Bell and Fogler (1997) posited that experience—the main feature of VR—is of great
benefit to all learning styles, which means it could provide support to all four of
Kolb’s learning characteristics. Bricken (1990) has also theorized about VR as a tool
for experiential learning because VR supports active construction of knowledge
through experiment, users experience the consequences, and then choose from
knowledge. Likewise, Fizpatrick (2008) asserted that VR learning systems embrace
the concepts and models of learning from experience by immersing learners in an
interactive 3-D computer generated world which very closely emulates operations
and equipment found in the real world.
Chee’s (2001) C-Visions (Collaborative Virtual Interactive Simulations), Müller and
Ferreira’s (2005) MARVEL (Virtual Laboratory in Mechatronics ) and Chen, Toh &
Abstract Conceptualization (AC) (thinking)
Concrete Experience (CE) (feeling)
Reflective Observation (RO) (watching)
Active Experimentation (AE) (doing)
Diverger
Accommodator
Assimilator Converger
41
Wan’s (2005) VR program for novice car driver have provided example applications
of how VR can be designed to support Kolb’s model of experiential learning.
According to Chee (2001), the first-person learning experience afforded by a virtual
environment allows learners to directly experience things that they seek to learn and
they have the autonomy and control over their own learning experience. The
synthetic replica of objects and phenomena of interest by the virtual environment
would help learners to concretize and reify ideas. Thus the virtual representations
would help make what is otherwise unimaginable, imaginable and experienceable.
Ultimately, learners need to generalize their learning experience to form appropriate
rules and abstractions for the knowledge learned. VR is capable of supporting the
experiential learning theory because it is able to provide “here-and-now” experience
to test theories, as well as giving instant feedback to change these theories (Müller &
Ferreira, 2005). Chen et al., (2005) have also found that their virtual environment
that mimics the real world road scenarios provides a concrete experience for learners
to explore actively and, at the same time, the text and image material presented
require reflective observation and abstract conceptualization.
Various learning style models have been developed by scholars, such as the Honey
and Mumford learning model (Honey & Mumford, 1992), the VARK learning model
(Hawk & Shah, 2007), and the Felder-Silverman Learning model (Hawk & Shah,
2007). As VR and the Kolb learning style model are directly related, the Kolb
Learning Style Inventory that categorize one’s learning style model based on the
experiential learning theory was chosen in this study.

42
2.6 Theoretical Foundation for a Desktop VR-based Learning Environment Research on how desktop VR supports and enhances learning is rare. A search of
the literature shows that there is a lack of a broad framework and a theoretical model
that is systematically and empirically tested to describe how desktop VR enhances
the learning outcomes. This research aims to fill this gap. For parsimony and
feasibility of practice, this study intends to identify the relevant constructs and
measurement factors that play an important role in a desktop VR-based learning
environment. The findings will present guidelines for desktop VR-based learning
development. Hence, this section analyzes and synthesizes various relevant
theoretical models and frameworks that could guide the development of the
theoretical framework of how desktop VR could enhance the learning outcomes.
The literature search conducted in this study shows only one model has been
developed to understand how VR influences the learning process and learning
outcomes in the VR learning environment. The model is developed by Salzman et al.
(1999) for immersive virtual learning and describes the importance of scrutinizing
how VR features work together with other factors such as the concept that is to be
learned, the learner characteristics, the interaction and learning experience that
influence the learning process (the kinds of information to which one attends), which
in turn affects the learning outcomes (the person’s level of understanding after the
lessons have been completed)—see Figure 2.4. VR features influence not only
learning, but the quality of the interaction and learning experience as well. The
appropriate usage of VR features depends on the concepts to be learned and
mastered.

43
Concept
3-D Immersion
FORs Multi-sensory
Spatial Ability
Gender Domain Experience
Computer Experience
Motion Sickness History
Immersive Tendency
Simulator Sickness
Usability
Immersion
Motivation
Learning Process
Learning Outcomes
VR Features Learning
Learner Characteristics
Interaction Experience
Learning Experience
Figure 2.4: Theoretical model describing how VR features, concept to be learned, learner characteristics, and the interaction and learning experiences work together to influence the learning outcomes in immersive VR learning environments (Saltzman et al., 1999)

44
According to the model of Salzman et al. (1999), learner characteristics are an
important factor that may moderate the relationship between VR features and
learning, and they may influence the interaction experience (e.g. how easily the user
can interact with the system) and learning experience (e.g. motivation). Each
individual has a unique experience when interacting with the VR learning
environment which may help to motivate one to learn, and vice versa. The learner
characteristics that are likely to be important are gender, domain experience, spatial
ability, computer experience, motion sickness history and immersive tendencies.
Learning experiences such as motivation and presence, and interaction experiences
such as usability and simulator sickness can be affected by VR features, which
influence learning. The model demonstrates that the link between VR affordances
and learning occurs within a web of other relationships (Salzman et al., 1999, p.
295).
The lack of literature on the theoretical model and framework of using non-
immersive desktop VR in education has prompted a literature search in the field of
information systems. It was found that there is a convergence among the theoretical
perspectives between the model identified by Salzman et al. (1999) and the models
used in other technology-mediated learning (e.g. web-based learning). The
underlying reason could be that the use of VR in web-based learning is proliferating.
Indeed, with the emergence of desktop VR technology, the simulation of a 3-D
world on a 2-D computer screen is made possible and this form of VR has been on
the Internet since the mid-1990s (Inoue, 2007; Kwan, Kim, & Kim, 2002), for

45
instance, in the studies of Li et al. (2002), Ong and Mannan (2004), Song and Lee
(2002), Sharda et al. (2004), Kim et al. (2001), Creedy et al. (2007), and Monahan,
McArdle and Bertolotto (2008). Technology-mediated learning models could help
to shed some light on the learning effectiveness with VR technology because this
technology has been used in web-based learning with the emergence of VRML and
X3D to generate 3-D interactive graphical representations that can be delivered over
the web. Learner-content interaction is crucial in web-based learning as well as in
desktop VR-based learning.
Alavi and Leidner (2001), Piccoli, Ahmad and Ives (2001), Benbunan-Fich and Hiltz
(2003), Sharda et al. (2004) and Wan et al. (2007) have offered a relatively complete
view on the framework of technology-mediated learning. Alavi and Leidner (2001,
p. 2) defined technology-mediated learning as an environment in which the learner’s
interactions with learning material, peers and/or instructors are mediated through
advanced information technologies. The focus of this study is on learning from
instruction in the context of a desktop VR-based learning environment for secondary
school education. Learning from instruction refers to situations where one individual
intentionally creates and structures the environment of the learner in such a way that
the learner will achieve the desired outcomes (Shuell & Lee, 1976). In this study, the
environment strictly refers to the desktop VR-based learning environment in which
the learners’ interaction with learning materials is mediated by the VR technology.
The focus is on student-content interaction. Hence, the technology-mediated learning
theory is adopted in this study.
46
Alavi and Leidner (2001) have proposed a framework for technology-mediated
learning that addresses the question of how can technology enhance learning. This
framework emphasizes the need to consider technology in relation to instructional
methods, psychological and environmental factors to enhance learning outcomes (see
Figure 2.5). Alavi and Leidner (2001) have called for greater depth of research on
using technology in learning as there is a lack of studies that consider the internal
psychological process through which learning occurs. Psychological processes refer
to states within the learner that are involved in learning which include the learner’s
cognitive and information processing activities, motivation, interest and cognitive
structure.
Technology features are emphasized in the framework as they can influence learning
through the psychological processes. Nevertheless, the framework of Alavi and
Leidner (2001) ignores participant factors such as student characteristics which other
researchers have found to be influential on the learning outcomes of technology-
mediated learning (Benbunan-Fich & Hiltz, 2003; Piccoli et al., 2001; Sharda et al.,
2004).
The learning experiences examined by Salzman et al. (1999) are in some ways
parallel to the internal psychological process emphasized by Alavi and Leidner
(2001). Both determine the impact of technology features on learning experiences
and learning outcomes. However, the framework of Alavi and Leidner (2001)
ignores construct such as learner characteristics as identified by Salzman et al.
(1999) in the VR learning environment.

47
Figure 2.5: A framework for technology-mediated learning research (Alavi & Leidner, 2001)
Drawing on the technology-mediator learning theory, Piccoli et al. (2001) have
developed a conceptual framework that identifies the primary dimension for a web-
based virtual learning environment. Two classes of determinants are identified by
Piccoli et al. (2001): human dimension and design dimension. The student is one of
the primary participants in the human dimension (see Figure 2.6).
Student characteristics such as maturity, motivation, technology comfort, technology
attitudes, previous experience, computer anxiety and epistemic beliefs may influence
students’ ability to learn effectively in a virtual learning environment. It is noted that
the student characteristics identified by Piccoli et al. (2001) bear some similarity to
those identified by Salzman et al. (1999). The design dimension emphasizes the
learning model, the quality and reliability of the technology, the aspects of learner
control, content and interaction. However, this framework ignores that role of
learning processes that mediates the relationships between instructional design and
technology dimension and learning outcomes as proposed by Alavi and Leidner
(2001).
Instructional Strategy
Information Technology
Psychological
Learning Process
Learning Outcomes

48
Figure 2.6: Dimensions and antecedents of virtual learning environment effectiveness (Piccoli et al., 2001)
Benbunan-Fich and Hiltz’s (2003) research framework consists of moderator
variables, mediator variables and independent variables (see Figure 2.7). The
moderators consist of the factors of technology (e.g. functionality, usability and
reliability which are akin to interaction experience), course (e.g. type of subject and
Human Dimension
Students e.g. Maturity Motivation Technology comfort Previous experience Computer anxiety Epistemic beliefs
Instructors e.g. Technology control Technology attitudes Teaching Style Self-efficacy Availability
Design Dimension
Learning Model e.g. Objectivist Constructivist
Technology e.g. Quality, Reliability Availability
Learner Control e.g. Pace, Sequence Content
Content e.g. Factual knowledge
Procedural knowledge Conceptual knowledge
Interaction e.g. Timing, Frequency Quantity
Effectiveness
Performance e.g. Achievement Recall Time on task
Self-efficacy
Satisfaction e.g. Evaluation of the learning experience Drop rate Anxiety

49
organization context) and student characteristics (ability, skills and attributes). This
framework highlights the mediating effect of the learning process on the
relationships between technology, course, student characteristics and learning
outcome which answers the call for greater depth in technology-mediated learning
by Alavi and Leidner (2001).
Figure 2.7: Research framework of Benbunan-Fich and Hiltz (Benbunan-Fich
& Hiltz, 2003)
To address the issue of an inconsistent measurement of learning outcomes, that is,
some studies measured learning effectiveness whereas others measured in term of
students’ perceptions, Sharda et al. (2004) have proposed a theoretical foundation of
computer-supported collaborative learning requiring immersive presence (CSCLIP)
which categorizes the learning outcomes into three components: cognitive learning
Technology Mode (Media Mix) - Equipment access -Software functionality -Software interface (Usability) -Reliability
Technology Mode (Media Mix) - Equipment access -Software functionality -Software interface (Usability) -Reliability
Course Course Type - Class size - Type of subject - Instructor skill and effort -Organizational context
Student Characteristics -Ability (GPA) -Skills -Attribute
Mediators: Motivation
Collaborative learning Active participation Access to professor
Convenience
Outcomes:
Perceived learning outcomes
Moderators
50
outcomes which include knowledge, comprehension, application, analysis, synthesis
and evaluation (Bloom, 1956); affective learning outcomes which include students’
perceptions of satisfaction, attitudes, respect and appreciation for the learning
experiences (Sharda et al., 2004); and psychomotor learning outcomes which refer to
efficiency, accuracy and response magnitude (Sharda et al., 2004).
The framework of CSCLIP is used to develop a simulated 3-D virtual lab for remote
students to move around the lab in the virtual world, and manipulate components of
live equipment. For instance, remote students can select the appropriate cable from a
bin of virtual cables and plug it into the hub using the mouse and drag-and-drop
action. This framework also emphasizes the dimension of technology in the form of
process support (e.g. audio and video using Internet and VR technologies), process
structure (e.g. embedded procedural order built into the remote-task software), task
structure (e.g. instructional lab modules) and task support (e.g. virtual lab tours and
virtual control) in technology-mediated learning, with the human dimension such as
the student as the moderator variable that may influence the learning outcomes (see
Figure 2.8).

51
Figure 2.8: Framework of outcomes and their causal relationships in CSCLIP (Sharda et al., 2004)
Learning Objectives Psychomotor Cognitive Affective
Task Type Difficulty Time
Immersive Communication Technologies (Process Support) e.g. Reliability Richness Usefulness
Embedded Procedural Order (Process Structure) e.g. Subtask Order
Instructional Module (Task Structure) e.g. Redesigned Lab Modules to Accommodate CSCLIP
Instructional Infrastructure (Task Support) e.g. Virtual Tours Virtual Control
Human Dimension Students
Learning Styles Demographics
Groups Size
Homogeneity Instructors
Teaching Style Technology Comfort
Psychomotor Efficiency Effectiveness Response Magnitude
Cognitive Comprehension Knowledge Problem Solving
Affective Individual Satisfaction Group Satisfaction Task Satisfaction
(+/-)
(+/-)
(+/-)
(+/-)
(+/-)
(+/-)
Legend Instructional Design and Decision Influences Causal Influences Moderating Influences
CSCLIP Environment

52
Wan et al. (2007) have proposed an input-process-output framework for technology-
mediated learning. It consists of three main dimensions as inputs: primary participant
(e.g. students’ and instructors’ characteristics), instructional design (e.g. learning
model) and technology (e.g. quality, reliability and accessibility) as shown in Figure
2.9. All these dimensions individually and collectively influence the students’
learning process, and eventually affect the learning outcomes (Wan et al., 2007, p.
184). This model also stresses the importance of the mediating process, that is, the
internal psychological processes and the actual learning activities, while technology
is being used for learning.
Figure 2.9: Theoretical framework for technology-mediated learning (Wan et. al., 2007)
Primary Participant Student
Demographics Technology experience
Instructor Teaching style
Technology experience Availability
Technology Quality
Reliability Accessibility
Instructional Design Learning model
Instructional strategy Content
Method of interaction Class size/homogeneity
Learning process
Psychological Processes
Actual learning
activities
Learning outcomes
Psychomotor Efficiency/effectiveness
Accuracy Response magnitude
Cognitive Comprehension
Knowledge Application
Analysis Affective
Satisfaction Attitude
Appreciation

53
To summarize, the theoretical model of immersive VR-based learning by Salzman et
al. (1999) and most of the theoretical frameworks for technology-mediated learning
cover three main processes, that is, input, process and output. A summary of the
comparison between the model by Salzman et al. (1999) and other technology-
mediated frameworks is presented in Table 2.3. Almost all of them emphasize the
relevant independent variables such as the technology factor and student
characteristics, the mediating process such as the psychological learning experience,
and finally the output such as the learning outcomes. It is noted that some
technology-mediated frameworks illustrate the technology factor in terms of
technology features while others illustrate in terms of quality and accessibility which
is analogous to the interaction experience in the immersive VR model of Salzman et
al. (1999). Likewise, the emphasis on the psychological learning process in
technology-mediated learning is analogous to the learning experience in the model of
Salzman et al. (1999). Student characteristics are also emphasized in most of the
models as they could have some moderating effects on learning experience and
learning outcomes. A summary of the literature relevant to the factors vital to the
activities of desktop VR-based learning, and affecting the learning outcomes in
desktop VR-based learning, is presented in Table 2.4.

54
Table 2.3: Comparison between the immersive VR theoretical model by Salzman et al. (1999) and technology mediated models
Articles Technology
Features Interaction Experience
Learning Experience
Participant Dimension
Learning Outcomes
Salzman et al. (1999)
x x x x x
Alavi and Leidner (2001)
x x x
Piccoli et al. (2001)
x x x
Benbunan-Fich and Hiltz (2003)
x x x x
Sharda et al. (2004)
x x x x
Wan et al. (2007)
x x x x x
Table 2.4: Related references about the factors relevant to desktop VR-based learning
Authors Factors
Salzman et al. (1999) VR features, ease of use, motivation, immersion, spatial ability, gender, computer experience
Piccoli et al. (2001) Maturity, motivation, previous experience, constructivist, technology quality and reliability, learner control
Benbunan-Fich & Hiltz (2003)
Usability, technology reliability, motivation, active participation
Sharda et al. (2004) Usefulness, reliability, learning styles Wan et al. (2007) Technology quality and accessibility, learning model,
motivation, interest, cognitive structures (e.g. memory), active participation
Sun, Tsai, Finger, Chen & Yeh (2008)
Perceived usefulness, perceived ease of use
The literature review shows a lack of theoretical models or frameworks that
emphasize the relevant constructs and their causal relationships for a desktop VR-
based learning environment. In other words, there is a lack of greater depth of
research that emphasizes the mediating process to understand how desktop VR

55
enhances learning. Hence, the theoretical model for the immersive VR-based
learning environment by Salzman et al. (1999) is used as a starting point to develop a
conceptual framework for a desktop VR-based learning environment, which is
further supported by technology-mediated learning models. With such, a conceptual
framework that is based on an input, process and output metaphor that emphasizes
the psychology learning factors is developed in this study to guide the research
design for evaluating how desktop VR enhances learning. The framework consists
of the input factor, that is, technology factors and student characteristics. The
attributes, quality and accessibility of the technology are studied. Student
characteristics such as spatial abilities and learning styles are investigated as to how
they influence the learning. As for the process, the internal psychological learning
experience is investigated to provide evidence of what kind of learning experience is
enhanced by VR and how important the learning experience is in shaping the
learning outcomes. In addition, the interaction experience with desktop VR-based
learning is also investigated to determine how it influences the learning outcomes.
Finally, the learning outcomes are assessed in terms of cognitive and affective
domains. This conceptual framework does not emphasize the direct influence of VR
features on the learning outcomes, but emphasizes the mediating factors such as
interaction experience and learning experience as supported by the technology-
mediated models.
The results could show instructional designers and VR developers how to improve
the learning effectiveness and further strengthen their desktop VR-based learning
implementation. Furthermore, academia can use the findings of this study as a basis

56
to initiate other related studies in the desktop VR-based learning area. Apart from
telling educators and VR practitioners what has occurred, the findings also tell
educators and VR practitioners how learning occurs in a desktop VR-based learning
environment. A detailed description of the development of the conceptual framework
and model for evaluating a desktop VR-based learning environment is elaborated in
the next chapter.
2.7 Summary
This chapter provides a description of the various types of VR and their application
in instructional settings. In addition, the capability of VR technology to support the
constructivist learning model is discussed. Lastly, the theoretical foundation to
develop a framework that covers the relevant constructs and their interrelationships
to enhance learning with desktop VR was elaborated. A framework that emphasizes
the mediating process when using desktop VR technology would be developed
because this research would like to answer the call for a greater depth of research by
information system researchers to address the issue of “How can desktop VR
technology enhance learning outcomes?” apart from “Does desktop VR technology
influence learning outcomes?”
The findings of this study would contribute to the understanding of the learning
outcomes of a desktop VR-based learning environment and provide empirical
evidence of the merit (if any) of desktop VR-based learning to educators and policy
makers. Moreover, the ATI research would be beneficial to instructors to facilitate
individualized learning. It is hoped that the results of this study could create

57
awareness on the potential and/or weakness of the desktop VR technology for
educational purposes. Most importantly, the model developed would assist
instructional designers and VR software developers to leverage the desktop VR
technology to enhance learning.
58
Chapter 3
RESEARCH FRAMEWORK AND HYPOTHESES DEVELOPMENT
3.0 Overview
This chapter discusses the research framework employed in this study in order to
measure the effects of each different learning mode on learning and the moderating
effects of student characteristics on learning. The hypotheses concerned are also
discussed. Next, the development of the conceptual framework, model and
hypotheses for evaluating how desktop VR enhances the learning outcomes are
elaborated. A comprehensive framework that consists of relevant dimensions or
constructs and their interrelationships is developed to explain how desktop VR
improves and enhances the quality of student learning.
3.1 Framework for Determining the Effects of a Desktop VR-based Learning Environment and ATI Research The research framework shown in Figure 1.1 presents the variables for determining
the learning effectiveness of a desktop VR-based learning environment and the ATI
research (see p. 12). The independent variable is the learning mode which consists of
VR mode and Non-VR mode. A desktop VR-based learning environment is provided
to the VR mode whereas the Non-VR mode follows a conventional classroom
learning method. The VR mode supports the learning model of constructivism
because learners are active, able to control the learning pace and be responsible for
their learning, which follows a student-centric approach. Learners are actively

59
interpreting and constructing individual knowledge representations in the VR-based
learning environment. One the other hand, the Non-VR mode follows the objectivist
model which assumes the instructor is the source of knowledge to be transferred to
the learners. The instructor is in control of the material and the pace, with students
passively receiving facts and information. There are three dependent variables
which serve as the learning outcomes for the treatments given. They are performance
achievement, which is measured by the posttest score, perceived learning
effectiveness and satisfaction towards the teaching and learning approach. To
complete the ATI research, the effects of the moderator variables such as students’
spatial abilities and learning styles are investigated. In addition, the gain score
(posttest score minus pretest score) is used to investigate the overall improvement in
performance for students with different aptitudes in the VR mode.
3.2 Hypotheses for Determining the Effects of a Desktop VR-based Learning Environment and ATI Research To address research questions 1 to 6, and to achieve the objectives of this research as
described in Section 1.3, the following null hypotheses are developed.
H01: There is no significant difference in the performance achievement between
students in the VR mode and Non-VR mode.
H02: There is no significant difference in the perceived learning effectiveness
between students in the VR mode and Non-VR mode.
H03: There is no significant difference in the satisfaction between students in the
VR mode and Non-VR mode.
H04: There is no interaction effect between the learners’ spatial abilities and the
learning modes, related to the performance achievement.

60
H05: There is no interaction effect between the learners’ spatial abilities and the
learning modes, related to the perceived learning effectiveness.
H06: There is no interaction effect between the learners’ spatial abilities and the
learning modes, related to the satisfaction.
H07: There is no interaction effect between the learners’ learning styles and the
learning modes, related to the performance achievement.
H08: There is no interaction effect between the learners’ learning styles and the
learning modes, related to the perceived learning effectiveness.
H09: There is no interaction effect between the learners’ learning styles and the
learning modes, related to the satisfaction.
H10: There is no significant difference in the performance achievement for high
and low spatial ability learners in the VR mode.
H11: There is no significant difference in the perceived learning effectiveness for
high and low spatial ability learners in the VR mode.
H12: There is no significant difference in the satisfaction for high and low spatial
ability learners in the VR mode.
H13: There is no significant difference in the overall improvement in performance
for high and low spatial ability learners in the VR mode.
H14: There is no significant difference in the performance achievement for
accommodator learners and assimilator learners in the VR mode.
H15: There is no significant difference in the perceived learning effectiveness for
accommodator learners and assimilator learners in the VR mode.
H16: There is no significant difference in the satisfaction for accommodator
learners and assimilator learners in the VR mode.

61
H17: There is no significant difference in the overall improvement in performance
for accommodator learners and assimilator learners in the VR mode.
3.3 Framework and Model for Evaluating How Desktop VR Enhances Learning Outcomes Based on the literature search, several research frameworks were used to guide the
development of the conceptual framework for evaluating how desktop VR enhances
learning outcomes. In view of the scarcity of literature on the VR-based learning
model, models of technology-mediated learning were used to provide additional
support.
The model of Salzman et al. (1999) provides a starting point for the framework of
this study. The model of Salzman et al. (1999) is a comprehensive framework that
has identified the relevant dimensions and their relationships in achieving successful
learning outcomes in an immersive VR-based learning environment. Furthermore,
there is a convergence among the theoretical perspectives between the model
identified by Salzman et al. (1999) and the models of the technology-mediated
learning theory as explained in the previous chapter. Greater depth of research was
emphasized in some technology mediated models as there is a lack of studies that
consider the internal psychological process through which learning occurs (Alavi &
Leidner, 2001; Benbunan-Fich & Hiltz, 2003; Wan et al., 2007). Thus, the
framework for a desktop VR-based learning environment is supported by the
technology-mediated learning models and it focuses on the input, process and output
factors as elaborated in the previous chapter. With such, a conceptual framework of
the outcomes and their causal relationships in a desktop VR-based learning

62
environment as shown in Figure 1.2 is developed (see p. 12). The input factors that
could affect the interaction and learning experience, which in turn would affect the
learning outcomes in this study, are VR technology, that is, the VR features as
measured by representational fidelity and immediacy of control as the independent
variables. Student characteristics such as spatial abilities and learning styles are the
moderator variables which would strengthen or weaken the relationships between
variables.
The mediating processes comprise interaction and learning experiences. Both
interaction experience and learning experience are the mediating variables that
influence the learning outcomes. Some key process variables that act as the mediator
variables would be investigated to explain how learning outcomes come about.
These mediator variables are conceptualized as leading to the presence or absence of
the desired learning outcomes (Benbunan-Fich & Hiltz, 2003). For interaction
experience, usability as measured by perceived usefulness and perceived ease of use
is studied in this research, whereas for learning experience, psychological factors
consisting of presence, motivation, cognitive benefits, control and active learning,
and reflective thinking are investigated. As mentioned by Yaman, Nerdel &
Bayrhuber (2008), the impact of learners’ psychological perspective on their learning
has hardly been studied in computer simulation-based learning. Finally, the
effectiveness of the VR-based learning environment is measured in terms of
cognitive domain through performance achievement as measured by the posttest, and
affective domain through the students’ perceived learning effectiveness and
63
satisfaction with the learning environment. Hence, the dependent variables are
performance achievement, perceived learning effectiveness and satisfaction.
Based on the conceptual framework of desktop VR-based learning, a model is
developed for evaluating how VR enhances the learning outcomes as shown in
Figure 3.1. The fit of the hypothesized model is assessed using SEM. This model
addresses the constructs and their causal relationships. The hypothesized model
consists of the constructs or latent variables of (1) VR features which are measured
by representational fidelity and immediacy of control; (2) usability which is
measured by perceived usefulness and perceived ease of use; (3) presence; (4)
motivation; (5) cognitive benefits; (6) control and active learning; (7) reflective
thinking; and (8) learning outcomes which are measured by performance
achievement, perceived learning effectiveness and satisfaction. This study focuses
on a greater depth of research by investigating the individual effect of the
psychological factors on learning with VR technology; therefore, they are not
collectively grouped under the construct of learning experience. As a result, this
model can help make an opaque construct (i.e. all psychological factors were to be
considered together as a single construct) more transparent (i.e. the effects of each
psychological factor are more apparent), and thus produces important implications
and insights. The relevance of the constructs and measurement variables are
described below.

64
Notes: REP = Presentational fidelity; IMM = Immediacy of control; USE = Perceived usefulness; EASE = Ease of use; PERF = Performance achievement; PERC = Perceived learning effectiveness; SAT = Satisfaction
Figure 3.1: Model for evaluating how desktop VR enhances learning outcomes
3.3.1 VR Features Technology quality is an important determinant of learning effectiveness (Arbaugh
& Duray, 2002; Marks, Sibley, & Arbaugh, 2005; Webster & Hackley, 1997). Some
technologies are best suited to support specific theoretical learning models (Leidner
& Jarvenpaa, 1995). Technology itself does not produce desired learning outcomes,
but it facilitates intentional changes in teaching and learning processes and so
operates as an enabler (Leidner & Jarvenpaa, 1995). Technologies influence learning
by providing support to the underlying psychological processes of learning such as
the learner’s cognitive and information processing activities, motivation and interest
(Alavi & Leidner, 2001). Similarly, Jonassen et al. (1999) mentioned that the role of
technologies in learning is indirect. For instance, they can simulate and support
REP
IMM
USE
EASE
PERF
PERC
SAT
VR Features
Usability
Presence
Motivation
Cognitive Benefits
Control & Active
Reflective Thinking
Learning Outcomes

65
activities that engage learners in thinking, and thinking mediates learning. Hence,
learners do not learn directly from the technology; they learn from thinking what
they are doing. In other words, technologies can foster and support learning, if they
are used as tools and intellectual partners that motivate learners to learn, engage and
involve learners in the learning activities, help learners to construct, understand and
apply new knowledge, and help learners to think.
In this study, it was hypothesized that the quality of the VR features have an indirect
effect on the learning outcomes which are mediated by the interaction experience
and learning experience as supported by Salzman et al. (1999). In other words, the
qualities of the medium are regarded as determinants of the interaction experience
(e.g. usability) and learning experience (e.g. the psychological state and experience
of a learner as being physically located in a mediated space). Factors that influence
the interaction experience and the learning experience are realism factors, the degree
of realism of the objects or scenarios portrayed in the virtual environment; and
control factors, the amount of control the user had on activities and events in the
virtual environment (Witmer & Singer, 1998). The desktop VR features in this study
are thus measured by representational fidelity (scene realism) and immediacy of
control.
Representation fidelity is the degree of realism provided by the rendered 3-D images
and scene content; the degree of realism provided by temporal changes to these
images such as the motion of the objects that appears smooth enough to provide a
very high degree of realism; and the degree to which objects behave in a realistic

66
way or in a way consistent with the ideas being modeled (Dalgarno et al., 2002). In
short, representation fidelity refers to the connectedness and continuity of the stimuli
being experienced (Witmer & Singer, 1998, p. 230).
Immediacy of control refers to the ability to change the view position or direction,
giving the impression of smooth movement through the environment, and the ability
to pick up, examine and manipulate objects within the virtual environment (Dalgarno
et al., 2002). The consequences of the user’s action should be appropriately obvious
and apparent to the user to afford expected continuities (McGreevy, 1992).
3.3.2 Usability Based on the model of Salzman et al. (1999), VR features are the antecedents to
interaction experience. Interaction experience in the framework refers to the user’s
observation and interaction with the technology provided with regard to the aspect of
quality and accessibility. The issue that learning outcomes are dependent on the
technology quality and accessibility is highlighted in the model of Salzman et al.
(1999) and the model of technology-mediated learning (Alavi & Leidner 2001;
Piccoli et al., 2001; Benbunan-Fich & Hiltz, 2003; Sharda et al., 2004; Wan et al.,
2007). Moreover, it is important to recognize that a virtual learning environment
with a high degree of fidelity and user control, modeled on a real world system, will
not necessarily facilitate the development of conceptual understanding (Dalgarno et
al., 2002). Thus, an appropriate set of learning tasks needs to be designed, with
appropriate task support that is deemed to be useful and easy to use by the learners
(Dalgarno et al., 2002). This is to ensure that the learning activities that the learners
67
undertake while exploring and interacting with the learning environment do actually
require them to develop such an understanding of the learning contents (Dalgarno et
al., 2002).
Given the relative newness of VR-based learning in the school setting, theoretical
perspectives of technology adoption seem appropriate for predicting student learning
and satisfaction. Davis (1989) theorizes the widely accepted TAM in examining the
acceptance of new information technology. TAM was adapted from the Theory of
Reasoned Action (TRA) model, and posited that two beliefs, perceived ease of use
and perceived usefulness, to determine one’s intention to use a technology.
According to Davis (1989, p. 322), the information technology quality measured by
Swanson (1987) which covered items such as “important”, “relevant”, “useful” and
“valuable” is parallel to perceived usefulness, while accessibility items such as
“convenient”, “controllable”, “easy”, and “unburdensome” correspond to perceived
ease of use.
Therefore, in this study, the quality and accessibility of the desktop VR technology
are measured by the perceived usefulness and perceived ease of use, and are
collectively grouped as the construct of usability. TAM identifies perceived
usefulness as the degree of work improvement after adoption of a system, whereas
perceived ease of use is the users’ perception of ease of adopting a system. Applying
this model to desktop VR-based learning, the presumption is the more learners
perceive usefulness and ease of use in the instructional delivery media, the more
positive their attitudes when interacting with the VR learning system, consequently

68
improving their learning experience and learning outcomes (Arbaugh & Duray,
2002; Sun et al., 2008). A sizable amount of literature has demonstrated the
empirical validity of the TAM instrument on new software packages (Adams,
Nelson, & Todd, 1992; Hendrickson, Massey, & Cronan, 1993; Szajna, 1994).
3.3.3 Presence
Presence refers to the user’s subjective psychological response to a system (Bowman
& McMahan, 2007). It is the psychological sense of “being there” in the
environment generated by the system. Users tend to behave as if they are in the real
life situation though cognitively they know they are not. A key result of presence is
that a person recalls the virtual environment experience as if recalling a visit to a
place rather than a set of images and pictures (Schuemie et al., 2001; Usoh, Alberto,
& Slater, 1996). According to Dalgarno et al., (2002), the sense of presence in a 3-D
environment occurs as a consequence of the fidelity of representation and the high
degree of interaction or user control, rather than just a unique attribute of the
environment.
Slater (2003) mentioned that presence is a human reaction to immersion. It is the
response to a given level of immersion. Different people may experience different
levels of presence for the same system (Bowman & McMahan, 2007; Slater, 2003).
This internal psychological process of the users in a virtual environment determines
the extent to which they will be compelled by what they see, hear and feel and thus
become immersed into the virtual world (Usoh et al., 1996). Furthermore, it may
influence the learning outcomes of an individual (Salzman et al., 1999).

69
However, there were some inconsistent results reported on the relationship between
presence and performance. Mania and Chalmers (2000) found that there was no
correlation between presence and task performance in an empirical study with three
conditions: lectures on a specific topic in the real world, in a virtual classroom, and
an auditory-only environment. However, in a study using infomercials on television,
Kim and Biocca (1997) found a weak but significant correlation between presence
and performance in terms of factual memory and average recognition speed for
recognizing stills from the infomercial. In a recent study, Ma and Kaber (2006) did
not find any correlation between presence experiences and performance. In actual
fact, empirical evidence to support the pervasive belief that presence is causally
related to performance is still limited.
Generally, the more immersive a virtual environment is, the greater sense of
presence users tend to experience in it (Schuemie et al., 2001). However, recently
there was a debate that the low-immersion systems, such as desktop VR, are capable
of providing high-presence experience to users (Nunez, 2004). High quality and
high resolution information, interaction with the virtual environment, and anticipated
effect of action in the virtual environment are some of the factors that contribute to
presence (Slater & Usoh, 1994). This study is thus interested to gain a better
understanding of this psychological factor underlying an experience in VR.
3.3.4 Motivation
Motivation refers to the magnitude and direction of behavior. It is the choices
people make as to what experiences or goals they will approach or avoid, and the

70
degree of effort they will exert in that respect (Keller, 1983, p. 389). Research on
this psychological response to a desktop system is to date rare. This learning
experience could have an effect on learning effectiveness as posited by many
researchers (Alavi & Leidner, 2001; Benbunan-Fich & Hiltz, 2003; Piccoli et al.,
2001; Salzman et al., 1999; Wan et al., 2007).
It is believed that student motivation influences student performances in school
which include attention, effort, quality, behavior, test scores, and grades (Hardré &
Sullivan, 2008; Linnenbrink & Pintrich, 2002). Educational psychology studies have
also shown a positive correlation between intrinsic motivation and academic
achievement (Wilbourne, 2006). Intrinsic motivation occurs when the learning
activities and learning environment elicit motivation in the students; intrinsic
motivation behaviors are those that are freely engaged out of interest and do not
depend on reinforcements, for example, rewards (Deci & Ryan, 2000). To maintain
those behaviors, they require satisfaction of basic psychological needs such as
autonomy and competence (Deci & Ryan, 2000).
Student motivation is a potentially important but understudied factor in the VR-
based learning environment. According to Rezabek (1995), the study of motivation
has long been neglected in instructional technology. This is supported by Yaman et
al. (2008) who stated that the impact of the learner’s motivational perspective on its
learning effects has hardly been studied though the effectiveness of a multimedia-
based learning environment is greatly influenced by student motivation.

71
The reason is instructional designers assume that good quality instruction will be
motivating (Keller, 1983). However, Rezabek (1995, p. 479) mentioned that
“motivation is such a crucial issue in education that simple assumptions are not
sufficient”. Using computer-based instruction, research by Rezabek (1995)
confirmed that intrinsic motivation has an effect on learning effectiveness and
achievement. Virvou, Katsionis, and Manos (2005) compared a virtual reality game
named VR-ENGAGE with educational software without a gaming aspect, for
learning primary school geography. Results show that the VR game is motivating
and it influences students’ behavior in learning and also helps students to retain or
improve their performance.
One of the assumptions of the currently accepted social cognitive motivational
theories is that motivation is situated and contextualized (Linnenbrink & Pintrich,
2002). It is not an individual’s stable trait but is inherently changeable and sensitive
to context. Thus, instructional efforts can make a difference in motivating students to
learn because motivation can vary depending on the situation and context of learning
(Linnenbrink & Pintrich, 2002). Therefore, based on the features of VR such as 3-D
dimension, dynamic display, closed-loop interaction where users have control over
the contents viewed or visited, motivational value is one of the justifications cited for
using VR for learning (McLellan, 2004). Moreover, learning objectives are more
transparent in the VR-based learning environment because it is able to help students
to identify the learning objectives as well as the central issues of the learning topic.
With such, the VR-based learning environment is able to increase student motivation
for learning, which in turn influences the learning outcomes.

72
3.3.5 Cognitive Benefits Antonietti, Rasi, Imperio, and Sacco (2000) have also identified cognitive benefits
as one of the psychological correlates in the study of students’ representation of
using VR in instruction. Cognitive benefits refer to better memorization,
understanding, application and overall view of the lesson learned. In the six levels of
Bloom’s taxonomy, memorization is synonymous with the knowledge level which
emphasizes the ability to recall facts, terms or definitions, while understanding,
application and overall view involve the remaining five levels of Bloom’s taxonomy.
Bell & Fogler (1997, p. 3) asserted that VR provides an environment in which
students can exercise the higher levels of Bloom’s taxonomy in a manner totally
unique from other educational methods. This is because in the VR-based learning
environment, students have the freedom to explore, and view the environment from
any vantage point desired. Thus, it allows them to analyze their problems and
evaluate possible alternatives in ways that were impossible before (Bell & Fogler,
1997). Furthermore, through the interactive dynamic visualizations, students could
adapt a presentation’s pace and sequence to their own cognitive needs and skills for
better comprehension and assimilation of the knowledge learned (Schwan &
Riempp, 2004).
VR is also capable of affording constructivist learning, which is a relatively new
paradigm of instructional design. Constructivist learning focuses on helping learners
to construct and build on their own new knowledge, based on their prior experiences
and knowledge. This is mainly because in VR-based learning, learners are active
73
participants in a computer-generated world. They can navigate and manipulate the
virtual object in the virtual world, and the interaction is observed by learners in real
time. Therefore, VR is not only well-suited for providing exploratory learning
environments in which learners learn through experimentation, it is also able to
support situated learning where learners learn in the actual context where the
learning is to be applied (Chen, 2005; Kim et al., 2001). These interactive learning
activities may help to develop learners’ higher order thinking skills. Leidner and
Jarvenpaa (1995) stated that technology that promotes interaction can be effectively
used to develop higher-order thinking skills and build conceptual knowledge.
Hence, the cognitive benefits gained through VR technology could lead to better
learning outcomes.
3.3.6 Control and Active Learning Control and active learning, which is akin to involvement, is a psychological state
experienced as a consequence of focusing one’s attention on a coherent set of related
activities and stimuli (Schuemie et al., 2001). Theorists and researchers have
suggested that some degree of learner control is important in a learning process
because students may better learn how to learn through making instructional choices
and may feel more motivated to learn, which in turn results in better performance
(Kinzie et al., 1988).
According to Williams (1996), learner control refers to “instructional designs where
learners make their own decisions concerning the learning path, flow, or events of
instruction”. Elements that can be controlled include learning pace, sequencing,

74
content of instruction, and amount of practice in a learning environment (Kinzie et
al., 1988; Milheim & Martin, 1991). With total internal control by the learners,
learners can better learn how to learn because they make their own instructional
decisions, experience and are responsible for the consequences and results of those
decisions, and in the process discover the best tactics for different situations (Merrill
1975). Consequently, learners are actively involved in the learning process and may
feel more competent, self-determining, and intrinsically more interested in learning
(Lepper, 1985).
Many studies have reported positive correlations between perceptions of control and
achievement performance (Stipek & Weisz, 1981). Performance is measured in
terms of lower error tests and higher learning satisfaction (Merrill, 1994). However,
the superiority of learner control in learning remains inconclusive (Kinzie et al.,
1988; Williams, 1996). Other researchers have shown that learners with instructional
control decisions do not learn as effectively as those who do not have control over
their learning. According to Kinzie et al. (1988), these different results may be a
function of the degree and type of learner control given. Since individuals vary in
their ability to make progress in learning, some may view less material and skip
important instructional components, thus learner control should be accompanied by
aids for self-monitoring of progress (Kinzie et al., 1988; Milheim & Martin, 1991:
Williams, 1996). In this study, self-monitoring of progress is done through
laboratory reports that come together with the desktop VR software.

75
Research has found that computer-simulated experiments permit more active student
involvement in the learning process and thus leads to greater understanding of
science concepts (Choi & Gennaro, 1987; Rivers & Vockell, 1987; Yang & Heh,
2007). This is in agreement with the principle of constructivism that the more
opportunity for active learning, the more positive results the students would gain
(Roblyer, 2003; Yang & Heh, 2007). The preliminary study of Jang, Jyung and
Black (2007) revealed that active learner control in rotating the 3-D structures
enhances a learner’s internal representation of a complex structure. However,
research by Keehner and Khooshabeh (2002) showed that active learning does not
contribute to improvement in performance in drawing tasks. In their studies, active
learning is provided where students can rotate a 3-D visualization freely during the
drawing task. Thus, more research is needed to acknowledge the inconsistency in
empirical studies.
VR technology can provide multisensory and interactive experiences to enhance
learning. Learners control their own learning pace and are actively involved in the
learning activities. These interactions can be as good, or better, than traditional
classroom lectures.
3.3.7 Reflective Thinking To achieve meaningful learning and to support constructivist learning principles,
learners must reflect on their learning activities and observations to learn the lessons.
According to Jonassen et al. (1999, p. 9),
New experiences often create a discrepancy between what learners observe and what they understand. They are curious about or puzzled by what they

76
see. That puzzlement is the catalyst for meaning making. By reflecting on the puzzling experience, learners integrate new experiences with their prior knowledge, or they establish goals for what they need to learn in order to make sense out of what they observe.
Research on reflective thinking in the context of a desktop VR-based environment is
limited. Reflection is beneficial in the learning process as it enables students to think
critically about their own learning (Phan, 2007), and to explore their experiences in a
conscious manner that leads to a new understanding. Dewey (1933, p. 9) defined
reflective thinking as “active, persistent, and careful consideration of any belief or
supposed form of knowledge in the light of the grounds that support it and the
conclusion to which it tends.” According to Dewey (1933, p. 12), “reflective
thinking involves (1) a state of doubt, hesitation, perplexity, mental difficulty, in
which thinking originates, and (2) an act of searching, hunting, inquiring, to find
material that will resolve the doubt, settle and dispose of the perplexity.”
Mezirow (1991; 1998) theorized four stages of reflective thinking which include:
habitual action, understanding, reflection, and critical reflection. Habitual action is
activity that has been learned before and carried out frequently until it becomes a
routine procedure which is performed automatically with little conscious thought.
Understanding means comprehending without relating to other situations. Reflection
is active, persistent, and careful consideration of any beliefs grounded in
consciousness. The understood concepts are associated with related personal
meaning and experience. Finally, critical reflection is considered as a higher level of
reflective thinking that involves individuals becoming more aware of how they
perceive things, think, feel, or act as they do, and it may result in a change of
personal belief (Leung & Kember, 2003).

77
Research has shown that a surface approach to learning—that is, studying merely for
the intention of reproducing information without any attempt to understand the
contents acquired—is aligned with habitual action, whereas a deep approach to
learning, which entails an intention to understand meaning and link it to previous
knowledge and personal experience so as to construct new knowledge, is aligned to
reflective thinking (Leung & Kember, 2003; Phan, 2007).
Empirical findings show that reflective thinking is predictive of performance
outcomes if the learning objectives are aligned closely to assessment tasks (Phan,
2007). It is the interest of this study to investigate whether the VR-based learning
environment engages learners in some form of reflective thinking, such as the
understanding and reflection advocated by Mezirow (1991, 1998), that promotes
deep learning, which is consistent with the constructivist approach of learning; in
addition, to investigate if reflective thinking leads to greater perceived learning
effectiveness and satisfaction.
3.3.8 Learning Outcomes A central purpose of learning is to acquire knowledge and increase the capability to
take effective action. However, knowledge is implicitly constructed in the mind of
the learners and that knowledge and capability cannot be directly measured; only the
action and performance resulting from learning can be observed and measured
(Alavi & Leidner, 2001). Sharda et al. (2004) have classified learning outcomes into
three groups: psychomotor outcomes, cognitive outcomes, and affective outcomes.

78
Psychomotor outcomes include efficiency, accuracy and response magnitude.
Cognition outcomes include comprehension, knowledge, application and analysis
based on Bloom’s taxanomy. Affective outcomes include students’ perceptions of
satisfaction, attitude and appreciation for the learning experience (Sharda et al.,
2004). Indeed, research suggests that technology-mediated learning environments
may improve students’ achievements (Alavi, 1994; Hiltz, 1995; Maki, Maki,
Patterson, & Whittaker, 2000; Schutte, 1997; Wetzel, Radtke, & Stern, 1994), their
attitudes toward learning (Schutte, 1997), and their evaluation of the learning
experience (Alavi, 1994; Hiltz, 1995). This study focuses on two domains, that is,
the cognitive domain in terms of performance achievement, and the affective domain
in terms of perceived learning effectiveness and satisfaction with the desktop VR-
based learning environment.
3.3.9 Student Characteristics Students are the primary participants in any learning environment (Piccoli et al.,
2001). Students are generally comfortable with the traditional classroom learning
environment. The VR-based learning environment departs noticeably from this
dominant model as the students control, and are responsible for, their learning with
the use of VR technology. Educators usually expect students to learn effectively with
a new technology in a short time; however, because of individual differences, several
factors could affect the final achievement (Wen & Hsu, 2000).
Student factors that could affect the learning outcomes include demographics (e.g.
age and gender), language, communication skills, learning styles, spatial abilities,

79
problem solving styles or prior knowledge and attitudes toward technology,
cognitive styles, cognitive needs, computer anxiety and technology experience
(Arbaugh & Duray, 2002; Lee, Hong, & Ling, 2001; Piccoli et al., 2001; Wen &
Hsu, 2000). It was reported in the ScienceSpace project of Salzman et al. (1999) that
individual differences have affected the students’ abilities to interact with the virtual
learning environment.
The influence of two individual learner characteristics, spatial abilities and learning
styles, on learning outcomes was investigated in this study. These student
characteristics may influence the perception towards VR technology and may serve
to moderate the relationship between the learning experience and the learning
outcomes, as advocated by Salzman et al. (1999).
3.4 Hypotheses for Evaluating How Desktop VR Enhances Learning Outcomes
Based on the hypothesized theoretical model, the following hypotheses were thus
developed to answer research questions 7 and 8, that is, (7) What are the constructs
that play an important role in a desktop VR-based learning environment? and (8)
How do these constructs interrelate to enhance the VR-based learning effectiveness?
Figure 3.2 represents the hypothesized relationships in the model.
Hypotheses for the Relationships between Constructs
H1: VR features are significantly related to usability.
H2: VR features are significantly related to presence.
H3: VR features are significantly related to motivation.
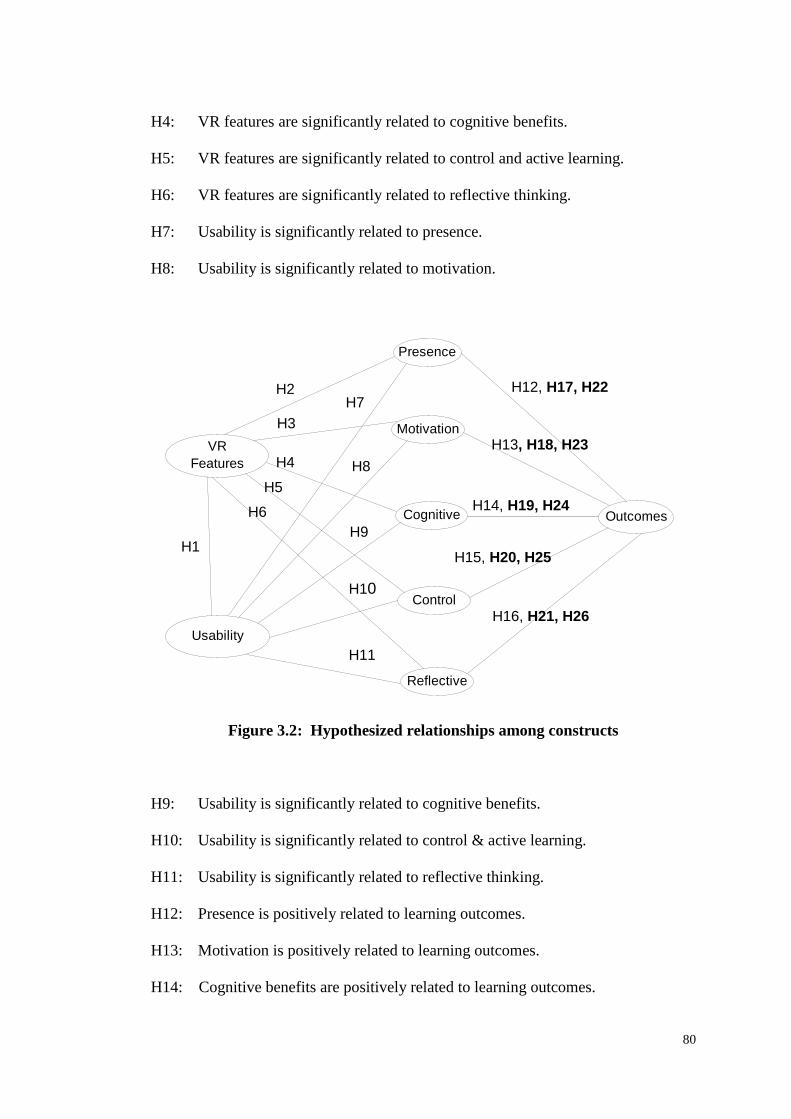
80
H4: VR features are significantly related to cognitive benefits.
H5: VR features are significantly related to control and active learning.
H6: VR features are significantly related to reflective thinking.
H7: Usability is significantly related to presence.
H8: Usability is significantly related to motivation.
Figure 3.2: Hypothesized relationships among constructs
H9: Usability is significantly related to cognitive benefits.
H10: Usability is significantly related to control & active learning.
H11: Usability is significantly related to reflective thinking.
H12: Presence is positively related to learning outcomes.
H13: Motivation is positively related to learning outcomes.
H14: Cognitive benefits are positively related to learning outcomes.
VRFeatures
Outcomes
Usability
Presence
Motivation
Cognitive
Control
Reflective
H1
H2
H3
H4
H5
H6
H7
H8
H9
H10
H11
H12, H17, H22
H13, H18, H23
H14, H19, H24
H15, H20, H25
H16, H21, H26

81
H15: Control and active learning is positively related to learning outcomes.
H16: Reflective thinking is positively related to learning outcomes.
Hypotheses for the Moderating Effect of Student Characteristics
H17: Spatial ability moderates the influence of presence on learning outcomes.
H18: Spatial ability moderates the influence of motivation on learning outcomes.
H19: Spatial ability moderates the influence of cognitive benefits on learning
outcomes.
H20: Spatial ability moderates the influence of control and active learning on
learning outcomes.
H21: Spatial ability moderates the influence of reflective thinking on learning
outcomes.
H22: Learning style moderates the influence of presence on learning outcomes.
H23: Learning style moderates the influence of motivation on learning outcomes.
H24: Learning style moderates the influence of cognitive benefits on learning
outcomes.
H25: Learning style moderates the influence of control and active learning on
learning outcomes.
H26: Learning style moderates the influence of reflective thinking on learning
outcomes.
Hypotheses for Latent Mean Testing
Based on the measurement models, further analysis was conducted to determine the
latent mean differences in the perception of the technical features afforded by the

82
desktop VR technology by learners with different spatial abilities and learning styles.
Thus, the following two hypotheses were developed for this purpose.
H27: Spatial ability influences the perception of VR features.
H28: Learning style influences the perception of VR features
3.5 Summary
There are two main purposes in this research: to investigate the learning
effectiveness of a desktop VR-based learning environment as compared to the
conventional classroom learning method; and to develop a framework and
subsequently a model to evaluate how VR enhances the learning outcomes. The
research frameworks that guide this study are presented as well as the hypotheses. In
addition, the constructs of the hypothesized model to evaluate how desktop VR
enhances the learning outcomes are also elaborated in detail before the hypotheses
are discussed.

83
Chapter 4
METHODOLOGY
4.0 Overview
This chapter describes the research methodology adopted in this study. The chapter
starts with the description of the research design. It continues on with the description
of the population and sample. Next, it includes a detailed explanation of the
instruments development, the software used, the data collection procedures and the
data analysis techniques. In addition, a description of SEM which is used to test the
model is provided. This chapter further explains the approach of using SEM which
includes the measurement development models and structural model evaluation. It
also elaborates the strategy used to investigate the moderating effects of student
characteristics on the model. Finally, it concludes with the findings of the pilot
study.
4.1 Research Design A two-group pretest-posttest experimental design was employed in this study. The
permission from the education department and school administrators, the willingness
of teachers and students, and the computer system facilities in schools were all
prerequisites required to execute this study. As the class organization could not be
reorganized due to the fact that the students could only be allowed to participate in
the experiment at certain times during the school hours, the pretest-posttest quasi-
experimental design was employed to establish a cause-effect relationship between

84
the interventions and learning outcomes. This design involved an experimental
group (VR mode) and a control group (Non-VR mode). The experimental group
used desktop VR software for the lesson while the control group followed a
conventional classroom learning method with PowerPoint slides (see Figure 4.1).
Both the experiment and control groups constituted randomly selected intact classes
from the randomly selected schools.
Figure 4.1: Two-group pretest-posttest quasi-experimental design
To minimize the learning content differences in the two learning modes, PowerPoint
slides were used to deliver similar contents with texts and colored pictures as in the
desktop VR software, but with no animations and interaction. PowerPoint slides also
help to minimize the teaching capability differences of teachers from different
classes and different schools in the Non-VR mode because the content and flow of
the presentation could be kept as similar as possible. Furthermore, PowerPoint slides
are a common teaching aid used by teachers in secondary classrooms, and real frog
dissection is not compulsory for the Form Four biology syllabus where the study was
conducted.
Experimental Group
Control Group
Pretest & Questionnaire
Desktop VR PowerPoint Slides
Posttest & Questionnaire

85
In addition, factorial design was used to investigate the interaction of the
independent variables with one or more other variables, known as moderator
variables (Fraenkel & Wallen, 1996). A 2 x 2 quasi-experimental factorial design
was used in which learning modes were crossed with the spatial abilities of the
learners (see Figure 4.2). The same method was used to determine the interaction
effect of learning modes and learning styles (see Figure 4.3).
VR Mode
Non-VR Mode
Low High
Figure 4.2: The factorial design to study the effects of learning mode and spatial ability on posttest score, perceived learning effectiveness and satisfaction
VR Mode
Non-VR Mode
Accommodator Assimilator
Figure 4.3: The factorial design to study the effects of learning mode and learning style on posttest score, perceived learning effectiveness and satisfaction
4.2 Population and Sample The population for this study was senior high school science stream students, aged
between 15 and 17 years old of any co-education secondary school in a city of East
Malaysia. They were Form Four students in the Malaysian education system. These
Spatial Ability
Learning Mode
Learning Style
Learning Mode

86
students were chosen because they were within the target population as they have
started to take a biology unit in Form Four.
A list of secondary schools in the city that fulfilled criteria such as (a) co-education,
and (b) well-equipped with multimedia computer laboratories, was formed. Four
secondary schools were first selected from the list using the simple random method.
For each selected school, two to four intact classes were randomly chosen using the
simple random method to take part in the experiment. These selected classes were
then randomly assigned to either experimental (VR mode) or control groups (Non-
VR mode).
4.3 Development of the Measurement Instruments Altogether there were five sets of questions that the participants needed to answer.
These included the pretest, posttest, spatial ability test, initial questionnaire (pre-
experiment questionnaire) which comprised some demographic information of the
participants and their learning styles, and a final questionnaire (post-experiment
questionnaire). A summary of the measurement instruments used before and after the
treatment is shown in Table 4.1. The instruments developed were attached in
Appendix C to Appendix F.
The final questionnaire composed of a combination of five-point Likert-scaled items
and open-ended questions (for the VR mode). The assessed domains of the final
questionnaire included background information and affective learning outcomes
(perceived learning effectiveness and satisfaction). For the VR learning mode, the

87
final questionnaire also included the assessed domains of interaction experience
(perceived usefulness and perceived ease of use), learning experience (presence,
motivation, cognitive benefits, control and active learning, and reflective thinking),
VR features (representational fidelity and immediacy of control), and the potential
use of the VR computer program. After the treatment, a few students were also
randomly selected from the VR learning mode to provide some qualitative feedback
during debriefing sessions.
Table 4.1: Measurement instruments for various stages of treatment
Stage Measurement Instruments Before Treatment - Posttest
- Spatial Ability Test - Initial Questionnaire
• Demographic information • Learning style inventory
After Treatment - Posttest - Final Questionnaire
• Background information • Perceived learning effectiveness • Satisfaction • Representation fidelity* • Immediacy of control* • Perceived usefulness* • Perceived ease of use* • Presence* • Motivation* • Cognitive benefits* • Control and active learning* • Reflective thinking* • Potential use of VR* (Open-
ended questions) Note: * for VR learning mode
A five-point Likert scale ranging from (1) Strongly Disagree to (5) Strongly Agree
was used for all scaled items in the final questionnaire, that is, perceived learning
effectiveness, satisfaction, representational fidelity, immediacy of control, perceived

88
usefulness, perceived ease of use, presence, motivation, cognitive benefits, control
and active learning, and reflective thinking. For all of these variables, an individual’s
score on the scale was conducted by taking the mean of all items that comprised the
scale. A high score on the scale meant a positive result was obtained. The higher
the score, the better the result was. Before the mean scores of all items were
calculated and formed into a single composite measure for these variables, the
reliability and the unidimensionality of all items in the scale that measured these
variables were determined. Cronbach’s alpha was used to determine the internal
consistency reliability of the scale, that is, the consistency of the scale or the degree
to which the items that make up the scale are all measuring the same underlying
attribute (Kumar, 2005; Pallant, 2007). Factor analysis was used to determine the
unidimensionality of the items, meaning that they are strongly associated with each
other and represent a single concept (Hair et al., 2006; Hattie, 1985; McDonald,
1981).
The following describes the development of each measurement instrument for this
study.
4.3.1 Pretest and Posttest
Both pretest and posttest were similar in content but the order of questions was
different to avoid the set response effect. Some 38 questions regarding frog anatomy
for the modules covered in this study were developed to test the students’ knowledge
on this subject. Students were required to complete the sentences with the correct
word(s), to label and draw the organs, and to answer multiple-choice questions.
89
4.3.1.1 Scoring
The total score for the test was 38 marks. One mark was given to each correct
answer and zero to each incorrect answer. For questions that required the students to
draw the organs, one full mark was given if the position and shape of the organs
were correctly shown. The total score was then converted to a percentage score.
4.3.1.2 Test Validity
Content validity of these tests was determined by expert judgment. Three subject
matter experts were requested to review the test questions and make a judgment
about how well these items represent the intended content area. These three subject
matter experts were biology teachers in the city where the study was conducted.
Comments from the subject matter experts were taken into consideration before the
test was used for the pilot study.
4.3.1.3 Test Reliability
A pilot study was carried out after the questions were validated. Item analysis was
carried out to obtain two types of information to improve the tests. These included
the item difficulty index and item discrimination index. The item difficulty index is
the proportion of students who answered an item correctly, whereas the item
discrimination index measures how adequately an item discriminates between high
scorers and low scorers on an entire test (Cohen, Swerdlik, & Philips, 1996). The
reliability of the test was estimated with Cronbach’s alpha coefficient.

90
4.3.2 Kolb Learning Style Inventory
The Kolb Learning Style Inventory Version 3.1 (KLSI 3.1) was used to categorize
the learning style of each participant into either assimilator learner or accommodator
learner (Kolb, 2007). Each participant needs to complete 12 sentences that describe
learning. Each item has four endings and the participant is required to rank the
endings for each sentence according to how well he or she thinks each ending
describes the way he or she learned.
Based on the Learning Style Inventory scoring, the scores for each learning phase,
AC, CE, AE and RO, were first obtained for each participant. Subsequently, the CE
score was subtracted from the AC scores, and the RO score was subtracted from the
AE scores to have two combination scores. These two combination scores were then
put on the Learning Style Type Grid to determine the participant’s learning style,
that is, accommodator, assimilator, diverger or converger (see Figure 2.3, p. 40). On
the Grid, accommodator falls on the top left quadrant; diverger falls on the top right
quadrant; converger falls on the bottom left quadrant; and assimilator falls on the
bottom right quadrant.
However, for this study, based on the method of Chen et al. (2005), a dashed
diagonal line was introduced to equally separate the grid into two halves as shown in
Figure 4.4. Based on this diagonal line, any diverger learner or converger learner
with the two combination scores that fell below the diagonal line was classified as an
assimilator learner. Likewise, if the two combination scores fell above the diagonal
line, the participant was classified as an accommodator learner. Thus, assimilator

91
included learners who fulfilled Kolb’s definition of assimilator, diverger learners
with stronger Kolb’s characteristics of RO than CE, and converger learners with
stronger Kolb’s characteristics of AC than AE (Chen et al., 2005). On the other
hand, accommodator included learners who fulfilled Kolb’s definition of
accommodator, diverger learners with stronger Kolb’s characteristic of CE than RO,
and converger learners with stronger Kolb’s characteristic of AE than AC (Chen et
al., 2005).
Figure 4.4: Kolb’s learning styles (Adapted from Kolb, 1984)
Several studies have shown that KLSI 3.1 has good internal consistency reliability
across a number of different populations (Kolb & Kolb, 2005). Table 4.2 shows the
Cronbach’s alpha coefficients for five different studies for the randomized KLSI 3.1:
the norm subsample of online LSI users, Kayes’s (2005) study of liberal arts college
students, Wierstra and DeJong’s (2002) study of psychology undergraduates, and
two studies by Ruble and Stout (1990; 1991) of business students.
Reflective Observation (RO) (Watching)
Concrete Experience (CE) (Feeling)
Active Experimentation (AE) (Doing)
Abstract Conceptualization (AC) (Thinking)
Accommodator Diverger
Converger Assimilator

92
Table 4.2: Internal consistency alphas for the scale scores of the KLSI 3.1 (Kolb & Kolb, 2005)
Source N CE RO AC AE AC-CE AC-RO
Online Sample
5023 0.77 0.81 0.84 0.80 0.82 0.82
Kayes (2005)
221 0.81 0.78 0.83 0.84 0.77 0.84
Wierstra & DeJong (2002)
101 0.81 0.78 0.83 0.84 0.83 0.82
Ruble & Stout (1990; 1991)
323 (1990) 403 (1991)
0.72 0.67
0.75 0.78
0.72 0.78
0.73 0.78
- -
- -
4.3.3 Spatial Ability Test
The spatial ability test from Barrett and Williams (2003) was used to test the spatial
visualization ability of the participants. It consists of 75 patterns that could be folded
or formed into figures. This test explores how easily the participants can ‘see’ and
manipulate shapes and figures in space (Barrett & Williams, 2003). In other words,
this test evaluates the spatial visualization component of spatial ability, which is the
spatial skill needed to see and manipulate the objects in the VR-based learning
environment of this study.
First, students read instructions and saw sample problems similar to those tested, and
then they had 10 minutes to complete the test. In this study, a median split was used
to classify a participant as having high spatial visualization ability or low spatial
visualization ability. This provides a rough way to categorize learners with different
spatial abilities (Mayer, 2001). A pilot study was conducted to determine the test
reliability of this test.

93
4.3.4 Perceived Learning Effectiveness
Perceived learning effectiveness was developed based on the instruments of
Benbunan-Fich and Hiltz (2003), Marks et al. (2005) and Martens et al. (2007). An
eight-item instrument was developed to measure perceived learning effectiveness on
the issues of identification, integration and generalization of the lesson material. For
all items, participants rated themselves on a five-point Likert scale ranging from (1)
Strongly Disagree to (5) Strongly Agree. An individual’s score on the scale was
conducted by taking the mean of the eight items. A high score on this scale indicated
that the participant thought he or she learned effectively in this study. Perceived
learning effectiveness has been used in numerous studies as a learning outcome
measurement (Benbunan-Fich & Hiltz, 2003; Marks et al., 2005; Martens et al.,
2007). The tests of unidimensionality and reliability were performed on the actual
data.
4.3.5 Satisfaction
Students’ perceived satisfaction was measured by a scale consisting of seven items
adapted from Chou and Liu (2005). The original instruments have eight items with
an alpha coefficient of 0.8625. A five-point Likert scale ranging from (1) Strongly
Disagree to (5) Strongly Agree was used to rate a participant’s perception on
satisfaction. The mean of all the items was calculated to represent an individual’s
score on this scale. A high score meant the participant was satisfied with the learning
method provided. Internal consistency reliability was examined through a pilot
study. Subsequently, unidimensionality and reliability tests were further conducted
on the actual data.

94
4.3.6 Representational Fidelity
Three items were created based on the representational fidelity defined by Dalgarno
et al. (2002). The opinions on representational fidelity were measured using a five-
point Likert scale with (1) Strongly Disagree and (5) Strongly Agree. A pilot test
was conducted to examine the internal consistency. Tests of unidimensionality and
reliability were also conducted on the actual data.
4.3.7 Immediacy of Control
Four items were created based on the immediacy of control defined by Dalgarno et
al. (2002). A five-point Likert scale with (1) Strongly Disagree and (5) Strongly
Agree was used to measure immediacy of control. Internal consistency reliability
was first determined through a pilot test. Unidimensionality and reliability test were
further conducted on the actual data.
4.3.8 Perceived Usefulness
Perceived usefulness was measured with four items adapted from the instrument of
Davis (1989). A five-point Likert scale with (1) Strongly Disagree and (5) Strongly
Agree was used to measure perceived usefulness. Internal consistency reliability was
first determined through a pilot test. Unidimensionality and reliability tests were
further conducted on the actual data.
4.3.9 Perceived Ease of Use
Four items were adapted from the instrument of Davis (1989) to measure perceived
ease of use. A five-point Likert scale with (1) Strongly Disagree and (5) Strongly
95
Agree was used to measure perceived ease of use. Internal consistency reliability
was first determined through a pilot test. Unidimensionality and reliability tests were
further conducted on the actual data.
4.3.10 Presence
Presence was measured using a single item with five-point Likert scale ranging from
(1) Strongly Disagree to (5) Strongly Agree. Since it was a single item, internal
consistency could not be determined.
4.3.11 Motivation
The motivation instrument consisted of fifteen items scored on a Likert scale ranging
from (1) Strongly Disagree to (5) Strongly Agree. It was adapted from the Intrinsic
Motivation Inventory (IMI) by McAuley, Duncan and Tammen (1989). The items
were reworded to suit the current task studied. Negatively worded items were
reverse coded prior to the analysis of the data. The original IMI by McAuley et al.
(1989) has eighteen items which were categorized into four sub-categories.
However, the overall scale was used in this study. The overall scale has an alpha
coefficient of 0.85 (McAuley et al., 1989). A pilot test was conducted to determine
the internal consistency of this fifteen-item instrument. Unidimensionality and
reliability tests were also performed on the actual data.
4.3.12 Cognitive Benefits
Cognitive benefits were measured with five items, with four items adapted from the
instrument of Antonietti et al. (2000). A five-point Likert scale was used with (1)

96
Strongly Disagree and (5) Strongly Agree. A pilot test was carried out to determine
the internal consistency. Tests of unidimensionality and reliability were further
conducted on the actual data.
4.3.13 Control and Active Learning
Four items were developed to measure learner control and active learning. A five-
point Likert scale was used with (1) Strongly Disagree and (5) Strongly Agree.
Internal consistency was first determined through a pilot testing of this instrument.
Tests of unidimensionality and reliability were further conducted on the actual data.
4.3.14 Reflective Thinking
Maor and Fraser’s (2005) reflective thinking instrument was used as a starting point
for the development of the items used to measure reflective thinking. Four items
were developed, with three adapted from Maor and Fraser (2005). The instrument of
Maor & Fraser (2005) has five items with an alpha coefficient of 0.87. A pilot test
was carried out to determine the internal consistency. It was followed by the tests of
unidimensionality and reliability on the actual data.
4.4 Software
A desktop virtual reality program, V-FrogTM, was used to provide the virtual learning
environment to students (Tactus Technologies, 2007). This software was developed
and supplied by Tactus Technologies, Inc., New York. This virtual reality-based
dissection simulator was developed using virtual surgery technology. Textual
information to guide the virtual experiment and to explain the lesson content is on
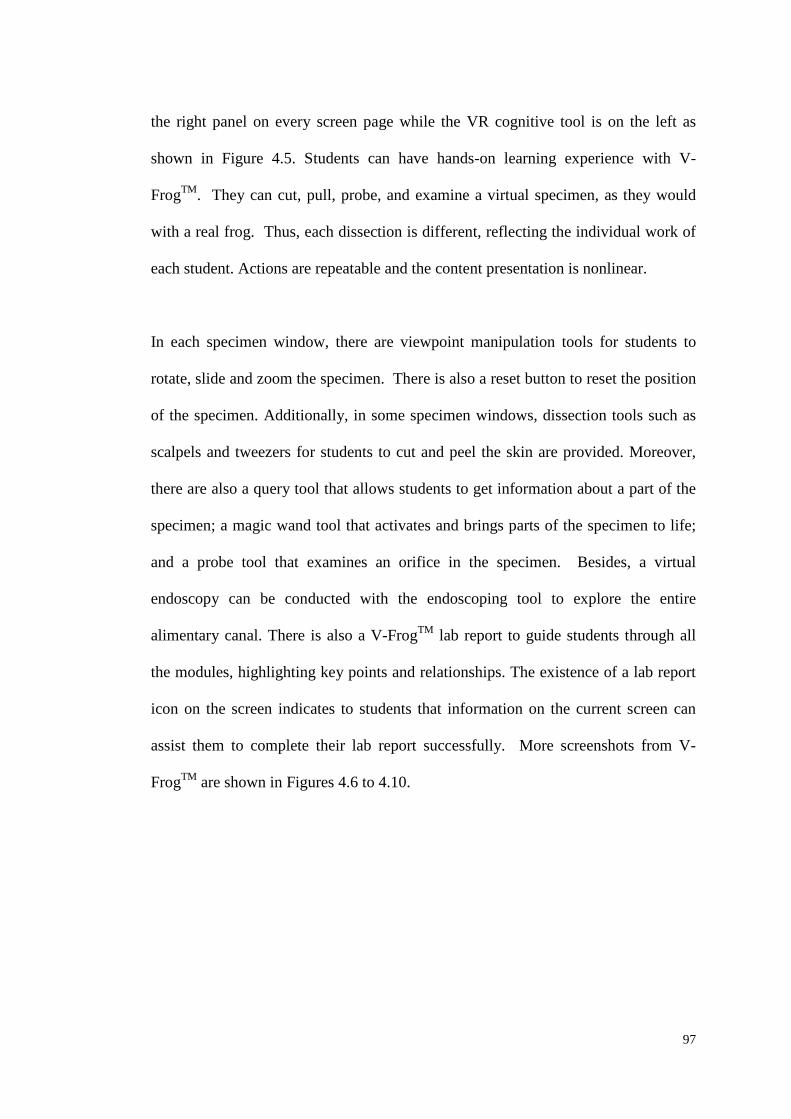
97
the right panel on every screen page while the VR cognitive tool is on the left as
shown in Figure 4.5. Students can have hands-on learning experience with V-
FrogTM. They can cut, pull, probe, and examine a virtual specimen, as they would
with a real frog. Thus, each dissection is different, reflecting the individual work of
each student. Actions are repeatable and the content presentation is nonlinear.
In each specimen window, there are viewpoint manipulation tools for students to
rotate, slide and zoom the specimen. There is also a reset button to reset the position
of the specimen. Additionally, in some specimen windows, dissection tools such as
scalpels and tweezers for students to cut and peel the skin are provided. Moreover,
there are also a query tool that allows students to get information about a part of the
specimen; a magic wand tool that activates and brings parts of the specimen to life;
and a probe tool that examines an orifice in the specimen. Besides, a virtual
endoscopy can be conducted with the endoscoping tool to explore the entire
alimentary canal. There is also a V-FrogTM lab report to guide students through all
the modules, highlighting key points and relationships. The existence of a lab report
icon on the screen indicates to students that information on the current screen can
assist them to complete their lab report successfully. More screenshots from V-
FrogTM are shown in Figures 4.6 to 4.10.

98
Figure 4.5: Screenshot of the desktop VR-based learning environment, the V-FrogTM (Courtesy of Tactus Technologies)
Figure 4.6: The virtual scalpel cuts the frog, just like a real dissection (Courtesy of Tactus Technologies)

99
Figure 4.7: The skin is being pulled back with the tweezers (Courtesy of Tactus Technologies)
Figure 4.8: The internal organs are exposed after the membrane is removed (Courtesy of Tactus Technologies)

100
Figure 4.9: Query tool is used to identify the organ (Courtesy of Tactus Technologies)
Figure 4.10: The comparison of human and frog’s heart. Magic wand can be used to animate the heartbeats (Courtesy of Tactus Technologies)

101
4.5 Data Collection Procedures
The following subsections describe the data collection procedures for both the actual
and pilot study. Prior to the implementation of the study, human research ethics
approval was first obtained from the Human Research Ethics Committee of Murdoch
University, and permission was sought from the Ministry of Education in Malaysia,
the Regional Education Department and school principals. Students and teachers’
consents were also prerequisites required to execute this study.
4.5.1 Actual Study
Standardized written research protocols were used for both the experimental and
control groups respectively to minimize differences in data collection procedures
(see Appendix A and Appendix B). A detailed research protocol was provided to
each teacher who conducted the experiment. The researcher was also available to the
teachers for consultation throughout the study.
Two weeks before the treatment, respondents were required to sit for a pretest
regarding frog anatomy which took about 30 minutes and a spatial ability test which
took 15 minutes to complete, respectively. Apart from the tests, students were also
asked to answer a set of questionnaires (initial questionnaire) which took 15–20
minutes to complete.
During the treatment, both groups were given a lesson on frog anatomy for about 1.5
hours. The experimental groups learned with the VR software, V-FrogTM, where
each student was assigned to an individual computer. Just before the treatment, the

102
experimental groups were given training on how to use the V-FrogTM software
program. On the other hand, the control groups underwent a conventional classroom
learning method with PowerPoint slides conducted by their biology teacher.
Immediately after the treatment, respondents were required to answer a posttest
regarding frog anatomy which took 30 minutes and a set of questionnaires (final
questionnaire) which took 20 minutes to complete, respectively.
A gap of two weeks between the pretest and the posttest was meant to reduce the
pretest sensitization threat. The respondents were assured that the results of the tests
and questionnaires were solely for the research purposes and were not part of the
subject assessment in school.
After completing the experiment, a few participants from the VR learning mode
from each selected school were asked to provide additional qualitative feedback
during debriefing sessions.
4.5.2 Pilot Study
A posttest only experimental design was conducted for the pilot study. A group of
Form Four students, aged between 15 and 17 years old, from a co-education school
from the same city in East Malaysia participated in the pilot study. These students
were randomly selected from science stream classes. A day before the treatment,
participants were given a spatial ability test to answer. Just before the treatment, the
participants were given training on how to use the V-FrogTM software program.

103
Immediately after the treatment, which took about 1.5 hours, the participants were
given a posttest and a set of questionnaires to answer.
4.6 Data Analysis Technique
This subsection describes the various statistical tests used to analyze the actual and
pilot test data. Statistical Package for Social Sciences (SPSS) Version 16 was used
to analyze the data for descriptive statistics such as frequency and proportion. SPSS
Version 16 was also used to run the statistical tests which included independent-
samples t-test, two-way analysis of variance (two-way ANOVA), factor analysis and
internal consistency reliability. Analysis of Moment Structures (AMOS) Version 16
was used for SEM to determine the fit of the hypothesized model.
4.6.1 Actual Study To answer the research questions and to achieve the research objectives, the
quantitative data was analyzed using the software as mentioned above.
The initial plan to use analysis of covariance (ANCOVA) to explore differences
between groups with pretest as a covariate to increase the likelihood to detect
differences between groups was found to be not appropriate because the
homogeneity of regression slopes that concerns the relationship between the
covariate and the dependent variable for each group was violated. Unequal slopes
would indicate the existence of interaction between the covariate and the treatment
(Pallant, 2007, p. 293). A violation of this assumption would cause misleading
results with ANCOVA, thus it should not be conducted (Stevens, 1996, p. 323;

104
Tabachnick & Fidell, 2007, pp. 203, 213). Hence, Independent-samples t-test was
used to determine the differences in the dependent variables between groups.
4.6.1.1 Statistical Analysis for Determining the Learning Effectiveness of a Desktop VR-based Learning Environment Independent-samples t-test was conducted to determine if there was statistical
difference in the mean score of the dependent variables (pretest, posttest, perceived
learning effectiveness and satisfaction) between the two learning modes (VR mode
and Non-VR mode). Independent-sample t-test was also used to determine if there
was difference in the mean score of the learning outcomes and overall improvement
in performance for students with different characteristics in the VR mode. However,
before this test was conducted, assumptions for this test were checked to ensure that
there was no violation of the assumptions.
To determine the effects of the moderator variables (spatial ability and learning
style), a two-way ANOVA was carried out to determine if any interaction existed
between the learning modes and each of the moderators, related to the learning
outcomes, that is, the performance achievement as measured by the posttest, and
affective qualities as measured by the perceived learning effectiveness and
satisfaction. Independent-samples t-test was also conducted for testing simple
effects. A simple effect is the effect of one independent variable within one level of
a second independent variable (Newsom, 2006), for instance, to determine if spatial
ability has any effect in the VR mode.
105
4.6.1.2 Statistical Analysis for Evaluating How VR Enhances Learning Outcomes The reliability and validity of the instruments mentioned in Sections 4.3.4 to 4.3.14
were further determined using the Cronbach’s alpha procedures and factor analysis.
Items that are unidimensional, load highly on a factor and with good internal
consistency reliability are combined into a single composite measure. In this study,
the average (mean) score of the items was used. These single composite measures
were for the indicators (observed variables) underlying the latent variables
(constructs) in the model as shown in Figure 3.1 (see p. 64).
Evaluation of the model was undertaken using SEM with AMOS Version 16. SEM
is a collection of statistical techniques that allows a hypothesized model to be tested
statistically in a simultaneous analysis of the entire system of variables to determine
the extent to which it is consistent with the data (Byrne, 2001, p. 3). If the goodness
of fit is adequate, the model is considered plausible for the postulated relations
among variables (Byrne, 2001). Two main characteristics of SEM are: (1)
simultaneous estimation of multiple and interrelated dependence relationships, and
(2) the ability to present unobserved concepts in these relationships and correct for
measurement error in the estimation process (Hair et al., 2006). Thus, SEM is the
only analysis that allows complete and simultaneous tests of all causal relationships
and the relationships are free of measurement error because the error has been
estimated and removed, leaving only common variance (Ullman, 2007, p. 679).
There are two major types of variables in SEM: observed variables (indicators) and
latent variables (constructs). Latent variables are not directly observable or

106
measured, rather they are measured indirectly through observed variables that define
the latent variable (Schumacker & Lomax, 2004). Thus, SEM involves consideration
of two types of models: the measurement model and the structural model. The
measurement model specifies the relationships among observed variables underlying
the latent variables. The structural model specifies the theoretical relationships
among the latent variables. Estimated path coefficients between the latent variables
indicate the strength and sign of the theoretical relationship. Each latent variable or
construct has a corresponding measurement model that provides an assessment of
convergent and discriminant validity (Schumacker & Lomax, 2004). In other words,
the measurement model can be used to assess the contribution of each indicator in
the estimation of relationships between latent variables. The structural models
provide an assessment of nomological validity, which means the correlation of the
constructs in the models make sense (Hair et al., 2006; Schumacker & Lomax,
2004).
A two-step model-building approach which has been advocated by many authors
(e.g. Anderson & Gerbing, 1988; Mulaik et al., 1989) was adopted to analyze the
two conceptually distinct models: the measurement model followed by the structural
model. This is because the testing of the structural model may be meaningless unless
the reliability and validity of the indicators underlying the constructs can be
established (Jöreskog & Sörbom, 1993). Once the measurement model development
has been completed, the structural path of the SEM is estimated. This means to test
the relationships among the independent and dependent latent variables in the
structural models.

107
The evaluation of the measurement models and structural models was done using
maximum likelihood estimation. Before the evaluation was conducted, the
assumptions for maximum likelihood estimation were performed to make sure that it
was appropriate for employment.
4.6.1.2.1 Measurement Model Development Prior to the development of the measurement model, the unidimensionality and
internal consistency of the items of each factor were determined. The
unidimensionality of the items was determined by exploratory factor analysis while
the internal consistency was determined by the Cronbach’s alpha coefficient.
After the unidimensionality of the items was determined, a composite measure using
unit weights was created, that is, each item was assumed to contribute equally to the
composite. The composite measures created were for the measured variables
(indicators) underlying the respective latent constructs in the measurement models.
The aim of the measurement model development was to establish the reliability and
validity of a set of indicators in each latent construct. The construct validity of the
measurement model was assessed in terms of convergent validity and discriminant
validity. Convergent validity means the indicators of a specific construct should
converge or share a proportion of variance in common (Hair et al., 2006, p. 776). In
this study, composite reliability and average variance extracted were used to
determine convergent validity.

108
Composite reliability is a more general measure of reliability as it uses the item
loadings estimated within the model. It is commonly used in SEM. It is calculated
as:
Composite reliability =
+
∑∑
∑
==
=
n
ii
n
ii
n
ii
1
2
1
2
1
δλ
λ
where λ represents the standardized factor loading for the indicators on the latent
variable, and δ is the measurement error for each indicator. A commonly used
threshold value for composite reliability is 0.7 (Hair et al., 2006). However, values
below 0.7 have been considered acceptable for exploratory research (Hair, Anderson,
Tatham, & Black, 1988).
The average variance extracted reflects the overall amount of variance in the
indicators accounted for by the latent construct. An average variance extracted of
0.5 or higher suggests adequate convergent (Hair et al., 2006). It is calculated as:
Average variance extracted =
+
∑∑
∑
==
=
n
ii
n
ii
n
ii
11
2
1
2
δλ
λ
where λ represents the standardized factor loading for the indicators on the latent
variable, and δ is the measurement error for each indicator.
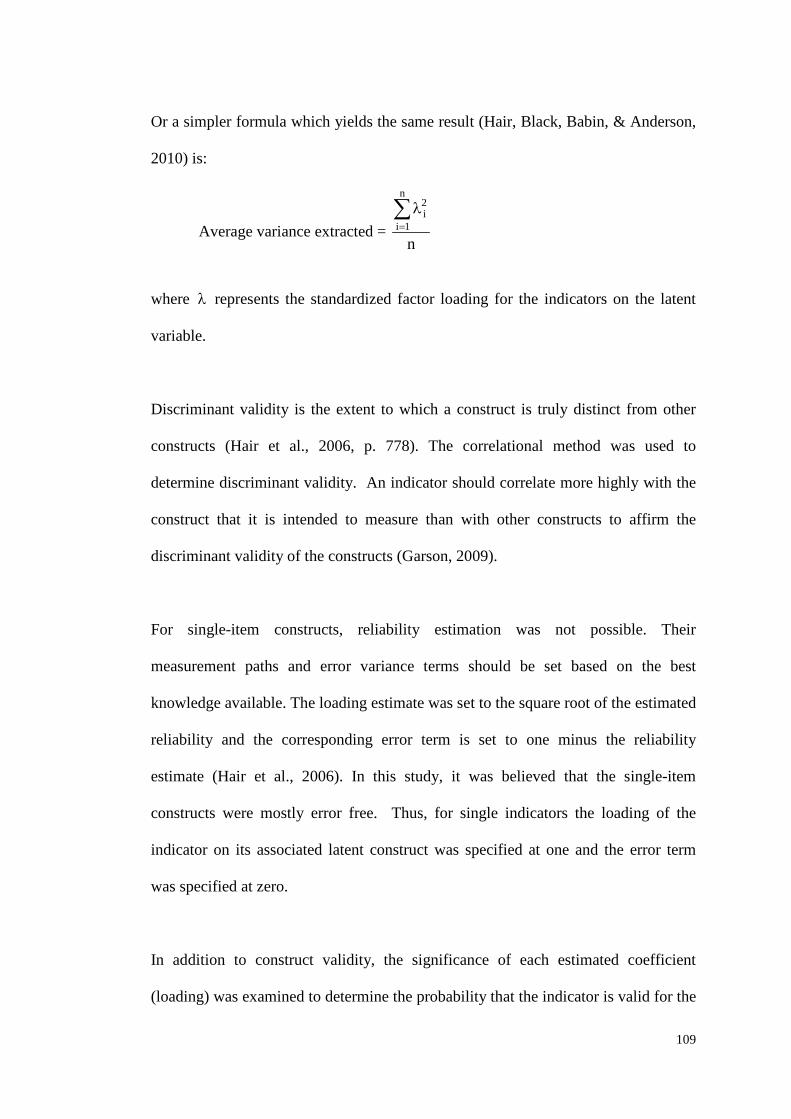
109
Or a simpler formula which yields the same result (Hair, Black, Babin, & Anderson,
2010) is:
Average variance extracted = n
n
1i
2i∑
=
λ
where λ represents the standardized factor loading for the indicators on the latent
variable.
Discriminant validity is the extent to which a construct is truly distinct from other
constructs (Hair et al., 2006, p. 778). The correlational method was used to
determine discriminant validity. An indicator should correlate more highly with the
construct that it is intended to measure than with other constructs to affirm the
discriminant validity of the constructs (Garson, 2009).
For single-item constructs, reliability estimation was not possible. Their
measurement paths and error variance terms should be set based on the best
knowledge available. The loading estimate was set to the square root of the estimated
reliability and the corresponding error term is set to one minus the reliability
estimate (Hair et al., 2006). In this study, it was believed that the single-item
constructs were mostly error free. Thus, for single indicators the loading of the
indicator on its associated latent construct was specified at one and the error term
was specified at zero.
In addition to construct validity, the significance of each estimated coefficient
(loading) was examined to determine the probability that the indicator is valid for the

110
construct. The ratio of unstandardized coefficient to standard error which is the
critical ratio (C.R.) or t value was used to test the significance of each coefficient. A
C.R. of greater than 1.96 is considered significant. However, the higher the C.R. the
more likely it is a valid indicator of the construct (Hayduck, 1987).
4.6.1.2.2 Structural Model Evaluation The evaluation of the structural model was conducted with the entire sample. The
estimation of parameters was based on maximum likelihood methods using AMOS
Version 16.
The primary interest in SEM is to determine the extent to which a hypothesized
model “fits” or adequately describes the sample data. The evaluation of the model
fit was based on three criteria. The first criterion was the feasibility and significance
of the estimated model parameters. The parameter estimates should exhibit the
correct sign and size that are consistent with the underlying theory. Besides, they
should fall within the admissible range (e.g. no correlations > 1.00 and negative
variances). Furthermore, the proposed relationships should be significant. In AMOS,
the critical ratio can be used to determine the significance of estimated parameters.
Based on a level of 0.05, the C.R. needs to be > ± 1.96 to reject the hypothesis that
the estimate equals to 0.0 (Byrne, 2001). For directional hypotheses, a one-tailed
C.R. of 1.645 indicates significance at the p < 0.05 (Hair et al., 2006). For non-
directional hypotheses, a two-tailed C.R. of 1.96 indicates significance at the p <
0.05 (Byrne, 2001).

111
The second criterion is the overall goodness of fit between the hypothesized model
and the sample data. These goodness-of-fit measures include the chi-square statistics
( 2χ ), normed 2χ , the goodness-of-fit index (GFI), the comparative fit index (CFI),
Tucker Lewis Index (TLI) and the root mean square error of approximation
(RMSEA). The guidelines for interpreting these measures are shown in Table 4.3.
A non-significant 2χ (p > 0.05) indicates a good fit. However, 2χ values depend on
sample sizes. With large samples (generally above 200), trivial deviations from fit
may be statistically significant, thus the 2χ test of model fit can lead to erroneous
conclusions (Schumacker & Lomax, 2004). To eliminate or minimize this effect,
other fit indices such as the normed 2χ ( 2χ /df) were used to look at model fit
(Ullman, 2007, p. 695). Chin and Todd (1995) recommended a normed 2χ of smaller
than three, while Jackson, Dezee, Douglas and Shimeall (2005) recommended a ratio
of less than two as an excellent fit and three to five as a satisfactory fit.
The GFI was less sensitive to sample size (Hair et al., 2006). It is a measure of the
relative amount of variance and covariance in the sample covariance matrix that is
predicted by the estimated population covariance matrix (Byrne, 2001). One is a
perfect fit; however, GFI > 0.9 indicates a good fit (Jackson et al., 2005). The
adjusted goodness-of-fit index (AGFI) includes an adjustment for model complexity.
It adjusts for the number of degrees of freedom in the specified model. An AGFI >
0.80 indicates a good fit (Segars & Grover, 1993).

112
The CFI measures how well a specified model fits relative to a null model, a model
in which all observed variables have no relationship (Hair et al., 2006). A value close
to 0.95 indicates a good model fit (Hu & Bentler, 1999).
The TLI is conceptually similar to the CFI. However, TLI is not normed, thus its
value can fall below zero or above one (Hair et al., 2006). Values close to 0.95
indicate a good fit (Hu & Bentler, 1999).
The RMSEA measures the mean discrepancy (per degree of freedom) between
observed and model implied covariances, thus this index is sensitive to the number
of estimated parameters in the model (Byrne, 2001). A RMSEA < 0.05 indicates a
good fit (Byrne, 2001). However, RMSEA values ranging from 0.05 to 0.08
represent a fair fit (Browne & Cudeck, 1993) and RMSEA values ranging from 0.08
to 0.10 indicate a mediocre fit (Hair et al., 2006; MacCallum, Browne, & Sugawara,
1996). Table 4.3 shows a summary of the goodness-of-fit indices and reliability
measures adopted in this study.
The third criterion was the ability of the models to explain the variances in the
dependent variables. The squared multiple correlations (R2) of these variables were
used as estimates of variance explained. Although no test of statistical significance
can be performed, R2 provides a relative measure of fit for each structural equation
in the model.

113
Table 4.3: Summary of the guidelines for model fit Model fit measures Guidelines for fit Goodness-of-fit measures
Chi-square ( 2χ )
Non significant 2χ (p > 0.05)
Normed 2χ
< 3 indicates a good fit
Goodness-of-fit index (GFI)
> 0.90
Adjusted Goodness-of-fit index (AGFI)
> 0.80
Comparative fit index (CFI)
Tucker Lewis Index (TLI)
≥ 0.95 ≥ 0.95
Root mean square error of approximation
(RMSEA) < 0.05 indicates a good model fit 0.05 – 0.08 indicates a fair fit < 0.10 indicates an acceptable fit
Reliability measures Cronbach’s alpha coefficient ≥0.70 Composite reliability ≥0.70 Average variance extracted ≥0.50
4.6.1.2.3 Moderating Effects Analysis The analytical strategy of Singh (1995) was used to examine the existence of the
moderating effect on the structural model by using a subgroup analysis. First, an
“unconstrained” simultaneous multi-group estimation of path coefficients was
conducted where path coefficients were allowed to vary across the cross-group data
set. This served as the baseline model. Next, a “partially constrained” model was
estimated with the target path coefficient restricted to be equal for simultaneous
multi-group estimation. By comparing the 2χ value for the “unconstrained” and
“partially constrained” models, a 2χ difference test was then used to examine the

114
hypotheses. A statistically significant result indicates that the constrained model
produced a poorer fit than the unrestricted model.
4.6.2 Pilot Study
Item analysis was performed on the posttest. Item discrimination and item difficulty
indices were determined to improve the instrument. The reliability of the posttest,
spatial ability test and instruments mentioned in Sections 4.3.5 to 4.3.14 was
determined using the Cronbach’s alpha procedure. SPSS Version 16 was used to
calculate Cronbach’s alpha. A Cronbach’s alpha value of 0.7 or higher indicates
acceptable internal consistency (Nunnally, 1978).
Hopkins’s (1988) item discrimination index guidelines were used to interpret the
item’s sensitivity to measure individual differences (see Table 4.4). These guidelines
are relevant when there is a minimum of 30 examinees. An item discrimination
index measures how adequately an item discriminates between high scorers and low
scorers on an entire test (Cohen et al., 1996).
A difficulty index is the proportion of students who answered an item correctly. The
value of an item difficulty index can range from zero (if no one got the item right) to
one (if everyone got the index right). Hopkins (1988) articulates that items with a
difficulty index between 0.25 and 0.75 are of moderate difficulty.

115
Table 4.4: Guidelines for interpreting item discrimination index (Hopkins, 1998)
Discrimination Index, d Item discrimination evaluation
0.40 and above Excellent discrimination 0.30 to 0.39 Good discrimination 0.10 to 0.29 Fair discrimination 0.01 to 0.10 Poor discrimination
Negative Item may be mis-keyed or intrinsically ambiguous 4.7 Results of Pilot Study The results of the pilot study are presented here while the results for the actual study
are elaborated in the subsequent chapters.
4.7.1 Number of Samples
Fifty students were randomly chosen from the name lists of three science classes in
the selected school. However, three students were absent on the day when the
experiment was carried out. Thus, 47 students participated and sat for the posttest
and spatial ability test. A total of 40 students had completed and returned the
questionnaire.
4.7.2 Evaluation of Posttest The posttest scores by 47 students ranged from the lowest of 24% to the highest of
92%. According to Kelley (1939), the optimal boundary lines to segregate the upper
and lower areas of a score distribution are scores within the upper and lower 27% of
the distribution of scores if the distribution is normal. The posttest data is normally
distributed as showed by the Kolmogorov-Smirnov test where p > 0.05 (see Table
4.5). Hence, the students were ranked according to their posttest scores, and then the

116
top 27% and the lowest 27% in terms of the posttest scores were selected to calculate
the discrimination index. The top 27% was taken as Upper Group and the lowest
27% was taken as Lower Group with a total of 13 students in each group.
Table 4.5: Test of normality for Posttest
Kolmogorov-Smirnov(a) Shapiro-Wilk
Statistic df Sig. Statistic df Sig. posttest score .122 47 .078 .977 47 .473
a Lilliefors Significance Correction
The proportion in the Upper Group (PU) answering a particular item correctly was
determined by dividing the number of correct responses from the Upper Group with
the total number of people in the Upper Group, while the proportion in the Lower
Group (PL) answering a particular item correctly was determined in a similar way.
The item discrimination index was obtained by subtracting PL from PU, whereas the
item difficulty index was calculated by taking the average of PU and PL as shown in
Appendix H.
The results of item discrimination analysis showed that Item A6, A14, B1c, B1f and
C1 were of poor discrimination (discrimination index, d < 0.1)—see Appendix G.
Therefore, these items were removed. Internal consistency was measured using
Cronbach’s alpha. Item deletion procedures suggested that Item B2d could be
deleted to increase the alpha coefficient. This item had a low corrected item-total
correlation, r = 0.010. Corrected item-total correlation is the Pearson correlation
between the score on the individual item and the sum of the scores on the remaining
items (Coakes & Steed, 2001). Thus, the deletion of this item did not affect the

117
overall reliability of the posttest. Originally, the Cronbach’s alpha for all 38 items
was 0.833. However, when Items A6, A14, B1c, B1f, B2d and C1 were removed,
the alpha coefficient was raised to 0.846 (see Table 4.6). Thus, the number of items
for the posttest was reduced to 32 items.
Table 4.6: Cronbach’s alpha for posttest with 32 items
N of Items .846 32
The difficulty index showed that the majority of the questions were of moderate
difficulty (see Appendix G). The reason why Items B1h and B1i had a lower item
difficulty index was because many students missed out these questions. The students
were requested to show these two answers on the same diagram where they were
requested to label the given internal organs. Thus, to avoid this problem, a separate
diagram was given for the students to show their answers for B1h and B1i for the
actual survey.
In addition, it was found that Figure 1 and 2 of Part C in the posttest did not clearly
show the internal organs due to the black and white printing. Therefore, these two
diagrams were printed in color for the actual survey.
4.7.3 Reliability Test of Measurement Instruments All instruments except the instrument to measure perceived ease of use have a
Cronbach’s alpha coefficient that exceeded the recommended level of 0.70

118
(Nunnally, 1978), which was considered reliable and had good internal consistency
(see Table 4.7). Though the motivation instrument has a Cronbach’s alpha
coefficient that was greater than 0.70, item deletion procedures suggested that Items
No. 5, No. 6, and No. 11 could be deleted to increase the alpha coefficient. Item No.
5 (r = 0.078) and Item No. 11 (r = 0.070) had the lowest corrected item-total
correlations. Hence, deletion of these two items did not affect the overall reliability
of this instrument. Item No. 6 was misinterpreted by many participants and it was
very similar with Item No. 12, thus it was removed. When these three items were
removed, the reliability coefficient, Cronbach’s alpha, was raised from 0.738 to
0.818 (see Table 4.7).
Table 4.7: Reliability test of instruments
Measurement Cronbach’s alpha
Motivation 0.738* Cognitive Benefits 0.915 Control and Active Learning 0.888 Reflective Thinking 0.836 Representational Fidelity 0.838 Immediacy control 0.900 Satisfaction 0.835 Perceived Usefulness 0.899 Perceived Ease of Use 0.636 Spatial ability test 0.757
*Cronbach’s alpha for motivation was raised to 0.818 after three items were deleted to improve the measurement. The final motivation measurement consists of 15 items.
The item deletion procedure suggested that Item No. 3 of the perceived ease of use
instrument could be deleted to increase the reliability. However, it was not removed
but rephrased so that the participants could apprehend the intended meaning of this
item better. As mentioned by Kumar (2005, p. 157), a slight ambiguity in the
wording of statements can affect the reliability of a research instrument as

119
respondents may interpret the statements differently at different times, resulting in
different responses.
Tests of reliability and unidimensionality for measurements with Likert scale were
further conducted on the actual data and the results are presented in Section 6.3.
4.8 Summary This chapter provides an elaboration of the methodology that was used for
determining the learning effectiveness in the VR-based learning environment and the
evaluation of how VR enhances the learning outcomes. A two-group pretest-posttest
quasi-experimental design was employed to evaluate the effects of each learning
mode on learning, and factorial design was used to investigate the possible
interaction effects between the two learning modes and the learner’s aptitudes in
terms of spatial abilities and learning styles.
To evaluate how VR enhances learning outcomes, SEM with maximum likelihood
estimation was employed to determine the model fit. A two-step model building
approach was used, that is, the measurement model was first evaluated in terms of its
convergent validity and discriminant validity and this was followed by the structural
model evaluation to determine the causal relationships between independent and
dependent latent variables. The analytical strategy of Singh (1995) was used to
examine the existence of the moderating effect on the structural model by using a
subgroup analysis, that is, accommodator learners and assimilator learners, and high
and low spatial ability groups.

120
Finally, the pilot test results were presented. Item analysis was performed to
improve the posttest. Reliability test results on pilot data indicated a good level of
internal consistency for all the instruments except for the instrument to measure
perceived ease of use in which the Cronbach’s alpha is slightly lower than the
acceptable level of 0.7. For this instrument, the number of items was retained but the
wordings of one of its items were rephrased in order to improve its reliability. The
results of the actual study are reported in the following two chapters.
121
Chapter 5
RESULTS: LEARNING EFFECTIVENESS OF A DESKTOP VR-BASED LEARNING ENVIRONMENT
AND ATI RESEARCH
5.0 Overview One of the aims of this study was to obtain empirical data to investigate the effects of
a VR-based learning environment on learning outcomes as compared to the
conventional classroom learning method. The learning outcomes were measured by
the performance achievement, perceived learning effectiveness and satisfaction of
the learning modes. Besides, ATI research was also conducted in this study to
investigate the effects of individual differences in terms of spatial abilities and
learning styles on learning outcomes from different forms of treatments.
This chapter reports the results from the data analysis of the quasi-experimental
study. The analyses were carried out through various statistical techniques such as
the descriptive statistics analysis, the independent-samples t-test and two-way
ANOVA. This chapter first describes the characteristics of the sample and the
distribution of learners. It then presents the justification of the techniques used to
analyze the data which is followed by the results of the hypotheses testing. Lastly, a
summary of the findings to the research questions is presented.

122
5.1 Characteristics of Sample A total of 431 students participated in this experiment. However, out of these
students, 61 of them did not fully complete all the instruments, that is, they were
either absent in the pretest or posttest during the day of testing or did not return the
questionnaire. Hence, only 370 participants were taken into consideration in the
analysis. The mean age of the participants was 15.68 years old.
5.2 Distribution of Learners The 370 participants were randomly divided into two groups based on their intact
classes. Each group was assigned to one of the two learning modes: VR mode and
Non-VR mode. A total of 210 participants were in the VR mode whereas 160
participants were in the Non-VR mode. Some 23.8% (88) were male and 33% (122)
were female in the VR mode while 18.4% (68) were male and 24.9% (92) were
female in the Non-VR mode. Overall, the sample consisted of 42.2% (156) male
students and 57.8% (214) female students (see Table 5.1).
Table 5.1: Cross tabulation of learning mode and gender
Gender Male Female Total
Learning Mode VR Count 88 122 210
% of Total 23.8% 33.0% 56.8%
Non-VR Count 68 92 160
% of Total 18.4% 24.9% 43.2%
Total Count 156 214 370
% of Total 42.2% 57.8% 100.0%

123
As shown in Table 5.2, based on those who had answered this question, almost half
of the participants, 46.2% have no knowledge about VR, 40.9% have some
knowledge, only 3.8% have a lot of knowledge about VR, and 9.1% have some
experience in using VR.
Table 5.2: Virtual reality knowledge of students in the VR mode
Frequency Percent Valid Percent Cumulative
Percent
Valid Knew Nothing 96 45.7 46.2 46.2
Some Knowledge 85 40.5 40.9 87.0
Lots of Knowledge 8 3.8 3.8 90.9
Some Experiences 19 9.0 9.1 100.0
Total 208 99.0 100.0
Missing System 2 1.0
Total 210 100.0
5.3 Homogeneity of Pretest Table 5.3 shows the Levene’s test of equality of variance of pretest across the two
different learning modes. The p-value was greater than 0.05, thus the variance in
pretest score was not significantly different for the two learning modes.
Independent-samples t-test was conducted to determine if the two learning modes
were homogeneous in terms of existing knowledge of the subject matter, which was
measured by the pretest. Statistical tests were conducted at the alpha = 0.05
significance level. The result shows that there was no statistically significant
difference in the pretest score between VR mode (M = 43.14, SD = 19.98) and Non-
VR mode [M=42.46, SD = 18.82, t(368) = 0.330, p = 0.741] (see Table 5.4). It is

124
thus inferred that there was no significant difference in the prior knowledge on the
subject matter for both learning modes.
Table 5.3: Levene’s test of equality of variance of pretest across VR mode and
Non-VR mode Levene's Test for Equality of
Variances
F Sig.
Pretest Equal variances assumed 1.048 .307
Equal variances not assumed
Table 5.4: Pretest mean score, standard deviation and t-test of pretest of VR mode (N = 210) and Non-VR mode (N = 160)
Group Mean Standard Deviation
t
df p-value
Pretest VR Mode 43.14 19.98 0.330 368 0.741 Non-VR Mode 42.46 18.82
5.4 Testing Assumptions for T-test and Two-way ANOVA
Independent-samples t-test was used to explore differences in the dependent
variables between groups, and two-way ANOVA was employed to investigate the
interaction effect of two independent variables on the dependent variable.
According to Pallant (2007), the following assumptions have to be met before t-test
and two-way ANOVA are conducted.

125
Assumption 1: Level of measurement
T-test and two-way ANOVA assume that the dependent variable is a continuous
scale, measured at the interval or ratio level.
Assumption 2: Random sampling
T-test and two-way ANOVA assume that the scores are obtained using a random
sample from the population. According to Pallant (2005, p. 203), though parametric
techniques assumes the scores are obtained using a random sample from the
population, this is often not the case in real-life research.
Assumption 3: Independence of observations
The observations that make up the data must be independent of one another. In other
words, each observation or measurement must not be influenced by any other
observation or measurement.
Assumption 4: Normal distribution
It is assumed that the population from which the samples are taken is normally
distributed. However, with large sample sizes (e.g. 30+), reasonably accurate results
will be obtained even though this assumption is violated (Pallant, 2007).
Assumption 5: Homogeneity of variance
T-test and two-way ANOVA assume that samples are obtained from populations of
equal variances. In other words, the variability of scores for each of the groups is
similar. For t-tests, two sets of results are provided, for situations where the

126
assumption is not violated and for when it is violated. Hence, the result is used that
is appropriate to the data. If this assumption is violated, then it is recommended that
a more stringent significance level (e.g. 0.01) is set in two-way ANOVA (Pallant,
2007).
The results of testing of each of the aforementioned assumptions were presented as
follows.
Assumption 1: Level of measurement
The dependent variables were measured at interval level. The posttest scores were
converted to percentage, and mean scores from the five-point Likert scale were used
as the composite measures for perceived learning effectiveness and satisfaction.
Assumption 2: Random sampling
The sample of this study was randomly selected from four co-education secondary
schools in East Malaysia. For each selected school, two to four intact classes were
randomly chosen and assigned to the VR and Non-VR mode. Thus, the groups
constituted intact classes, in which equivalency could not be presumed or assumed.
Though quasi-experimental design is not randomize, but it is useful in generating
results for general trends and it is most frequently used when it is not feasible to use
ramdom assignment (Gribbons & Herman, 1997).

127
Assumption 3: Independence of observation
Each student was given the pretest, posttest, spatial ability test, initial questionnaire
and final questionnaire to answer under the supervision of a teacher or researcher to
avoid unnecessary interaction that might lead to the violation of this assumption.
Assumption 4: Normal distribution
The Kolmogorov-Smirnov test was used to assess the normality of the distribution
for all dependent variables for the VR mode, Non-VR mode and whole sample (see
Tables 5.5–5.7). A non-significant test (Sig. values greater than 0.05) indicates
normality. As such, posttest has a normal distribution for the VR mode (p = 0.627),
Non-VR mode (p = 0.156) and across the whole sample (p = 0.068). Gain score was
used to measure overall improvement in performance and it was normally distributed
for the VR mode (p = 0.376). However, perceived learning effectiveness was not
normal for the Non-VR mode (p = 0. 0210) and satisfaction was not normal for the
VR mode (p = 0.007), Non-VR mode (p = 0.004) and the whole sample (p = 0.023).
Nevertheless, according to Pallant (2007), a non-significant result is quite common
in larger samples as mentioned earlier. With large sample sizes (e.g. 30+),
reasonably accurate results will still be obtained even though this assumption is
violated (Pallant, 2007).
Moreover, an inspection on the skewness and kurtosis values did not show that the
data was highly skewed and highly kurtotic. The absolute value of critical ratio
(skewness/standard error and kurtosis/standard error) of less than or equal to two
indicates that skewness and kurtosis are not significantly different from zero, thereby

128
meeting the normality assumption (Brown, 1997)—see Table 5.8. Thus, perceived
learning effectiveness was assumed normal for the VR mode. Satisfaction also met
the normality assumption for the Non-VR mode and the whole sample. Although the
critical ratio of kurtosis for satisfaction in the VR mode was slightly higher than two,
the histogram of satisfaction for the VR mode appeared to be reasonably normally
distributed (see Figure 5.1). This was also supported by an inspection of the
normality plots as shown in Figure 5.2. The reasonably straight line suggested a
normal distribution.
Table 5.5: Test of normality for posttest, perceived learning effectiveness,
satisfaction and gain score for the VR mode
Posttest
Perceived
Learning
Effectiveness Satisfaction Gain Score
N 210 210 210 210
Normal Parametersa Mean 65.5095 3.9369 4.0245 22.3714
Std. Deviation 15.67561 .53022 .58609 19.25789
Most Extreme Differences Absolute .052 .086 .117 .063
Positive .052 .086 .117 .063
Negative -.051 -.049 -.080 -.048
Kolmogorov-Smirnov Z .750 1.246 1.691 .912
Asymp. Sig. (2-tailed) .627 .090 .007 .376
a. Test distribution is Normal.

129
Table 5.6: Test of normality for posttest, perceived learning effectiveness and satisfaction for the Non-VR mode
Posttest
Perceived Learning
Effectiveness Satisfaction
N 160 160 160
Normal Parametersa Mean 60.5625 3.3008 3.2094
Std. Deviation 20.88474 .48651 .51453
Most Extreme Differences Absolute .089 .119 .139
Positive .049 .119 .139
Negative -.089 -.093 -.122
Kolmogorov-Smirnov Z 1.129 1.509 1.761
Asymp. Sig. (2-tailed) .156 .021 .004
a. Test distribution is Normal.
Table 5.7: Test of normality for posttest, perceived learning effectiveness and
satisfaction for the whole sample
Posttest
Perceived Learning
Effectiveness Satisfaction
N 370 370 370
Normal Parametersa Mean 63.3703 3.6618 3.6720
Std. Deviation 18.25224 .60067 .68713
Most Extreme Differences Absolute .068 .063 .078
Positive .039 .063 .078
Negative -.068 -.046 -.061
Kolmogorov-Smirnov Z 1.300 1.210 1.498
Asymp. Sig. (2-tailed) .068 .107 .023
a. Test distribution is Normal.

130
Table 5.8: Assessment of normality with skewness and kurtosis for perceived learning effectiveness and satisfaction
Variables Mode Skew Critical
ratio Kurtosis Critical
ratio Perceived Learning Effectiveness
Non-VR mode
0.174 0.906 0.058 0.152
Satisfaction VR mode
0.850 0.506 0.858 -2.569
Non-VR mode
0.178 0.927 0.516 1.354
Whole sample
0.158 1.244 -0.483 -0.253
Figure 5.1: Histogram of satisfaction for the VR mode
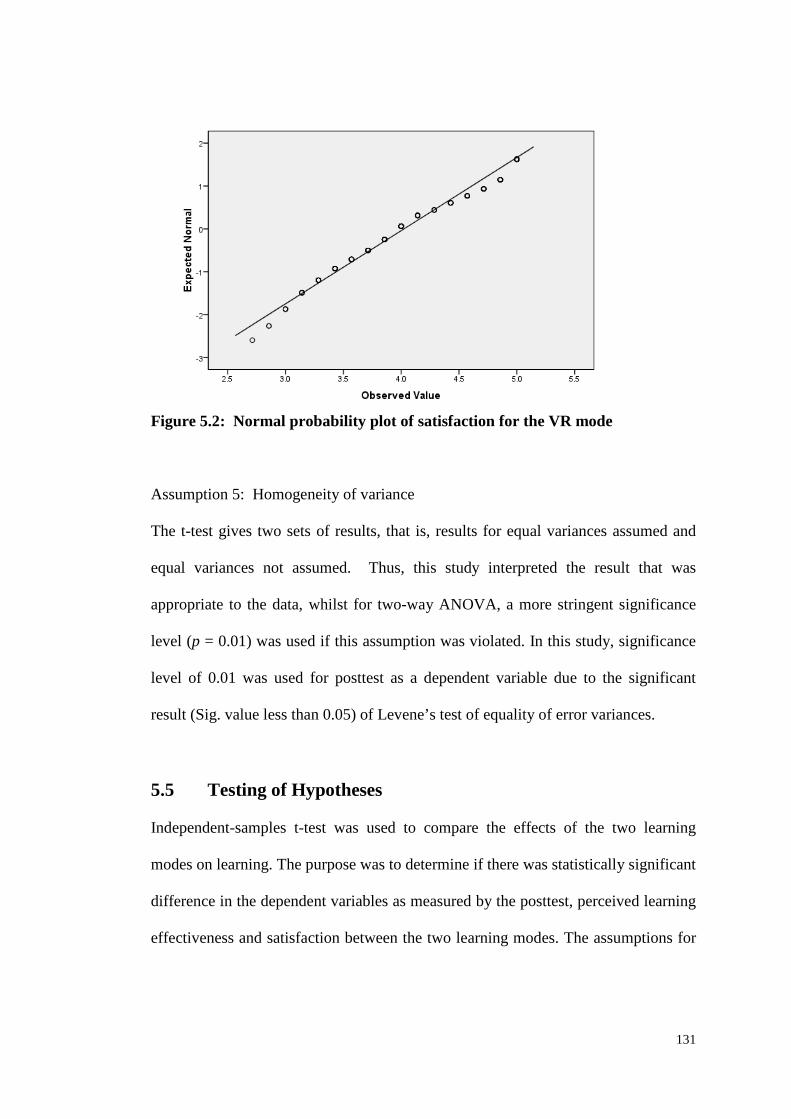
131
Figure 5.2: Normal probability plot of satisfaction for the VR mode Assumption 5: Homogeneity of variance The t-test gives two sets of results, that is, results for equal variances assumed and
equal variances not assumed. Thus, this study interpreted the result that was
appropriate to the data, whilst for two-way ANOVA, a more stringent significance
level (p = 0.01) was used if this assumption was violated. In this study, significance
level of 0.01 was used for posttest as a dependent variable due to the significant
result (Sig. value less than 0.05) of Levene’s test of equality of error variances.
5.5 Testing of Hypotheses Independent-samples t-test was used to compare the effects of the two learning
modes on learning. The purpose was to determine if there was statistically significant
difference in the dependent variables as measured by the posttest, perceived learning
effectiveness and satisfaction between the two learning modes. The assumptions for

132
this test had been performed and this test was found to be appropriate for
employment. Statistical tests were conducted at the alpha = 0.05 significance level.
5.5.1 Testing of H01
H01: There is no significant difference in the performance achievement between
students in the VR mode and Non-VR mode.
The significance level for Levene’s test for the posttest was less than 0.05; the t-
value under “Equal variances not assumed” was thus reported. The statistical results
rejected the null hypothesis (p < 0.05). There was a significant difference in the
posttest scores for the VR mode (M = 65.51, SD = 15.68) and the Non-VR mode [M
= 60.56, SD = 20.89; t(284.863) = 2.506, p = .013] (see Tables 5.9–5.10). Students
in the VR mode scored higher than students in the Non-VR mode on posttest.
Eta squared was used to determine the effect size which provides an indication of the
magnitude of the differences between the two learning modes (Pallant, 2007). The
formula for eta squared is as follows:
Eta squared = )22N1N(t
t2
2
−++
t is the t value, N1 and N2 are the sample sizes for the two respective modes.
The magnitude of the differences in the means of posttest for the two learning modes
was small (eta squared = 0.02). This interpretation was based on the guidelines

133
proposed by Cohen (1988): 0.01 = small effect, 0.06 = moderate effect, and 0.14 =
large effect.
5.5.2 Testing of H02 H02: There is no significant difference in the perceived learning effectiveness
between students in the VR mode and Non-VR mode.
The significance level for Levene’s test was more than 0.05 which indicated that
there was no violation in the homogeneity of variances of the perceived learning
effectiveness for both learning modes; the t-value under “Equal variance assumed”
was thus reported. The statistical results rejected the null hypothesis (p < 0.05).
There was a significant difference in perceived learning effectiveness for the VR
mode (M = 3.94, SD = 0.53) and the Non-VR mode [M = 3.30, SD = 0.49; t(368) =
11.844, p < 0.0005] (see Tables 5.9–5.10). Students in the VR mode perceived a
higher learning quality than students in the Non-VR mode. The magnitude of the
differences in the means was large (eta squared = 0.28). So, 28% of the variance in
perceived learning effectiveness was explained by the learning mode.
5.5.3 Testing of H03 H03: There is no significant difference in the satisfaction between students in the VR
mode and Non-VR mode.
The significance level of Levene’s test was less than 0.05; the t-value under “Equal
variance not assumed” was thus reported. The statistical results rejected the null
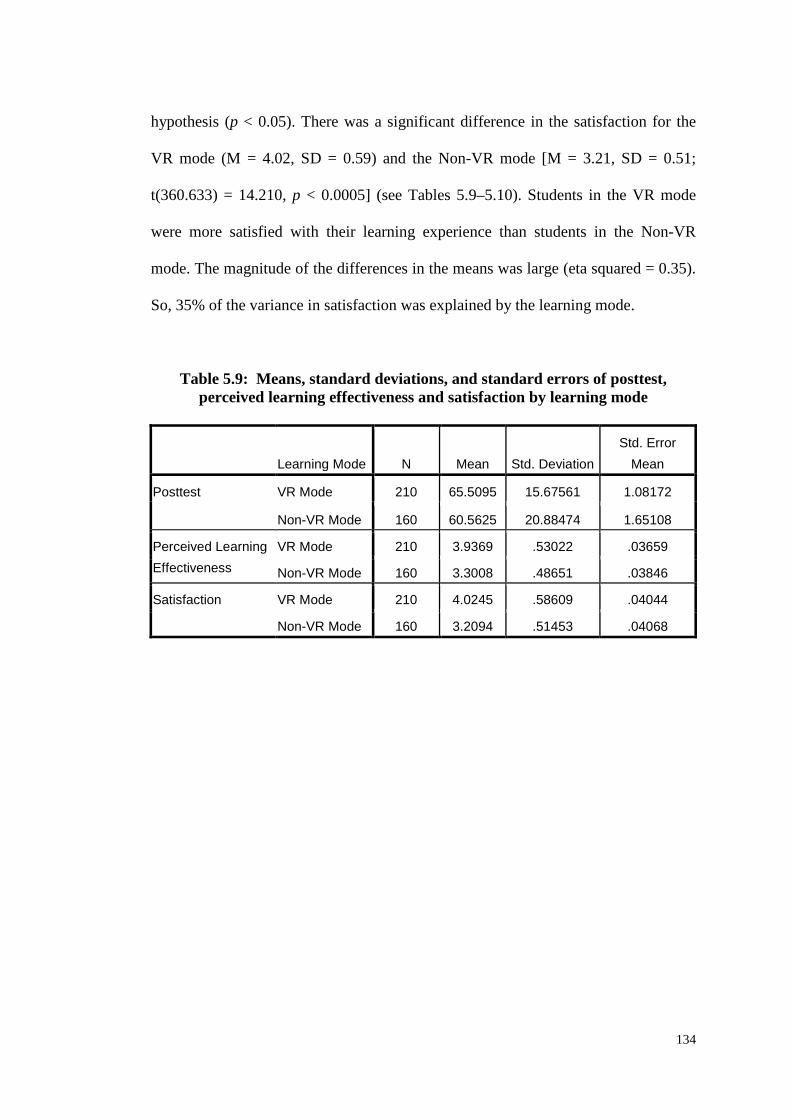
134
hypothesis (p < 0.05). There was a significant difference in the satisfaction for the
VR mode (M = 4.02, SD = 0.59) and the Non-VR mode [M = 3.21, SD = 0.51;
t(360.633) = 14.210, p < 0.0005] (see Tables 5.9–5.10). Students in the VR mode
were more satisfied with their learning experience than students in the Non-VR
mode. The magnitude of the differences in the means was large (eta squared = 0.35).
So, 35% of the variance in satisfaction was explained by the learning mode.
Table 5.9: Means, standard deviations, and standard errors of posttest, perceived learning effectiveness and satisfaction by learning mode
Learning Mode N Mean Std. Deviation Std. Error
Mean
Posttest VR Mode 210 65.5095 15.67561 1.08172
Non-VR Mode 160 60.5625 20.88474 1.65108
Perceived Learning Effectiveness
VR Mode 210 3.9369 .53022 .03659
Non-VR Mode 160 3.3008 .48651 .03846
Satisfaction VR Mode 210 4.0245 .58609 .04044
Non-VR Mode 160 3.2094 .51453 .04068
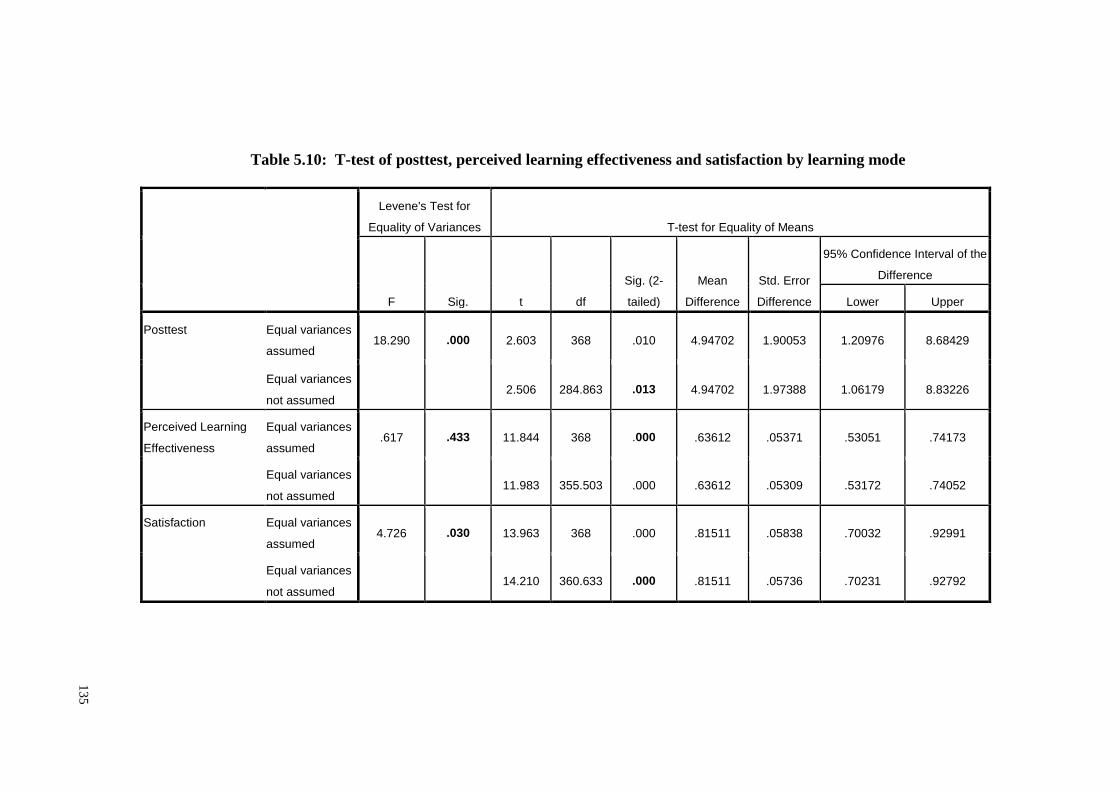
135
Table 5.10: T-test of posttest, perceived learning effectiveness and satisfaction by learning mode
Levene's Test for
Equality of Variances T-test for Equality of Means
F Sig. t df
Sig. (2-
tailed)
Mean
Difference
Std. Error
Difference
95% Confidence Interval of the
Difference Lower Upper
Posttest Equal variances
assumed 18.290 .000 2.603 368 .010 4.94702 1.90053 1.20976 8.68429
Equal variances
not assumed
2.506 284.863 .013 4.94702 1.97388 1.06179 8.83226
Perceived Learning
Effectiveness
Equal variances
assumed .617 .433 11.844 368 .000 .63612 .05371 .53051 .74173
Equal variances
not assumed
11.983 355.503 .000 .63612 .05309 .53172 .74052
Satisfaction Equal variances
assumed 4.726 .030 13.963 368 .000 .81511 .05838 .70032 .92991
Equal variances
not assumed
14.210 360.633 .000 .81511 .05736 .70231 .92792

136
5.5.4 Testing of H04 H04: There is no interaction effect between the learners’ spatial abilities and the
learning modes, related to the performance achievement.
Two-way ANOVA was conducted to explore the effects of the learning modes and
spatial abilities on the performance achievement as measured by the posttest. The
independent variables were the learning modes, that is, VR mode and Non-VR mode
and spatial abilities, that is, low and high. The dependent variable was the posttest
scores. Table 5.11 presents the two-way ANOVA results. The Levene’s test of
equality of error variances showed a significant result (Sig. value less than 0.05),
thus a more stringent significance level of 0.01 was used. The interaction effect was
statistically significant [F(1, 366) = 10.75, p = 0.001]. An inspection of Figure 5.3
reveals that the effect of learning mode was much greater for the low spatial ability
group than it was for the high spatial ability group. Indeed, an analysis of simple
effects with independent-samples t-test showed that the learning mode effect was not
significant for the high spatial ability group but it was significant for the low spatial
ability group. Therefore, there was no evidence that performance achievement of the
high spatial ability learners in the VR mode [M = 70.35, SD = 16.05] differ from the
Non-VR mode [M = 71.84, SD = 14.83, t(177) = 0.629, p = 0.530] (see Table 5.12 &
Table 5.13). However, there was evidence that performance achievement of the low
spatial ability learners in the VR mode differs from the Non-VR mode. The low
spatial ability learners in the VR mode [M = 60.67, SD = 13.74] scored higher in the
posttest than the low spatial ability learners in the Non-VR mode [M = 50.86, SD =
20.52, t(143.121) = 3.790, p < 0.0005] (see Table 5.12 & Table 5.14).
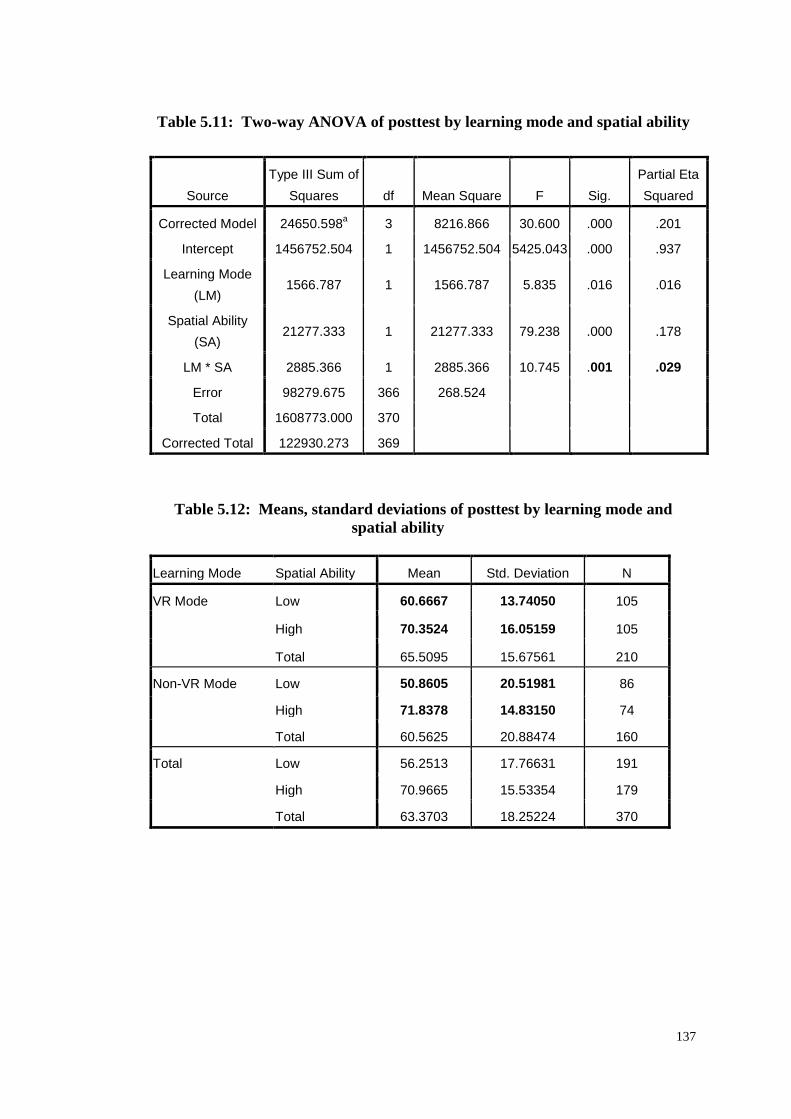
137
Table 5.11: Two-way ANOVA of posttest by learning mode and spatial ability
Source Type III Sum of
Squares df Mean Square F Sig. Partial Eta Squared
Corrected Model 24650.598a 3 8216.866 30.600 .000 .201
Intercept 1456752.504 1 1456752.504 5425.043 .000 .937
Learning Mode (LM)
1566.787 1 1566.787 5.835 .016 .016
Spatial Ability (SA)
21277.333 1 21277.333 79.238 .000 .178
LM * SA 2885.366 1 2885.366 10.745 .001 .029
Error 98279.675 366 268.524
Total 1608773.000 370
Corrected Total 122930.273 369
Table 5.12: Means, standard deviations of posttest by learning mode and spatial ability
Learning Mode Spatial Ability Mean Std. Deviation N
VR Mode Low 60.6667 13.74050 105
High 70.3524 16.05159 105
Total 65.5095 15.67561 210
Non-VR Mode Low 50.8605 20.51981 86
High 71.8378 14.83150 74
Total 60.5625 20.88474 160
Total Low 56.2513 17.76631 191
High 70.9665 15.53354 179
Total 63.3703 18.25224 370

138
Figure 5.3: Plot of interaction between learning mode and spatial ability, related to performance achievement

139
Table 5.13: T-test of posttest by learning mode for high spatial ability learners
Levene's Test for
Equality of Variances T-test for Equality of Means
F Sig. t df
Sig. (2-
tailed)
Mean
Difference
Std. Error
Difference
95% Confidence Interval of
the Difference Lower Upper
Posttest Equal variances assumed .936 .335 .629 177 .530 1.48546 2.36170 -3.17526 6.14618
Equal variances not
assumed
.638 164.556 .525 1.48546 2.32948 -3.11406 6.08497
Table 5.14: T-test of posttest by learning mode for low spatial ability learners
Levene's Test for
Equality of Variances T-test for Equality of Means
F Sig. t df
Sig. (2-
tailed)
Mean
Difference
Std. Error
Difference
95% Confidence Interval of
the Difference Lower Upper
Posttest Equal variances
assumed 19.839 .000 3.937 189 .000 9.80620 2.49056 4.89333 14.71907
Equal variances not
assumed
3.790 143.121 .000 9.80620 2.58731 4.69192 14.92048

140
5.5.5 Testing of H05 H05: There is no interaction effect between the learners’ spatial abilities and the
learning modes, related to the perceived learning effectiveness.
Two-way ANOVA was conducted to explore the effects of the learning modes and
spatial abilities on perceived learning effectiveness. The independent variables were
the learning modes, that is, VR mode and Non-VR mode and spatial abilities, that is,
low and high. The dependent variable was the perceived learning effectiveness. The
Levene’s test of equality of error variances showed a non-significant result (Sig.
value more than 0.05), thus the significance level of 0.05 was used.
Figure 5.4 shows the interaction between learning mode and spatial ability, related to
perceived learning effectiveness. Results in Table 5.15 shows the interaction effect
between learning mode and spatial ability was not statistically significant, [F(1, 366)
= 1.312, p = 0.253]. This means the difference in perceived learning effectiveness
between the learning modes did not vary as a function of learners’ spatial abilities.
However, there was a main effect for learning modes [F(1,366) = 138.41, p <
0.0005] and for spatial ability [F(1, 366) = 5.94, p = 0.015]. This means that there
was a difference in perceived learning effectiveness for the two learning modes as
well as for the high and low spatial ability learners. The mean score for the VR mode
across the high and low spatial ability learner was higher than the Non-VR mode as
reported in Section 5.5.2. The mean score of perceived learning effectiveness for the
high spatial ability learners across the two learning modes was higher than the mean
score of perceived learning effectiveness for the low spatial ability learners [M =

141
3.74, SD = 0.58 versus M = 3.59, SD = 0.61] (see Table 5.16). However, the
difference was small. The effect size was only 0.016 which was small according to
Cohen’s (1988) interpretation (see Table 5.15).
Table 5.15: Two-way ANOVA of perceived learning effectiveness by learning mode and spatial ability
Source Type III Sum of
Squares df Mean Square F Sig. Partial Eta Squared
Corrected Model 38.456a 3 12.819 49.551 .000 .289
Intercept 4751.233 1 4751.233 18366.040 .000 .980
Learning Mode (LM)
35.807 1 35.807 138.413 .000 .274
Spatial Ability (SA)
1.536 1 1.536 5.939 .015 .016
LM * SA .339 1 .339 1.312 .253 .004
Error 94.683 366 .259
Total 5094.453 370
Corrected Total 133.139 369
Table 5.16: Means, standard deviations of perceived learning effectiveness by
learning mode and spatial ability
Learning Mode Spatial Ability Mean Std. Deviation N
VR Group Low 3.9024 .53146 105
High 3.9714 .52927 105
Total 3.9369 .53022 210
Non-VR Group Low 3.2122 .48396 86
High 3.4037 .47206 74
Total 3.3008 .48651 160
Total Low 3.5916 .61474 191
High 3.7367 .57763 179
Total 3.6618 .60067 370

142
Figure 5.4: Plot of interaction between learning mode and spatial ability,
related to perceived learning effectiveness 5.5.6 Testing of H06 H06: There is no interaction effect between the learners’ spatial abilities and the
learning modes, related to the satisfaction.
Two-way ANOVA was conducted to explore the effects of the learning modes and
spatial ability on satisfaction. The independent variables were the learning modes,
that is, VR mode and Non-VR mode and spatial abilities, that is, low and high. The
dependent variable was the satisfaction. The Levene’s test of equality of error
variances showed a non-significant result (Sig. value more than 0.05), thus the
significance level of 0.05 was used.

143
The results of two-way ANOVA were shown in Table 5.17. There was no
significant interaction effect between learning mode and spatial ability on
satisfaction, [F(1, 366) = 0.225, p = 0.635]. This indicates that the difference in the
satisfaction between the learning modes did not vary as a function of learners’ spatial
abilities. Figure 5.5 illustrates the interaction between the learning modes and the
students’ spatial abilities on satisfaction. There was a main effect for learning modes
[F(1,366) = 194.28, p < 0.0005] and for spatial ability [F(1, 366) = 4.592, p = 0.033].
This means that there was a difference in satisfaction for the two learning modes. In
fact, the early statistical analysis in Section 5.5.3 had revealed that this difference
was significant. The mean score of satisfaction for the high spatial ability learners
across the two learning modes [M = 3.75, SD = 0.70] was higher than the mean score
of satisfaction for the low spatial ability learners [M = 3.60, SD = 0.67] (see Table
5.18). However, the difference was small because the effect size was small (0.012)—
see Table 5.17.
Table 5.17: Two-way ANOVA of satisfaction by learning mode and spatial
ability
Source
Type III Sum of
Squares df Mean Square F Sig.
Partial Eta
Squared
Corrected Model 61.930a 3 20.643 67.285 .000 .355
Intercept 4741.584 1 4741.584 15454.638 .000 .977
Learning Mode
(LM) 59.606 1 59.606 194.280 .000 .347
Spatial Ability (SA) 1.409 1 1.409 4.592 .033 .012
LM * SA .069 1 .069 .225 .635 .001
Error 112.291 366 .307
Total 5163.168 370
Corrected Total 174.221 369

144
Table 5.18: Means, standard deviations of satisfaction by learning mode and spatial ability
Learning Mode Spatial Ability Mean Std. Deviation N
VR Mode Low 3.9483 .58705 105
High 4.1007 .57789 105
Total 4.0245 .58609 210
Non-VR Mode Low 3.1645 .48135 86
High 3.2616 .54926 74
Total 3.2094 .51453 160
Total Low 3.5954 .66722 191
High 3.7538 .70039 179
Total 3.6720 .68713 370
Figure 5.5: Plot of interaction between learning mode and spatial ability, related to satisfaction

145
5.5.7 Testing of H07 H07: There is no interaction effect between the learners’ learning styles and the
learning modes, related to the performance achievement.
Two-way ANOVA was conducted to explore the effects of the learning modes and
learning styles on performance achievement. The independent variables were the
learning modes, that is, VR mode and Non-VR mode and learning styles, that is,
accommodator learners and assimilator learners. The dependent variable was the
performance achievement as measured by the posttest. The Levene’s test of equality
of error variances showed a significant result (Sig. value less than 0.05), thus a more
stringent significance level of 0.01 was used.
The interaction effect between learning mode and learning style, and the main effect
of learning mode and learning style are shown in Table 5.19. There was no
significant interaction effect, [F(1, 366) = 0.175, p = 0.676]. This means that the
difference in the performance achievement between the two learning modes did not
vary as a function of students’ learning styles. Figure 5.6 illustrates the interaction
between learning mode and learning style on performance achievement. The main
effect for learning modes [F(1,366) = 7.548, p = 0.006] was significant. In fact, the
earlier statistical analysis in Section 5.5.1 had revealed that this difference was
statistically significant. The main effect for learning style, [F(1, 366) = 0.929, p =
0.336], did not reach statistical significance indicating that accommodator learners
[M = 62.97, SD = 18.34] and assimilator learners [M = 63.75, SD = 18.21] did not

146
differ in their performance achievement across the two learning modes (see Table
5.20).
Table 5.19: Two-way ANOVA of posttest by learning mode and learning style
Source Type III Sum of
Squares df Mean Square F Sig. Partial Eta Squared
Corrected Model 2552.244a 3 850.748 2.587 .053 .021
Intercept 1380061.037 1 1380061.037 4195.968 .000 .920
Learning Mode (LM)
2482.388 1 2482.388 7.548 .006 .020
Learning Style (LS)
305.430 1 305.430 .929 .336 .003
LM * LS 57.529 1 57.529 .175 .676 .000
Error 120378.029 366 328.902
Total 1608773.000 370
Corrected Total 122930.273 369

147
Table 5.20: Means, standard deviations of posttest by learning mode and learning style
Group Learning Style Mean Std. Deviation N
VR Mode Accommodator 65.0504 15.72100 119
Assimilator 66.1099 15.68258 91
Total 65.5095 15.67561 210
Non-VR Mode Accommodator 58.9016 22.16883 61
Assimilator 61.5859 20.09976 99
Total 60.5625 20.88474 160
Total Accommodator 62.9667 18.33515 180
Assimilator 63.7526 18.21352 190
Total 63.3703 18.25224 370
Figure 5.6: Plot of interaction between learning mode and learning style, related to performance achievement

148
5.5.8 Testing of H08
H08: There is no interaction effect between the learners’ learning styles and the
learning modes, related to the perceived learning effectiveness.
Two-way ANOVA was conducted to explore the effects of the learning modes and
learning styles on perceived learning effectiveness. The independent variables were
the learning modes, that is, the VR mode and Non-VR mode and learning styles, that
is, accommodator learners and assimilator learners. The dependent variable was the
perceived learning effectiveness. The Levene’s test of equality of error variances
showed a non-significant result (Sig. value more than 0.05), thus a significance level
of 0.05 was used.
The two-way ANOVA results are shown in Table 5.21. There was no significant
interaction effect [F(1, 366) = 0.204, p = 0.652] which means learning styles did not
moderate the effects of learning modes on perceived learning effectiveness. Figure
5.7 illustrates the interaction between learning mode and learning style on perceived
learning effectiveness. The main effect for learning modes [F(1,366) = 131.063, p <
0.0005] was significant. The earlier statistical analysis in Section 5.5.2 had
confirmed this difference was significant. The main effect for learning style, [F(1,
366) = 0.344, p = 0.558] was not significant. This means that accommodator
learners [M = 3.74, SD = 0.59] and assimilator learners [M = 3.59, SD = 0.61] did
not differ in terms of their perceived learning effectiveness across the two learning
modes (see Table 5.22).
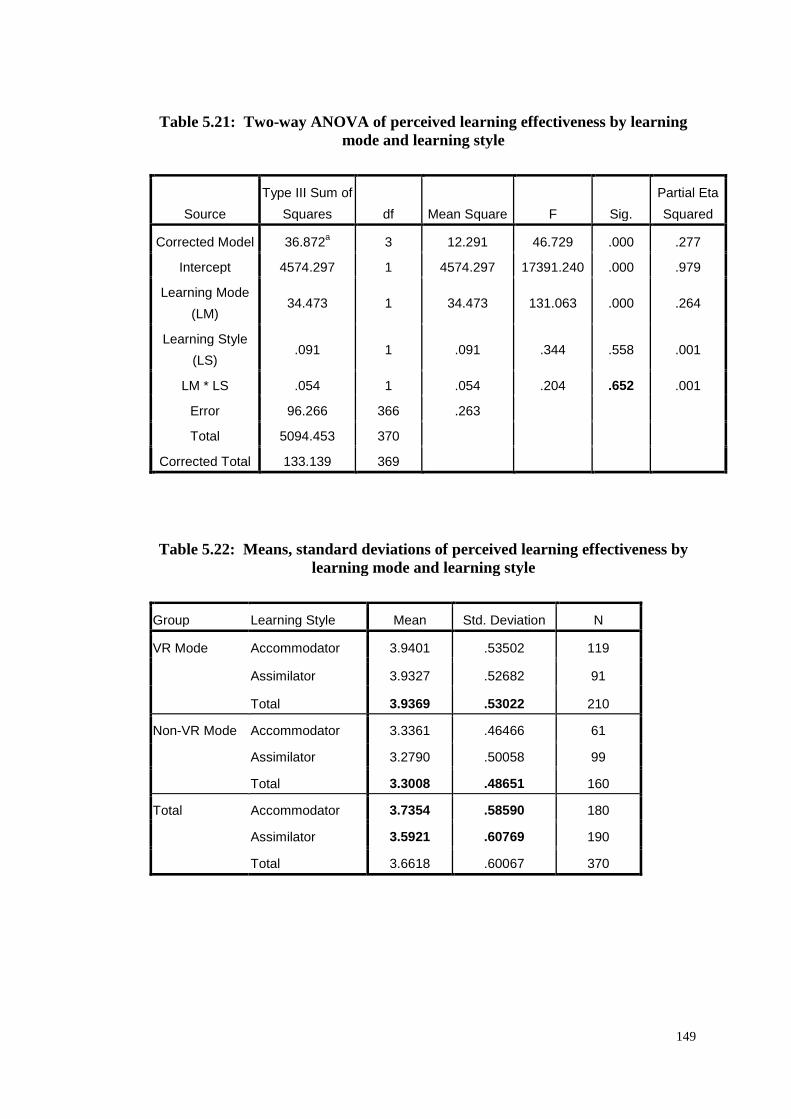
149
Table 5.21: Two-way ANOVA of perceived learning effectiveness by learning mode and learning style
Source Type III Sum of
Squares df Mean Square F Sig. Partial Eta Squared
Corrected Model 36.872a 3 12.291 46.729 .000 .277
Intercept 4574.297 1 4574.297 17391.240 .000 .979
Learning Mode (LM)
34.473 1 34.473 131.063 .000 .264
Learning Style (LS)
.091 1 .091 .344 .558 .001
LM * LS .054 1 .054 .204 .652 .001
Error 96.266 366 .263
Total 5094.453 370
Corrected Total 133.139 369
Table 5.22: Means, standard deviations of perceived learning effectiveness by learning mode and learning style
Group Learning Style Mean Std. Deviation N
VR Mode Accommodator 3.9401 .53502 119
Assimilator 3.9327 .52682 91
Total 3.9369 .53022 210
Non-VR Mode Accommodator 3.3361 .46466 61
Assimilator 3.2790 .50058 99
Total 3.3008 .48651 160
Total Accommodator 3.7354 .58590 180
Assimilator 3.5921 .60769 190
Total 3.6618 .60067 370

150
Figure 5.7: Plot of interaction between learning mode and learning style, related to perceived learning effectiveness
5.5.9 Testing of H09 H09: There is no interaction effect between the learners’ learning styles and the
learning modes, related to the satisfaction.
Two-way ANOVA was conducted to explore the effects of the learning modes and
learning styles on satisfaction. The independent variables were the learning modes,
that is, the VR mode and Non-VR mode and learning styles, that is, accommodator
learners and assimilator learners. The dependent variable was the satisfaction. The
Levene’s test of equality of error variances showed non-significant result (Sig. value
more than 0.05), thus a significance level of 0.05 was used.

151
The results in Table 5.23 show no significant interaction effect [F(1, 366 = 1.923, p
= 0.166]. This mean the difference in the satisfaction between the two learning
modes did not vary as a function of learners’ learning styles. The main effect for
learning modes [F(1,366) = 188.444, p < 0.0005] was significant. In actual fact, the
earlier statistical analysis in Section 5.5.3 had revealed this difference was
significant. The main effect for learning style, [F(1, 366) = 0.343, p = 0.558] did not
reach statistical significance. This means that accommodator learners [M = 3.72, SD
= 0.66] and assimilator learners [M = 3.62, SD = 0.71] did not differ in terms of their
satisfaction (see Table 5.24). Figure 5.8 illustrates the interaction effect between the
two learning modes and the learning styles on satisfaction.
Table 5.23: Two-way ANOVA of satisfaction by learning mode and learning style
Source Type III Sum of
Squares df Mean Square F Sig. Partial Eta Squared
Corrected Model 61.133a 3 20.378 65.951 .000 .351
Intercept 4578.586 1 4578.586 14818.187 .000 .976
Learning Mode (LM)
58.226 1 58.226 188.444 .000 .340
Learning Style (LS)
.106 1 .106 .343 .558 .001
LM * LS .594 1 .594 1.923 .166 .005
Error 113.088 366 .309
Total 5163.168 370
Corrected Total 174.221 369

152
Table 5.24: Means, standard deviations of satisfaction by learning mode and learning style
Group Learning Style Mean Std. Deviation N
VR Mode Accommodator 3.9736 .59833 119
Assimilator 4.0911 .56605 91
Total 4.0245 .58609 210
Non-VR Mode Accommodator 3.2389 .47718 61
Assimilator 3.1912 .53781 99
Total 3.2094 .51453 160
Total Accommodator 3.7246 .65874 180
Assimilator 3.6222 .71112 190
Total 3.6720 .68713 370
Figure 5.8: Plot of interaction between learning mode and learning style,
related to satisfaction
153
5.5.10 Testing of H10
H10: There is no significant difference in the performance achievement for high and
low spatial ability learners in the VR mode.
The basic assumption of homogeneity of variances was not violated. In other words,
the variance of posttest scores for the two groups (high and low spatial ability
learners) was the same. Thus, t-value under “Equal variance assumed” was reported.
The statistical results rejected the null hypothesis (p < 0.05). There was a significant
difference in the posttest scores for high spatial ability learners [M = 70.35, SD =
16.05] and low spatial ability learners [M = 60.67, SD = 13.74; t(208) = -4.697, p <
0.0005] in the VR mode (see Table 5.25 & Table5.26). High spatial ability learners
have higher posttest scores than low spatial ability learners in the VR mode. The
magnitude of the differences in the means was moderate (eta squared = 0.10). So,
10% of the variance in posttest scores was explained by spatial ability.
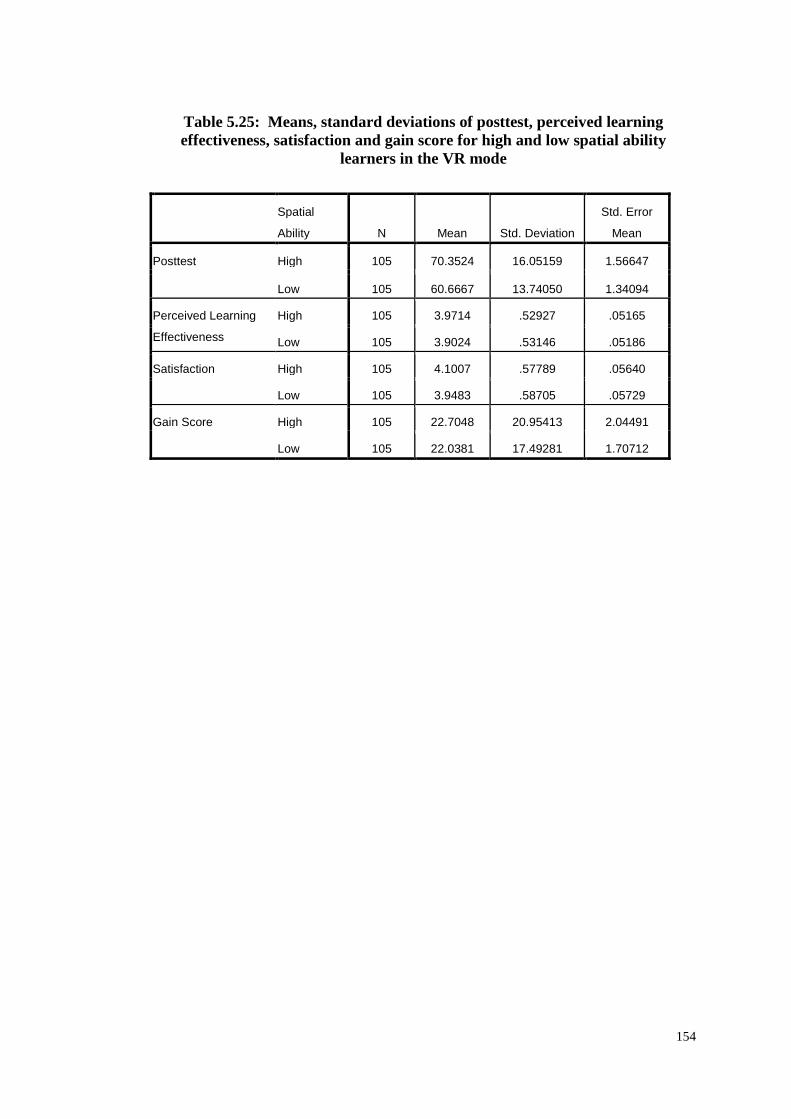
154
Table 5.25: Means, standard deviations of posttest, perceived learning effectiveness, satisfaction and gain score for high and low spatial ability
learners in the VR mode
Spatial
Ability N Mean Std. Deviation
Std. Error
Mean
Posttest High 105 70.3524 16.05159 1.56647
Low 105 60.6667 13.74050 1.34094
Perceived Learning
Effectiveness
High 105 3.9714 .52927 .05165
Low 105 3.9024 .53146 .05186
Satisfaction High 105 4.1007 .57789 .05640
Low 105 3.9483 .58705 .05729
Gain Score High 105 22.7048 20.95413 2.04491
Low 105 22.0381 17.49281 1.70712

155
Table 5.26: T-test of posttest, perceived learning effectiveness, satisfaction and gain score for high and low spatial ability learners in the VR mode
Levene's Test for
Equality of Variances T-test for Equality of Means
F Sig. t df
Sig. (2-
tailed)
Mean
Difference
Std. Error
Difference
95% Confidence Interval
of the Difference
Lower Upper
Posttest Equal variances assumed 2.196 .140 -4.697 208 .000 -9.68571 2.06203 -13.75086 -5.62057
Equal variances not
assumed
-4.697 203.168 .000 -9.68571 2.06203 -13.75143 -5.62000
Perceived Learning Equal variances assumed .648 .422 -.943 208 .347 -.06905 .07320 -.21335 .07526
Equal variances not
assumed
-.943 207.996 .347 -.06905 .07320 -.21335 .07526
Satisfaction Equal variances assumed .045 .833 -1.895 208 .059 -.15238 .08039 -.31087 .00611
Equal variances not
assumed
-1.895 207.949 .059 -.15238 .08039 -.31087 .00611
Gain Score Equal variances assumed 6.413 .012 -.250 208 .803 -.66667 2.66382 -5.91822 4.58488
Equal variances not
assumed
-.250 201.570 .803 -.66667 2.66382 -5.91920 4.58586

156
5.5.11 Testing of H11
H11: There is no significant difference in the perceived learning effectiveness for
high and low spatial ability learners in the VR mode.
The significance level of Levene’s test was more than 0.05, thus there was no
significant difference in the variance of the perceived learning effectiveness for both
groups. The statistical results did not reject the null hypothesis (p > 0.05). There was
no significant difference in perceived learning effectiveness for high spatial ability
learners [M = 3.97, SD = 0.53] and low spatial ability learners [M = 3.90, SD = 0.53;
t(208) = -0.943, p = 0.347] in the VR mode (see Table 5.25 & Table 5.26).
5.5.12 Testing of H12
H12: There is no significant difference in the satisfaction for high and low spatial
ability learners in the VR mode.
The variance of the satisfaction was the same as the significance level of Levene’s
test was more than 0.05, thus t-value under “Equal variance assumed” was reported.
The statistical results did not reject the null hypothesis (p > 0.05). There was no
significant difference in the satisfaction for high spatial ability learners [M = 4.10,
SD = 0.58] and low spatial ability learners [M = 3.95, SD = 0.59; t(208) = -1.895, p
= 0.059] in the VR mode (see Table 5.25 & Table 5.26).

157
5.5.13 Testing of H13
H13: There is no significant difference in the overall improvement in performance
for high and low spatial ability learners in the VR mode.
The significance level of Levene’s test was less than 0.05; the t-value under “Equal
variance not assumed” was thus reported. The statistical results did not reject the null
hypothesis (p > 0.05). There was no significant difference in overall improvement of
performance (gain scores) for high spatial ability learners [M = 22.70, SD = 20.95]
and low spatial ability learners [M = 22.04, SD = 17.49; t(201.57) = -0.250, p =
0.803] in the VR mode (see Table 5.25 & Table 5.26).
5.5.14 Testing of H14
H14: There is no significant difference in the performance achievement for
accommodator learners and assimilator learners in the VR mode.
The significance level of Levene’s test was more than 0.05, thus the basic
assumption of equal variances of the posttest scores for both groups (accommodator
learners and assimilators learners) was not violated. The statistical results did not
reject the null hypothesis (p > 0.05). There was no significant difference in the
performance achievement for accommodator learners [M = 65.05, SD = 15.72] and
assimilator learners [M = 66.11, SD = 15.68; t(208) = -0.484, p = 0.629] in the VR
mode (see Table 5.27 & Table 5.28).

158
5.5.15 Testing of H15
H15: There is no significant difference in the perceived learning effectiveness for
accommodator learners and assimilator learners in the VR mode.
There was no violation in the assumption of equal variances of the perceived
learning effectiveness for both groups as the significance level of Levene’s test was
more than 0.05. The statistical results did not reject the null hypothesis (p > 0.05).
There was no significant difference in perceived learning effectiveness for
accommodator learners [M = 3.94, SD = 0.54] and assimilator learners [M = 3.93,
SD = 0.53; t(208) = 0.100, p = 0.920] in the VR mode (see Table 5.27 & Table 5.28).
Table 5.27: Means, standard deviations of posttest, perceived learning effectiveness, satisfaction and gain score for accommodator learners and
assimilator learners in the VR mode
Learning Style N Mean Std. Deviation Std. Error Mean
Posttest Accommodator 119 65.0504 15.72100 1.44114
Assimilator 91 66.1099 15.68258 1.64398
Perceived Learning
Effectiveness
Accommodator 119 3.9401 .53502 .04904
Assimilator 91 3.9327 .52682 .05523
Satisfaction Accommodator 119 3.9736 .59833 .05485
Assimilator 91 4.0911 .56605 .05934
Gain Scores Accommodator 119 23.4790 19.26657 1.76616
Assimilator 91 20.9231 19.25630 2.01861

159
Table 5.28: T-test of posttest, perceived learning effectiveness, satisfaction and gain score for accommodator learners and assimilator learners in the VR mode
Levene's Test for Equality
of Variances Tt-test for Equality of Means
F Sig. t df
Sig. (2-
tailed)
Mean
Difference
Std. Error
Difference
95% Confidence
Interval of the
Difference
Lower Upper
Posttest Equal variances assumed .029 .864 -.484 208 .629 -1.05947 2.18694 -5.37088 3.25194
Equal variances not
assumed
-.485 194.063 .628 -1.05947 2.18622 -5.37127 3.25234
Perceived Learning Equal variances assumed .000 .991 .100 208 .920 .00743 .07401 -.13848 .15334
Equal variances not
assumed
.101 195.294 .920 .00743 .07386 -.13823 .15310
Satisfaction Equal variances assumed .044 .834 -1.443 208 .151 -.11746 .08141 -.27795 .04303
Equal variances not
assumed
-1.454 198.803 .148 -.11746 .08080 -.27681 .04188
Gain Scores Equal variances assumed .005 .946 .953 208 .342 2.55591 2.68238 -2.73222 7.84404
Equal variances not
assumed
.953 193.879 .342 2.55591 2.68218 -2.73409 7.84592

160
5.5.16 Testing of H16
H16: There is no significant difference in the satisfaction for accommodator learners
and assimilator learners in the VR mode.
The Levene’s test revealed no significant difference in the variance of the
satisfaction for both groups. The statistical results did not reject the null hypothesis
(p > 0.05). There was no significant difference in satisfaction for accommodator
learners [M = 3.97, SD = 0.60] and assimilator learners [M = 4.09, SD = 0.57; t(208)
= -1.443, p = 0.151] in the VR mode (see Table 5.27 & Table 5.28).
5.5.17 Testing of H17
H17: There is no significant difference in the overall improvement in performance
for accommodator learners and assimilator learners in the VR mode.
The significance level of Levene’s test was more than 0.05, thus the basic
assumption of homogeneity of variances of the gain scores was not violated. The
statistical results did not reject the null hypothesis (p > 0.05). There was no
significant difference in overall improvement of performance (gain scores) for
accommodator learners [M = 23.48, SD = 19.27] and assimilator learners [M =
20.92, SD = 19.26; t(208) = 0.953, p = 0.342] in the VR mode (see Table 5.27 &
Table 5.28).

161
5.6 Summary of Hypotheses Testing
H01: There was a significant difference in the performance achievement as measured
by the posttest for learners of each learning mode. Therefore, H01 was not supported.
H02: There was a significant difference in the perceived learning effectiveness for
learners of each learning mode. Therefore, H02 was not supported.
H03: There was a significant difference in the satisfaction for learners of each
learning mode. Therefore, H03 was not supported.
H04: There was a significant interaction effect between the learners’ spatial ability
and the learning modes, related to the performance achievement. Therefore, H04 was
not supported.
H05: There was no significant interaction effect between the learners’ spatial ability
and the learning modes, related to perceived learning effectiveness. Therefore H05
was supported.
H06: There was no significant interaction effect between the learners’ spatial abilities
and the learning modes, related to the satisfaction. Therefore, H06 was supported.
H07: There was no significant interaction effect between the learners’ learning styles
and the learning modes, related to the performance achievement. Therefore, H07 was
supported.
162
H08: There was no significant interaction effect between the learners’ learning styles
and the learning modes, related to the perceived learning effectiveness. Therefore,
H08 was supported.
H09: There was no significant interaction effect between the learners’ learning styles
and the learning modes, related to the satisfaction. Therefore, H09 was supported.
H10: There was significant difference in the performance achievement for high and
low spatial abilities learners in the VR mode. Therefore, H10 was not supported.
H11: There was no significant difference in the perceived learning effectiveness for
high and low spatial ability learners in the VR mode. Therefore, H11 was supported.
H12: There was no significant difference in the satisfaction for high and low spatial
ability learners in the VR group. Therefore, H12 was supported
H13: There was no significant difference in the overall improvement in performance
for high and low spatial ability learners in the VR mode. Therefore, H13 was
supported.
H14: There was no significant difference in the performance achievement for
accommodator learners and assimilator learners in the VR mode. Therefore, H14 was
supported.

163
H15: There was no significant difference in the perceived learning effectiveness for
accommodator learners and assimilator learners in the VR mode. Therefore, H15 was
supported.
H16: There was no significant difference in the satisfaction for accommodator
learners and assimilator learners in the VR mode. Therefore, H16 was supported.
H17: There was no significant difference in the overall improvement in performance
for accommodator learners and assimilator learners in the VR mode. Therefore, H17
was supported.
5.7 Summary This chapter reports the results of the learning effectiveness of a desktop VR-based
learning environment as compared to the conventional classroom learning practice
and ATI research. The effects of individual difference were also investigated for
students in the VR learning mode. The findings indicated that students’ performance
achievement was better in the VR mode and the students’ perception on learning
effectiveness and satisfaction was higher for the VR mode.
There was an interaction effect between the learners’ spatial abilities and the learning
modes on performance achievement. The simple effect analysis revealed that the
performance achievement was significantly different for low spatial ability learners
between both learning modes, but was not statistically significant for high spatial
ability learners. However, there was no interaction effect between the learners’

164
spatial ability and the learning modes on perceived learning effectiveness and
satisfaction.
The findings also indicated there was no interaction effect between the learners’
learning styles and the learning modes on performance achievement, perceived
learning effectiveness and satisfaction.
For students’ performance in the VR mode, there was a significant difference
between high and low spatial ability learners in the performance achievement with
high spatial ability learners having a better score in the posttest. However, there was
no significant difference between high and low spatial ability learners in the overall
improvement in performance, perceived learning effectiveness and satisfaction.
In terms of learning styles, no significant difference was found between
accommodator learners and assimilator learners in the performance achievement,
overall improvement in performance, perceived learning effectiveness and
satisfaction. The findings to research questions 1–6 and hypotheses testing were
summarized in Table 5.29. The results of this chapter are discussed in detail in
Chapter 7.

165
Table 5.29: Summary of the findings to research questions 1–6 and hypotheses testing
RQ Test Dependent
Variables
Findings
1 Main effect LM
Performance Achievement
VR > Non-VR S
1 Main Effect LM
Perceived Learning
VR > Non-VR S
1 Main Effect LM
Satisfaction VR > Non-VR S
2 Interaction effect LM * SA
Performance Achievement
S
2 Interaction effect LM * SA
Perceived Learning
Effectiveness
NS
2 Interaction effect LM * SA
Satisfaction NS
2 Interaction effect LM * LS
Performance Achievement
NS
2 Interaction effect LM * LS
Perceived Learning
Effectiveness
NS
2 Interaction effect LM * LS
Satisfaction NS
3 VR Group Main effect
SA
Performance Achievement
H > L S
3 VR Group Main effect
SA
Perceived Learning
Effectiveness
H > L NS
3 VR Group Main effect
SA
Satisfaction H > L NS
4 VR Group Main effect
SA
Overall Improvement
H > L NS
5 VR Group Main effect
LS
Performance Achievement
As > Ac NS
5 VR Group Main effect
LS
Perceived Learning
Effectiveness
Ac > As NS
5 VR Group Main effect
LS
Satisfaction As > Ac NS
6 VR Group Main effect
LS
Overall Improvement
Ac > As NS
Notes: RQ = Research Question; LM = Learning Mode; SA = Spatial Ability; LS = Learning Style, H = High Spatial Ability Learners; L = Low Spatial Ability Learners; Ac = Accommodator learners; As = Assimilator learners; S = Significant; NS = Non Significant

166
Chapter 6
RESULTS: HOW DOES DESKTOP VR ENHANCE LEARNING OUTCOMES?
6.0 Overview
Apart from investigating the learning effectiveness of a desktop VR-based learning
environment, the purpose of this study is to develop a theoretical model for
evaluating how VR enhances the learning outcomes in order to provide more in-
depth empirical findings to guide future VR-based learning developmental
endeavors. Relevant constructs were identified and their relationships were
examined. The model does not merely focus on the input (VR technology) and
output (learning outcomes), but the process that the learners experience, such as the
interaction and learning experience. Moreover, the moderating effects of learner
characteristics on the structural paths were also investigated.
This chapter reports the results for the hypothesized model developed to investigate
how desktop VR enhances the learning outcomes. SEM was employed to evaluate
the model fit. This chapter first describes the characteristics of the sample, followed
by the reliability and validity of the instruments that were used in SEM. Next, it
presents the reliability and validity of the measurement models and the overall fit of
the structural model. It is followed by the analysis of the total effects estimated for
the hypothesized model and the analysis of the individual effect of mediating
variables, that is, the psychological factors of learning experience on the learning
outcomes. Subsequently, the effects of the moderator variables, the results on latent

167
mean testing and the findings of the hypotheses are presented. Finally, the chapter
ends with the summary of the findings to the research questions.
6.1 Characteristics of Sample
For this analysis, only those who participated in the VR mode were taken into
consideration. There were 232 students who participated in the VR mode. However,
out of these students, 22 of them did not fully complete all instruments, that is, they
were either absent in the pretest or posttest during the day of testing or did not return
the questionnaires. Therefore, the results from a total of 210 students were analyzed.
Out of 210 students in the VR mode, 41.9% (88) were male and 58.1% (122) were
female students. The mean age of the participants was 16 years old.
6.2 Evaluation of Assumptions for Confirmatory Factor Analysis
This section describes the assumptions for undertaking the maximum likelihood
estimation of SEM to test the goodness of fit of the hypothesized model. Maximum
likelihood estimation techniques in SEM assume multivariate normality and a
reasonable sample size.
6.2.1 Normality
Normality of the observed variables was assessed through examination of the critical
ratio of skewness and kurtosis. The absolute value of critical ratio of less than or
equal to two indicates that skewness and kurtosis are not significantly different from
zero, thus meeting the normality assumption (Brown, 1997). To improve the
normality of the measured variables, two cases of outliers were removed. Hence, the

168
data from 208 respondents was run with AMOS Version 16, which showed that the
normality assumption was not violated. The critical ratio of skewness and kurtosis
did not indicate high skewness and high kurtosis, as shown in Table 6.1.
Table 6.1: Assessment of normality
Variable Min Max Skew Critical ratio
Kurtosis Critical ratio
EASE 2.500 5.000 -0.112 -0.657 -0.475 -1.398 USE 2.500 5.000 -0.343 -2.018 -0.256 -0.753 REF 2.000 5.000 0.025 0.148 -0.045 -0.132
CONT 2.000 5.000 -.171 -1.009 0.353 1.040 COG 2.000 5.000 -0.230 -1.356 0.352 1.036 MOT 2.000 5.000 0.279 1.640 0.189 0.555 SAT 2.667 5.000 0.090 0.528 -0.867 -2.553
PERC 2.875 5.000 0.259 1.525 -0.461 -1.358 PERF 19.000 100.00 -0.046 -0.268 -.0.520 -1.532 PRES 1.000 5.000 -0.320 -1.886 0.151 0.446 IMM 2.750 5.000 -0.224 -1.321 -0.759 -2.234 REP 2.333 5.000 -0.225 -1.326 -0.072 -0.212
6.2.2 Sample Size
The reasonable sample size for maximum likelihood estimation is about 200 (Hox &
Bechger, 1998). The sample size for this study was 208 which met the reasonable
sample size requirement. Furthermore, the ratio of cases to observed variables
(indicators) is 17:1. As a rules of thumb, a ratio of 10:1 is considered sufficient
(Schumacker & Lomax, 2004). The ratio of cases to estimated (free) parameters was
6:1 which also met the general minimum requirement of 5:1 under the normal
distribution theory (Bentler & Chou, 1987). It is generally agreed that 100 to 150
subjects is the minimum satisfactory sample size when constructing structural
equation models (Ding, Velicer, & Harlow, 1995)

169
6.3 Measurement Models
This section presents the measurement model for each latent variable in the model.
The unidimensionality and internal consistency of the items that were measured with
Likert scale of each indicator were first determined. The measurement models were
then assessed based on the significance of each estimated coefficient or loadings, and
the convergent and discriminant validity. A detailed elaboration of these was given
in Section 4.6.1.2.1.
Exploratory factor analysis was first conducted to determine the unidimensionality of
the items in each measurement instrument. Internal consistency was tested with
Cronbach’s alpha coefficient. Criteria suggested by Nunnally (1978) were applied to
determine the adequacy of the reliability coefficients obtained for each measurement.
The number of items in each measurement and the source of the items were
elaborated in Section 4.3.4 to Section 4.3.14. Convergent validity was then
determined for latent variables (constructs) with multiple indicators. Discriminant
validity was also performed for all latent variables.
Before factor analysis was performed, assessment of the suitability of the data for
factor analysis was conducted. The assessment showed that factor analysis was
appropriate for all the multi-item measurement instruments because the correlation
coefficients among the items in all instruments were mostly greater than 0.3; the
Barlett’s test of sphericity was significant (p < 0.05); and the Kaiser-Meyer-Olkin
(KMO) was greater than 0.6 (Pallant, 2007). Guidelines recommended by Hair,
Anderson, Tatham and Black (1995) was used to determine the significance of the

170
factor loading of each item: loadings greater than 0.30 are considered significant;
loadings greater than 0.40 are considered more important; and loadings 0.50 or
greater are considered to be very significant.
Table 6.2 presents the test results on unidimensionality and reliability. The results
revealed unidimensionality was achieved for all items in the respective
measurements. The instruments also have good internal consistency as their
Cronbach’s alpha coefficient was greater than 0.7. The detailed assessment results
of the measurement models are as follows.
Table 6.2: Exploratory principal component and internal consistency analysis with actual data
Indicators Eigenvalues Factor Loadings Significant level of
correlation coefficient between pairs of items
Cronbach’s alpha
Representational Fidelity Component 1
2.199
0.820 – 0.883
0.01
0.816
Immediacy of Control Component 1
2.759
0.819 – 0.849
0.01
0.849
Perceived Usefulness Component 1
2.552
0.711 – 0.839
0.01
0.807
Perceived Ease of Use Component 1
2.234
0.693 – 0.802
0.01
0.728
Presence NA* NA* NA* NA* Motivation** Component 1 Component 2 Component 3 Component 4
5.171 1.407 1.223 1.119
0.500 – 0.853 0.376 – 0.850 0.527 – 0.743 0.572 – 0.825
Mostly significant at the 0.01 level
0.843
Cognitive Benefits Component 1
3.486
0.764 – 0.883
0.01
0.890
Control and Active Learning
Component 1
2.486
0.758 – 0.826
0.01
0.796 Reflective Thinking
Component 1
2.645
0.806 – 0.821
0.01
0.828 Perceived Learning
Component 1
4.167
0.693 – 0.779
0.01
0.867 Satisfaction Component 1
4.077
0.504 – 0.833
0.01
0.862
* Single item measurement; ** Exploratory principal component analysis with varimax rotation
171
6.3.1 VR Features
VR features construct consists of two indicators: representational fidelity and
immediacy of control. Factor analysis was first conducted to determine the
unidimensionality of these two indicators as well as their internal consistency. The
degree to which these two indicators were related to each other was determined with
correlation analysis.
Representational Fidelity
Representational Fidelity was measured by three items. An exploratory principal
component analysis revealed a single factor solution which had an eigenvalue of
2.199. All three items loaded significantly on the factor ranging from 0.820 to 0.883
as shown in Table 6.2. The correlation coefficients between pairs of these items were
all significant at the 0.01 level. The raw items have a Cronbach’s alpha coefficient
of 0.816. Consequently, representational fidelity was represented by the mean of the
responses across the three items, with higher scores indicating better representational
fidelity.
Immediacy of Control
Four items were used to measure participants’ opinion on immediacy of control. An
exploratory principal component analysis revealed a single factor solution which had
an eigenvalue of 2.759 (see Table 6.2). All four items loaded significantly on the
factor. The loadings ranged from 0.819 to 0.849. The correlation coefficients
between pairs of these items were all significant at the 0.01 level. The raw items
with a Cronbach’s alpha coefficient of 0.849 were then summed and averaged to

172
form the composite measure for immediacy of control. Higher scores indicated better
immediacy of control.
These two indicators of VR features were significantly correlated as shown in Table
6.3. As there were only two indicators to measure VR features, it was not possible to
determine measurement model fit in the initial modeling phase. However, the
measures of reliability of this scale were good. Composite reliability was 0.85 which
exceeded the threshold of 0.7, and average extracted variance was 0.79 which
exceeded the 0.5 threshold. Thus, the evidence supported the convergent validity of
the measurement model. Moreover, the C.R of indicators was greater than 1.96 and
thus can be considered valid indicators of the construct.
Table 6.3: Unstandardized parameter estimates (standardized parameter estimates), correlation matrix and validity measures for VR features
VR Features Estimate C.R. (1) (2) Parameter estimates (1) Representational Fidelity 0.98 (0.88) 16.336*** 1.000 (2) Immediacy of Control 1.00 (0.89) - 0.784** 1.000 Validity measures Composite reliability 0.9 (0.85) Average extracted variance 0.8 (0.79) Notes: ** p < 0.01, ***p < 0.001
6.3.2 Presence A single item was used to measure this variable as the main objective was to elicit
the opinion of the feeling of presence or “being there” while interacting with the VR
systems. Thus, measures of reliability and validity could not be calculated.

173
6.3.3 Motivation Motivation was measured by fifteen items of the Intrinsic Motivation Inventory
(IMI) by McAuley et al. (1989). The IMI was categorized into four sub-dimensions.
An exploratory principal component analysis (with varimax rotation) revealed four
factor solutions which was consistent with the study of McAuley et al. (1989). As
presented in Table 6.2, the eigenvalues for all four factors were 5.171, 1.407, 1.223
and 1.119 respectively. The loading factors ranged from 0.376 to 0.853. The
correlation coefficients between pairs of these items were mostly significant at the
0.01 level. The overall scale was used to measure motivation factor in this study.
The raw items with a Cronbach’s alpha of 0.843 were then summed and average to
form the composite measure for the motivation variable. Higher scores indicated
higher motivation.
6.3.4 Cognitive Benefits
Cognitive benefits were measured with five items. An exploratory principal
component analysis revealed a single factor solution with an eigenvalue of 3.486
(see Table 6.2). The factor loadings ranged from 0.764 to 0.883. The correlation
coefficients between pairs of these items were significant at the level of 0.01.
Cognitive benefits were represented by the mean of the responses across these five
items which had a Cronbach’s alpha of 0.890. Higher scores indicated greater
cognitive benefits.
174
6.3.5 Control and Active Learning
Learner control and active learning was measured by four items. An exploratory
principal component analysis depicted a single factor solution with an eigenvalue of
2.486 (see Table 6.2). The factor loadings ranged from 0.758 to 0.826. The
correlation coefficients between pairs of these items were significant at the level of
0.01. Its Cronbach’s alpha coefficient was 0.796. The mean score of all four items
was the composite measure for control and active learning. Higher scores indicated
greater control and active learning.
6.3.6 Reflective Thinking
Reflective thinking was measured by four items. An exploratory principal
component analysis described a single factor solution with an eigenvalue of 2.645
(see Table 6.2). The factor loadings ranged from 0.806 to 0.821. The correlation
coefficients between pairs of these items were significant at the 0.01 level. It had a
Cronbach’s alpha of 0.828. The mean score of these four items was calculated as the
composite measure that represented reflective thinking. Higher scores indicated
better reflective thinking.
6.3.7 Usability
Usability was measured by two indicators: perceived usefulness and perceived ease
of use. Factor analysis was first conducted to determine the unidimensionality of
these two indicators as well as their internal consistency.

175
Perceived Usefulness
An instrument of four items was used to measure perceived usefulness. An
exploratory principal component analysis revealed a single factor solution with an
eigenvalue of 2.552 (see Table 6.2). The factor loadings ranged from 0.711 to 0.839.
The correlation coefficients between pairs of these items were significant at the 0.01
level. The raw items with a Cronbach’s alpha of 0.807 were then summed and
averaged to represent the composite measure of perceived usefulness. Higher scores
indicated higher perceived usefulness.
Perceived Ease of Use
Perceived ease of use was measured by four items. An exploratory principal
component analysis showed a single factor solution with an eigenvalue of 2.234 (see
Table 6.2). The factor loadings ranged from 0.693 to 0.802. The correlation
coefficients between pairs of these items were significant at the level of 0.01.
Perceived ease of use was represented by the mean of the responses across these four
items which had a Cronbach’s alpha of 0.728. Higher scores indicated greater
perceived ease of use.
These two indicators of usability were significantly correlated as presented in Table
6.4. As there were only two indicators to measure VR features, it was not possible to
determine measurement model fit in the initial modeling phase. However, the
measures of validity of this scale have met the requirement. Average extracted
variance was 0.51 which was above the 0.5 rule of thumb. Composite reliability was
0.67 which was close to the threshold of 0.7 for composite reliability. According to

176
Hair et al. (2010), reliability between 0.6 and 0.7 could be acceptable if other
indicator of a model’s construct validity is good. Taken together, the scale was
deemed reliable. Moreover, the C.R. of the indicators was greater than 1.96, and thus
can be considered valid indicators of the construct.
Table 6.4: Unstandardized parameter estimates (standardized parameter estimates), correlation matrix and validity measures for usability
Usability Estimate C.R. (1) (2) Parameter estimates (1) Usefulness 1.00 (0.73) - 1.000 (2) Ease of Use 0.91 (0.69) 9.741*** 0.557** 1.000 Validity measures Composite reliability 0.67 Average extracted variance 0.51 Notes: **p < 0.01, *** p < 0.001 6.3.8 Learning Outcomes
Learning outcomes were measured by performance achievement, perceived learning
effectiveness and satisfaction. Factor analysis was first conducted to determine the
unidimensionality of perceived learning effectiveness and satisfaction as well as their
internal consistency. Content validity, a reliability test, and item analysis were
performed on posttest which measured performance achievement as elaborated in
Sections 4.3.1 and 4.7.2.
Perceived Learning Effectiveness
Eight items asked respondents about their opinions on perceived learning
effectiveness. An exploratory principal component analysis revealed a single factor
solution with an eigenvalue of 4.167 (see Table 6.2). The factor loadings ranged

177
from 0.693 to 0.779. The correlation coefficients between pairs of these items were
significant at the level of 0.01. The raw scores were summed and averaged to form
the composite measure of the perceived learning effectiveness variable. The
Cronbach’s alpha coefficient was 0.867, with higher scores indicating greater
perceived learning effectiveness.
Satisfaction
Satisfaction was measured by seven items. An exploratory principal component
analysis revealed a single factor solution with an eigenvalue of 4.077 (see Table 6.2).
The factor loadings ranged from 0.504 to 0.833. The correlation coefficients between
pairs of these items were significant at the level of 0.01. Satisfaction was represented
by the mean score of these seven items which had a Cronbach’s alpha of 0.862, with
higher scores indicating greater sense of satisfaction.
The learning outcomes construct has three indicator variables: performance
achievement, perceived learning effectiveness and satisfaction. These three
indicators were significantly correlated as shown in Table 6.5. It is possible to
determine the factor loadings but not the measurement model fit. Hence, no
goodness-of-fit statistics were provided. However, the measures of validity for this
scale have met the requirement of construct validity. Composite reliability was 0.70
and average extracted variance was 0.48 which was very close to the threshold of
0.5. The scale was therefore considered satisfactory for SEM. Moreover, the C.R. of
all indicators was greater than 1.96 and they thus can be considered valid indicators
of the construct.

178
Table 6.5: Unstandardized parameter estimates (standardized parameter estimates), correlation matrix and validity measures for learning outcomes
Learning Outcomes Estimate C.R. (1) (2) (3) Parameter estimates (1) Performance 8.13 (0.27) 2.959** 1.000 (2) Perceived Learning 0.74 (0.74) 3.761*** 0.200** 1.000 (3) Satisfaction 1.00 (0.90) - 0.243** 0.664** 1.000 Validity measures Composite reliability 0.70 Average extracted variance 0.48 Notes: **p < 0.01; ***p< 0.001
6.4 Discriminant Validity
Table 6.6 shows the implied correlations between the variables in the model.
Discriminant validity appeared to be satisfactory for all constructs as the estimated
correlations were not excessively high except for usability and learning outcomes.
The correlation between learning outcomes and usability was slightly higher than
0.9. However, it was evidenced that perceived usefulness and perceived ease of use
correlated more highly with usability than with learning outcomes. Similarly,
performance achievement, perceived learning effectiveness and satisfaction
correlated more highly with learning outcomes than with usability (see Table 6.6).
Discriminant validity is achieved if an indicator correlates more highly with the
construct that it is intended to measure than with other constructs (Garson, 2009;
Zen, 2007). Moreover, two constructs could be highly correlated and still be
absolutely distinct (Zen, 2007). Thus, a decision was made to accept the identified
constructs.

179
Table 6.6: Implied correlation between the variables in the model
1 2 3 4 5 6 7 8 9 10 11 12 13 14 15 1 1.000 2 .777 1.000 3 .660 .792 1.000 4 .772 .819 .666 1.000 5 .675 .825 .658 .689 1.000 6 .766 .879 .707 .750 .733 1.000 7 .566 .513 .427 .480 .440 .488 1.000 8 .816 .906 .864 .875 .803 .854 .648 1.000 9 .878 .676 .579 .678 .529 .672 .497 .716 1.000
10 .893 .688 .590 .690 .603 .684 .506 .729 .784 1.000 11 .564 .733 .580 .600 .604 .644 .376 .664 .495 .504 1.000 12 .534 .694 .549 .568 .572 .609 .356 .628 .469 .477 .508 1.000 13 .693 .769 .734 .743 .682 .725 .550 .849 .608 .619 .564 .534 1.000 14 .637 .708 .675 .683 .627 .667 .506 .781 .559 .569 .519 .491 .663 1.000 15 .208 .231 .221 .223 .205 .218 .165 .255 .183 .186 .170 .161 .217 .200 1.000
Notes: 1 = VR features; 2 = Usability; 3 = Reflective thinking; 4 = Control and active learning; 5 = Cognitive benefits; 6 = Motivation; 7 = Presence; 8 = Learning outcomes; 9 = Representation fidelity; 10 = Immediacy of control; 11 = Perceived usefulness; 12 = Perceived ease of use; 13 = Perceived learning effectiveness; 14 = Satisfaction; 15 = Performance achievement
180
6.5 Analysis of the Structural Model
Following the assessment of the measurement models, the structural model was
evaluated. The hypothesized model was evaluated based on three criteria: overall
goodness of fit, the feasibility and significance of estimated model coefficients and
the ability to explain the variance in the dependent variables. An acceptable model
should meet the criteria for acceptable fit, would contain only valid paths and explain
a moderate to high proportion of the variance in the dependent variables of interest.
Table 6.7 displays the standardized loading, C.R. and goodness-of-fit measure for
the hypothesized model. Figure 6.1 shows the standardized loading for each path,
and the multiple squares correlation (R2) for each dependent variable in the model.
All estimates were within the admissible range (i.e. correlation coefficient less than
one and no negative covariance) and in the theoretically expected directions. In
addition, based on a level of 0.05, all except three of the C.R.s were greater than 1.96
which indicated the significance of the estimated coefficients.
The goodness-of-fit measures indicated an acceptable fit of the model. The chi-
square goodness-of-fit statistic is not a good model fit index because it is sensitive to
sample sizes (Lin & Dembo, 2008). With large samples (generally more than 200),
even small deviations from fit may be statistically significant which may lead to
erroneous conclusions (Schumacker & Lomax, 2004). Hence, other fit indices were
used to look at the model fit. A detailed elaboration of model fit indices was given in
Section 4.6.1.2.2. Other fit indices have met the general guidelines of model fit.
The normed chi-square was 1.825 which was less than 3, the GFI was 0.942 which

181
was greater than 0.9, AGFI was 0.895 which was greater than 0.8, CFI was 0.979
which was greater than 0.95, TLI was 0.968 which was higher than 0.95 and
RMSEA was 0.063 which was below 0.08. All these goodness-of-fit measures
indicated that the model has a good fit to the data.
The third criterion used to evaluate the model was the proportion of variance in
dependent variables explained by the model. The squared multiple correlations, R2,
are measures of the ability of the model to explain the variance in the dependent
variables. The model explained a moderate to high proportion of the variances in
almost all of the dependent variables. The model explained 97% of the learning
outcomes. Learning outcomes accounted for 61% of the variability in the
satisfaction, 72% of the variability in perceived learning effectiveness, and 7% of the
variability in performance achievement. The model accounted for 59% of the
variance in usability, 42% in presence, 79% in motivation, 68% in cognitive benefits,
72% in control and active learning, and 63% in reflective thinking (see Figure 6.1).
The VR feature is a strong antecedent to usability (beta = 0.77, p < 0.001), presence
(beta = 0.42, p < 0.001), control and active learning (beta = 0.35, p < 0.001), and
motivation (beta = 0.22, p < 0.05). Usability is a strong antecedent to motivation
(beta = 0.71, p < 0.001), cognitive benefits (beta = 0.75, p < 0.001), control and
active learning (beta = 0.55, p < 0.001), and reflective thinking (beta = 0.70, p <
0.001). All the psychological learning factors are strong antecedents to learning
outcomes: presence (beta = 0.20, p < 0.001), motivation (beta = 0.16, p < 0.01),

182
cognitive benefits (beta = 0.14, p < 0.01), control and active learning (beta = 0.33, p
< 0.001) and reflective thinking (beta = 0.36, p < 0.001).
Table 6.7: Standardized loading, C.R. and goodness-of-fit measure for the hypothesized model
Hypothesis Path Standardized C.R.
From To Loading H1 VR Features Usability 0.770*** 9.064 H2 VR Features Presence 0.420*** 3.548 H3 VR Features Motivation 0.220* 2.262 H4 VR Features Cognitive benefits 0.098 0.890 H5 VR Features Control & active learning 0.348*** 3.686 H6 VR Features Reflective thinking 0.123 1.114 H7 Usability Presence 0.190 1.623 H8 Usability Motivation 0.709*** 6.805 H9 Usability Cognitive benefits 0.749*** 6.409 H10 Usability Control & active learning 0.551*** 5.656 H11 Usability Reflective thinking 0.697*** 6.011 H12 Presence Outcomes 0.200*** 4.645 H13 Motivation Outcomes 0.155** 2.383 H14 Cognitive benefits Outcomes 0.139** 2.421 H15 Control & active
learning Outcomes 0.327*** 5.369
H16 Reflective thinking Outcomes 0.360*** 6.340 Goodness-of-fit measures Chi-square ( 2χ ) 78.473
Degree of freedom (df) 43 Probability (p) 0.001 Normed chi-square ( 2χ /df) 1.825
Goodness-of-fit index (GFI) 0.942 Adjusted goodness-of-fit index 0.895 Comparative fit index (CFI) 0.979 Lewis Tucker index (LTI) 0.968 Root mean square error of approximation (RMSEA)
0.063
Notes: *p < 0.05; **p < 0.01; ***p < 0.001

183
Notes: *p < 0.05; **p < 0.01; ***p < 0.001 REP = Representation fidelity; IMM = Immediacy of control; USE = Perceived usefulness; EASE = Perceived ease of use; PERF = Performance achievement; PERC = Perceived learning; SAT = Satisfaction Figure 6.1: Structural equation model showing the standardized loading for each path, and the R2 for each dependent variable in the model
The results for the hypotheses associated with the model are stated below.
H1: VR features were significantly related to usability. Therefore, this hypothesis
was supported.
Chi-square = 78.473, df = 43, p = 0.001 Normed chi-square = 1.825
GFI = 0.942 AGFI = 0.895 CFI = 0.979 LTI = 0.968
RMSEA = 0.063

184
H2: VR features were significantly related to presence. Therefore, this hypothesis
was supported.
H3: VR features were significantly related to motivation. Therefore, this hypothesis
was supported.
H4: VR features were not significantly related to cognitive benefits. Therefore, this
hypothesis was not supported.
H5: VR features were significantly related to control and active learning. Therefore,
this hypothesis was supported.
H6: VR features were not significantly related to reflective thinking. Therefore, this
hypothesis was not supported.
H7: Usability was not significantly related to presence. Therefore, this hypothesis
was not supported.
H8: Usability was significantly related to motivation. Therefore, this hypothesis was
supported.
H9: Usability was significantly related to cognitive benefits. Therefore, this
hypothesis was supported.

185
H10: Usability was significantly related to control and active learning. Therefore,
this hypothesis was supported.
H11: Usability was significantly related to reflective thinking. Therefore, this
hypothesis was supported.
H12: Presence was significantly and positively related to learning outcomes.
Therefore, this hypothesis was supported.
H13: Motivation was significantly and positively related to learning outcomes.
Therefore, this hypothesis was supported.
H14: Cognitive benefits were significantly and positively related to learning
outcomes. Therefore, this hypothesis was supported.
H15: Control and active learning was significantly and positively related to learning
outcomes. Therefore, this hypothesis was supported.
H16: Reflective thinking was significantly and positively related to learning
outcomes. Therefore, this hypothesis was supported.
6.5.1 Total Effects Analysis
Besides the direct relationships reported in Table 6.7, relationships may be direct or
indirect, such that the relationship between two variables is mediated by one or more

186
intervening variables. Table 6.8 reports the standardized total effects (direct plus
indirect effects) estimated for the hypothesized model.
Table 6.8: Standardized total effects on dependent variables
VR Features
Usability Presence Motivation Cognitive Benefits
Control & Active Learning
Reflective Thinking
Usability 0.770 Presence 0.566 0.190 Motivation 0.766 0.709 Cognitive Benefits
0.675 0.749
Control & Active Learning
0.772 0.551
Reflective Thinking
0.660 0.697
Outcomes 0.816 0.683 0.200 0.155 0.139 0.327 0.360 Performance 0.208 0.174 0.051 0.040 0.035 0.084 0.092 Perceived Learning
0.693 0.580 0.170 0.131 0.118 0.278 0.306
Satisfaction 0.637 0.534 0.156 0.121 0.109 0.256 0.281 Note: Table shows total effects of each variable listed across the top of the table on each dependent variable listed in the left-hand column. The results confirmed the significant indirect effect of VR features and usability on
learning outcomes as supported by the model of Salzman et al. (1999). The
relationships of VR features and usability on learning outcomes were mediated by
learning experience. Likewise, some of relationships between VR features and
learning experience were mediated by usability (interaction experience). For the
relationships between VR features and learning outcomes, the total effect of VR
features was the strongest for perceived learning effectiveness (0.693), followed by
satisfaction (0.637) and performance achievement (0.208), whilst the total effect of
VR features on the psychological factors of learning experience was the strongest for
control and active learning (0.772). This was followed by motivation (0.766),
cognitive benefits (0.675), reflective thinking (0.660) and presence (0.566). These

187
psychological factors of learning experience, in turn have a significant direct effect
on learning outcomes (see Figure 6.1).
6.5.2 Individual Effect of Mediating Variables
Indirect effects through mediating variables could be further analyzed to examine
their individual effect. Table 6.9 presents the individual effect the learning
experience variables have upon the path of VR features to learning outcomes. The
decomposition indicated that the mediated effect of VR features on learning
outcomes which were measured by performance achievement, perceived learning
effectiveness and satisfaction was the strongest through control and active learning
(30.9%). This was followed by reflective thinking (29.2%), motivation (14.6%),
presence (13.8%) and cognitive benefits (11.5%).
Table 6.9: Individual effect of mediators
Path Indirect effects through
Presence Motivation Cognitive Benefits
Control & Active Learning
Reflective Thinking
Total Effects
VR Features to Outcomes
0.113 (13.8%)
0.119 (14.6%)
0.094 (11.5%)
0.252 (30.9%)
0.238 (29.2%)
0.816
VR Features to Performance
0.029 (13.9%)
0.030 (14.4%)
0.024 (11.5%)
0.064 (30.8%)
0.061 (29.3%)
0.208
VR Features to Perceived Learning
0.096 (13.9%)
0.101 (14.6%)
0.080 (11.5%)
0.214 (30.9%)
0.202 (29.1%)
0.693
VR Features to Satisfaction
0.088 (13.8%)
0.093 (14.6%)
0.073 (11.5%)
0.197 (30.9%)
0.186 (29.2%)
0.637

188
6.6 Moderating Effects of Student Characteristics
The subgroup analysis for the moderating effects of spatial ability and learning style
is presented in Table 6.10 and Table 6.11. The chi-square difference test was used to
examine the hypotheses. Spatial ability did not moderate all the paths from learning
experience to learning outcomes except for the path from control and active learning
to learning outcomes. The findings have also indicated that learning style did not
moderate all the paths from learning experience to learning outcomes.
Table 6.10: Spatial ability moderating effects
Hypothesis High Spatial Ability Group
Low Spatial Ability Group
Subgroup comparison (unconstrained) 2χ (86) =149.603
Result
Standardized Coefficient
C.R. Standardized Coefficient
C.R. Constrained 2χ (87)
2χ difference
H17 0.19** 2.484 0.19* 1.406 151.003 1.400 H = L H18 0.10 1.096 0.17 1.207 149.767 0.164 H = L H19 0.21** 2.078 0.13 1.148 151.951 2.348 H = L H20 0.39*** 2.932 0.30* 1.439 152.880 3.277* H > L H21 0.25*** 2.390 0.43* 1.534 149.871 0.268 H = L Notes: C.R. = Critical Ratio; H = High spatial ability group; L = Low spatial ability group *p < 0.10; ** p < 0.05; *** p < 0.01
Table 6.11: Learning style moderating effects
Hypothesis Accommodator Learner
Assimilator Learner
Subgroup comparison (unconstrained) 2χ (86) =171.483
Result
Standardized Coefficient
C.R. Standardized Coefficient
C.R. Constrained 2χ (87)
2χ difference
H22 0.13** 1.902 0.27* 1.588 171.529 0.046 AC = AS H23 0.19** 1.748 0.10 1.010 172.547 1.064 AC = AS H24 0.09 0.975 0.19* 1.416 171.548 0.065 AC = AS H25 0.38*** 2.595 0.30* 1.574 172.266 0.783 AC = AS H26 0.33*** 2.390 0.41* 1.621 171.588 0.105 AC = AS Notes: C.R. = Critical Ratio; AC = Accommodator Learner; AS = Assimilator Learner *p < 0.10; ** p < 0.05; *** p < 0.01
189
Based on the subgroup analysis in Table 6.10 and Table 6.11, the results for each of
the hypotheses are stated below.
H17: Spatial ability did not moderate the influence of presence on learning
outcomes. Therefore, this hypothesis was not supported.
H18: Spatial ability did not moderate the influence of motivation on learning
outcomes. Therefore, this hypothesis was not supported.
H19: Spatial ability did not moderate the influence of cognitive benefits on learning
outcomes. Thus, this hypothesis was not supported.
H20: Spatial ability moderated the influence of control and active learning on
learning outcomes. Therefore, this hypothesis was supported.
H21: Spatial ability did not moderate the influence of reflective thinking on learning
outcomes. Therefore, this hypothesis was not supported.
H22: Learning style did not moderate the influence of presence on learning
outcomes. Therefore, this hypothesis was not supported
H23: Learning style did not moderate the influence of motivation on learning
outcomes. This hypothesis was not supported.

190
H24: Learning style did not moderate the influence of cognitive benefits on learning
outcomes. This hypothesis was not supported.
H25: Learning style did not moderate the influence of control and active learning on
learning outcomes. This hypothesis was not supported.
H26: Learning style did not moderate the influence of reflective thinking on
learning outcomes. This hypothesis was not supported.
6.7 Latent Mean Testing
Latent Mean Testing was conducted to determine the main effects of spatial ability
and learning style on the VR features. In order to have the hypotheses meaningfully
tested, latent mean testing was conducted as in the following steps (Byrne, 2001): (1)
Variance of the exogenous construct (VR features) was freely estimated in each
group. (2) Means of the error terms are not estimated and remain constrained to zero.
Variances of the error terms are freely estimated in each group. (3) Except for those
fixed to 1.00, all factor loadings were constrained to be equal across groups. (4) All
intercepts for the observed measures were constrained to be equal across groups. (5)
The mean for exogenous construct (VR features) was freely estimated for one of the
group, but was constrained to zero for the other group. The latter group was
therefore regarded as the “reference” group.
Table 6.12 reports the results of latent mean testing across groups. To examine the
main effects of spatial ability, the high spatial ability group was set as the reference

191
group. The low spatial ability group has a latent mean estimate of -0.106 which
means the VR features mean was estimated to be 0.106 units below the high spatial
ability group. However, the low spatial ability group’s latent mean estimate has a
critical ratio of -1.429 which was not significantly different from zero (p = 0.153).
In other words, it was not significantly different from the latent mean of the high
spatial ability group. Hence, the perception of VR features was not significantly
different across groups.
Though the equality of constraints was imposed on both the factor loadings and the
observed variable intercepts across the two groups, the goodness-of-fit measures
show that the model fitted the data well (e.g. normed 2χ = 1.771; CFI = 0.949;
RMSEA = 0.061)—see Appendix H. Therefore, the results obtained could be
interpreted confidently.
Table 6.12: Latent mean difference across groups (for examining the main effects of spatial ability and learning style)
Group Estimate S.E. C.R. p
VR Features Spatial Ability -.106 .074 -1.429 .153 Learning Style .070 .072 .971 .332
To examine the main effects of learning style, the accommodator group was set as
the reference group. Assimilator learners have a latent mean estimate of 0.070
which means the VR features mean was estimated to be 0.070 units above the
accommodator learners. However, the assimilator learners’ latent mean estimate has
a critical ratio of 0.971 which was not significantly different from zero (p = 0.332).

192
In other words, it was not significantly different from the latent mean of the
accommodator learners. Hence, the perception of VR features was not significantly
different across the accommodator learners and assimilator learners.
Though the equality of constraints was imposed on both the factor loadings and the
observed variable intercepts across the two groups, the goodness-of-fit measures
show that the model fitted the data well (e.g. normed 2χ = 1.812; CFI = 0.947;
RMSEA = 0.063)—see Appendix H. Thus the results obtained could be interpreted
confidently.
Based on the latent mean testing, the following results were obtained.
H27: Spatial ability did not influence the perception on VR features. Thus, H27 was
not supported.
H28: Learning style did not influence the perception on VR features. Thus, H28 was
not supported.
6.8 Summary
This chapter reports the analysis of how desktop VR enhances the learning
outcomes. The fit of the hypothesized model was determined using SEM. First, the
unidimensionality and reliability of the measurements were determined. The results
of the factor analysis revealed unidimensionality was achieved for all items in the
respective measurements. Based on the criteria suggested by Nunnally (1978), the

193
measurements have good internal consistency. The reliability and validity of the
measurement models were investigated before the structural model was evaluated.
The results on convergent validity and discriminant validity of the measurement
models were considered satisfactory. Subsequently, the assessment of the structural
model indicated an acceptable fit of the model that supported the hypothesis that VR
features indirectly affect the learning outcomes. The model evaluation has provided
the answers to the seventh and eighth research questions of this study as summarized
below.
The seventh research question was:
What are the constructs that play an important role in a desktop VR-based
learning environment?
The SEM analysis indicated that the major significant constructs that affect the
learning outcomes in a VR-based learning environment are the VR features, usability
(interaction experience), psychological factors of learning experience, that is,
presence, motivation, cognitive benefits, control and active learning, and reflective
thinking. The findings revealed that all these constructs are interrelated in an input,
intermediary and output process to enhance learning. Student characteristics could
also influence the learning outcomes. Student characteristics, such as spatial ability,
have a minimal influence on certain structural path in the model.

194
The eighth research question was:
How do these constructs interrelate to enhance the VR-based learning
effectiveness?
VR features enhance the learning outcomes through usability and learning
experience. VR features have a strong and positive direct effect on usability. Results
have also shown that VR features were directly and significantly related to the
psychological factors of learning experience, that is, presence, control and active
learning, and motivation; however, they were indirectly and significantly related to
cognitive benefits and reflective thinking through usability. Among the indirect
effects of VR features to the learning outcomes through learning experience, the
mediating effect was the strongest through the psychological factor of control and
active learning. This was followed by reflective thinking, motivation, presence and
cognitive benefits.
Student characteristics did not moderate the path from the learning experience to the
learning outcomes in the VR-based learning environment except for the path from
control and active learning to learning outcomes. This path was moderated by
students’ spatial abilities. Overall, individual differences such as spatial abilities and
learning styles did not widen the gap of learning effectiveness among students in the
desktop VR-based learning environment.
The results of latent mean testing for examining the main effects of spatial ability
and learning style have indicated that there was no significant difference in the

195
perception of VR features across different subgroups. In other words, the perception
of the VR features is similar for both high and low spatial ability learners, and both
accommodator learners and assimilator learners.
The results reported in this chapter are discussed in detail in Chapter 7.

196
Chapter 7
DISCUSSION
7.0 Overview
The aims of this study were to determine “Does, and how does, desktop VR
influence the learning outcomes of the learners?” It investigated the learning
effectiveness of a desktop VR-based learning environment and developed a
theoretical model for evaluating how desktop VR enhances the learning outcomes.
The effects of two learning modes, the desktop VR-based learning environment (VR
mode) and conventional classroom learning method (Non-VR mode) on the learning
outcomes, the possible interaction effects between the learning modes and the
learners’ aptitudes, that is, spatial ability and learning style on learning, and the
effects of learners’ aptitudes on learning outcomes in the VR group were studied. A
theoretical model was developed to gain insights into the relevant constructs that
influence the learning outcomes in a desktop VR learning environment.
This chapter presents discussion and implications of the obtained empirical results. It
first discusses the results on “Does desktop VR influence the learning outcomes?”
and its effects on learners with different characteristics. The discussion and
implications on the learning outcomes is categorized into cognitive learning outcome
(i.e. performance achievement) and affective learning outcome (i.e. perceived
learning effectiveness and satisfaction). This is followed by the discussion and

197
implications of the results for the evaluation of the theoretical model on how desktop
VR enhances the learning outcomes.
7.1 Effects of the Learning Modes on Learning
The sample consisted of 370 Form Four science students, aged between 15 and 17
years old from four co-education secondary schools in a city of East Malaysia.
These students were exposed to different learning modes of the learning
environment. The independent variable was the learning mode (VR and Non-VR);
the moderator variables were the spatial ability (high and low) and the learning style
(accommodator learners and assimilator learners); and the dependent variables were
the performance achievement (cognitive outcome), and the perceived learning
effectiveness and satisfaction (affective outcome).
7.1.1 Cognitive Learning Outcome
The experimental results have shown that significantly higher scores were obtained
for the cognitive learning outcome in the desktop VR-based learning environment as
presented in Section 5.5.1. The result of better performance achievement was
consistent with the studies by Chen et al. (2005) and Yang and Heh (2007).
However, some studies have shown no obvious benefits of using desktop VR-based
learning over traditional instruction on students’ science achievement, as in the study
of Crosier et al. (2000). Nevertheless, it was argued that only those science
experiments that cover hands-on and minds-on activities and in which students could
be actively involved in the learning process can enhance the effect of computer
assisted learning (Berger, Lu, Belzer, & Voss, 1994; Chang & Barufaldi, 1999).
198
These activities were integrated in the software used in this study where the students
did the virtual dissection and enhanced their understanding by completing the lab
report that scaffolded their understanding. It is possible that these have helped the
students to grasp scientific facts and concepts more easily.
Furthermore, students controlled their own learning pace and were actively involved
in the learning activities because they made their own instructional decisions,
experienced and were responsible for the consequences of those decisions. Thus,
active and self-paced learning could be the partial cause as to why students’ learning
achievement was better in the desktop VR-based learning environment. This is
congruent with the principles of constructivism that advocate better learning results
with active learning (Jonassen, 1993; Roblyer, 2003).
The ability of VR technology to allow the user to see a person, place or thing as it
would appear in real life has opened up the possibilities of using this technology in
classrooms where students can learn about science anatomy, geography or
astronomy by interacting with the content rather than reading it in a textbook
(Nichols, 2009). Indeed, in the open-ended sections of the survey, one student wrote,
“Through it, self learning is not difficult and boring anymore. I learn more and
easily compared to reading from the text book.” Another wrote, “It helps me to
memorize the parts of the frog better than reading it from a book.”
The fact that students in the VR learning mode performed better than students in the
Non-VR learning mode could also be explained by the cognitive load theory

199
(Sweller, 1999). Cognitive load refers to the total amount of mental activity imposed
on working memory when processing information (Cooper, 1998; Sweller, 1999).
The process of learning requires working memory to be actively engaged in
comprehension of instructional material to encode to-be-learned information for
appropriate schema construction that will be stored in long-term memory (Cooper,
1998). The capacity of working memory is limited, thus the cognitive load theory
asserts that learning is inhibited when the working memory capacity is exceeded by
the total cognitive load in a learning task (Cooper, 1998; De Jong, 2009).
There are three types of cognitive load: intrinsic, extraneous and germane. Intrinsic
cognitive load refers to the difficulty of the content and cannot be changed by
instructional design and treatments. This is because it is determined by the
interaction between the nature of the materials being learned and the expertise of the
learner (Cooper, 1998; Sweller & Chandler, 1994; van Merriënboer & Sweller,
2005). Extraneous cognitive load is the load that does not directly contribute to
learning (i.e. schema construction), is evoked by the instructional material and can
be altered by instructional interventions (van Merriënboer & Sweller, 2005).
Germane cognitive load is the load that is necessary for learning and it results from
the way information is presented and the circumstances in which it is presented
(Khalil, Paas, Johnson, & Payer, 2005). These three cognitive loads are additive and
the sum should not exceed the memory resources available (see Figure 7.1).

200
Figure 7.1: Total cognitive load (Adapted from Cooper, 1998)
For learning to be effective, activities and representations that maximize germane
load should be provided while extraneous load should be minimized to ensure that
the total cognitive load is within the memory resources available. If the learning
content is difficult (a high intrinsic cognitive load) and if the strategy to present the
information has created a high extraneous cognitive load, then the total cognitive
load may exceed the available memory resources (see Figure 7.2). As a result,
learning will be impeded and may fail to occur.
Figure 7.2: An illustration of total cognitive load exceeding mental resources
(Adapted from Cooper, 1998) Based on the cognitive load theory, it is believed that students in the VR mode
performed better because the available memory resources were not exceeded by the
total cognitive load imposed. VR instructional intervention has helped to reduce
extraneous cognitive load and at the same time increase germane cognitive load. The
Total Cognitive Load
Intrinsic Cognitive Load
Extraneous Cognitive Load
Mental Resources (exceeded by cognitive load requirement)
Intrinsic Cognitive Load
Extraneous Cognitive Load
Germane Cognitive Load
Total Cognitive Load
Intrinsic Cognitive Load
Extraneous Cognitive Load
Germane Cognitive Load

201
ability to control the learning activities while interacting with the dynamic
visualizations allows learners to adapt the instructional material to their cognitive
system to decrease extraneous load; and engages learners in active processing of
instructional material to increase germane cognitive load (Bodemer, Ploetzner,
Feuerlein, & Spada, 2004; Khalil et al., 2005; Schwan & Riempp, 2004).
Moreover, the spatial contiguity principle was adopted in the VR-based learning
environment because the text and graphics are placed close to each other on each
screen. This appears to help decrease extraneous cognitive load as well (Mayer,
2001; Moreno & Mayer, 1999). In addition, the virtual environment in the VR
learning mode provides a more automated spatial encoding and therefore does not
require specific spatial processing schema to mentally transform 2-D objects into 3-
D objects. Such support could help to reduce the extraneous cognitive load (Chen,
2006).
On the other hand, in the PowerPoint slides for the Non-VR learning mode, due to a
limited space on each page, different sources of information are separated in time,
that is, texts are on one page that is presented after or before the graphic illustrations
which are on another page. This separation design has caused the learners to be less
likely to be able to hold both words and pictures in working memory at the same
time (Mayer, 2001). The process of information integration may burden the working
memory (Kalyuga, Ayres, Chandler, & Sweller, 2003). This probably explains the
significant positive effects of the VR learning mode as compared with the Non-VR
learning mode.

202
It is noted that small effect size was found for group differences in students’
performance achievement. This indicates that the result should be interpreted more
cautiously in a practical sense and further replication studies should be conducted.
Nevertheless, the research findings have shown that desktop VR could improve
academic performance of the learners and could serve as an alternative way of
providing instruction within secondary-school classrooms.
7.1.2 Affective Learning Outcome
There were significantly higher scores in both the perceived learning effectiveness
and satisfaction for students in the VR mode (see Section 5.5.2 and Section 5.5.3).
The results imply that desktop VR technology was effective in boosting the students’
affective behavior and the perception of their learning experience. The same results
were obtained in the study of Wekesa, Kiboss & Ndigangu (2006). The higher
perception in learning effectiveness in the VR learning mode indicates that VR was
seen as an educational tool that could enhance learning and make learning more
interesting and stimulating. The VR technology has helped them to have a good
understanding of the basic concepts of the learning material; to identify the central
issue of learning; and to make conclusions and generalizations. The learning
activities in the desktop VR-based learning environment were perceived as
meaningful, and the learning experience with VR technology has made the students
interested to learn more. These positive learning attitudes are imperative for
successful learning achievement.

203
Likewise, students in the VR learning mode exhibited much higher satisfaction in
learning. This could be due to the positive emotions generated during learning. It
was shown that positive emotions experienced during learning improve learners’
performance, satisfaction and perception towards learning (Um, 2008). Learning is
more likely to occur with a positive state of emotion because learners make more
constructive judgments as they interpret situations more positively (Um, Song, &
Plass, 2007). The esthetic elements such as colors, layout and graphics illustration of
the VR learning material could be the partial cause of the positive effects on
perceived learning effectiveness and satisfaction (Lee, Wong, & Fung, 2009b).
7.2 Interaction Effects
The following subsections discuss the interaction effects between the learners’
spatial abilities and the two learning modes, and the interaction effects between the
learners’ learning styles and the two learning modes on the learning outcomes based
on the ATI model.
7.2.1 Interaction Effect of Spatial Ability and Learning Mode on Cognitive Learning Outcome There was a significant interaction between the spatial abilities and learning modes
on performance achievement (see Section 5.5.4). Thus, performance achievement
varies as a function of spatial abilities and learning modes. Low spatial ability
learners’ performance, compared with high spatial ability learners, appeared to be
more positively affected by the learning mode. There was evidence that low spatial
ability learners performed better in the VR learning mode, but there was no
significant difference in performance for high spatial ability learners between the

204
two learning modes. However, the performance of high spatial ability learners in the
VR learning mode was slightly lower than high spatial ability learners in the Non-
VR learning mode.
The findings could be explained by the cognitive load theory. The major factor that
contributes to cognitive load is the number of elements that a learner needs to attend
to. The capability of working memory is limited to deal with about seven items or
elements of information simultaneously (Baddeley, 1992; Miller, 1956). However,
since working memory is also used to compare, contrast, organize or work on that
information, thus probably only two or three items of information can be processed
at any one time (Kirschner, 2002). The number of elements of information presented
in the instructional material for the Non-VR learning mode could have imposed
extraneous load for the low spatial ability learners. They need to mentally transform
the 2-D objects into 3-D objects while at the same time to organize, compare and
contrast different organs in the digestive tract and different parts of the veins and
arteries in the circulatory system. Thus, their learning was hindered because the total
cognitive load was not within the confines of working memory.
Low spatial ability learners are generally novices. They usually have relatively fewer
and less sophisticated schemas on spatial intelligence (Cooper, 1998; Kalyuga et al.,
2003). For instance, they have trouble recognizing visuo-spatial representations that
require them to mentally transform 2-D graphics into 3-D representations; less
ability to mentally restructure or manipulate the components of visual stimulus; and
less ability to recognize, retain, and recall configurations when figure or parts are

205
moved. The level of automation, that is, the ability to perform tasks without
concentrating is relatively lower for novices. They need to concentrate intently to
avoid making errors (Cooper, 1998).
The superior test performance of the low spatial ability learners in the VR learning
mode compared to the Non-VR learning mode indicated that the interactive learning
environment, animated pictures and on screen text did not provide redundant
information imposing extraneous working memory load. All sources of information
provided were necessary for more understanding to occur. The VR-based learning
has in fact managed to reduce the extraneous load for the low spatial ability learners,
thus enabling more working memory to be used for processing and encoding to-be-
learned information into the long-term memory. In other words, germane cognitive
load occurred because free working memory resources were actively devoted to
learning activities.
The following reasons could further explain why low spatial ability learners
performed much better in the VR learning mode. Learner control allows low spatial
ability learners to control their interactivity with the instructional material; actively
participate to search for some items in space; and closely monitor the information
given to follow the lesson. These learning activities may increase the germane
cognitive load to assist in schema acquisition when learning in the VR-based
learning environment. According to Hasler, Kersten & Sweller (2007, p. 725), the
deeper cognitive processing of the instructional information in terms of a higher
germane cognitive load is likely to result in better learning performance. This could

206
help to explain why low spatial ability learners performed better in the VR learning
mode than those in the Non-VR learning mode.
In addition, the split attention effect is reduced for low spatial ability learners in the
VR learning mode. Split attention occurs when students need to attend to more than
one source of information such as both the graphic and the text if the associated text
is placed above, below or the side of the graphic. The instructional material can only
be understood after the multiple sources of information are mentally integrated by
the learners (Cooper, 1998).
A lot of information needs to be labeled in anatomical visuals. The instructional
material in the VR learning mode has physically integrated the multiple sources of
information and has also used visual cues such as color cueing to direct the learners’
attention to the relevant parts of the diagram. For instance, in V-FrogTM the
anatomical image is highlighted with a different color when it is activated with the
query tool and at the same time the labeling of the image is given which is embedded
onto the image as shown Figure 7.3. Thus, instructional guidance could act as a
substitute to the missing schemas and help to construct schemas and automation for
low spatial ability learners.

207
Figure 7.3: The organ is highlighted in red and the labeling is provided when it is activated with the query tool
Based on the cognitive load theory (Sweller, 1999), the fact that there was no
difference in performance for the high spatial ability learners in both learning modes
suggested that the cognitive load imposed by both learning modes fell to a level that
was within the bounds of mental resources, thus learning was not impeded.
High spatial ability learners usually have a more expansive set of schemas on spatial
intelligence, and bring their activated schemas to the process of constructing mental
representations of a task or situation (Cooper, 1998; Kalyuga et al., 2003). As
mentioned by Cooper (1988), when learners hold high levels of expertise in the
content area then their working memory may attend to elements with large complex
knowledge networks. Thus, their working memory needs to attend only a few
elements in order to hold all of the to-be-learned information in long-term memory.
Moreover, those with high levels of expertise in the content area can categorize

208
multiple elements or related information as a single higher level element which
requires considerably less working memory capacity for processing (Kalyuga et al.,
2003). Consequently, ample cognitive resources are available for the process of
learning. High spatial ability has compensated for a non interactive 3-D virtual
learning environment in the Non-VR mode. Hence, instructional design
manipulations for this group of learners is ineffective because their working memory
capacity is not being exceeded (Cooper, 1998).
Such findings could be explained by the ability-as-compensator hypothesis (Mayer,
2001). High spatial ability learners could use their ability to compensate in an
environment without explicit presentation of 3-D representation and dynamic
visualization, but low spatial ability learners could not. Thus, the ability-as-
compensator hypothesized that low spatial ability learners should gain particular
benefit from the interactive 3-D virtual learning environment as they have difficulty
in mentally constructing their own visualization. The explicit presentation of 3-D
representations and dynamic visualizations may keep the need for using spatial
processing schema to the very minimum, thus reducing the extraneous cognitive
load. In fact, one of the strategies used to solve the information overload problem is
to present the information spatially and to use virtual environment interfaces to help
users to perceive, understand, and manipulate visuo-spatial information (Durlach et
al., 2000).
The slightly lower posttest score of high spatial ability learners in the VR learning
mode as compared to the Non-VR learning mode could be due to the expertise

209
reversal effect (Kalyuga et al., 2003). Essential information for the novices, in this
case, the lower spatial ability learners, may be redundant for advanced learners, that
is, the high spatial ability learners. Advanced learners cannot ignore the redundant
information, but try to integrate and cross-reference the redundant information with
its overlapped schemas that are already stored in long-term memory. This
unnecessary process would exert irrelevant cognitive load that causes adverse effects
in learning (Khalil et al., 2005, p. 18).
In such a case, the split-attention effect for novices is replaced by the redundancy
effect for the advanced learners. Information that is relevant to the process of schema
construction for a novice may hinder this process for a more advanced learner. In
short, both scheme-based and instructional-based guidance for dealing with the same
units of information may consume more mental resources and cause cognitive
overload, thus learning is hindered for advanced learners.
7.2.2 Interaction Effect of Spatial Ability and Learning Mode on Affective Learning Outcome There was no significant interaction between spatial abilities and learning modes on
perceived learning effectiveness and satisfaction (see Section 5.5.5 and Section
5.5.6). This means the effects of the learning modes on perceived learning
effectiveness and satisfaction did not depend on the learners’ differences in terms of
spatial abilities. However, among the two learning modes, both high and low spatial
ability learners perceived a higher level of learning effectiveness and were more
satisfied with their learning experience in the VR learning modes. The possible cause
210
of positive effects on perceived learning effectiveness and satisfaction in the VR
learning mode was explained in Section 7.1.2.
7.2.3 Interaction Effect of Learning Style and Learning Mode on Cognitive Learning Outcome The interaction effect between the learners’ learning styles and the two learning
modes on performance achievement was not significant (see Section 5.5.7). This
indicates that the effects of the learning modes on performance achievement did not
depend on the learning styles of the learners. However, among the two learning
modes, both accommodator learners and assimilator learners have higher
performance achievement scores in the VR learning mode. The underlying reasons
for better cognitive learning outcomes for learners in the VR learning mode were
explained in Section 7.1.1.
7.2.4 Interaction Effect of Learning Style and Learning Mode on Affective Learning Outcome There was no significant interaction effect between the learners’ learning styles and
the two learning modes on perceived learning effectiveness and satisfaction (see
Section 5.5.8 & Section 5.5.9). In other words, the effects of the learning modes on
perceived learning effectiveness and satisfaction did not depend on the learners’
learning styles. Nevertheless, among the two learning modes, the VR mode provided
a more positive effect to both accommodator learners and assimilator learners. Both
accommodators and assimilators perceived a higher level of learning effectiveness
and satisfaction in the VR learning mode. The positive effects on affective domain
for learners in the VR learning mode were elaborated in Section 7.1.2.
211
7.3 VR and Individual Differences The following subsections discuss the effects of the VR learning mode on both the
cognitive and affective learning outcomes for learners with different characteristics,
that is, spatial abilities and learning styles.
7.3.1 Effects of VR-based Learning on Cognitive Learning Outcome for Learners with Different Spatial Abilities There was a significant difference in the posttest score for high and low spatial
ability learners (see Section 5.5.10). The scores for high spatial ability learners are
higher than the low spatial ability learners. This is in agreement with the research by
Huk (2006) where students with high spatial ability benefited from learning with
interactive 3-D Quick-Time-VR animations on understanding cell biology. High
spatial ability learners scored better because they have a more hierarchically
organized schema on spatial intelligence and this may assist them in the process of
constructing mental representations of a task or situation. On the other hand, low
spatial ability learners have insufficient cognitive resources to build connections
between the graphic and text representations of the information they select and hold
in working memory, thus hindering their learning (Plass & Homer, 2002).
In general, it is expected there is a multiplicative effect when user proficiency and
system power are combined, that is, the performance for individuals with high
proficiency is amplified with the effect of an increase in the power of technology
while there is no significant improvement for individuals with low proficiency
(Norman 1994). However, when the overall improvement in performance as
measured by the gain scores was determined in this study, there was no significant

212
difference in the overall improvement in performance between high and low spatial
abilities learners (see Section 5.5.13). This shows that desktop VR-based learning
did not magnify the gap of achievement between high and low spatial ability
learners. This findings are consistent with the study of Chen (2006) where both
spatial ability groups benefited from the desktop VR-based learning environment
when additional navigational aids were provided in the virtual environment.
Messick (1976) proposes the compensatory match strategy to match individual
differences to learning tasks. The compensatory match aims to offset learners’
deficiencies by providing mediators or cognitive tools that learners cannot provide
for themselves. The use of virtual environment in the VR learning mode
compensates for the need to mentally construct and maintain the 3-D representations
and dynamic visualizations. The non-significant difference in the overall
improvement in performance between high and low spatial ability learners proves
the success of the compensatory match. Hence, the performance gap between high
and low spatial ability groups was not widened with the use of the virtual learning
environment. This is consistent with the study of Chen (2006). Consequently, the VR
learning mode is beneficial to both groups in terms of overall improvement in
performance.
7.3.2 Effects of VR-based Learning on Affective Learning Outcome for Learners with Different Spatial Abilities There was no significant difference in perceived learning effectiveness and
satisfaction between high and low spatial ability learners (see Section 5.5.11 and
Section 5.5.12). In other words, all learners regardless of their spatial abilities had a

213
similar perception of the learning quality in the VR-based learning environment and
experienced the same level of satisfaction with the VR learning mode. Both groups
scored approximately four out of the five-point Likert scale on perceived learning
effectiveness and satisfaction. In terms of perceived learning effectiveness, this
shows that both groups agreed that the VR-based learning environment allowed them
to achieve the desired learning effectiveness in identifying the issue learned, making
generalizations and conclusions. In terms of satisfaction, both groups agreed that
there was a high level of satisfaction in learning with the VR technology. Learner
satisfaction and perceived learning effectiveness are important factors in how readily
this VR-based learning will be adopted by learners. In short, VR has appealed
positively to the affective and emotional state of the learners regardless of their
spatial abilities, this implies that learners will accept and adopt VR-based learning.
7.3.3 Effects of VR-based Learning on Cognitive Learning Outcome for Learners with Different Learning Styles There was no significant difference in the performance achievement and the overall
improvement in performance between accommodator learners and assimilator
learners in the VR learning mode (see Section 5.5.14 and Section 5.5.17). This
implies that the effects of this learning on both accommodator learners and
assimilator learners were almost equivalent. Indeed, Bell and Fogler (1997) have
mentioned that, experience—the main feature of VR—is of great benefit to all
learning styles. In other words, VR could provide support to all elements of Kolb’s
model. A possible explanation for the findings is that in the VR learning mode, the
virtual environments that mimic the real world provide concrete experience to the
learners (Lee, Wong, & Fung, 2010a). Learners could actively construct knowledge

214
through experiment (Fitzpatrick, 2008); experience the consequences as they could
actively explore the virtual environment; and have the autonomy and control over
their own leaning (Chee, 2001; Fitzpatrick, 2008).
Moreover, the synthetic replica of objects by the virtual environment would help to
concretize and reify ideas. Besides, the instructional material in text and images
could provide reflective observation and abstract conceptualization to learners (Lee
et al., 2010a). Thus, the VR learning mode covers all four extreme ends of the
information perception continuum and the information processing continuum of
Kolb’s model. In other words, this learning model supports Kolb’s model of
experiential learning by providing concrete experience, abstract conceptualization,
active experimentation and reflective observation. The findings are consistent with
the study of Chen et al. (2005) in which their VR (guided exploration) mode has
equally benefited both accommodator learners and assimilator learners.
7.3.4 Effect of VR-based Learning on Affective Learning Outcome for Learners with Different Learning Styles There was no significant difference in perceived learning effectiveness and
satisfaction between accommodator learners and assimilator learners (see Section
5.5.15 and Section 5.5.16). In other words, all learners regardless of their learning
styles had a similar perception of the learning quality in the VR-based learning
environment and experienced the same level of satisfaction with the VR learning
mode. Based on a five-point Likert scale with higher scores indicating better
perceptions of learning quality and satisfaction, both groups scored approximately
four on perceived learning effectiveness and satisfaction. Thus, this indicates that

215
both groups agreed that the VR-based learning environment allowed them to achieve
the desirable learning effectiveness in identifying the issues learned, making
generalizations and conclusions. Likewise, both groups experienced a high level of
satisfaction in the VR-based learning environment. To conclude, VR has appealed
positively to the affective and emotional state of the learners irrespective of their
learning styles. The high level of perceived learning effectiveness and satisfaction
implies that learners irrespective of their learning styles are willing to adopt this
technology and this will have an impact on the success of this technology (Lee at al.,
2010a).
7.4 Theoretical Model for Evaluating How Desktop VR Enhances Learning Outcomes This study examined how desktop VR enhances the learning outcomes by
identifying the relevant constructs and their causal relationships that play an
important role in shaping the learning process and learning outcomes in the desktop
VR-based learning environment. The mediating effects of interaction experience and
the psychological factors of learning experience between the desktop VR technology
and the learning outcomes were empirically tested. With survey data from 208
respondents, a research model with eight latent variables was proposed and analyzed.
Overall the model explained 97% of variance in learning outcomes. In addition, the
moderating effects of learner characteristics (spatial ability and learning style) on the
model paths were analyzed using analytical analysis, and the mean latent testing for
the exogenous construct (i.e. VR features) across subgroups was also determined.
Table 7.1 summaries the results of these hypotheses, indicating which were
supported and which were not. The detailed results were presented in Section 6.5.

216
This section will first discuss the causal paths (relationship between constructs) of
the model. Next, the hypotheses testing for the influence of moderators on the model
paths will be discussed, and this will be followed by the hypotheses for mean latent
testing for the exogenous construct across subgroups.
Table 7.1: Summary of the hypotheses investigated in the hypothesized model
Hypotheses supported Relationships between constructs
• VR features → usability • VR features → presence • VR features → motivation • VR features → control and active learning • Usability → motivation • Usability → cognitive benefits • Usability → control and active learning • Usability → reflective thinking • Presence → learning outcomes • Motivation → learning outcomes • Cognitive benefits → learning outcomes • Control and active learning → learning outcomes • Reflective thinking → learning outcomes
Moderating effects of spatial ability
• Control and active learning → learning outcomes Hypotheses not supported
Relationships between constructs
• VR features → cognitive benefits • VR features → reflective thinking • Usability → presence
Moderating effects of spatial ability
• Presence → learning outcomes • Motivation → learning outcomes • Cognitive benefits → learning outcomes • Reflective thinking → learning outcomes
Moderating effects of learning style • Presence → learning outcomes • Motivation → learning outcomes • Cognitive benefits → learning outcomes • Control and active learning → learning outcomes • Reflective thinking → learning outcomes
Main effects of spatial ability and learning style (Latent Mean Testing)
• Spatial ability → VR features • Learning style → VR features

217
7.4.1 Causal Path
Using AMOS Version 16, the results supported the causal paths from VR features to
presence, motivation, control and active learning, and usability; from usability to
motivation, cognitive benefits, control and active learning, and reflective thinking;
and from presence, motivation, cognitive benefits, control and active learning, and
reflective thinking to learning outcomes. Learning experience which was
individually measured by the psychological factors—that is, presence, motivation,
cognitive benefits, control and active learning, and reflective thinking—took central
stage in affecting the learning outcomes in the VR-based learning environment.
7.4.1.1 Presence
Presence was found to be significantly and positively related to learning outcomes in
the VR-based learning environment. This is in agreement with the findings of
Salzman et al. (1999) and Mania and Chalmers (2000) that presence could influence
learning outcomes. The antecedent to presence was VR features and not usability.
This could be explained by the argument of Dalgarno et al. (2002) that presence is
not a unique attribute of the environment, but it is induced by the fidelity of
representation and the high degree of interaction or user control. Presence is a user’s
reaction to the given level of immersion in the VR-based learning environment, thus
it is a subjective psychological response to a system. The positive relationships
between VR features and presence indicated that the better the VR features in terms
of realism and control factors, the higher level of presence the users experienced.
And the higher the level of presence, the better the learning outcomes. The finding
implies that low-immersion systems, such as desktop VR, are capable of providing
218
presence experience to users. Furthermore, it provides empirical evidence on the
causality relationship between presence and learning outcomes which until today is
still relatively limited (Lee, Wong, & Fung, 2010b). Most of the research findings
were analyzed with correlation analysis which does not imply causality relationship.
7.4.1.2 Motivation
In the desktop VR-based learning environment, the results show that motivation was
significantly and positively related to learning outcomes. This is in line with the
model proposed by Salzman et al. (1999) and Benbunan-Fich and Hiltz (2003).
Similar with the findings by Rezabek (1995) and Virvou et al. (2005), motivation
was found to have an effect on learning effectiveness and achievement. The finding
has contributed to the limited studies on the impact of the learners’ motivational
perspective on its learning effects in a multimedia-based learning environment
(Yaman et al., 2008).
VR features were a significant antecedent to motivation. The result is consistent with
the finding of Virvou et al. (2005) where their VR educational software game named
VR-ENGAGE was found to be very motivating. Indeed, instructional efforts can
make a difference in motivating students to learn and this is in line with the social
cognitive motivational theories that motivation is not an individual’s stable trait but
varies depending on the situation and context of learning. Indeed, the realism of the
scene, dynamic displays and closed-loop interaction where users have control over
the contents viewed of the VR software used have been shown to be motivating in

219
this research, and this has supported the view on why motivational value was one of
the justifications cited for using VR for learning (McLellan, 2004).
In fact, when the students were asked in the open-ended sections of the survey why
the desktop VR program was effective as an educational tool, students reported the
desktop VR program was interesting and had motivated them to put more efforts in
the related subjects. One student wrote in the survey, “The realism of the image
makes it easier for students to learn as they won’t get bored. The ability to
manipulate the objects makes the learning session more interesting and effective.”
Another mentioned, “I think the software program motivates students to learn and
makes the learning environment more fun. Its 3-D images are very interesting.”
Usability was also a significant antecedent to motivation in the desktop VR-based
learning environment. This shows that learning activities that are perceived as useful
and easy to use in the desktop VR-based learning environment help to motivate the
students. A learning system that is useful and easy to use makes it possible for
individuals to devote their attention to learning materials (Sun et al., 2008), and thus
they are more motivated to learn with the system provided (Lee et al., 2010b). It may
eventually influence the intention of the students to adopt this system for learning.
7.4.1.3 Cognitive Benefits
Cognitive benefits were positively related to learning outcomes of the desktop VR-
based learning environment. The better the cognitive benefits, the better the learning
outcomes in terms of performance achievement, perceived learning effectiveness and

220
satisfaction of learning in a desktop VR-based learning environment. This finding
has supported the study of Antonietti et al. (2000) in that students perceived
cognitive benefits such as better memorization, understanding, application and
overall view of the lesson learned were the advantages of using VR for learning.
Though VR is able to provide an environment in which students can develop higher
levels of Bloom’s taxonomy, the findings of this research show that VR features did
not directly relate to cognitive benefits, but were mediated by usability. A possible
explanation for this is that VR technology itself does not have any influence on
cognitive benefits; cognitive benefits are caused by the instructional method
embedded in the media presentation, for instance, learning content and instructional
strategy (Lee et al. 2010b). As mentioned by Dalgarno et al. (2002), the high degree
of fidelity and user control will not necessarily facilitate the development of
conceptual understanding. It is an appropriate set of learning tasks that is deemed
useful and easy to use by the learners that is crucial. This is to ensure that the
learning activities that the students undertake have a positive impact on cognitive
benefits (Dalgarno et al., 2002).
7.4.1.4 Control and Active Learning
Control and active learning was proven to be positively related to learning outcomes
in the desktop VR-based learning environment. This implies that the higher the level
of control and active learning afforded by the VR-based learning environment, the
better the learning outcomes as measured by performance achievement, perceived
learning effectiveness and satisfaction. The result corroborates those of Stipek and
221
Weisz (1981), Choi and Gennaro (1987), Rivers and Vockell (1987), Yang and Heh
(2007), and Jang et al. (2007). In essence, it is important to integrate both the hands-
on and minds-on activities in which students could actively be involved in the
learning process to enhance the effect of computer assisted learning (Berger et al.,
1994; Chang & Barufaldi, 1999).
In addition, students’ positive reactions to learner control and active learning could
also be one of the factors. From the open-ended sections of the survey, students
reacted positively to learner control and active learning. One student wrote in the
survey, “We can study on our own, can always review back. We learn to be
responsible for our own learning.” Others mentioned, “This type of computer
program allows the students to be more active in learning and the students would be
more interested to learn.” “Students can study at their own pace without being
pressured. Apart from that, immediate information is gained, making it easier for
students to learn.” “Students can learn the subject by doing. This helps students to
learn and understand better and makes the lesson more interesting.” Indeed, the
results of this study indicate that learner control and active learning could positively
affect the learning outcomes in a desktop VR-based learning environment.
Both VR features and usability were the antecedents to control and active learning. It
was an expected finding because the feature of immediacy of control provided
interactive experiences to learners, and learning tasks and activities that were useful
and easy to use provided pleasant experiences when interacting with the VR system.
Students could focus their attention on a coherent set of related activities and stimuli.

222
As one student mentioned, “It gives a clear picture to me. I understand more
through exploration. Furthermore, it is not difficult to operate.”
7.4.1.5 Reflective Thinking
Reflective thinking was another significant psychological learning factor that
influenced the learning outcomes in the desktop VR-based learning environment.
The result implies that the desktop VR-based learning environment could engage
learners in a deep approach of learning where they could actively search for
information from the learning material to resolve their doubts, to understand the
lesson and link it to previous knowledge and experiences to construct new
knowledge. Through reflective thinking, the learners’ mental models to explain their
worlds will become more complex, and enable them to reason more consistently and
productively about the phenomena they are observing (Jonassen et al., 1999).
Consequently, better learning outcomes were achieved, that is, better performance
achievement, perceived learning effectiveness and satisfaction were attained.
The finding has shown that VR features were indirectly related to reflective thinking
which was mediated by usability. Similar to cognitive benefits, a possible
explanation is that reflective thinking is caused by the instructional method
embedded in the media presentation (Lee et al., 2010b). In fact, the consensus among
scholars is that technology does not cause learning, but the learning and teaching
behaviors do (Chickering & Ehrmann, 1996). Nevertheless, technology can enhance
certain behaviors or methods (Ahmad, Piccoli, & Ives, 1998). As mentioned by
Collis (1995, p. 146), it is the instructional implementation of technology, and not

223
technology itself, that determines learning outcomes. This is also supported by
Dalgarno et al. (2002) who stated that a virtual learning environment that is modeled
on a real world system with high degree of fidelity and immediacy of control will not
necessarily facilitate better learning and understanding. There must be an appropriate
set of learning tasks and activities that are considered to be useful and easy to use by
learners in order to facilitate reflective thinking, which in turn affect the learning
outcomes (Dalgarno et al., 2002).
Learners must be able to reflect on their activities and observations to learn the
lesson that the activities have to teach. It is believed the requirement to complete the
lab report had helped the learners to reflect on their activities and observations, to
integrate new experiences with their prior knowledge to construct new knowledge,
and to make sense out of what they observe. As one student mentioned during the
debriefing session, “I think, reflect, and answer the lab report.” Others mentioned,
“I do my own learning. I read, understand, reflect and answer the lab report.” “It is
an interactive program which allows me to do discovery learning. Thus, the whole
learning process was interesting. I did reflect on what had been learned.” Hence, the
interactive virtual learning, coupled with the appropriate instructional strategy that is
perceived as useful and easy to use by learners, helps to facilitate reflective thinking.
7.4.1.6 Usability
Usability was found to be a significant antecedent to a number of the psychological
learning factors as elaborated above. This implies that usability, the interaction
experience with the desktop VR-based learning environment, plays a significant role
224
in influencing the learning experience, which in turn affects the learning outcomes.
Moreover, usability plays the role of mediating the VR features to some
psychological factors such as cognitive benefits and reflective thinking which
indicates that the unique desktop VR features alone are not sufficient to facilitate
learning, thinking and understanding. The learning activities and tasks provided must
be useful and easy to use for the desktop VR to fully captivate its capabilities and
potentials to improve the learner’s learning experience. In short, the design
dimension of the VR-based learning environment that takes into account the
perceived usefulness and ease of use has a significant impact on learning experience
and learning outcomes. This research echoes that of Sun et al. (2008) and Arbaugh
and Duray (2002) in technology-mediated learning.
VR features were significant antecedents to usability, as predicted by the model.
This was consistent with the findings of Salzman et al. (1999). The VR features that
were measured by the representational fidelity and the ability to control, manipulate
and interact with the virtual objects in the VR-based learning environment
collectively influenced the interaction experience of the users. The relationship
between VR features and usability were positively related, indicating that the better
the realism and control factors, the better the interaction experience.
In the open-ended question, many students reported that the VR features have
enhanced their interaction experience. In terms of perceived usefulness, students
stated that “The most important part is students are able to learn at their own pace.
Besides, this software enables students to view the objects in 3-D which further

225
enhances their understanding.” “We are able to rotate the specimen or zoom it. We
won’t be able to do this with the real specimen. This is the good part where you can
turn and play with the specimen and this helps to understand more.” “It is an
effective educational tool as there are pictures and images throughout the learning.
I will never feel bored with this type of computer-based learning. The information is
always clear and detailed.” “I think it is very useful and should be used continuously
for students to understand more on the topics.” From the perspective of perceived
ease of use, students mentioned, “It is easy and fun to use. It helps me to understand
more about the subject.” “It is easy to use and I can get a lot of information from
this type of computer program.”
7.4.1.7 VR Features
VR features were found to be directly and indirectly related to all psychological
factors, the learning experience and also a significant antecedent to usability, the
interaction experience as explained in detail above. These findings support what
other researchers have argued in terms of leveraging the uniqueness of the VR
technology to enhance the learners’ interaction and learning experience, which in
turn affects the learning outcomes (Barnett et al., 2005; Salzman et al., 1999). VR
technology may have significant potential to improve student learning; however, it is
the aspects of this technology that are best leveraged for enhancing the learning
effectiveness that need to be examined (Barnett et al., 2005). This study has shown
that representational fidelity and immediacy of control are the two unique features of
desktop VR that play a significant role in influencing the interaction and learning
experience of learners, which eventually enhances the learning outcomes.

226
VR features had a stronger direct effect on perceived learning effectiveness and
satisfaction than on performance achievement. A possible explanation is that the
cognitive tool (3-D interactive features) in the VR-based learning environment has
helped the students to understand, to build new knowledge, to make generalizations
and conclusions to the lesson learned, and has provided the students a satisfying
learning experience. However, good and impressive VR features might not lead to
better performance achievement because getting a good score might not be necessary
the goal of all students (McGill & Klobas, 2009). Furthermore, other factors could
influence the performance outcomes of the students such as cognitive style and
attitude towards computer. It was found that the total effect of VR features was the
strongest for the psychological factors of control and active learning (see Section
6.5.1). This implies the capability of desktop VR to provide more active student
involvement in the learning process.
Another significant finding of this research was that the indirect effects analysis from
the path of VR features to learning outcomes indicated that the mediated effect
through control and active learning was the strongest among the psychological
factors (see Section 6.5.2). This implies that the students are more sensitive to this
psychological factor when learning in a desktop VR-based learning environment.
This is consistent with the nature of human beings. When learning about things,
humans want to be active, to control and interact with the environment, to
manipulate objects in that environment, and to observe the effect of their
interventions and construct their own interpretation for the phenomena and the
results of the manipulation (Jonassen et al., 1999). Thus, instructional designers and

227
desktop VR developers should be aware that real learning requires active learners
who are engaged by meaningful tasks and not just merely pressing the space bar or
clicking the button to continue.
7.4.2 Moderating Effects of Learner Characteristics
The influence of presence, motivation, cognitive benefits and reflective thinking on
learning outcomes being similar for high and low spatial ability groups indicates that
these psychological factors to learning outcomes are not spatial ability specific (see
Section 6.6). The phenomenon implies that these psychological factors are the
common success factors, regardless of the learners’ spatial abilities. Thus, a VR-
based learning environment that is able to provide such learning experience (e.g.
presence, motivation, cognitive benefits and reflective thinking) is crucial to achieve
good learning outcomes.
The influence of control and active learning on learning outcomes is stronger for the
high spatial ability than the low spatial ability group, implying that the high spatial
ability group displays more sensitivity to control and active learning rather than to
the rest of the psychological factors. This difference between both groups may result
from the phenomenon that the high spatial ability learners generate a higher level of
performance achievement, perceived learning effectiveness and satisfaction if
control and active learning is provided. This shows that control and active learning is
more of a concern factor for the high spatial ability group. A possible explanation
could be control and active learning enable learners to adapt the pace of presentation
to their individual cognitive needs, thereby ameliorating their performance and

228
helping them perceive the learning process as effective and satisfying (Lee et al.,
2010b).
Likewise, the influence of presence, motivation, cognitive benefits, control and
active learning and reflective thinking on learning outcomes being similar for
accommodator learners and assimilator learners indicates that these psychological
factors to learning outcomes are not learning style specific (see Section 6.6). The
phenomenon implies that these psychological factors are the common success
factors, regardless of the learners’ learning styles (Lee et al., 2010b). Thus, a VR-
based learning environment that is able to provide such learning experiences is
crucial to achieve good learning outcomes (Lee et al., 2010b).
The implication of these findings is that a VR-based learning environment is found
to be suitable for learners with different learning styles because learning style does
not influence learning experience on learning outcomes. Likewise, a VR-based
learning environment is also suitable for learners with different spatial abilities
because spatial ability does not influence the learning experience paths to learning
outcomes except from the path of control and active learning to learning outcomes.
Thus, the efforts to improve the learning outcomes are only subjected to very
minimal influence of spatial ability. Consequently, VR is an educational tool that
could accommodate individual differences in terms of learning styles and spatial
abilities.

229
7.4.3 Latent Mean Testing
The non-significant difference for the means of the exogenous construct (VR
features) across the subgroups of spatial ability and learning style shows that all
subgroups have given similar evaluation to the VR features (see Section 6.7). This
indicates that all learners regardless of which subgroups they were assigned to have
the same perception on the VR features of the software program. This shows that
there was a consistent perspective on the technical features that were afforded by the
desktop VR technology between all types of learners in terms of spatial ability and
learning style.
7.5 Summary
This chapter presents the discussion and implications of the research results: the
learning effectiveness of a VR-based learning environment, the ATI research, VR
and individual differences, and the model evaluation of how VR enhances the
learning outcomes.
The possibilities of why the VR-based learning environment outperformed the
conventional classroom learning practice were discussed in great detail. It was
argued that interactive, active and self-paced learning in the VR learning mode could
be the partial causes. The argument was further supported by the cognitive load
theory. It was believed that the VR instructional intervention has helped to reduce
extraneous cognitive load and at the same time increased the germane cognitive load.
Thus, the available memory resources were not exceeded by the total cognitive load
imposed, which fostered better learning in the VR-based learning environment.

230
As for the ATI research, the interaction effect was found significant only for spatial
abilities and learning modes on cognitive learning outcome. Low spatial ability
learners performed better in the VR mode as compared to the Non-VR mode. Again,
the findings could be explained by the cognitive load theory, that is, the learning of
low spatial ability learners in the VR mode was not hindered because the total load
was within the confines of working memory. Other arguments include learner
control and the split attention effect.
In terms of individual differences in the VR learning mode, only spatial ability has
an influence on the performance achievement. High spatial ability learners did better
than the low spatial ability learners. This was an expected result because high spatial
ability learners have a more hierarchically organized schema on spatial intelligence
than low spatial ability learners, which may assist them in the process of constructing
mental representations of a task or situation.
To evaluate how VR enhances learning outcomes, the results have supported the
relationships in the hypothesized model that VR features did not directly influence
the learning outcomes, but did so indirectly through interaction experience and
learning experience. VR features, that is, representational fidelity and immediacy of
control were found to collectively influence the psychological factors of learning
experience, that is, presence, motivation, and control and active learning directly.
The positive relationship between them indicates that the better the realism and
control factor, the better the level of presence, motivation, and control and active
learning. VR features were also found to directly influence the interaction

231
experience of the users. The relationship between VR features and usability were
positively related, indicating the better the realism and control factors, the better the
interaction experience. These findings have shown that representational fidelity and
immediacy of control are two unique features of desktop VR that could play a
significant role in influencing the learners’ interaction and learning experience,
which in turn enhances the learning outcomes.
Some of the psychological factors of the learning experience are not directly related
to the VR features, but are related indirectly to the VR features through usability, the
interaction experience. The implication of this result is that interaction experience
(usability) plays an important role in a desktop VR-based learning environment.
Learning tasks and activities that are deemed useful and easy to use by learners are
crucial to provide better learning experiences and learning outcomes to the users.
Students were found to be more sensitive to the mediating effect of control and
active learning from the indirect effects analysis from the path of VR features to
learning outcomes. This is consistent with the nature of human beings. When
learning, humans want to be active, to be able to control and interact with the
environment, to observe the effect of their inventions and to construct their own
interpretation of the phenomena (Jonassen et al., 1999).
Desktop VR was found to be able to accommodate individual differences. Learning
style did not moderate any paths from learning experience to learning outcomes and
the influence of spatial ability is minimal. High spatial ability learners are more

232
sensitive to control and active learning. A possible explanation could be that control
and active learning enables learners to adapt the pace of presentation to their
individual cognitive needs, thereby improving their learning outcomes.
Lastly, the latent mean testing shows all subgroups which were based on spatial
abilities and learning styles had given similar evaluation to the VR features. This
implies that there was a similar perspective on the technical features that were
afforded by the desktop VR technology between all types of learners in terms of
spatial ability and learning style.

233
Chapter 8
CONCLUSIONS
8.0 Summary of the Research and Its Contributions
The main aims of this research are two-fold. First, it investigates the learning
effectiveness of a desktop VR-based learning environment as compared to a
conventional classroom learning method. The results have contributed to our
understanding of the learning outcomes of a student-centered approach in a desktop
VR-based learning environment that supports the constructivist learning model.
Consequently, the findings provide empirical evidence on the merit of desktop VR-
based learning to educators, VR software developers and policy makers. Besides,
through the ATI research, the understanding of how individual differences interact
with different learning environments could help the instructors to identify
instructional treatments that facilitate individualized learning, and also to provide
evidence that VR could accommodate individual differences. The influence of
individual differences was further analyzed in the VR learning mode.
Next, the research centered around the development of a theoretical model of
determinants for effective desktop VR-based learning to understand how a desktop
VR system is capable of enhancing and improving the quality of student learning,
and also the types of students that would benefit from this technology. The model
provides some insights into the relationships among the relevant constructs that work
together to shape learning in a desktop VR-based learning environment. With such

234
understanding and knowledge, desktop VR technology could be best leveraged for
enhancing the learning effectiveness to maximize the benefits of using this
technology for educational purposes. For instance: Which VR feature is prominent?
How does the VR feature influence the learning outcomes? Which psychological
factors that are induced by the VR technology play a significant role in the learning
environment? And which characteristics of the learners require careful attention in a
desktop VR-based learning environment?
Through this research, an initial theoretical model of the determinants of learning
effectiveness in a desktop VR-based learning environment was developed and
evaluated. The proposed model appeared to provide a useful model of the
relationships under consideration. Thirteen of the sixteen hypotheses on causal paths
were supported when the model was tested with the sample data. The results of the
structural model evaluation have pointed out the relevant constructs and their causal
relationships that could enhance and improve the learning outcomes of a desktop
VR-based learning environment. Furthermore, the investigation of the moderating
effect of learner characteristics on the structural paths suggests that the desktop VR-
based learning environment is suitable for learners with different learning styles and
spatial abilities. The influence of spatial abilities is minimal in a desktop VR-based
learning environment.
8.1 Limitations of the Study
There are some limitations that may restrict the probability of generalizing the
findings of this study.

235
First, it is noted that the learning outcomes accounted for 61% of the variability in
satisfaction, 72% of the variability in perceived learning effectiveness, but only 7%
of the variability in performance. Though performance achievement is a significant
indicator for learning outcomes, only a small proportion of variability in
performance achievement was explained. Student performance achievement is
influenced by a myriad of other factors including personal goals (Yi & Im, 2004),
cognitive styles (Witkin, 1976), and computer attitudes (Teo, 2008). Getting better
scores is not necessarily the goal of all students (McGill & Klobas, 2009). A short
exposure with desktop VR might not be sufficient to gauge students’ performance
achievement.
Second, the findings were limited to the context of a biology topic on frog anatomy.
The results obtained here are primarily dependent on the context of biology learning.
Different learning content may arouse different attitudes, perceptions and results. .
Third, the subjects were confined to the context of Malaysia. Research has shown
that cultural backgrounds of students from different cultures could influence how
they use and think about learning with computer based technologies (Colis, 1999;
Lal, 2002; Palma-Rivas, 2002).
Fourth, the novelty effect cannot be ruled out. Almost half of the samples have
never heard of VR and used VR before. Thus, this new technology may create a
sense of new excitement that could influence the students’ perception on the factors
measured in this study.

236
Fifth, presence is a highly complex construct which should be measured by a more
comprehensive measurement and not with a single questionnaire item.
Sixth, instead of straight gain scores, modified percent gain scores generally provide
a better alternative as not to penalize the scores of high pretest scorers in the
calculation of gains to measure the overall improvement in the performance of
students with different characteristics.
8.2 Recommendations for Future Investigations
This study raises several issues that worth further research.
First, to study students in a desktop VR-based learning environment over a longer
period will be useful as the impact of the VR-based learning on student achievement
may be cumulative over time. It is also recommended to delay the posttest to
measure the retention rate as compared to conventional classroom learning methods.
Furthermore, studying students in the desktop VR-based learning environment over a
number of terms or semesters might diminish the novelty effect.
Second, is it suggested that future research looks into the influence of desktop VR-
based learning on individual indicators instead of collectively grouping the indicators
under one construct of learning outcomes.
Third, replication of the study in a different learning context is recommended for
future research to determine whether the identified constructs and the pattern of

237
relationships in the tested structural model is restricted to the present sample and
design or if it can be observed in samples for other learning programs with different
content and over a period of time.
Fourth, it is recommended that similar study to be carried out for students with
different cultural backgrounds from different geographical areas to generalize the
result findings.
8.3 Implications of the Study
The findings have important implications to instructional designers, desktop VR
software developers and educators.
8.3.1 Conceptual Framework and Theoretical Model of How Desktop VR Enhances Learning Outcomes It is hoped that the framework and model that evaluates how desktop VR enhances
the learning outcomes will serve as a feasible and useful template to guide the
development efforts of desktop VR-based learning. By understanding how the
relevant factors or constructs work together to shape learning, instructional designers
and desktop VR software developers will be able to maximize the benefits of
desktop VR technology. The model has highlighted the influence of the
psychological learning factors by both the VR features and interaction experience
that eventually enhance the learning outcomes. For instructional designers and
desktop VR software developers, this study would help them to leverage the VR
features to enhance the desired interaction and learning experience that play a

238
significant role in improving the learning outcomes. Among the psychological
factors of learning experience, it was also found that control and active learning was
the most influential in affecting the learning outcomes in the desktop VR-based
learning environment. An important finding is that great VR features alone might
not achieve the desired learning experience. An appropriate set of learning tasks and
activities that are afforded by the VR technology—and that are considered to be
useful and easy to use by learners—is crucial in enhancing the learning outcomes.
The findings on the influence of student characteristics on the structural paths have
suggested to educators that desktop VR-based learning could accommodate students
with different learning styles and spatial abilities. The influence of spatial abilities
on learning outcomes is minimal in a desktop VR-based learning environment.
Furthermore, all learners irrespective of their spatial abilities and learning styles have
a similar perspective on the technical features afforded by the desktop VR
technology.
8.3.2 A VR-based Learning Environment—An Effective Alternative
The significant positive effects of the VR-based learning environments on both the
cognitive and affective domains when compared with the Non-VR mode have
provided empirical evidence of the potential of desktop VR as an alternative to the
traditional way of teaching and learning. These findings imply that a student-
centered approach in a desktop VR-based learning environment that supports
constructivist learning principles is superior to the teacher-centered approach in a
learning environment that supports objectivist learning principles.

239
The findings have further supported the use of VR for learners with different
aptitudes. There was no significant difference in the overall improvement in
performance, perceived learning effectiveness and satisfaction between high and low
spatial ability learners and between accommodator learners and assimilator learners
in the desktop VR-based learning environments, which imply that a VR-based
learning mode provides equivalent benefits to learners of different spatial abilities
and learning styles. Besides cognitive gains, VR has appealed positively to the
affective and emotional state of the learners regardless of their spatial abilities and
learning styles. These findings have provided evidence on the potential of VR to
empower students’ learning and as a curriculum enhancement in secondary
classrooms. Furthermore, the new generation in schools is in a digital generation
where the computer has become part of everyday life. Desktop VR therefore should
be considered as an alternative way of providing instruction in schools.
8.3.3 Aptitude-by-Treatment Interaction Study
There is little research that looks into how learner characteristics could aid or inhibit
learning in a virtual environment as most research for instructional use is
technology-driven, rather than taking into account human factors (Chen, 2005).
Thus, the ATI study undertaken would provide more understanding of this aspect.
The findings show that the learners irrespective of their learning styles benefit more
from the VR-based learning environment in terms of performance achievement,
perceived learning effectiveness and satisfaction. This proves the VR-based learning
environment could be used to accommodate learners with different learning styles.
The ATI findings show that a VR-based learning environment benefits more the low

240
spatial ability learners in terms of performance achievement. Thus, this could help
educators to facilitate individualized learning. In terms of perceived learning
effectiveness and satisfaction, the learners irrespective of their spatial abilities
benefit more from the VR-based learning environment. This implies that in terms of
affective domain, VR-based learning offers a promising medium to accommodate
individual differences pertaining to this aptitude.
In conclusion, this research makes a significant contribution by bringing VR
practitioners one step closer to understanding the potential of desktop VR technology
to support and enhance learning. The findings contribute to the understanding of the
learning outcomes of a desktop VR-based learning environment and the merit of
using desktop VR for learning. A broad framework that identifies the theoretical
constructs and their relationships in a desktop VR-based learning environment has
been developed and the fit of the theoretical model has been systematically and
empirically tested. The framework and model are intended to guide the future
development efforts of a desktop VR-based learning environment. Moreover, the
framework and model have enlightened educators and practitioners to the capability
of desktop VR to enhance learning and to support educators and practitioners using
desktop VR-based learning. Taken together, the findings from this study not only
tell VR practitioners what has occurred but also how the learning has occurred in a
desktop VR-based learning environment.

241
Appendix A
Data Collection Procedures for VR Mode (Actual Study)

242
Data Collection Procedures (VR Mode) Two weeks before the treatment The students answer the spatial ability test, pretest and initial questionnaire. First Part (Spatial Ability Test) Directions:
1. Introduction – The teacher will put the participants at ease by briefly explaining the purpose of the test.
2. Spatial Ability Test and Answer Sheet – The participants will be given the spatial ability test and answer sheet.
3. Identification Information – The teacher must ensure each participant fills in his or her identification information, that is, the participant’s last four digits of their Identity Card Number and their home address number on the answer sheet and question paper.
4. Administration of the Spatial Ability Test – The teacher will say: “Please refer the spatial ability test. This test consists of 75 questions. You are given 3 minutes to go through the examples of the type of questions being asked in this test. Please read the instructions on what you should do in order to answer each question. Show your choice of answer by marking your answer on the answer sheet provided. You will have 10 minutes for this test. Work as rapidly and as accurately as you can.”
5. Collection of Question Paper and Answer Sheet – The teacher needs to ensure the number of answer sheets and question papers tally with the number of participants present.
Second Part (Pretest) Directions:
1. Introduction – The teacher will put the participants at ease by briefly explaining the purpose of the test.
2. Pretest and Answer Sheet – The participants will be given the pretest question paper and answer sheet.
3. Identification Information – The teacher must ensure each participant fills in his or her identification information, that is, the participant’s last four digits of their Identity Card Number and their home address number on the answer sheet and question paper.
4. Administration of Pretest – The teacher will say: “Please refer to the pretest. This test consists of three parts. You are given 30 minutes to complete the test. For each Part, please read the instructions carefully before answering the questions.”
5. Collection of Question Paper and Answer Sheet – The teacher needs to
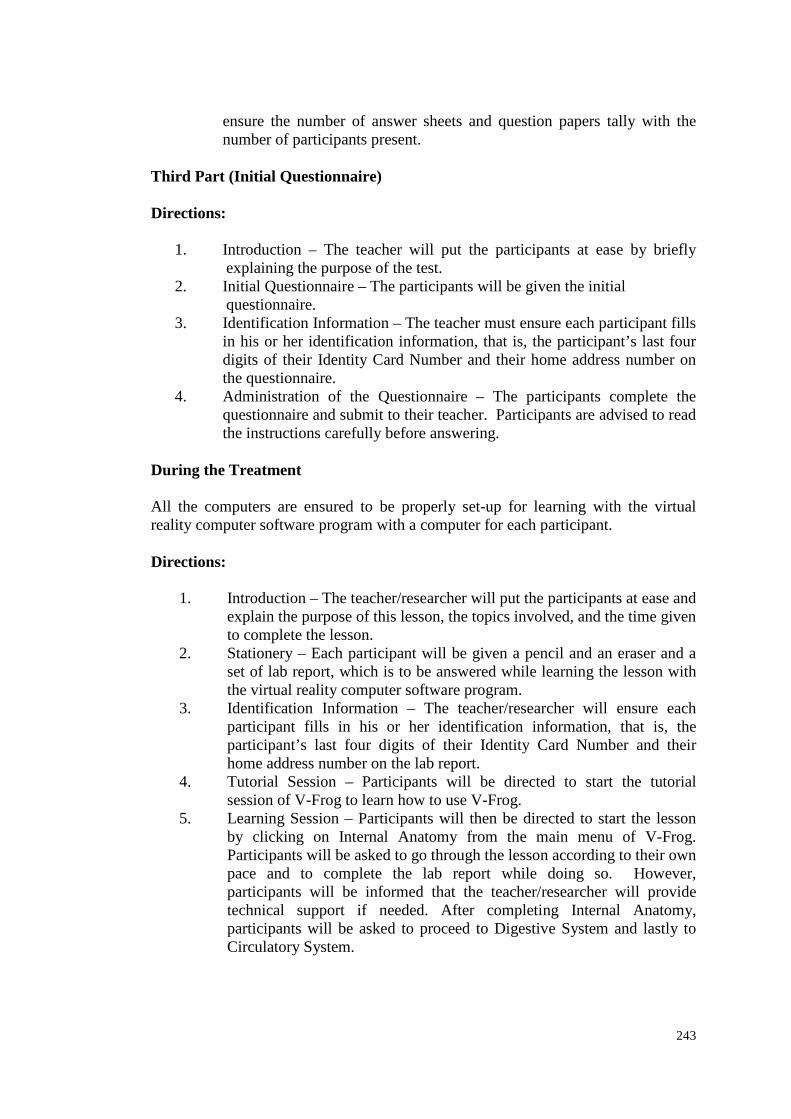
243
ensure the number of answer sheets and question papers tally with the number of participants present.
Third Part (Initial Questionnaire) Directions:
1. Introduction – The teacher will put the participants at ease by briefly
explaining the purpose of the test. 2. Initial Questionnaire – The participants will be given the initial
questionnaire. 3. Identification Information – The teacher must ensure each participant fills
in his or her identification information, that is, the participant’s last four digits of their Identity Card Number and their home address number on the questionnaire.
4. Administration of the Questionnaire – The participants complete the questionnaire and submit to their teacher. Participants are advised to read the instructions carefully before answering.
During the Treatment All the computers are ensured to be properly set-up for learning with the virtual reality computer software program with a computer for each participant. Directions:
1. Introduction – The teacher/researcher will put the participants at ease and explain the purpose of this lesson, the topics involved, and the time given to complete the lesson.
2. Stationery – Each participant will be given a pencil and an eraser and a set of lab report, which is to be answered while learning the lesson with the virtual reality computer software program.
3. Identification Information – The teacher/researcher will ensure each participant fills in his or her identification information, that is, the participant’s last four digits of their Identity Card Number and their home address number on the lab report.
4. Tutorial Session – Participants will be directed to start the tutorial session of V-Frog to learn how to use V-Frog.
5. Learning Session – Participants will then be directed to start the lesson by clicking on Internal Anatomy from the main menu of V-Frog. Participants will be asked to go through the lesson according to their own pace and to complete the lab report while doing so. However, participants will be informed that the teacher/researcher will provide technical support if needed. After completing Internal Anatomy, participants will be asked to proceed to Digestive System and lastly to Circulatory System.

244
6. Collection of lab report – Lab report will be collected from the participants who have finished the lesson. The computer software program will be closed.
7. Posttest and Answer Sheet – The participants will be given the posttest question paper and the answer sheet immediately after the learning session.
8. Identification Information – The teacher/researcher will ensure each participant fills in his or her identification information, that is, the participant’s last four digits of their Identity Card Number and their home address number on the answer sheet and question paper.
9. Administration of Posttest – Participants will be given 30 minutes to complete the posttest.
10. Collection of Question Paper and Answer Sheet – The teacher/researcher needs to ensure the number of answer sheets and question papers tally with the number of participants present.
11. Final Questionnaire – Participants will be given the final questionnaire to answer and submit to the teacher.

245
Appendix B
Data Collection Procedures for Non-VR Mode (Actual Study)

246
Data Collection Procedures (Non-VR Mode) Two weeks before the treatment The students answer the pretest, spatial ability test and initial questionnaire. First Part Directions:
1. Introduction – The teacher will put the participants at ease by briefly explaining the purpose of the test.
2. Spatial Ability Test and Answer Sheet – The participants will be given the spatial ability test question paper and answer sheet.
3. Identification Information – The teacher must ensure each participant fills in his or her identification information, that is, the participant’s last four digits of their Identity Card Number and their home address number on the answer sheet and question paper.
4. Administration of the Spatial Ability Test – The teacher will say: “Please refer to the spatial ability test. This test consists of 75 questions. You are given 3 minutes to go through the examples of the type of questions being asked in this test. Please read the instructions on what you should do in order to answer each question. Show your choice of answer by marking your answer on the answer sheet provided. You are given 10 minutes for this test. Work as rapidly and as accurately as you can.”
5. Collection of Question Paper and Answer Sheets – The teacher needs to ensure the number of answer sheets and question papers tally with the number of participants present.
Second Part Directions
1. Introduction – The teacher will put the participants at ease by briefly explaining the purpose of the test.
2. Pretest and Answer Sheets – The participants will be given the pretest question paper and answer sheet.
3. Identification Information – The teacher must ensure each participant fills in his or her identification information, that is, the participant’s last four digits of their Identity Card Number and their home address number on the answer sheet and question paper.
4. Administration of Pretest – The teacher will say: “Please refer to the pretest. This test consists of three parts. You are given 30 minutes to complete the test. For each Part, please read the instructions carefully before answering the questions.”
5. Collection of Question Paper and Answer Sheet – The teacher needs to ensure the number of answer sheets and question papers tally with the number of participants present.

247
Third Part Directions
1. Introduction – The teacher will put the participants at ease by briefly explaining the purpose of the initial questionnaire. 2. Initial Questionnaire – The participants will be given the initial
questionnaire. 3. Identification Information – The teacher must ensure each participant
fills in his or her identification information, that is, the participant’s last four digits of their Identity Card Number and their home address number on the questionnaire.
4. Administration of the Questionnaire – The participants complete the questionnaire and submit to their teacher. Participants are advised to read the instructions carefully before answering.
During the Treatment The computer, projector and screen are ensured to be properly set-up for learning with PowerPoint presentation. Directions:
1. Introduction – The teacher will put the participants at ease and explain the purpose of this lesson, the topics involved, and the time (about 1.5 hours) taken to complete the lesson.
2. Learning Session – The teacher will conduct the lesson by using
PowerPoint slides for the topics of Internal Anatomy, Digestive System and Circulatory System.
3. Posttest and Answer Sheet - The participants will be given the posttest
question paper and answer sheet immediately after the learning session.
4. Identification Information – The teacher will ensure each participant fills in his or her identification information, that is, the participant’s last four digits of their Identity Card Number and their home address number on the answer sheet and question paper.
5. Administration of Posttest – Participants will be given 30 minutes to
complete the posttest.
6. Collection of Question Papers and Answer Sheets – The teacher needs to ensure the number of answer sheets and question papers tally with the number of participants present.
7. Final Questionnaire – Participants will be given the final questionnaire to
answer and submit to their teacher.

248
Appendix C
Pretest/Posttest (Actual Study)

249
Please write down: i. The last four digits of your Identification Card Number: ___________ ii. Your home address number: ___________ Instruction: The test is about the anatomy of the frog. Answer all questions in Part A, Part B and Part C. Please write down all answers on the Answer Sheet provided. Part A: Fill in the blank with the correct word or words. (liver, gall bladder, right, coelum, truncus arteriosis, stomach, oxygenated, left, pulmonary veins, duodenum, small intestine, spleen, veins) 1. The organ that is the first major site of chemical digestion is the ________ . 2. The body cavity where the internal organs are located is called the
___________. 3. Deoxygenated blood from all parts of the body enters the heart through the
_________________atrium. 4. The ____________________ connects the ventricle to the pulmonary arteries
to carry deoxygenated blood away from the heart. 5. __________________are blood vessels that always carry blood to the heart. 6. _______________________ blood leaves the heart and travels through the
rest of the frog’s body. 7. The first part of the small intestine is the __________________________ . 8. The organ found under the liver which stores bile is the
___________________ . 9. The largest organ in the body cavity is the ______________________. 10. The organ that functions as an emergency storage area for red blood cells is
the _____________________. 11. The ____________________ carry oxygenated blood from the lungs to the
heart. 12. The esophagus leads to the ______________________________ .

250
13. Oxygenated blood from the lungs enter the heart through the ___________
atrium. Part B: 1. On the diagram below, label the following organs of the frog internal
anatomy:
esophagus cloaca duodenum ileum jejunum
Figure 1 The internal organs
a.
b.
c.
d.
f.
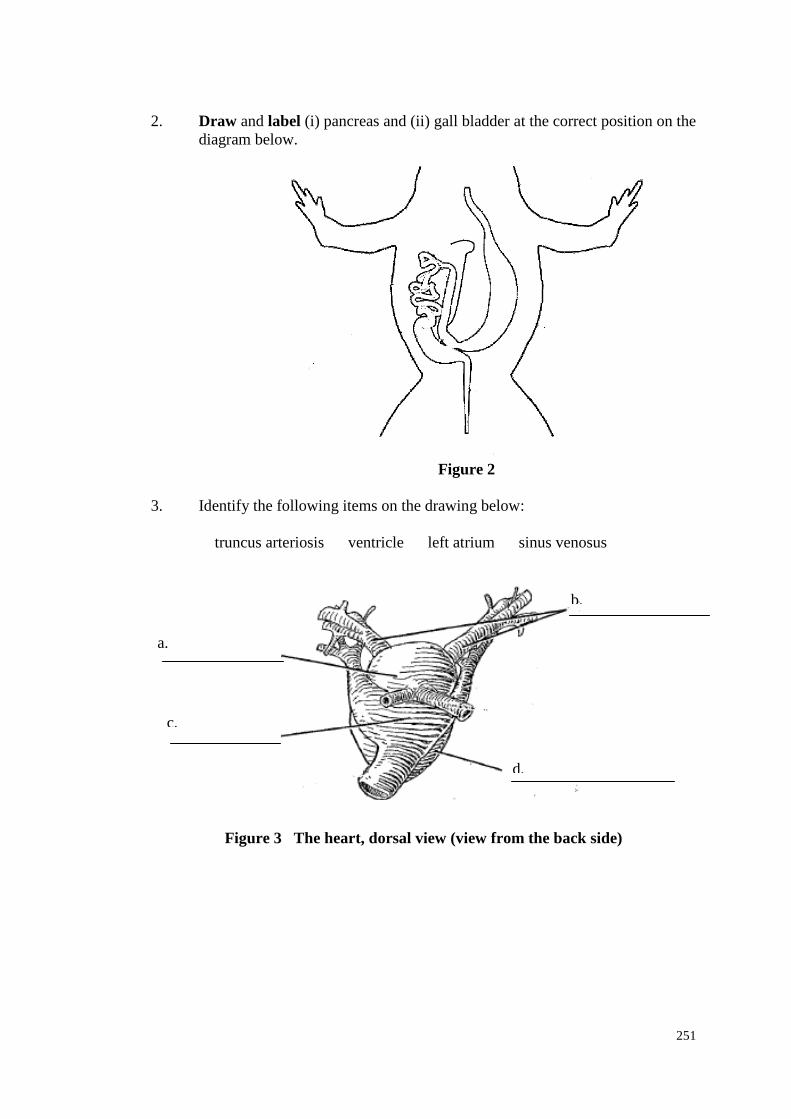
251
2. Draw and label (i) pancreas and (ii) gall bladder at the correct position on the diagram below.
Figure 2
3. Identify the following items on the drawing below: truncus arteriosis ventricle left atrium sinus venosus
Figure 3 The heart, dorsal view (view from the back side)
a.
c.
b.
d.

252
Part C: Choose the correct answer from the four alternatives (either A, B, C or D) below. Figure 4 and Figure 5 are on the last page (p. 5). Please refer to Figure 4 for Questions 1 to 5, and Figure 5 for Questions 6 to 8. 1. In Figure 4, “G” belongs to what system?
A. digestive B. urogenital C. circulatory D. respiratory
2. In Figure 4, the letter “H” indicates the
A. spleen B. stomach C. duodenum D. gall bladder
3. In Figure 4, the letter “I” indicates the A. pancreas B. kidney C. spleen D. gall bladder 4. In Figure 4, the letter “J” indicates the
A. liver B. duodenum C. spleen D. colon
5. In Figure, 4, which of the following functions as a blood storage organ
associated with the immune system? A. G B. H C. I D. J 6. In Figure 5, the letter “P” indicates the
A. right atrium B. left atrium C. ventricle D. pulmonary artery
253
7. In Figure 5, the function of “P” is
A. to cleanse blood B. to receive blood from the pulmonary arteries C. to produce red blood cells D. to receive blood from the sinus venosus
8. Which description best describes structure “Q” in Figure 5?
A. site of gas exchange when the frog is breathing air B. last chamber to contract during a heart beat C. receives blood from arteries D. receives blood from veins
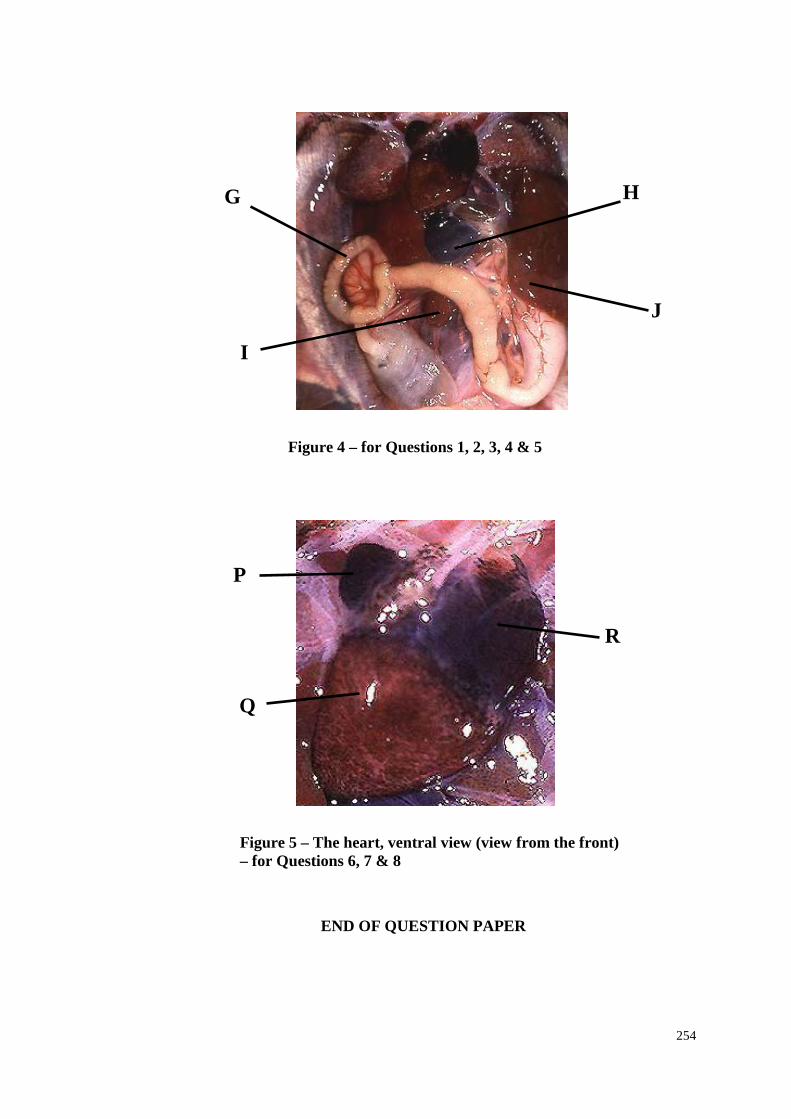
254
END OF QUESTION PAPER
G H
I
J
Figure 4 – for Questions 1, 2, 3, 4 & 5
P
Q
R
Figure 5 – The heart, ventral view (view from the front) – for Questions 6, 7 & 8
255
Appendix D
Initial Questionnaire (Actual Study)

256
Dear student: This questionnaire is designed to investigate your learning styles and consists of two parts:
Part A: Background Information Part B: Learning Styles
Completion of the questionnaires is entirely voluntary and you can decide not to participate at any time. All information given during the survey is confidential, no names or other information that might identify individuals will be obtained. If you have any questions about this project please feel free to contact me (Elinda Lee, [email protected] , Malaysia Mobile: +60128836361, Australia Mobile: +614 16713138), or my supervisors (Associate Professor Dr Kevin Wong, [email protected], +618 93606100). If you wish to talk to an independent person about your concerns, you can contact Murdoch University’s Human Research Ethics Committee on +618 9360 6677 or email [email protected] .

257
Please write down: 1) The last four digits of your Identification Card Number:
__________________ 2) Your home address number: ________________ This portion is aimed to gather your background information. Unless specified in the question, please select and tick ( √ ) only one appropriate answer for each of the following questions.
A1. Please write down your age: __________________
A2. What is your gender? Male Female A3. What is your ethnic group? Malay Chinese Indian Others, please specify: ____________________
Kolb Learning Style Inventory Version 3.1 Source: Kolb, D. A. (2007). Kolb Learning Style Inventory: LSI workbook Version
3.1. Boston, MA: HayGroup
PART A. Background Information
PART B. Learning Styles

258
Appendix E
Final Questionnaire for VR Mode (Actual Study)

259
Dear student: This questionnaire is designed to investigate your acceptance, learning processes and outcomes of using this type of computer software program for learning. It is a virtual reality software program. Virtual reality is an interactive three-dimension computer generated program in a multimedia environment which is implemented on a conventional personal computer. This questionnaire consists of seven parts:
Part A: Background Information Part B: Acceptance of the Computer Program Part C: Learning Process Part D: Features of the Computer Program Part E: Perceived Learning with the Computer Program Part F: Satisfaction with the Computer Program Part G: Suggestions and Comments
Completion of the questionnaire is entirely voluntary and you can decide not to participate at any time. All information given during the survey is confidential, and no names or other information that might identify individuals will be obtained. If you have any questions about this project please feel free to contact me (Elinda Lee, [email protected] , Malaysia Mobile: +60128836361, Australia Mobile: +614 16713138,) or my supervisor (Associate Professor Dr Kevin Wong, [email protected], +618 93606100.) If you wish to talk to an independent person about your concerns, you can contact Murdoch University’s Human Research Ethics Committee on +618 9360 6677 or email [email protected] .

260
Please write down: 1) The last four digits of your Identification Card Number: ________________ 2) Your home address number: ________________ This portion is aimed to gather your background information. Unless specified in the question, please select and tick ( √ ) only one appropriate answer for each of the following questions.
1. Do you have a computer at home?
Yes _______ No _______
2. How often do you use computers at home or at school? Always ____ Frequently _____ Sometimes _____ Seldom ____ Never ____
3. In what way do you use computers at home or at school? (Tick (√) all appropriate answers) Word processing ______ Drill-and-practice ______ Internet ______ Electronic mail ______ Games _____ Others, please specify: _______________________________
4. Did you know about “virtual reality” before taking this lesson? I knew nothing about virtual reality. _____ I had some knowledge about virtual reality. _____ I had lots of knowledge about virtual reality. _____ I had some experiences with virtual reality computer programs. _____
5. Would you like to use virtual reality programs in other school subjects? Yes ______ No ______ If yes, in which school subjects would you like to use virtual reality support? _______________________________________________________________________ _______________________________________________________________________ _______________________________________________________________________ _______________________________________________________________________
PART A. Background Information

261
This portion relates to your acceptance of the computer program for learning. Please circle only one answer for each of the following questions that best describes your opinion. 1. Using this type of computer program as a tool for learning in classroom increases/will
increase my learning and academic performance. 1 Strongly Disagree 2 Disagree 3 Neutral 4 Agree 5 Strongly Agree 2. Using this type of computer program enhances/will enhance the effectiveness on my
learning. 1 Strongly Disagree 2 Disagree 3 Neutral 4 Agree 5 Strongly Agree 3. This type of computer program allows/will allow me to progress at my own pace. (I can
use as much time as needed to practice and master the skills required). 1 Strongly Disagree 2 Disagree 3 Neutral 4 Agree 5 Strongly Agree 4. This type of computer program is useful in supporting my learning. 1 Strongly Disagree 2 Disagree 3 Neutral 4 Agree 5 Strongly Agree 5. Learning to operate this type of computer program is easy for me. 1 Strongly Disagree 2 Disagree 3 Neutral 4 Agree 5 Strongly Agree 6. Learning how to use this type of computer program in classes is too complicated and
difficult for me. 1 Strongly Disagree 2 Disagree 3 Neutral 4 Agree 5 Strongly Agree 7. It is easy for me to find information with the computer program. 1 Strongly Disagree 2 Disagree 3 Neutral 4 Agree 5 Strongly Agree 8. Overall, I think this type of computer program is easy to use. 1 Strongly Disagree 2 Disagree 3 Neutral 4 Agree 5 Strongly Agree This portion relates to the aspects of learning processes while using this type of computer program for learning. Please circle only one answer for each of the following questions that best describes your opinion. 1. I enjoyed this type of computer program very much. 1 Strongly Disagree 2 Disagree 3 Neutral 4 Agree 5 Strongly Agree
PART B. Acceptance of the Computer Program
PART C. Learning Processes

262
2. I think I am pretty good at this type of computer program. 1 Strongly Disagree 2 Disagree 3 Neutral 4 Agree 5 Strongly Agree 3. I put a lot of effort into this type of computer-based learning environment. 1 Strongly Disagree 2 Disagree 3 Neutral 4 Agree 5 Strongly Agree 4. It was important for me to do well at this type of computer program. 1 Strongly Disagree 2 Disagree 3 Neutral 4 Agree 5 Strongly Agree 5. Learning with this type of computer program was fun. 1 Strongly Disagree 2 Disagree 3 Neutral 4 Agree 5 Strongly Agree 6. I would describe this type of computer program as very interesting. 1 Strongly Disagree 2 Disagree 3 Neutral 4 Agree 5 Strongly Agree 7. I was satisfied with my performance in this type of computer-based learning
environment. 1 Strongly Disagree 2 Disagree 3 Neutral 4 Agree 5 Strongly Agree 8. I felt pressured while learning with this type of computer program. 1 Strongly Disagree 2 Disagree 3 Neutral 4 Agree 5 Strongly Agree 9. I didn’t try very hard while learning with this type of computer program. 1 Strongly Disagree 2 Disagree 3 Neutral 4 Agree 5 Strongly Agree 10. While learning with this type of computer program, I was thinking about how much I
enjoyed it. 1 Strongly Disagree 2 Disagree 3 Neutral 4 Agree 5 Strongly Agree 11. After trying this type of computer program for a while, I felt pretty competent. 1 Strongly Disagree 2 Disagree 3 Neutral 4 Agree 5 Strongly Agree 12. I was very relaxed while learning with this type of computer program. 1 Strongly Disagree 2 Disagree 3 Neutral 4 Agree 5 Strongly Agree 13. I am pretty skilled at this type of computer program. 1 Strongly Disagree 2 Disagree 3 Neutral 4 Agree 5 Strongly Agree

263
14. This type of computer program did not hold my attention. 1 Strongly Disagree 2 Disagree 3 Neutral 4 Agree 5 Strongly Agree 15. I couldn’t learn much using this type of computer program. 1 Strongly Disagree 2 Disagree 3 Neutral 4 Agree 5 Strongly Agree 16. This type of computer program makes the comprehension easier. 1 Strongly Disagree 2 Disagree 3 Neutral 4 Agree 5 Strongly Agree 17. This type of computer program makes the memorization easier. 1 Strongly Disagree 2 Disagree 3 Neutral 4 Agree 5 Strongly Agree 18. This type of computer program helps me to better apply what is learned. 1 Strongly Disagree 2 Disagree 3 Neutral 4 Agree 5 Strongly Agree 19. This type of computer program helps me to better analyze the problem. 1 Strongly Disagree 2 Disagree 3 Neutral 4 Agree 5 Strongly Agree 20. This type of computer program helps me to have a better overview of the content
learned. 1 Strongly Disagree 2 Disagree 3 Neutral 4 Agree 5 Strongly Agree 21. This type of computer program allows me to be more responsive and active in the
learning process. 1 Strongly Disagree 2 Disagree 3 Neutral 4 Agree 5 Strongly Agree 22. This type of computer program allows me to have more control over my own learning.
1 Strongly Disagree 2 Disagree 3 Neutral 4 Agree 5 Strongly Agree 23. This type of computer program promotes self-paced learning (can easily repeat learning
steps and processes as many times as required) 1 Strongly Disagree 2 Disagree 3 Neutral 4 Agree 5 Strongly Agree 24. This type of computer program helps to get myself engaged in the learning activity. 1 Strongly Disagree 2 Disagree 3 Neutral 4 Agree 5 Strongly Agree 25. I was able to reflect on how I learn. 1 Strongly Disagree 2 Disagree 3 Neutral 4 Agree 5 Strongly Agree

264
26. I was able to link new knowledge with my previous knowledge and experiences.
1 Strongly Disagree 2 Disagree 3 Neutral 4 Agree 5 Strongly Agree 27. I was able to become a better learner.
1 Strongly Disagree 2 Disagree 3 Neutral 4 Agree 5 Strongly Agree 28. I was able to reflect on my own understanding. 1 Strongly Disagree 2 Disagree 3 Neutral 4 Agree 5 Strongly Agree 29. There is a sense of presence (being there) while learning with this type of computer
program. 1 Strongly Disagree 2 Disagree 3 Neutral 4 Agree 5 Strongly Agree This portion investigates your opinions about the features of this type of computer program. Please circle only one answer for each of the following questions that best describes your opinion. 1. The realism of the three-dimensional (3-D) images in this type of computer program
motivates me to learn. 1 Strongly Disagree 2 Disagree 3 Neutral 4 Agree 5 Strongly Agree 2. The smooth changes of images in this type of computer program make learning more
motivating and interesting. 1 Strongly Disagree 2 Disagree 3 Neutral 4 Agree 5 Strongly Agree 3. The realism of the 3-D images in this type of computer program helps to enhance my
understanding. 1 Strongly Disagree 2 Disagree 3 Neutral 4 Agree 5 Strongly Agree 4. The ability to change the view position of the 3-D objects in this type of computer
program allows me to learn better. 1 Strongly Disagree 2 Disagree 3 Neutral 4 Agree 5 Strongly Agree 5. The ability to change the view position of the 3-D objects in this type of computer
program makes learning more motivating and interesting. 1 Strongly Disagree 2 Disagree 3 Neutral 4 Agree 5 Strongly Agree 6. The ability to manipulate the objects (eg: pick up, cut, change the size) within the virtual
environment makes learning more motivating and interesting. 1 Strongly Disagree 2 Disagree 3 Neutral 4 Agree 5 Strongly Agree
PART D. Features of the Computer Program

265
7. The ability to manipulate the objects in real time helps to enhance my understanding. 1 Strongly Disagree 2 Disagree 3 Neutral 4 Agree 5 Strongly Agree This portion investigates your perception on learning with this type of computer program. Please circle only one answer for each of the following questions that best describes your opinion. 1. I was more interested to learn the topics. 1 Strongly Disagree 2 Disagree 3 Neutral 4 Agree 5 Strongly Agree 2. I learned a lot of factual information in the topics. 1 Strongly Disagree 2 Disagree 3 Neutral 4 Agree 5 Strongly Agree 3. I gained a good understanding of the basic concepts of the materials. 1 Strongly Disagree 2 Disagree 3 Neutral 4 Agree 5 Strongly Agree 4. I learned to identify the main and important issues of the topics. 1 Strongly Disagree 2 Disagree 3 Neutral 4 Agree 5 Strongly Agree 5. I was interested and stimulated to learn more. 1 Strongly Disagree 2 Disagree 3 Neutral 4 Agree 5 Strongly Agree 6. I was able to summarize and conclude what I learned. 1 Strongly Disagree 2 Disagree 3 Neutral 4 Agree 5 Strongly Agree 7. The learning activities were meaningful. 1 Strongly Disagree 2 Disagree 3 Neutral 4 Agree 5 Strongly Agree 8. What I learned, I can apply in real context. 1 Strongly Disagree 2 Disagree 3 Neutral 4 Agree 5 Strongly Agree
PART E. Perceived Learning Effectiveness with the Computer Program

266
This portion investigates your satisfaction with this type of computer program for learning. Please circle only one answer for each of the following questions that best describes your opinion. 1. I was satisfied with this type of computer-based learning experience. 1 Strongly Disagree 2 Disagree 3 Neutral 4 Agree 5 Strongly Agree 2. A wide variety of learning materials was provided in this type of computer-based
learning environment. 1 Strongly Disagree 2 Disagree 3 Neutral 4 Agree 5 Strongly Agree 3. I don’t think this type of computer-based learning environment would benefit my
learning achievement. 1 Strongly Disagree 2 Disagree 3 Neutral 4 Agree 5 Strongly Agree 4. I was satisfied with the immediate information gained in this type of computer-based
learning environment. 1 Strongly Disagree 2 Disagree 3 Neutral 4 Agree 5 Strongly Agree 5. I was satisfied with the teaching methods in this type of computer-based learning
environment. 1 Strongly Disagree 2 Disagree 3 Neutral 4 Agree 5 Strongly Agree 6. I was satisfied with this type of computer-based learning environment. 1 Strongly Disagree 2 Disagree 3 Neutral 4 Agree 5 Strongly Agree 7. I was satisfied with the overall learning effectiveness. 1 Strongly Disagree 2 Disagree 3 Neutral 4 Agree 5 Strongly Agree 1. In what ways do you think this type of computer program is effective as an educational tool? __________________________________________________________________________ __________________________________________________________________________ __________________________________________________________________________
PART F. Satisfaction with the Computer Program
PART G. Suggestions and Comments

267
__________________________________________________________________________ __________________________________________________________________________ __________________________________________________________________________ __________________________________________________________________________ 2. Do you have any other comments on the use of this type of computer program for learning? __________________________________________________________________________ __________________________________________________________________________ __________________________________________________________________________ __________________________________________________________________________ __________________________________________________________________________ __________________________________________________________________________ Thank you for your participation. Your contribution to this survey is greatly appreciated. Do you want to receive a summary of this report by email? If Yes, please supply your email address: _______________________________ Alternatively, you may contact me at the given email address below. [email protected]

268
Appendix F
Final Questionnaire for Non-VR Mode (Actual Study)

269
Dear student: This questionnaire is designed to investigate the learning outcomes of using the conventional classroom learning method for learning. This questionnaire consists of three parts:
Part A: Background Information Part B: Perceived Learning Effectiveness with the Conventional Classroom Learning Method Part C: Satisfaction with the Conventional Classroom Learning Method
Completion of the questionnaire is entirely voluntary and you can decide not to participate at any time. All information given during the survey is confidential, no names or other information that might identify individuals will be obtained. If you have any questions about this project please feel free to contact me (Elinda Lee, [email protected] , Malaysia Mobile: +60128836361, Australia Mobile: +614 16713138), or my supervisors (Associate Professor Kevin Wong, [email protected], +618 93606100). If you wish to talk to an independent person about your concerns, you can contact Murdoch University’s Human Research Ethics Committee on +618 9360 6677 or email [email protected] .

270
Please write down: 1) The last four digits of your Identification Card Number: ________________ 2) Your home address number: ________________ This portion is aimed to gather your background information. Unless specified in the question, please select and tick (√ ) only one appropriate answer for each of the following questions.
A1. Do you have a computer at home? Yes _______ No _______ A2. How often do you use computers at home or at school? Always ____ Frequently _____ Sometimes _____ Seldom ____ Never ____ A3. In what way do you use computers at home or at school? (Tick (√ ) all appropriate answers) Word processing ______ Drill-and-practice ______ Internet ______ Electronic mail ______ Games _____ Others, please specify: _______________________________
This portion investigates your perception on learning with this type of conventional classroom learning method. Please circle only one answer for each of the following questions that best describes your opinion. 1. I was more interested to learn the topics. 1 Strongly Disagree 2 Disagree 3 Neutral 4 Agree 5 Strongly Agree 2. I learned a lot of factual information in the topics. 1 Strongly Disagree 2 Disagree 3 Neutral 4 Agree 5 Strongly Agree
PART A. Background Information
PART B. Perceived Learning Effectiveness with the Conventional Classroom Learning Method

271
3. I gained a good understanding of the basic concepts of the materials. 1 Strongly Disagree 2 Disagree 3 Neutral 4 Agree 5 Strongly Agree 4. I learned to identify the main and important issues of the topics. 1 Strongly Disagree 2 Disagree 3 Neutral 4 Agree 5 Strongly Agree 5. I was interested and stimulated to learn more. 1 Strongly Disagree 2 Disagree 3 Neutral 4 Agree 5 Strongly Agree 6. I was able to summarize and conclude what I learned. 1 Strongly Disagree 2 Disagree 3 Neutral 4 Agree 5 Strongly Agree 7. The learning activities are meaningful. 1 Strongly Disagree 2 Disagree 3 Neutral 4 Agree 5 Strongly Agree 8. What I learned, I can apply in real context. 1 Strongly Disagree 2 Disagree 3 Neutral 4 Agree 5 Strongly Agree This portion investigates your satisfaction with this type of conventional classroom learning method. Please circle only one answer for each of the following questions that best describes your opinion. 1. I was satisfied with this type of conventional classroom learning experience. 1 Strongly Disagree 2 Disagree 3 Neutral 4 Agree 5 Strongly Agree 2. A wide variety of learning materials was provided in this type of conventional classroom
learning environment. 1 Strongly Disagree 2 Disagree 3 Neutral 4 Agree 5 Strongly Agree 3. I don’t think this type of conventional classroom learning method would benefit my
learning achievement. 1 Strongly Disagree 2 Disagree 3 Neutral 4 Agree 5 Strongly Agree 4. I was satisfied with the immediate information gained in this type of conventional
classroom learning environment. 1 Strongly Disagree 2 Disagree 3 Neutral 4 Agree 5 Strongly Agree
PART C. Satisfaction with the Conventional Classroom Learning Method

272
5. I was satisfied with the teaching methods in this type of conventional classroom learning environment.
1 Strongly Disagree 2 Disagree 3 Neutral 4 Agree 5 Strongly Agree 6. I was satisfied with this type of conventional classroom learning environment. 1 Strongly Disagree 2 Disagree 3 Neutral 4 Agree 5 Strongly Agree 7. I was satisfied with the overall learning effectiveness. 1 Strongly Disagree 2 Disagree 3 Neutral 4 Agree 5 Strongly Agree Thank you for your participation. Your contribution to this survey is greatly appreciated. Do you want to receive a summary of this report by email? If Yes, please supply your email address: _______________________________ Alternatively, you may contact me at the given email address below. [email protected]

273
Appendix G
Posttest Item Analyses (Pilot Test)

274
Item Discrimination Index and Difficulty Index for Each Item
Item Group No of
Correct Proportion of
Correct Discrimination index, Difficulty index, Responses Responses d = PU - PL P = (PU + PL)/2
A1 U 13 1.000 0.462 0.769 L 7 0.538
A2 U 7 0.538 0.462 0.308 L 1 0.077
A3 U 13 1.000 0.769 0.615 L 3 0.231
A4 U 11 0.846 0.615 0.538 L 3 0.231
A5 U 12 0.923 0.615 0.615 L 4 0.308
A6 U 13 1.000 0.077 0.962 L 12 0.923
A7 U 13 1.000 0.154 0.923 L 11 0.846
A8 U 12 0.923 0.462 0.692 L 6 0.462
A9 U 13 1.000 0.538 0.731 L 6 0.462
A10 U 11 0.846 0.769 0.462 L 1 0.077
A11 U 11 0.846 0.462 0.615 L 5 0.385
A12 U 12 0.923 0.615 0.615 L 4 0.308
A13 U 12 0.923 0.769 0.538 L 2 0.154
A14 U 6 0.462 0.077 0.423 L 5 0.385
A15 U 12 0.923 0.538 0.654 L 5 0.385
B1a U 12 0.923 0.462 0.692 L 6 0.462
B1b U 12 0.923 0.308 0.769 L 8 0.615
B1c U 13 1.000 0.077 0.962 L 12 0.923
B1d U 11 0.846 0.231 0.731 L 8 0.615
B1e U 13 1.000 0.154 0.923 L 11 0.846
B1f U 13 1.000 0.000 1.000 L 13 1.000

275
Item Group No of
Correct Proportion of
Correct Discrimination index, Difficulty index, Responses Responses d = PU - PL P = (PU + Pl)/2
B1g U 13 1.000 0.308 0.846 L 9 0.692
B1h U 5 0.385 0.308 0.231 L 1 0.077
B1i H 2 0.154 0.154 0.077 L 0 0.000
B2a U 11 0.846 0.615 0.538 L 3 0.231
B2b U 7 0.538 0.308 0.385 L 3 0.231
B2c U 10 0.769 0.692 0.423 L 1 0.077
B2d U 10 0.769 0.231 0.654 L 7 0.538
B2e U 11 0.846 0.462 0.615 L 5 0.385
C1 U 9 0.692 0.077 0.654 L 8 0.615
C2 U 13 1.000 0.308 0.846 L 9 0.692
C3 U 7 0.538 0.231 0.423 L 4 0.308
C4 U 8 0.615 0.462 0.385 L 2 0.154
C5 U 8 0.615 0.385 0.423 L 3 0.231
C6 U 7 0.538 0.308 0.385 L 3 0.231
C7 U 10 0.769 0.538 0.500 L 3 0.231
C8 U 5 0.385 0.231 0.269 L 2 0.154
C9 U 6 0.462 0.308 0.308 L 2 0.154
276
Appendix H
Latent Mean Testing
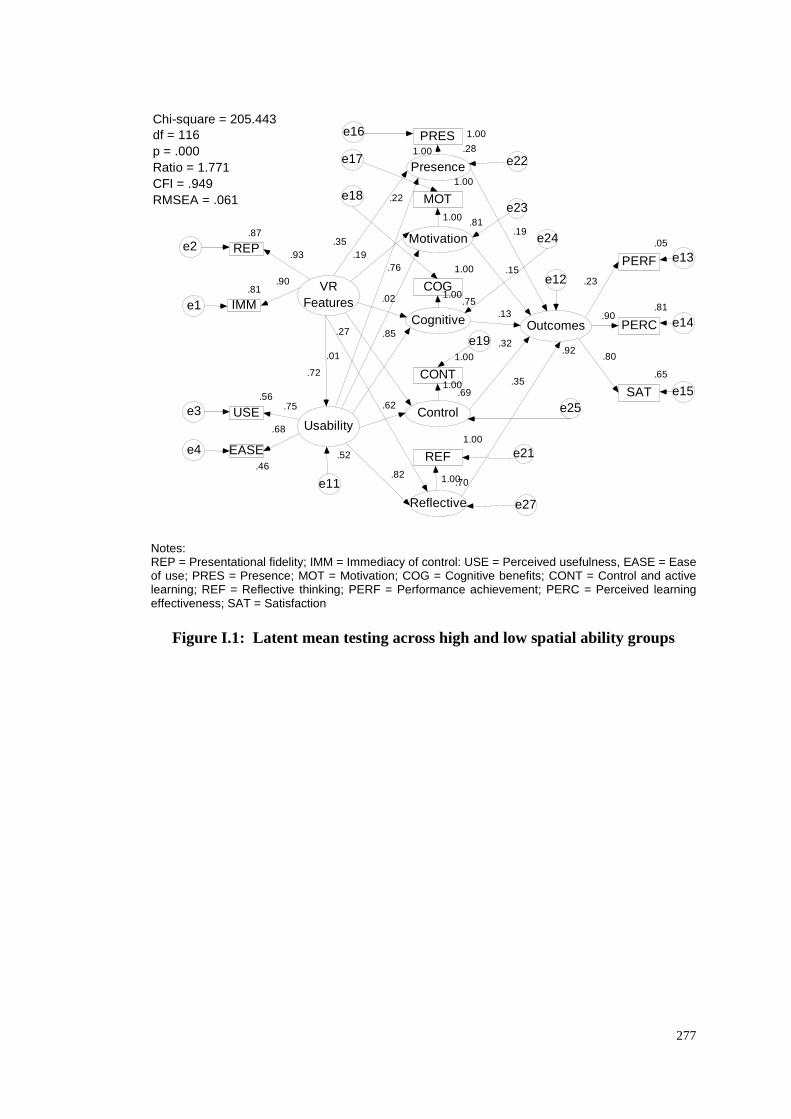
277
Notes: REP = Presentational fidelity; IMM = Immediacy of control: USE = Perceived usefulness, EASE = Ease of use; PRES = Presence; MOT = Motivation; COG = Cognitive benefits; CONT = Control and active learning; REF = Reflective thinking; PERF = Performance achievement; PERC = Perceived learning effectiveness; SAT = Satisfaction
Figure I.1: Latent mean testing across high and low spatial ability groups
VRFeatures
.81
IMMe1
.87
REPe2.93
.90
.92
Outcomes
.05
PERF e13
.23
.81
PERC e14
.65
SAT e15
.80
e12
.52
Usability
.46EASEe4
.68
.56
USEe3 .75
e11
.90
.72
.28
Presence
1.00PRESe161.00
.81
Motivation
1.00
MOT
e17
1.00
.75
Cognitive
1.00
COG
e18
1.00
.69
Control
1.00
CONT
e19
1.00
.70
Reflective
1.00
REF e21
.35.19
.02
.27
.22
.85
.62
.82
.19
.15
.13
.32
e22
e23
e24
e25
e27
.01
.76
.35
1.00
Chi-square = 205.443df = 116p = .000Ratio = 1.771CFI = .949RMSEA = .061

278
Notes: REP = Presentational fidelity; IMM = Immediacy of control: USE = Perceived usefulness, EASE = Ease of use; PRES = Presence; MOT = Motivation; COG = Cognitive benefits; CONT = Control and active learning; REF = Reflective thinking; PERF = Performance achievement; PERC = Perceived learning effectiveness; SAT = Satisfaction
Figure I.2: Latent mean testing across accommodator and assimilator groups
VRFeatures
.84
IMMe1
.79
REPe2 .89
.92
.96
Outcomes
.08
PERF e13
.28
.76
PERC e14
.63
SAT e15
.79
e12
.63
Usability
.50EASEe4
.71
.61
USEe3 .78
e11
.87
.80
.36
Presence
1.00PRESe16
1.00
.82
Motivation
1.00
MOT
e17
1.00
.74
Cognitive
1.00
COG
e18
1.00
.81
Control
1.00
CONT
e19
1.00
.68
Reflective
1.00
REF e21
.39
.16
.00
.25
.86
.65
.77
.19
.14
.14
.31
e22
e23
e24
e25
e271.00
.06
.77
.36
Chi-square = 210.235df = 116p = .000Ratio = 1.812CFI = .947RMSEA = .063
.29

279
References Adamo-Villani, N., & Wilbur, R. (2007). An immersive game for K-5 math and
science education. Paper presented at the 11th International Conference on Information Visualization, Zurich, Switzerland.
Adams, D., Nelson, R. R., & Todd, P. A. (1992). Perceived usefulness, ease of use, and usage of information technology: A replication. MIS Quarterly, 16(2), 227-247.
Ahmad, R., Piccoli, G., & Ives, B. (1998). Effectiveness of virtual learning environments in basic skills business education: A field study in progress. Paper presented at the Nineteenth International Conference on Information Systems, Helsinki, Finland.
Alavi, M. (1994). Computer-mediated collaborative learning: An empirical evaluation. MIS Quarterly, 18(2), 159-174.
Alavi, M., & Leidner, D. E. (2001). Research commentary: Technology-mediated learning—A call for greater depth and breadth of research. Information Systems Research, 12(1), 1-10.
Allen, K., Austin, T., Beach, R., Bergstrom, A., Exon, S., Fabri, M., et al. (2002). Creating and using virtual reality: A guide for the arts and humanities. Retrieved March 16, 2008, from http://vads.ahds.ac.uk/guides/vr_guide/sect11.html
Allison, D., & Hodges, L. F. (2000). Virtual reality for education. Paper presented at the ACM Symposium on Virtual Reality Software and Technology, Seoul, Korea.
Anderson, J. C., & Gerbing, D. W. (1988). Structural equation modeling in practice: A review and recommended two-step approach. Psychological Bulletin, 103(3), 411-423.
Antonietti, A., Rasi, C., Imperio, E., & Sacco, M. (2000). The representation of virtual reality in education. Education and Information Technologies, 5(4), 317-327.
Aoki, H., Oman, C. M., Buckland, D. A., & Natapoff, A. (2008). Desktop-VR system for preflight 3D navigation training. Acta Astronautica 63, 841-847.
Arbaugh, J. B., & Duray, R. (2002). Technological and structural characteristics, student learning and satisfaction with web-based courses: An exploratory study of two on-line MBA programs. Management Learning, 33(3), 331-347.
Auld, L. (1995). Differences between 3D computing and virtual reality. VR in the Schools Retrieved March 14, 2008, from http://vr.coe.edu/vrits/1-3Auld.htm
Ausburn, L. J., & Ausburn, F. B. (2004). Desktop virtual reality: A powerful new technology for teaching and research in industrial teacher education. Journal of Industrial Teacher Education, 41(4), 33-58.
Ausburn, L. J., & Ausburn, F. B. (2008). Effects of desktop virtual reality on learner performance and confidence in environment mastery: Opening a line of inquiry. Journal of Industrial Teacher Education, 45(1), 54-87.
Ausburn, L. J., Martens, J., Washington, A., Steele, D., & Washburn, E. (2009). A cross-case analysis of gender issues in desktop virtual reality learning environments. Journal of Industrial Teacher Education, 51(3), 51-89.
Baddeley, A. D. (1992). Working memory. Science, 255, 556-559.

280
Barnett, M., Yamagata-Lynch, L., Keating, T., Barab, S. A., & Hay, K. E. (2005). Using virtual reality computer models to support student understanding of astronomical concepts. Journal of Computers in Mathematics and Science Teaching, 24(4), 333-356.
Barrett, J., & Williams, G. (2003). Test your own aptitude. London, UK: Kogan Page.
Beier, K. P. (2004). Virtual reality: A short introduction. Retrieved April 9, 2010, from http://www-vrl.umich.edu/intro/index.html
Bell, J. T., & Fogler, H. S. (1995). The investigation of virtual reality based educational module for safety and hazard evaluation training. Paper presented at the American Society for Engineering Education, Indiana Sectional meeting, Peoria, IL.
Bell, J. T., & Fogler, H. S. (1997). Ten steps to developing virtual reality applications for engineering education. Paper presented at the American Society for Engineering Education, Milwaukee, WI.
Benbunan-Fich, R., & Hiltz, S. R. (2003). Mediators of the effectiveness of online courses. IEEE Transactions On Professional Communication, 46(4), 298-312.
Bentler, P. M., & Chou, C.-P. (1987). Practical issues in structural modeling. Sociological Methods & Research, 16, 78-117.
Berger, C. F., Lu, C. R., Belzer, S. J., & Voss, B. (1994). Research on the uses of technology in science education. In D. L. Gabel (Ed.), Handbook of research on science teaching and learning (pp. 466-490). New York: Macmillan Publishing Company.
Black, A. A. (2005). Spatial ability and earth science conceptual understanding. Journal of Geoscience Education, 53(4), 402-414.
Bloom, B. S. (1956). Taxonomy of educational objectives, Handbook 1: Cognitive domain. New York: David McKay Company Inc.
Bodemer, D., Ploetzner, R., Feuerlein, I., & Spada, H. (2004). The active integration of information during learning with dynamic and interactive visualizations. Learning and Instruction, 14(3), 325-341.
Bodner, G. M., & Guay, R. B. (1997). The Purdue visualization of rotations test. The Chemical Educator, 2(4), 1-17.
Bowman, D. A., & McMahan, R. P. (2007). Virtual reality: How much immersion is enough? Computer, 40(7), 36-42.
Bricken, W. (1990). Learning in virtual reality. Memorandum HITL-M-90-5. Seattle, WA: University of Washington, Human Interface Technology Laboratory.
Brown, J. D. (1997). Skewness & Kurtosis. Shiken: JALT Testing & Evaluation SIG Newsletter, 1(1), 20-23.
Browne, M. W., & Cudeck, R. (1993). Alternative ways of assessing model fit In K. A. Bollen & J. S. Long (Eds.), Testing structural equation models (pp. 445-455). Newbury Park, CA: Sage.
Burdea, G. C., & Coiffet, P. (2003). Virtual reality technology (2nd ed.). New Jersey: John Wiley & Sons.
Byrne, B. M. (2001). Structural equation modeling with AMOS. Mahwah, New Jersey: Lawrence Erlbaum Associates.

281
Cassidy, S. (2004). Learning styles: An overview of theories, models, and measures. Educational Psychology, 24(4), 419-444.
Chang, C. Y., & Barufaldi, J. (1999). The use of a problem–solving-based instructional model in initiating change in students' achievement and alternative frameworks. International Journal of Science Education, 21(4), 373-388.
Chee, Y. S. (2001). Virtual reality in education: Rooting learning in experience. Paper presented at the International Symposium on Virtual Education 2001, Busan, South Korea.
Chen, C. J. (2005). The design, development and evaluation of a virtual reality-based learning environment: Its efficacy in novice car driver instruction. Unpublished Ph.D. , University Science Malaysia.
Chen, C. J. (2006). Are spatial visualization abilities relevant to virtual reality? e-Journal of Instructional Science and Technology, 9(2), 1-16.
Chen, C. J., & Teh, C. S. (2000). An affordable virtual reality technology for constructivist learning environments. Paper presented at the 4th Global Conference on Computers in Education, Singapore.
Chen, C. J., & Toh, S. C. (2005). A feasible constructivist instructional development model for virtual reality (VR)-based learning environments: Its efficacy in the novice car driver instruction of Malaysia. Educational Technology Research and Development, 53(1), 111-123.
Chen, C. J., Toh, S. C., & Wan, M. F. (2004). The theoretical framework for designing desktop virtual reality-based learning environments. Journal of Interactive Learning Research, 15(2), 147-167.
Chen, C. J., Toh, S. C., & Wan, M. F. (2005). Are learning styles relevant to virtual reality? Journal of Research on Technology in Education, 38(2), 123-141.
Chickering, A. W., & Ehrmann, S. C. (1996). Implementing the seven principles: Technology as lever. Retrieved Oct 7, 2009, from http://2md.osu.edu/edtech/pdfs/seven_principles.pdf
Chin, W. W., & Todd, P. A. (1995). On the use, usefulness, and ease of structural equation modeling in MIS research: A note of caution. MIS Quarterly, 19(2), 237-247.
Choi, B.-S., & Gennaro, E. (1987). The effectiveness of using computer simulated experiments on junior high students' understanding of the volume displacement concept. Journal of Research in Science Teaching, 24(6), 539-552.
Chou, S. W., & Liu, C. H. (2005). Learning effectiveness in a web-based virtual learning environment: A learner control perspective. Journal of Computer Assisted Learning, 21, 65-76.
Chuah, K. M., Chen, C. J., & Teh, C. S. (2008). Incorporating kansei engineering in instructional design: Designing virtual reality based learning environments from a novel perspective. Themes in Science and Technology Education, 1(1), 37-48.
Coakes, S. J., & Steed, L. G. (2001). SPSS: Analysis without anguish. Milton, Qld: John Wiley & Sons Australia.
Cohen, J. W. (1988). Statistical power analysis for the behavioral sciences (2nd ed.). Hillsdale, NJ: Lawrence Erlbaum Associates.

282
Cohen, R. J., Swerdlik, M. E., & Philips, S. M. (1996). Psychological testing and assessment: An introduction to tests and measurement (3rd ed.). California: Mayfield Publishing Company.
Colis, B. (1999). Designing for difference: Cultural issues in the design of WWW-based course-support sites. British Journal of Educational Technology, 30(3), 201-215.
Collis, A. (1995). Anticipating the impact of multimedia in education: Lessons from the literature. Computers in Adult Education and Training, 2(2), 136-149.
Cooper, G. (1998). Research into cognitive load theory and instructional design at UNSW. Retrieved Sept 10, 2009, from http://education.arts.unsw.edu.au/staff/sweller/clt/
Cradler, J. (1997). Summary of current research and evaluation of findings on technology in education. Working Paper, Educational Support Systems, San Mateo, CA.
Creedy, D. K., Mitchell, M., Seaton-Sykes, P., Cooke, M., Patterson, E., Purcell, C., et al. (2007). Evaluating a web-enhanced bachelor of nursing curriculum: Perspectives of third-year students. Journal of Nursing Education, 46(10), 460-467.
Cronbach, L. J. (1957). The two disciplines of scientific psychology. American Psychologist, 12, 671-684.
Cronbach, L. J., & Snow, R. E. (1969). Individual differences in learning ability as a function of instruction variables. (Final report, Contract No. OEC-4-6-061269-1217), Stanford, CA: Stanford University, School of Education. (U.S. Office of Education, ERIC Document Reproduction Service No. ED 029 001).
Crosier, J. K., Cobb, S. V. G., & Wilson, J. R. (2000). Experimental comparison of virtual reality with traditional teaching methods for teaching radioactivity. Education and Information Technologies, 5(4), 329-343.
Crumpton, L. L., & Harden, E. L. (1997). Using virtual reality as a tool to enhance classroom instruction. Computers & Industrial Engineering, 33(1-2), 217-220.
Dalgarno, B. (1998). Choosing learner activities for specific learning outcomes: A tool for constructivist computer assisted learning design. In C. McBeath & R. Atkinson (Eds.), Planning for progress, partnership and profit: Proceedings EdTech'98. Perth: Australian Society for Educational Technology
Dalgarno, B. (2002). The potential of 3D virtual learning environments: A constructivist analysis. e-Journal of Instructional Science and Technology, 5(2), 19 pages.
Dalgarno, B., Bishop, A. G., Adlong, W., & Bedgood Jr, D. R. (2009). Effectiveness of a virtual laboratory as a preparatory resource for distance education chemistry students. Computers & Education, 53, 853-865.
Dalgarno, B., Hedberg, J., & Harper, B. (2002). The contribution of 3D environments to conceptual understanding. Paper presented at the ASCILITE 2002, Auckland, New Zealand.
Davis, F. D. (1989). Perceived usefulness, perceived ease of use, and user acceptance of information technology. MIS Quarterly, 13(3), 319-340.

283
De Jong, T. (2009). Cognitive load theory, educational research, and instructional design: Some food for thought. Instructional Science, Retrieved Sept 10, 2009, from http://www.springerlink.com.
Deci, E. L., & Ryan, R. M. (2000). The "what" and "why" of goal pursuits: Human needs and the self-determination of behaviour. Psychological Inquiry, 11(4), 227-268.
Dewey, J. (1933). How we think. Lexington, Massachusetts: DC Heath and Company.
Ding, L., Velicer, W. F., & Harlow, L. L. (1995). Effects of estimation methods, number of indicators per factor, and improper solutions on structural equation modeling fit indices. Structural Equation Modeling: A Multidisciplinary Journal, 2, 119-143.
Durlach, N., Allen, G., Darken, R., Garnett, R. L., Loomis, J., Templeman, J., et al. (2000). Virtual environments and the enhancement of spatial behavior: Towards a comprehensive research agenda. Presence: Teleoperators and Virtual Environments, 9(6), 593-615.
Ekstrom, R. B., French, J. W., Harman, H. H., & Dermen, D. (1976). Manual for kit of factor-referenced cognitive tests. Educational Testing Service, Princeton, N. J.
Fällman, D. (2000). Virtual reality in education: On-line survey. Retrieved 14 May 2007, from http://www.informatik.umu.se/~dfallman/projects/vrie
Fitzpatrick, J. J. (2008). Interactive virtual reality learning systems: Are they a better way to ensure proficiency? Retrieved Dec 9, 2008, from http://www.vrmariner.com/vr_learning.html
Fraenkel, J. R., & Wallen, N. E. (1996). How to design and evaluate research in education (3rd ed.). New York: McGraw-Hill.
Fox, J. , Arena, D., & Bailenson, J. N. (2009). Virtual reality: A survival guide for the social scientist. Journal of Media Psychology, 21(3), 95-113.
Gardner, H. (1993). Multiple intelligences: The theory in practice: New York: Basic Books.
Garson, G. D. (2009). Validity. Retrieved May 4, 2009, from http://faculty.chass.ncsu.edu/garson/PA765/validity.htm
Gribbons, B., & Herman, J. (1997). True and quasi-experimental designs. Practical Assessment, Research & Evaluation, 5(14). Retrieved Nov 30, 2010, from http://PAREonline.net/getvn.asp?v=5&n=14
Gustafson, K. L. (2002). The future of instructional design. In R. A. Rieser & J. V. Dempsey (Eds.), Trends and issues in instructional design and technology. New Jersey: Prentice Hall.
Hair, J. F., Anderson, R. E., Tatham, R. L., & Black, W. C. (1988). Multivariate data analysis. New Jersey: Prentice Hall.
Hair, J. F., Anderson, R. E., Tatham, R. L., & Black, W. C. (1995). Multivariate data analysis with readings (4th ed.). Eaglewood Cliffs, NJ: Prentice Hall.
Hair, J. F., Black, W. C., Babin, B. J., & Anderson, R. E. (2010). Multivariate data analysis: A global perspective (7th ed.). New Jersey: Pearson Prentice Hall.
Hair, J. F., Black, W. C., Babin, B. J., Anderson, R. E., & Tatham, R. L. (2006). Multivariate data analysis (6th ed.). New Jersey: Prentice Hall.

284
Hannafin, R. D., Truxaw, M. P., Vermillion, J. R., & Liu, Y. (2008). Effects of spatial ability and instructional program on geometry achievement. The Journal of Educational Research, 101(3), 148-156.
Hardré, P. L., & Sullivan, D. W. (2008). Student differences and environment perceptions: How they contribute to student motivation in rural high schools. Learning and Individual Differences, 18, 471-485.
Hasler, B. S., Kersten, B., & Sweller, J. (2007). Learner control, cognitive load and instructional animation. Applied Cognitive Psychology, 21, 713-729.
Hattie, J. (1985). Methodology review: Assessing unidimensionality of tests and items. Applied Psychological Measurement, 9, 139-164.
Hawk, T. F., & Shah, A. J. (2007). Using learning style instruments to enhance student learning. Decision Sciences Journal of Innovative Education, 5(1), 1-19.
Hayduck, L. A. (1987). Structural equation modeling with LISREL: Essentials and advances. Baltimore, MD: Johns Hopkins University Press.
Hays, T. A. (1996). Spatial abilities and the effects of computer animation on short-term and long-term comprehension. Journal of Educational Computing Research, 14, 139-155.
Hendrickson, A., Massey, P. D., & Cronan, T. P. (1993). On the test-retest reliability of perceived usefulness and perceived ease of use scales. MIS Quarterly, 17(2), 227-230.
Hiltz, S. R. (1995). Teaching in a virtual classroom. International Journal of Educational Telecommunications, 1(2), 185-198.
Honey, P., & Mumford, A. (1992). The manual of learning styles. Maidenhead: Peter Honey.
Hopkins, K. D. (1988). Educational and psychological measurement and evaluation (8th ed.). USA: Allyn & Bacon.
Hox, J. J., & Bechger, T. M. (1998). An introduction to structural equation modeling. Family Science Review, 11(4), 354-373.
Hu, L.-T., & Bentler, P. M. (1999). Cutoff criteria for fit indexes in covariance structural analysis: Conventional criteria versus new alternatives. Structural Equation Modeling: A Multidisciplinary Journal, 6(1), 1-55.
Huk, T. (2006). Who benefits from learning with 3D models? The case of spatial ability. Journal of Computer Assisted Learning, 22, 392-404.
Ieronutti, L., & Chittaro, L. (2007). Employing virtual humans for education and training in X3D/VRML worlds. Computers & Education, 49(1), 93-109.
Inoue, Y. (1999). Effects of virtual reality support compared to video support in a high-school world geography class. Campus-Wide Information Systems, 16(3), 95.
Inoue, Y. (2007). Concepts, applications, and research of virtual reality learning environments. International Journal of Social Sciences, 2(1), 1-7.
Jackson, J. L., Dezee, K., Douglas, K., & Shimeall, W. (2005). Introduction to structural equation modeling. Retrieved April 3, 2009, from http://www.sgim.org/userfiles/file/AMHandouts/AMO5/handouts/PA08.pdf
Jang, S., Jyung, R. W., & Black, J. B. (2007). How direct interaction in a virtual reality program aids in developing an internal representation of a complex 3-D structure. Paper presented at the World Conference on Educational Multimedia, Hypermedia and Telecommunication, Vancouver, Canada.

285
Jayaram, S. (1997). Special issue: Virtual reality. Computer-Aided Design, 29(8), 543-545.
Jonassen, D. H. (1993). Thinking technology: The trouble with learning environments. Educational Technology, 33(1), 35-37.
Jonassen, D. H. (1994). Thinking technology: Toward a constructivist design model. Educational Technology, 34(4), 34-37.
Jonassen, D. H., & Grabowski, B. L. (1993). Handbook of individual differences, learning, and instruction. Hillsdale, NJ: Lawrence-Erlbaum Associates.
Jonassen, D. H., Peck, K. L., & Wilson, B. G. (1999). Learning with technology: A constructivist perspective: Upper Saddle River, NJ: Prentice Hall, Inc.
Jones, A., Scanlon, E., Tosunoglu, C., Ross, S., Butcher, P., Murphy, P., et al. (1996). Evaluating CAL at the Open University: 15 Years on. Computers in Education, 26(1-3), 5-15.
Jöreskog, K. G., & Sörbom, D. (1993). LISREL 8: Structural equation modeling with the SIMPLIS command language. Hillsdale, NJ: Lawrence Erlbaum Associates.
Kalyuga, S., Ayres, P., Chandler, P., & Sweller, J. (2003). The expertise reversal effect. Educational Psychologist, 38 (1), 23-31.
Kaser, K. C. (1996). The effects of virtual reality on learning office layout design. Unpublished Ph.D., The University of Nebraska–Lincoln, Nebraska, United States.
Kaufmann, H., Schmalstieg, D., & Wagner, M. (2000). Construct3D: A virtual reality application for mathematics and geometry education. Education and Information Technologies, 5(4), 263-276.
Kayes, D. C. (2005). Interval validity and reliability of Kolb's learning styles inventory version 3 (1999). Journal of Business and Psychology, 20(2), 249-257.
Keehner, M., & Khooshabeh, P. (2002). Computerized representations of 3D structure: How spatial comprehension and patterns of interactivity differ among learners. Retrieved Sept 3, 2008, from http://media.igert.ucsb.edu/pubdls/Keehn&Khoosh.pdf
Keehner, M., Montello, D. R., Hegarty, M., & Cohen, C. (2004). Effects of interactivity and spatial ability on the comprehension of spatial relations in a 3D computer visualization. In K. Forbus, D. Gentner & T. Regier (Eds.), Proceedings of the 26th Annual Conference of the Cognitive Science Society Erlbaum, Mahwah, NJ.
Keller, J. M. (1983). Motivational design of instruction. In C. M. Reigeluth (Ed.), Instructional Design Theories and Models: An Overview of Their Current Status (pp. 383-434). Hillsdale, New Jersey: Lawrence Erlbaum Associates.
Kelley, T. L. (1939). The selection of upper and lower groups for the validation of test items. Journal of Educational Psychology, 30(1), 17-24.
Khalil, M. K., Paas, F., Johnson, T. E., & Payer, A. (2005). Design of interactive and dynamic anatomical visualizations: The implication of cognitive load theory. The Anatomical Record (Part B: New Anat.), 286B, 15-20.
Kim, J. H., Park, S. T., Lee, H., Yuk, K. C., & Lee, H. (2001). Virtual reality simulations in physics education. Retrieved Oct 11, 2007, from http://imej.wfu.edu/articles/2001/2/02/index.asp

286
Kim, T., & Biocca, F. (1997). Telepresence via television: Two dimensions of telepresence may have different connections to memory and persuasion. Journal of Computer-Mediated Communication, 3(2).
Kinzie, M. B., Sullivan, H. J., & Berdel, R. L. (1988). Learner control and achievement in science computer-assisted instruction. Journal of Educational Psychology, 80(3), 299-303.
Kirschner, P. A. (2002). Cognitive load theory: Implications of cognitive load theory on the design of learning. Learning and Instruction, 12, 1-10.
Kolb, A. Y., & Kolb, D. A. (2005). The Kolb learning style inventory—version 3.1 2005 technical specifications. Retrieved Nov 4, 2008, from http://www.learningfromexperience.com/images/uploads/Tech_spec_LSI.pdf
Kolb, D. A. (1976). Learning Style Inventory Technical Manual. Boston, MA: McBer and Company.
Kolb, D. A. (1984). Experiential learning: Experience as a source of learning and development: Englewood Cliffs, NJ: Prentice-Hall.
Kolb, D. A. (2007). Kolb Learning Style Inventory: LSI workbook Version 3.1. Boston, MA: HayGroup
Kumar, R. (2005). Research methodology: A step-by-step guide for beginners (2nd ed.). NSW, Australia: Pearson.
Kwan, O. N., Kim, S. H., & Kim, Y. (2002). Enhancing spatial visualization through virtual reality on the web: Software design and impact analysis. Journal of Computers in Mathematics and Science Teaching, 21(1), 17-31.
Lajoie, S. P. (2008). Individual differences in spatial ability: Developing technologies to increase strategy awareness and skills. Educational Psychologist, 38(2), 115-125.
Lal, V. (2002). Cultural difference and its influence on learning with computer-based technologies is schools. Retrieved April 23, 2010, from http://www.effectsproject.uts.edu.au/project_papers/3_vijendra_lal.pdf
Lee , E. A.-L., & Wong, K. W. (2008). A review of using virtual reality for learning. Transactions on Edutainment 1, LNCS 5080, 231-241.
Lee , E. A.-L., Wong, K. W., & Fung, C. C. (2009a). Educational values of virtual reality: The case of spatial ability. In C. Ardil (Ed.), Proceedings of World Academy of Science, Engineering and Technology. Paris, France.
Lee , E. A.-L., Wong, K. W., & Fung, C. C. (2009b). Learning effectiveness in a desktop virtual reality-based learning environment. In S. C. Kong, H. Ogata, H. C. Arnseth, C. K. K. Chan, T. Hiroshima, F. Klett, J. H. M. Lee, C. C. Liu, C. K. Looi, M. Milrad, A. Mitrovic, K. Nakabayashi, S. L. Wong & S. J. H. Yang (Eds.), Proceedings of the17th International Conference on Computers in Education [CDROM]. Hong Kong: Asia-Pacific Society for Computers in Education.
Lee, E. A.-L., Wong, K. W., & Fung, C. C. (2010a). Learning with virtual reality: Its effects on students with different learning styles. Transactions on Edutainment IV, LNCS 6250, 79-90.
Lee, E. A.-L., Wong, K. W., & Fung, C. C. (2010b). How Does Desktop Virtual Reality Enhance Learning Outcomes? A Structural Equation Modeling Approach, Computers and Education, 55(4), 1424-1442.
287
Lee, J., Hong, N. L., & Ling, N. L. (2001). An analysis of students' preparation for the virtual learning environment. The Internet and Higher Education, 4(3-4), 231-242.
Leidner, D. E., & Jarvenpaa, S. L. (1995). The use of information technology to enhance management school education: A theoretical view. MIS Quarterly, 19(3), 265-291.
Lepper, M. R. (1985). Microcomputers in education: Motivational and social issues. American Psychologist, 40, 1-18.
Leung, D. Y. P., & Kember, D. (2003). The relationship between approaches to learning and reflection upon practice. Educational Psychology, 23(1), 61-71.
Li, F. C., Angelier, J., Deffontaines, B., Hu, J. C., Hsu, S. H., Lee, C. H., et al. (2002). A virtual reality application for distance learning of Taiwan stream erosion in Geosciences. Paper presented at the International Conference on Computers in Education.
Lin, W.-H., & Dembo, R. (2008). An integrated model of juvenile drug use: A cross-demographic groups study. Western Criminology Review, 9(2), 33-51.
Linn, M., & Petersen, A. C. (1985). Emergence and characterization of sex differences in spatial ability: A meta-analysis. Child Development, 56, 1479-1498.
Linnenbrink, E. A., & Pintrich, P. R. (2002). Motivation as an enabler for academic success. School Psychology Review, 31(3), 313-327.
Liu, W., Cheok, A. D., Lim, C. M. L., & Theng, Y. L. (2007). Mixed reality classroom—learning from entertainment. Paper presented at the Second International Conference on Digital Interactive Media in Entertainment and Arts, Perth, Australia.
Ma, R., & Kaber, D. B. (2006). Presence, workload and performance effects of synthetic environment design factors. International Journal of Human-Computer Studies, 64, 541-552.
MacCallum, R. C., Browne, M. W., & Sugawara, H. M. (1996). Power analysis and determination of sample size for covariance structure modeling. Psychological Methods, 1(2), 130-149.
Maki, R. H., Maki, W. S., Patterson, M., & Whittaker, P. D. (2000). Evaluation of a web-based introductory psychology course: Learning and satisfaction in on-line versus lecture courses. Behavior Research Methods, Instruments and Computers, 32(2), 230-239.
Mania, K., & Chalmers, A. (2000). A user-centered methodology for investigating presence and task performance. Paper presented at the Presence 2000 Workshop, March 27-28, Delft.
Maor, D., & Fraser, B. J. (2005). An online questionnaire for evaluating students' and teachers' perceptions of constructivist multimedia learning environments. Research in Science Education, 35, 221-244.
Marks, R. B., Sibley, S. D., & Arbaugh, J. B. (2005). A structural equation model of predictors for effective online learning. Journal of Management Education, 29(4), 531-563.
Martens, R., Bastiaens, T., & Kirschner, P. A. (2007). New learning design in distance education: The impact on student perception and motivation. Distance Education, 28(1), 81-93.

288
Mayer, R. E. (2001). Multimedia learning. Cambridge, UK: Cambridge University Press.
Mayer, R. E., & Sims, V. K. (1994). From whom is a picture worth a thousand words? Extensions of a dual-coding theory of multimedia learning. Journal of Educational Psychology, 86, 389-401.
McArdle, G., Monahan, T., Bertolotto, M., & Mangina, E. (2004). A web-based multimedia virtual reality environment for e-learning. Paper presented at the Eurographics.
McAuley, E., Duncan, T., & Tammen, V. V. (1989). Psychometric properties of the intrinsic motivation inventory in a competitive sport setting: A confirmatory factor analysis. Research Quarterly For Exercise And Sport, 60(1), 48-58.
McDonald, R. P. (1981). The dimensionality of tests and items. British Journal of Mathematical and Statistical Psychology 34, 111-117.
McGee, M. G. (1979). Human spatial abilities, sources of sex differences. New York: Praeger.
McGill, T. J., & Klobas, J. E. (2009). A task-technology fit view of learning management system impact. Computers & Education, 52(2), 496-508.
McGreevy, M. W. (1992). The presence of field geologists in Mars-like terrain. Presence: Teleoperators and Virtual Environments, 1(4), 375-403.
McLellan, H. (1998). Cognitive issues in virtual reality. Journal of Visual Literacy, 18(2), 175-199.
McLellan, H. (2004). Virtual Realities. In D. H. Jonassen (Ed.), Handbook of Research on Educational Communications and Technology. Mahwah, NJ: Erlbaum Associates, Mahwah, NJ.
Mergel, B. (1998). Instructional design & learning theory. Retrieved Oct 31, 2007, from http://www.usask.ca/education/coursework/802papers/mergel/brenda.htm
Merrill, M. D. (1975). Learner control: Beyond aptitude-treatment interactions. Educational Technology Research and Development, 23(2), 217-226
Merrill, M. D. (1994). Instructional design theory. Englewood Cliffs, NJ: Educational Technology Publications.
Messick, S. (1976). Personal styles and educational options. In S. Messick (Ed.), Individuality in learning. San Francisco: Jossey-Bass.
Mezirow, J. (1991). Transformative dimensions of adult learning. San Francisco: Jossey-Bass.
Mezirow, J. (1998). On critical reflection. Adult Education Quarterly, 48, 185-198. Michael, W. B., Guildford, J. P., Fruchter, B., & Zimmerman, W. S. (1957). The
description of spatial-visualization abilities. Education and Psychological Measurement, 17, 185-199.
Milheim, M. D., & Martin, B. L. (1991). Theoretical bases for the use of learner control: Three different perspectives. Journal of Computer-Based Instruction, 18, 99-105.
Miller, G. A. (1956). The magical number seven, plus or minus two: Some limits on our capacity for processing information. Psychological Review, 63, 81-97.
Moallem, M. (2001). Applying constructivist and objectivist learning theories in the design of a Web-based course: Implications for practice. Educational Technology & Society, 4(3), 113-125.

289
Mohler, J. L. (1999). Utilizing desktop virtual reality to enhance visualization: Applied projects from the Department of Computer Graphics. Paper presented at the Proceedings of IEEE International Conference of Information Visualization.
Monahan, T., McArdle, G., & Bertolotto, M. (2008). Virtual reality for collaborative e-learning. Computers & Education, 50(4), 1339-1353.
Moreno, R., & Mayer, R. E. (1999). Cognitive principles of multimedia learning: The role of modality and contiguity. Journal of Educational Psychology, 91(2), 358-368.
Mulaik, S. A., James, L. R., Alstine, J. V., Bennett, N., Lind, S., & Stilwell, C. D. (1989). Evaluation of goodness-of-fit indices for structural equation models. Psychological Bulletin, 105, 430-445.
Müller, D., & Ferreira, J. M. (2005). Online labs and the MARVEL experience. International Journal on Online Engineering, 1(1).
Neale, H., & Nichols, S. (2001). Theme-based content analysis: A flexible method for virtual environmental evaluation. International Journal of Human-Computer Studies, 55, 167-189.
Newsom, J. (2006). Simple effects, simple contrasts, and main effect contrasts. Retrieved Nov 15, 2009, from www.upa.pdx.edu/IOA/newsom/da1/ho_factorial%20follow-ups.doc
Nichols, R. (2009). Welcome to 3-D learning. Retrieved Sept 9, 2009, from http://www.convergemag.com/edtech/Virtual-Simulations-Take-Learning-to-Higher-Dimension.html
Norman, K. L. (1994). Spatial visualization—A gateway to computer-based technology. Journal of Special Education Technology, 7(3), 195-206.
Nunez, D. (2004). How is presence in non-immersive, non-realistic virtual environments possible? Paper presented at the 3rd International Conference on Computer Graphics, Virtual Reality, Visualization and Interaction, Africa.
Nunnally, J. C. (1978). Psychometric Theory (2nd ed.). New York: McGraw Hill. Ong, S. K., & Mannan, M. A. (2004). Virtual reality simulations and animations in a
web-based interactive manufacturing engineering module. Computers & Education, 43(4), 361-382.
Pallant, J. (2007). SPSS Survival Manual (3rd ed.). Sydney, Australia: Allen & Unwin.
Palma-Rivas, N. (2000). Using technology to facilitate learning. New Directions For Community Colleges, 112, 73-83.
Pan, Z., Cheok, A. D., Yang, H., Zhu, J., & Shi, J. (2006). Virtual reality and mixed reality for virtual learning environments. Computers & Graphics, 30(1), 20-28.
Pantelidis, V. S. (1995). Reasons to use virtual reality in education. Retrieved June 27, 2006, from http://vr.coe.ecu.edu/reas.html
Phan, H. P. (2007). An examination of reflective thinking, learning approaches, and self-efficacy beliefs at the University of the South Pacific: A path analysis approach. Educational Psychology, 27(6), 789.
Piccoli, G., Ahmad, R., & Ives, B. (2001). Web-based virtual learning environments: A research framework and a preliminary assessment of effectiveness in basic IT skills training. MIS Quarterly, 25(4), 401-426.

290
Plass, J. L., & Homer, B. D. (2002). Cognitive load in multimedia learning: The role of learner preferences and abilities. Paper presented at the International Conference on Computers in Education, Auckland, New Zealand.
Rafi, A., Anuar, K., Samad, A., Hayati, M., & Mahadzir, M. (2005). Improving spatial ability using a web-based virtual environment. Automation in Construction, 14, 707-715.
Reigeluth, C. M. (1999). What is instructional-design theory and how is it changing? In C.M.Reigeluth (Ed.), Instructional-design theories and models—a new paradigm of instructional theory (pp. 5-29). Hillsdale, NJ: Lawrence Erlbaum.
Rezabek, R. (1995). The relationships among measures of intrinsic motivation, instructional design, and learning in computer-based instruction. Paper presented at the 1995 Annual National Convention of the Association for Educational Communications and Technology (AECT), Anaheim, CA.
Rieber, L. (1996). Seriously considering play: Designing interactive learning environments based on the blending of microworlds, simulations, and games. Educational Technology Research and Development, 44(2), 43-58.
Rivers, R. H., & Vockell, E. (1987). Computer simulations to stimulate scientific problem solving. Journal of Research in Science Teaching, 24(5), 403-415.
Roblyer, M. D. (2003). Integrating educational technology into teaching (3rd ed.). NJ: Pearson Education.
Roussou, M. (2004). Learning by doing and learning through play: An exploration of interactivity in virtual environments for children. Computers in Entertainment, 2(1), 10-23.
Ruble, T. L., & Stout, D. E. (1990). Reliability, construct validity, and response-set bias of the revised learning-style inventory (LSI-1985). Education and Psychological Measurement, 50(3), 619-629.
Ruble, T. L., & Stout, D. E. (1991). Reliability, classification stability, and response set-bias of alternative forms of the learning style inventory (LSI-1985). Education and Psychological Measurement, 51(2), 481-489.
Salzman, M. C., Dede, C., Loftin, R. B., & Chen, J. (1999). A model for understanding how virtual reality aids complex conceptual learning. Presence: Teleoperators and Virtual Environments, 8(3), 293-316.
Salzman, M. C., & Loftin, R. B. (1996). ScienceSpace: Lessons for designing immersive virtual realities. Paper presented at the CHI 96, Vancouver, Canada.
Sanchez, A., Barreiro, J. M., & Maojo, V. (2000). Design of virtual reality systems for education: a cognitive approach. Education and Information Technologies, 5, 345-362.
Schuemie, M. J., Van Der Straaten, P., Krijn, M., & Van Der Mast, C. A. P. G. (2001). Research on presence in virtual reality: A survey. Cyberpsychology & Behaviour, 4, 183-210.
Schumacker, R. E., & Lomax, R. G. (2004). A beginner's guide to structural equation modeling (2nd ed.). Mahwah, NJ: Lawrence Erlbaum Associates, Inc.
Schutte, J. G. (1997). Virtual teaching in higher education: The new intellectual superhighway or just another traffic jam? Retrieved Jan 24, 2008, from
291
http://ddi.cs.uni-potsdam.de/HyFISCH/Teleteaching/VirtualTeachingSchutte.htm
Schwan, S., & Riempp, R. (2004). The cognitive benefits of interactive videos: Learning to tie nautical knots. Learning and Instruction 14, 293-305.
Segars, A. H., & Grover, V. (1993). Re-examining perceived ease of use and usefulness: A confirmatory factor analysis. MIS Quarterly, 17(4), 517-525.
Sharda, R., Romano Jr, N. C., Lucca, J. A., Weiser, M., Scheets, G., Chung, J. M., et al. (2004). Foundation for the study of computer-supported collaborative learning requiring immersive presence. Journal of Management Information Systems, 20(4), 31-63.
Shuell, T. J., & Lee, C. Z. (1976). Learning and instruction. Monterey, CA: Brooks-Cole.
Silva, L. F., Cardoso, A., Mendes, E. B., Takahashi, E. K., & Martins, S. (2006). Associating non-immersive virtual reality and cognitive tools for Physics Teaching. Paper presented at the 9th International Conference on Engineering Education, San Juan, Puerto Rico.
Singh, J. (1995). Measurement issues in cross-national research. Journal of International Business Studies, 26(3), 597-619.
Slater, M. (2003). A note on presence terminology. Retrieved July 26, 2009, from http://www.cs.ucl.ac.uk/research/vr/Projects/Presencia/ConsortiumPublications/ucl_cs_papers/presence-terminology.htm
Slater, M., & Usoh, M. (1994). Representation systems, perceptual positions, and presence in immersive virtual environments. Presence: Teleoperators and Virtual Environments, 2(3),MIT Press 221-233.
Song, K. S., & Lee, W. Y. (2002). A virtual reality application for geometry classes. Journal of Computer Assisted Learning, 18, 149-156.
Stevens, J. (1996). Applied multivariate statistics for the social sciences (3rd ed.). Mahwah, NJ: Lawrence Erlbaum Associates.
Stipek, D. J., & Weisz, J. R. (1981). Perceived personal control and academic achievement. Review of Educational Research, 51, 101-137.
Strangman, N., & Hall, T. (2003). Virtual reality/simulations. Wakefield, MA: National Center on Accessing the General Curriculum. Retrieved May 9, 2006, from http://www.cast.org/publications/ncac/ncac_vr.html
Sun, P.-C., Tsai, R. J., Finger, G., Chen, Y.-Y., & Yeh, D. (2008). What drives a successful e-Learning? An empirical investigation of the critical factors influencing learner satisfaction. Computers & Education, 50(4), 1183-1202.
Sung, W.-T., & Ou, S.-C. (2002). Learning computer graphics using virtual reality technologies based on constructivism - case Study of the WebDeGrator system. Interactive Learning Environments, 10(3), 177-197.
Swanson, E. B. (1987). Information channel disposition and use. Decision Sciences, 18(1), 131-145.
Sweller, J. (1999). Instructional design in technical areas: Camberwell, Australia: ACER.
Sweller, J., & Chandler, P. (1994). Why some material is difficult to learn. Cognition and Instruction, 12(3), 185-233.
Szajna, B. (1994). Software evaluation and choice: predictive evaluation of the technology acceptance instrument. MIS Quarterly, 18(3), 319-324.

292
Tabachnick, B. G., & Fidell, L. S. (2007). Using multivariate statistics (5th ed.). USA: Pearson Education, Inc.
Tactus Technologies. (2007). V-Frog: Virtual frog dissection. Retrieved May 22, 2009, from http://www.tactustech.com/products/vfrog/documents/V-Frog-White-Paper.pdf
Teo, T. (2008). Assessing the computer attitudes of students: An Asian perspective. Computers in Human Behavior, 24(4), 1634-1642.
Tobias, S. (1980). Adapting instruction to individual differences among students. Paper presented at The Annual Meeting of the American Educational Research Association.
Ullman, J. B. (2007). Structural equation modeling. In B. G. Tabachnick & L. S. Fidell (Eds.), Using Multivariate Statistics (5th ed., pp. 676-780). USA: Pearson Education, Inc.
Um, E., Song, H., & Plass, J. (2007). The effect of positive emotions on multimedia learning. Paper presented at the Proceeding of World Conference on Educational Multimedia, Hypermedia and Telecommunications, Chesapeake, VA.
Um, E. R. (2008). The effect of positive emotions on cognitive processes in multimedia-based learning. Unpublished Dissertation, New York City.
Usoh, M., Alberto, C., & Slater, M. (1996). Presence: Experiments in the psychology of virtual environments. Retrieved July 26, 2009, from http://www.cs.umu.se/kurser/TDBD12/VT07/articles/precense-paper-teap_full96.pdf
van Merriënboer, J. J. G., & Sweller, J. (2005). Cognitive load theory and complex learning: Recent developments and future directions. Educational Psychology Review, 17(2), 147-177.
Virvou, M., Katsionis, G., & Manos, K. (2005). Combining software games with education: Evaluation of its educational effectiveness. Educational Technology and Society, 8(2), 54-65.
Wan, Z., Fang, Y., & Neufeld, D. J. (2007). The role of information technology in technology-mediated learning: A review of the past for the future. Journal of Information Systems Education, 18(2), 183 - 192.
Webster, J., & Hackley, P. (1997). Teaching effectiveness in technology-mediated distance learning. Academy of Management Journal, 40(6), 1282-1309.
Wekesa, E., Kiboss, J., & Ndigangu, M. (2006). Improving students' understanding and perception of cell theory in school biology using a computer-based instruction simulation program. Journal of Educational Multimedia and Hypermedia, 15(4), 397-410.
Wen, J. R., & Hsu, L. L. (2000). The effect of virtual reality learning with different cognitive style. Paper presented at the International Conference on Computers in Education/International Conference on Computer-Assisted Instruction, Taipei, Taiwan.
Wetzel, C. D., Radtke, P. H., & Stern, H. W. (1994). Instructional effectiveness of video media. Hillsdale, NJ: Lawrence Erlbaum Associates.
Wierstra, R. F. A., & DeJong, J. A. (2002). A scaling theoretical evaluation of Kolb's learning style inventory-2. In M. Valcke & D. Gombier (Eds.), Learning styles: reliability and validity, 431-440. Proceedings of the seventh annual

293
European learning styles information network, 26-28 June. Ghent, Belgium: University of Ghent.
Wilbourne, M. (2006). Intrinsic and extrinsic motivational orientations in the classroom: Age differences and academic correlates. Childhood Education, 82(5), 311.
Williams, M. D. (1996). Learner-control and instructional technologies. In D. H. Jonassen (Ed.), Handbook of research and educational communications and technology. New York: Simon and Schuster Macmillan.
Witkin, H. A. (1976). Cognitive style in academic performance and in teacher-student relations. In S. Messick (Ed.), Individuality in learning. San Francisco: Jossey-Bass.
Witmer, B. G., & Singer, M. J. (1998). Measuring presence in virtual environments: A presence questionnaire. Presence, 7(225-240).
Wu, H. K., & Shah, P. (2004). Exploring visuospatial thinking in chemistry learning. Science Education, 88, 465-492.
Yaman, M., Nerdel, C., & Bayrhuber, H. (2008). The effects of instructional support and learner interests when learning using computer simulations. Computers & Education, 51(4), 1784-1794.
Yang, K.-Y., & Heh, J.-S. (2007). The impact of internet virtual physics laboratory instruction on the achievement in physics, science process skills and computer attitudes of 10th-grade students. Journal of Science Education and Technology, 16(5), 451-461.
Yi, M. Y., & Im, K. S. (2004). Predicting computer task performance: Personal goal and self-efficacy. Journal of Organization and End User Computing, 16(2), 20 - 37.
Youngblut, C. (1998). Educational uses of virtual reality technology (No. IDA Document Report no. D2128): Alexandria, VA: Institute for Defense Analyses
Zen, C. (2007). The only thing unchanged is change: Discriminant validity. Retrieved May 4, 2009, from http://zencaroline.blogspot.com/2007/05/dicriminant-validity.html
Zhang, J. P., & Yang, Y. H. (2009). Design and implementation of virtual museum based on Web3D. Transactions on Edutainment III, LNCS 5940, 154-165.