chapter 1 introduction - millennium ecosystem …millenniumassessment.org/documents_sga/safma...
TRANSCRIPT

CHAPTER 1 Introduction
1.1 An Ecosystem Services Approach Around the world, ecosystem services support human livelihoods, societies, and economies. These services include the provisioning services of water, food, fuel, pharmaceuticals, and fibre, regulating services that control climatic processes, land degradation and disease, supporting services such as soil formation and nutrient cycling, and cultural services that provide nonmaterial benefits (Daily 1997, Millennium Ecosystem Assessment 2003). Ecosystem services command a range of direct and indirect values (Noss and Cooperrider 1994), but with a few exceptions (e.g. timber, agricultural products, medicine), standard economic measures fail to adequately capture these values. Concerted efforts have been made to estimate the natural capital that ecosystem services provide (Costanza et al. 1997), but these continue to grapple with the challenge posed by the intrinsic linkages between ecosystem components, and the resistance of some services to economic valuation. Furthermore, while some ecosystem services are obtained by harvesting or destroying a resource, or transforming an ecosystem, others are derived only by leaving the ecosystem intact. As resource extraction escalates, the increased benefits of any particular service may be gained at the cost of other services.
Historically, ecosystems have been managed within the context of individual economic sectors, each of which produces a single service, leaving managers unaware of the inherent trade-offs that exist among services (Ayensu et al. 1999). For this reason, these trade-offs are largely ignored until their multiple cascading effects culminate in ecosystem collapse. An exotic species is introduced to boost production but out-competes a native species that maintains an essential ecosystem function. A community clears indigenous forest to expand cropland but increases its vulnerability to erosion and floods. The construction of a dam improves water supplies but disrupts the migration of spawning fish and inundates critical resource patches used by local people. Despite the value of maintaining a full suite of ecosystem services, exploitation of ecosystems will continue where the benefits – economic, political or otherwise - appear to exceed the costs for the exploiter.
In essence, decisions to utilise or conserve ecosystems are embedded in complex ecological, social, and economic dynamics. To understand and interpret these dynamics requires collaborative, multiple-scale investigations of ecosystem services that compare the full range of trade-offs over competing land uses (Balmford et al. 2002). It also requires a dynamic approach that views humans and ecosystems as part of the same social-ecological system (Westley et al. 2002).
The Millennium Ecosystem Assessment (MA) is an effort to answer this call. The MA is an initiative to evaluate the state of Earth’s ecosystems across multiple scales, and in particular, the current capacity and potential of ecosystems to deliver services. The MA marks a departure from other global assessments in several ways: its spatial extent reaches from globe to village, temporal extent spans past, present, and future, and its integrated, multi-sector nature draws on expertise from ecologists, sociologists, and economists. This approach illuminates the trade-offs inherent in exploiting the array of services that an ecosystem offers, preserving the integrity of the ecosystem, and securing human well-being. The MA achieves this through a conceptual framework that identifies the relationships between drivers of ecosystem change, ecosystem services, and human well-being (Figure 1.1).
While we may be able to identify these drivers at present, it is uncertain how these relationships will change over time. To envision future arrays of ecosystem services, scenarios are used to explore possible alternative trajectories for ecosystem services and their consequences for various aspects of life on earth. Scenario planning is a useful, structured way to stimulate thinking and debate about future events or trends, and to state explicitly our uncertainty about them (Huntley et al. 1989, Peterson et al. 2003). The use of scenarios complements the development of response options that may be available to assessment users. Their responses assist further scenario generation and feed back into the assessment in an iterative, interactive cycle.
Crucial to this framework is a participatory approach that engages ecosystem users and managers who have a stake in the future of an ecosystem. Too often, scientific assessments exclude the people most closely connected to the assessed ecosystems and services, and comprise their credibility and effect. The MA recognizes the value of stakeholder knowledge and perceptions by incorporating these into the

Ecosystem Services in the Gariep Basin 2
assessment process in a variety of ways, including the establishment of User Advisory Groups (UAG). A UAG may either participate in the assessment or provide feedback to the team conducting the actual assessment. Two key objectives of the MA process are to encourage experimentation with different methodological assessment approaches and to build scientific capacity in deficient areas. Involving stakeholders in the assessment is one way to ensure that the MA experience and ideas reach beyond a small group of scientists and technical experts1.
Figure 1.1 Conceptual Framework of the Millennium Ecosystem Assessment (2003). Notes: The framework defines the relationships between indirect drivers, direct drivers, ecosystem services, human well-being, and poverty reduction. Indirect drivers can affect human well-being directly or indirectly via direct drivers which act on ecosystem services. Human well-being in turn feeds back on indirect drivers. Within the framework, there are opportunities for strategies and interventions that can halt, reverse, or otherwise change a process. This cycle operates at multiple spatial scales, from the local to the global, and multiple temporal scales, from the short- to long-term, with particular aspects taking prevalence at their characteristic scales.
As the knowledge and technological capacity to perform such assessments advance, it has become increasingly obvious that integrated environmental problem solving often lacks a mechanism to deal explicitly with uncertainty and variability, multiple data sources and types, evolving datasets, and human adaptation to change. An inability to make findings useful or relevant to decision-makers also hampers the process. The MA, through its suite of sub-global assessment sites that span the globe, provides a unique experiment for testing the application of different approaches to these challenges.
1 The list of participants in the Gariep Basin UAG is in the Acknowledgements. For detail on the UAGs involved in the Gariep local community assessments, refer to Shackleton et al. 2004.
Introduction 3
1.2 The Southern African Millennium Ecosystem Assessment (SAfMA) As an assessment region, southern Africa presents many unparalleled opportunities. A number of political and demographic changes currently taking place − including democratic transition in South Africa, political instability in Zimbabwe, migration, HIV/AIDS, decentralization as well as multi-national resource management, and the establishment of pan-African initiatives such as the New Partnership for Africa’s Development (NEPAD) − render it one of the most dynamic regions of the globe. The region is actively engaged in forging new relationships in a global marketplace, while attempting to address the legacies of historical and emergent trade asymmetries that have resulted, respectively, from colonisation and globalisation (Stiglitz 2003). The region spans a wide range of political systems, economies, livelihoods, and cultures. While sophisticated databases and modern scientific methodologies, and the expertise to use them are prevalent in parts of this region, other areas are data sparse and sorely lacking in the infrastructure needed to support even basic technology. Much information about southern African ecosystems exists outside of the formal literature and remains to be tapped.
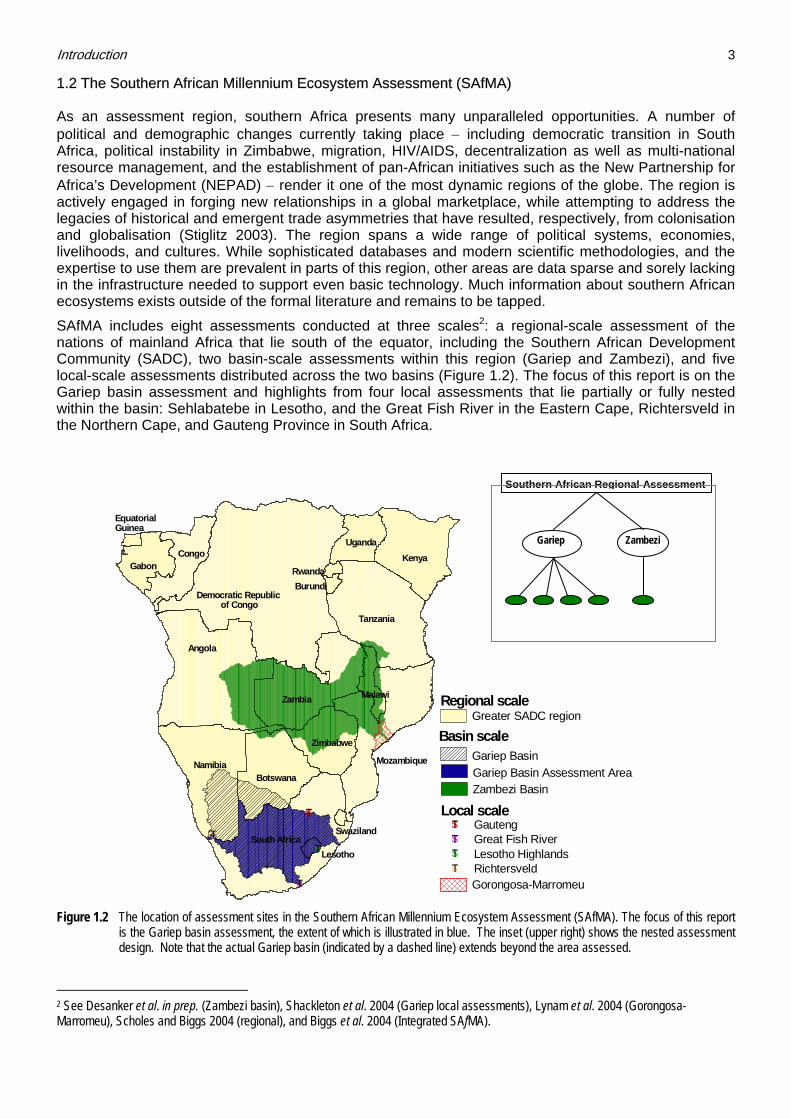
SAfMA includes eight assessments conducted at three scales2: a regional-scale assessment of the nations of mainland Africa that lie south of the equator, including the Southern African Development Community (SADC), two basin-scale assessments within this region (Gariep and Zambezi), and five local-scale assessments distributed across the two basins (Figure 1.2). The focus of this report is on the Gariep basin assessment and highlights from four local assessments that lie partially or fully nested within the basin: Sehlabatebe in Lesotho, and the Great Fish River in the Eastern Cape, Richtersveld in the Northern Cape, and Gauteng Province in South Africa.
Figure 1.2 The location of assessment sites in the Southern African Millennium Ecosystem Assessment (SAfMA). The focus of this report
is the Gariep basin assessment, the extent of which is illustrated in blue. The inset (upper right) shows the nested assessment design. Note that the actual Gariep basin (indicated by a dashed line) extends beyond the area assessed.
2 See Desanker et al. in prep. (Zambezi basin), Shackleton et al. 2004 (Gariep local assessments), Lynam et al. 2004 (Gorongosa-Marromeu), Scholes and Biggs 2004 (regional), and Biggs et al. 2004 (Integrated SAfMA).
$ T
$ T
$ T
$ T
D e m o c r atic R e p u b l i c o f Con g o
KenyaUganda
C o n g o
E q u a t o r i a l G u i n e a
G a b o n
Tanzania
R w a n d a B u r u n d i
A n g o l a
Z a m b i a Malawi
Mozambique
Z i mbabwe
N a m i b i a B o t s w a n a
S o u t h A f r i c a Swaziland
Lesotho
Basin scale
Gariep Basin Ass e s s m e n t A r e a Zambezi Basin
Gorongosa-Marro m e u
Local scale$T Gauteng$T Great Fish River$T Lesotho Highland s $T Richtersveld
Greater SADC re g i o n Regional scale
Gariep Basin
Southern African Regional Assessment
Zambezi Gariep

Ecosystem Services in the Gariep Basin 4
1.3 The Gariep Basin Assessment Among the river basins of the region, the Gariep is more significant as the locus of southern Africa’s socio-economic powerhouse than for the volume of water it delivers, modest in comparison to basins such as the Zambezi. Despite this, it is the largest catchment in South Africa, spanning some 665,000 square kilometres and delivering the third largest discharge in southern Africa. About three-fifths of the catchment area lies within South Africa, with the remainder shared by Lesotho, Namibia, and Botswana, the latter only occasionally forming part of this system when the area drained by its Molopo River spills over to the Gariep (Basson et al. 1997).
The Gariep basin begins at the Senqu River, rising in the Maluti Mountains of Lesotho and draining the majority of Lesotho before crossing the Lesotho-South Africa border. Here the Senqu becomes the Gariep, also known as the Orange River, and feeds the extensive “grain basket” of the central plateau. The Gariep joins the Vaal River to its north, which drains South Africa’s Gauteng Province, the greatest concentration of economic activity in the nation and region. This system transfers water from the Tugela River in KwaZulu-Natal via the Tugela-Vaal Project. To the south, the Gariep supplies water to the Great Fish and Sundays Rivers in the Eastern Cape Province via the Orange-Fish tunnel. Downstream, the river traverses an increasingly arid landscape until it meets the Atlantic Ocean.
We define the Gariep basin for the purposes of the Millennium Ecosystem Assessment as the area of South Africa and Lesotho drained by the Senqu-Gariep-Vaal River system, as well as two primary catchments connected to this system by major water transfer schemes: the Tugela (or Thukela) in KwaZulu-Natal Province and the Great Fish in the Eastern Cape Province (Figure 1.3). In previous assessments (e.g. Revenga et al. 2000) the system referred to as the Orange River basin excludes these transfers, but includes the areas of the catchment that extend into Namibia and Botswana, which are excluded here. This assessment was limited to South Africa and Lesotho due to a lack of datasets for Namibia and Botswana that would be independent from those used at the regional scale. Hydrological data are available for the catchments shared with Namibia and Botswana, but we were unable to secure data from these countries on other ecosystem services and socio-economic conditions and trends at a sub-national scale.
In addition to serving as an important watershed, the Gariep is home to nearly 40 percent of the South African population and all of Lesotho’s, who range from destitute communities which are tightly bound to ecosystem services to highly advanced industrialized societies. Within the boundaries of the Gariep, 70 percent of the national cereal crop production and 80 percent of the regional industrial activity are contained. The basin represents all seven of South Africa’s biomes, and encompasses two biodiversity hotspots of international importance, the Drakensberg grasslands at the Gariep River’s headwaters, and the Succulent Karoo just east of the river’s terminus. Owing to the region’s geology, the Gariep contains fuel (coal deposits) and mineral resources of regional and global importance. Certain areas of the basin are important for biofuels, such as fuelwood and dung, on which many rural people depend for energy.
1.4 The Gariep Local Assessments The livelihoods, cultures, and identities found across the Gariep basin are remarkably diverse. A suite of local-scale assessments captures the intricate ways in which this diversity plays out on the landscape, revealing how human reliance and use of ecosystem services depends on history, culture, governance, population makeup, natural and human-made barriers, and opportunism. While the basin assessment presents the ‘big picture’, these more detailed local-scale investigations serve to tell the stories of different communities, their dependence on ecosystems, and the challenges they face that are not evident from the coarser-scale basin assessment. Community-scale studies in particular strive to assess the dynamics of social-ecological systems by incorporating historical information and local knowledge (see Box 1.1).

Introduction 5
Figure 1.3 The location of the Gariep basin, international boundaries, South African provincial boundaries, major rivers, and major cities.
Major water transfers are indicated with red arrows: 1 = Orange-Fish (Orange River Project); 2 = Tugela-Vaal Scheme; 3 = Lesotho Highlands Water Project; 4 = Rand Water transfer to Johannesburg. Sources: Water transfers data from Basson et al. (1997), Herold and Rademeyer (2000).
They also attempt to understand the role of humans in influencing ecosystem processes through local adaptations to social and ecological change, as well as local management strategies and tactics.
The three community assessments are situated in diverse locations across the Gariep basin: the Richtersveld National Park, Sehlabathebe in the Lesotho Highlands, and the Great Fish River Valley (see Figure 1.2). A fourth local-scale assessment, at an intermediate scale between the basin and community assessments, focuses on Gauteng Province. The result is a multi-scale perspective of the dynamics between people and ecosystems across the Gariep basin.
Box 1.1 Ecosystem Services in Rural Livelihoods
Rural communities in the Gariep basin are highly dependent on ecosystem products and services for their survival. In the Richtersveld, Nama herders would not be able to make a living without access to key resource areas inside the Richtersveld National Park. They are entirely dependent on the Gariep River and natural fountains for their water supply and for fuelwood, and rely on wild food such as fish for their survival. In the Great Fish River, local people obtain most of their energy for heating and cooking from indigenous trees and shrubs, saving close to R1600 per family annually by using fuelwood instead of paraffin. In Sehlabathebe, where natural resources have become scarce, cow dung is the most important source of energy for heating and cooking. No scrap of meat is wasted when an animal is consumed. Because their options are few, people in this community have become increasingly vulnerable to climatic fluctuations.
The co-evolution of rural people and ecosystems has provided a rich body of knowledge about ecosystems and their functioning, and yields unique insights into the sustainability of relationships between humans and their environment. Despite the substantial challenges to integrate this knowledge with formal science, we attempted to tap into this major source of information for the community assessments.

Ecosystem Services in the Gariep Basin 6
Community Assessment Sites Each of the three community sites has a unique environment and ‘typical’ household socio-economic profile (see Boxes 1.2 - 1.4). Yet there are significant variations between households with respect to access to infrastructure and affluence, as well as the range of opportunities and livelihood activities in which people engage. For example, most people at the Fish River site do not engage in arable agriculture, but for some it is a vital and significant component of their livelihood portfolio, which is overlooked when households and situations are portrayed as typical. Indeed, at the local level, livelihood diversity in time and space and within and between households is a vital ingredient of survival in rural areas.
1.5 Ecosystems and Livelihoods The varied cultural and socioeconomic characteristics of the Gariep population have emerged against a backdrop of contrasting biophysical properties. In some cases, properties such as rainfall, soil type, and vegetation characteristics influenced the nature of the social and economic systems that were able to evolve in different areas. In other cases, the reverse is true; where social or economic systems were already strongly intertwined, or where opportunities existed to make social or economic gains, inhabitants changed the biophysical environment to suit their systems.
Box 1.2 Community Sketch of Sehlabathebe, Lesotho (upper catchment)
Sehlabathebe is located in the eastern highlands of Lesotho, where altitude ranges from 2300 to 3100 m. Two highland streams drain the area as major tributaries to the Senqu River and ultimately the Gariep River. Mean annual rainfall is up to 1200 mm. Frost and snow can occur at any time and is an important form of water. Temperatures are harsh, and severe winters limit agricultural production. The natural vegetation is highland grassland, differentiated by aspect and altitude. Dominant genera are Festuca, Mexmuellera and Themeda. Small and isolated pockets of woody vegetation are scattered in the valleys, dominated by Rhus, Buddleja, and Olea. Wetlands and bogs are common. The Sehlabathebe district comprises ten villages (comprising 590 households) covering an area of 33,000 ha. Three villages within the Sehlabathebe area were the focus of the study, namely Ha Semenyane (98 households), Ha Mavuka (62) and Lebenkeleng (95). The communal areas border on the 6475 ha Sehlabathebe National Park, proclaimed in 1970. No villages are electrified, but bulk water is available from communal standpipes.
There is limited commercial activity, other than two general stores in the villages and a guest lodge in the National Park. All villages have a primary school. Most inhabitants are nominally subsistence farmers, but the majority of households have a diverse livelihood portfolio, including arable farming, collection of natural resources, livestock husbandry, small-scale entrepreneurial activities, and migrant labor in the urban areas of Lesotho and mines of South Africa. About 45 percent of households do not own any livestock. Access to land is another determinant of wealth, and about 19 percent of households do not have access to land. Cattle and sheep on the rangelands are the main stock, and chickens around the homestead. Cattle are important for income generation as well as provision of goods and services within the household, such as milk, dung, draught for ploughing, savings, and cultural purposes. The major subsistence crops are maize, wheat, peas, and vegetables. Wild resources, such as wood for construction and energy, medicinal plants, and edible herbs, are collected for domestic use. There is some trade in medicinal plants, as well as the rare endemic Aloe polyphyllasold to collectors. Wage employment is in larger centers away from Sehlabathebe. Approximately 15 percent of households in the region receive income from relatives working on South African mines, and a further 15 – 20 percent receive income from employment (largely government) in Lesotho. The remoteness of the area and its poorly maintained roads are a constraint to further economic development and marketing of products.

Introduction 7
The patterns of human reliance on ecosystem services in the Gariep that one observes today are the product of a long history. Archaeological records suggest that hominid habitation in the Gariep basin dates to 1.5 million years ago. It is believed that the San people lived along the Gariep River for at least 20,000 years. Khoikois moved in around 2000 years before present, and are thought to have given the river the name Gariep, Khoi for “great river”. Settlements in the 19th century consisted of pastoralists and subsistence farming communities composed of Korana people who settled the banks of the Gariep River. The arrival of Europeans in the late 1800s saw the construction of an irrigation scheme at Upington, where a small trading station was located (Chutter et al. 1996), and sparse pastoral settlements in the grasslands.
It was the discovery of diamonds in Kimberley in 1869 and gold on the Witwatersrand in 1885 that attracted the first substantial numbers of European settlers into the interior of South Africa. These discoveries, together with the subsequent wave of mining, industrial and urban expansion that were ushered in during the years that followed, constitute a critical event of history that influenced South Africa’s divergence from the social, economic, and political pathways taken by much of the rest of southern Africa (van Onselen 1997). All other ecosystem services – water, food, and energy – have been usurped and manipulated to support the steady population and socioeconomic growth that transpired from this era. However, it can be argued that the legal and political ramifications of the mineral discoveries, e.g. those paving the way for the formalisation of the apartheid system in the 1960s, played a larger part in shaping the course of South Africa’s history (Reader 1998), as well as the spatial pattern of impacts on its ecosystems.
Access to ecosystem services has long been the source of great conflict in the region, both between and within groups of European and non-European inhabitants. While Europeans launched conquests and established colonies in the region, tensions stirred among the various indigenous groups across southern Africa in the early 19th century. The gruesome battles initiated by Shaka, the Zulu leader, are collectively referred to as the mfecane (“the crushing”) by the Ngoni people and difequane (“the scattering”) by the Sotho and Tswana of the interior (Reader 1998). The ultimate effect was to consolidate Zulu power and to force migration of other groups to various refuge areas across the region. The next century saw more reshuffling of populations. The creation of “homelands,” or areas to which non-whites were confined, under the Land Act of 1913 restricted the movements of these people to less than 10 percent of the land area of South Africa, and as such, put tremendous pressure on ecosystem services in those areas. The government’s Betterment Areas Proclamation of 1967 followed, which confined the movements of nomadic populations to the homelands and required them to cultivate land. This had disastrous consequences for land degradation (Hoffman et al. 1999) which continue to exert ecosystem pressures to this day although the policies have been revoked. Elsewhere, European agricultural practices converted and transformed the natural habitats and resources of South Africa. Similarly, today there is ongoing conversion of natural habitat as demands increase for resources and services.
A different history emerged for the small, landlocked, and mountainous kingdom of Lesotho. A single group of people, the Basotho, established themselves there as a result of Shaka’s reign of terror and averted much of the subsequent colonial rule in South Africa, at least partly by nature of the region’s intimidating terrain. During the apartheid era, the principle interactions between these nations were economic and related to the exchange of labour for the mines on the Witwatersrand. More recently, the tightest ecosystem service-related bond is the joint participation by the two nations in one of the largest development projects in the continent’s history: the Lesotho Highlands Water Project (LHWP). Since the 1950s the then British Protectorate of Basutoland had been targeted for a major water transfer scheme in which it would lend its comparatively vast supply of water resources to support South Africa’s urban and industrial requirements. The plan became a reality in 1986, and eight years later the LHWP began delivering water to support Gauteng Province’s economic and population growth in exchange for a number of economic and trade development benefits to Lesotho. The trade-offs associated with the project are discussed further in Chapter 2.

Ecosystem Services in the Gariep Basin 8
The Face of the Gariep Today, a diverse population, whose members are directly and indirectly dependent on these services to varying degrees, inhabits the Gariep basin. Lesotho’s two million inhabitants are composed almost entirely (99.7%) of Basotho people. By contrast, the rest of the basin’s nineteen million people represent a range of ethnic (Figure 1.4a) and language groups (Figure 1.4b). Compared to South Africa, Gariep basin inhabitants are more likely to be black African or white individuals, less likely to be coloured or Indian individuals, and are more likely to speak Isizulu, Sesotho, Setswana, or Afrikaans. Agriculture employs more than half of the basin’s population, many of whom reside in rural areas, while the remainder of the population lives and works in industrialised areas. This rural-urban dichotomy is a prominent feature in the divergent livelihoods of the inhabitants of the Gariep as well as their use of ecosystem services.
Figure 1.4 The face of the Gariep. (a) Ethnic and (b) linguistic profiles of the Gariep basin population. Sources: South Africa: Hirschowitz et
al. 2001; Lesotho: Lesotho Bureau of Statistics 2001.
In addition, considerable differences exist in the nature of the rural economies. For example, the two provinces that make the largest agricultural withdrawals of water from the Gariep River – the Northern and Eastern Cape – have highly divergent economies. The Northern Cape derives the majority of its gross geographic product (GGP) from mining and agriculture, while the Eastern Cape receives much of its GGP from manufacturing (Table 1.1). In Lesotho, a more rural nation than South Africa, agriculture plays a more important role in contributing to GDP, though South African mines and industries provide a significant source of employment.
Human Impacts on Ecosystem Capacity to Deliver Services Although the ecosystem services of the Gariep support and benefit substantial populations and industries, recognition and protection of these services has been poor. Thus, over time, the capacity of these ecosystems to continue supporting the needs of human society has been eroded. Land-use practices – notably urbanisation, industrial and mining developments, agriculture and forestry – as well as extractions and diversions of water resources are among the most commonly cited threats to the maintenance of ecosystem service delivery in the basin (Table 1.2).
These threats tend to result from the conversion of ecosystems to obtain the benefits of one service, or to improve well-being, without regard for the potential secondary effects on other services or long-term sustainability of such actions. Of particular note are the impacts on the Gariep’s ecosystems by inter-basin transfers into the basin (Tugela River), across tributaries (Lesotho Highlands), and also out of the basin (Great Fish River). These inter-basin transfers are of great importance to the regional economy, as indicated by the proportion of gross geographic product (GGP) that is supported by inter-basin transfers (IBT) in each province in Table 1.3.
(a) (b)

Introduction 9
Table 1.1 Land area, population, and economic characteristics of Lesotho and the eight South African provinces in the Gariep basin.
Percentage of provincial gross geographic product (GGP) derived from:
Country/ Province
Area (km2)
Province within
basin (%)
Population in millions (2001)
Agriculture Manufacturing Mining Trade
Lesotho 30,355 100 1.9 15.6 18.0 0.1 n/a
Eastern Cape 169,580 40 6.4 5.4 24.4 0.1 16.4
Free State 129,480 100 2.7 10.8 15.1 18.0 12.3
Gauteng 17,010 45 8.8 0.6 27.5 4.5 17.9
KwaZulu-Natal 92,100 40 9.4 5.4 29.4 1.7 17.1
Mpumalanga 79,490 25 3.1 7.8 25.3 18.1 7.3
Northern Cape 361,830 85 8.2 9.7 4.4 30.0 14.8
North West 116,320 70 3.7 7.9 10.4 38.3 10.5
Western Cape 129,370 2 4.5 6.0 23.5 0.2 20.3
Sources: South Africa: StatsSA 2003, Urban-Econ 2000; Lesotho: Lesotho Bureau of Statistics 2002a, 2002b. Table 1.2 Threats to ecosystem services and examples identified by the Gariep Basin User Advisory Group at the
onset of the assessment process.
Type of threat Examples given
Land use Grazing and pastoralism, urban/industrial development, irrigated agriculture, fuelwood and dung harvesting for domestic energy use, canalisation, riparian habitat loss or use, invasive plant aliens, land-use intensity change
Alteration of hydrological regime
Inter-basin transfers, impoundments, hydroelectric schemes
Climate change Exacerbation of land use threats, biodiversity loss
Poverty and wealth Consumption patterns, land use
Water quality change Mining drainage, agrochemical runoff, soil loss, salinity, eutrophication
Institutional issues Poor coordination, fragmentation, weak influence of technical studies on decision-making processes
Globalization Marketing, livelihood decisions in farming, economic viability
Tourism Poorly-managed recreation, game ranching, trophy hunting

Ecosystem Services in the Gariep Basin 10
However, water transfers, together with impoundments, have stabilised and transformed the flow of portions of the Gariep River to an extent where blackfly (Simulium chutteri) has become a pest to domestic livestock, costing the livestock industry up to R33 million per annum along an 800-kilometre stretch of river (Chutter et al. 1996). In the Great Fish River, transfers of not only water but also biota such as sharptooth catfish (Clarias gariepinus) have impacted the river, and its conversion from an ephemeral to perennial system has resulted in unanticipated problems such as the salinisation of alluvial soils. Blackfly has also spread to the Eastern Cape due to the construction of the Orange River Project tunnel and subsequent water releases.
Box 1.3 Community Sketch of the Great Fish River (mid-catchment)
The Great Fish River site stretches from just west of the confluence of the Great Fish and Koonap Rivers in the west to the town of Peddie in the east, an area of 145,000 ha. The primary focus area was the eleven villages of Tyefu Location (24,218 ha). Reference and comparisons were also made to adjacent land in (i) the Great Fish River Reserve Complex (45,000 ha), a nature reserve, and (ii) adjacent freehold commercial farmland under freehold tenure (about 50,000 ha) under extensive livestock production (angora, cattle, sheep, and Boer goat), intensive cropping under irrigation, and increasingly, game farming and associated activities such as trophy hunting.
Mean annual rainfall varies between 350 and 500 mm, and is largely received in the summer months (November – April). Droughts are common. Mean monthly maximum temperatures range from 21.8°C in June to 30.1°C in February when extreme temperatures exceed 40°C (De Lange et al. 1994). The area experiences between 15 and 30 days of light ground frost in winter, but the higher-lying areas are generally frost-free. Acocks (1988) originally classified the vegetation in the study area as Valley Bushveld, but it is now more commonly termed Xeric Succulent Thicket (Fabricius 1997). The structure and species composition of the vegetation can be accurately predicted from elevation, modified by the effects of prevailing management regimes (Palmer and Avis 1994). Dominant woody species are Acacia karroo (on disturbed sites), Azima tetracnatha, Diospyros spp., Euphorbia spp., Pappea capensis, Portulacaria afra, Rhus spp., and Schotia afra. The vegetation is highly sensitive to mismanagement.
The population of Tyefu Location was approximately 14,000 in the early 1990s, at approximately 58 people/km² (Ainslie et al. 1995). Population in the nature reserve and commercial farming sector is low (< 3 people/km²). The mean number of individuals per household is six. Approximately 45 percent of the population is 18 years old or younger. All the Tyefu villages have primary schools, and a few have secondary schools. Piped water is available via communal standpipes. Some villages have recently received electricity.
Livestock play an important role in local livelihoods. People own a wide variety, including, cattle, goats, sheep, pigs, equines, and chickens, but ownership is highly skewed. Approximately one-third of households own cattle, while two-thirds own goats. Meat and wool are sold on local markets. Livestock have numerous direct use roles including milk, manure for fields and walls, savings, cultural, and ritual roles. However, there is little household slaughter for direct consumption except at times of celebration, ritual or funerals. Although some families do engage in arable production from fields (maize and vegetables), it is generally in decline for a number of reasons, including a lack of land, poor markets, high costs of inputs, theft, poor returns, and a variable climate. A greater proportion of households maintain a kitchen garden (< 1 ha) around the homestead. There is widespread use of natural resources for home consumption and income generation. The most common are edible herbs and fruits, fuelwood, medicinal plants, bushmeat, and wild honey. People collect and sell medicinal plants, prickly pear, fuelwood, Aloe ferox, and fish. Approximately 70 percent of households regard state pensions as their main source of household income. There is limited wage employment within the area, largely in government services. Hence, migration is a core livelihood activity for most households. Migrants send home cash or goods on a regular or ad hoc basis.
Introduction 11
Table 1.3 Gross Geographic Product (GGP) per province supported by inter-basin transfers (IBTs). Source: Basson et al. (1997)
Province GGP supported by IBTs (%)
Gauteng 100
North West Province 80
Eastern Cape 70
Western Cape 70
Mpumalanga 70
KwaZulu-Natal 70
Free State 65
Northern Cape 50
Limpopo 25
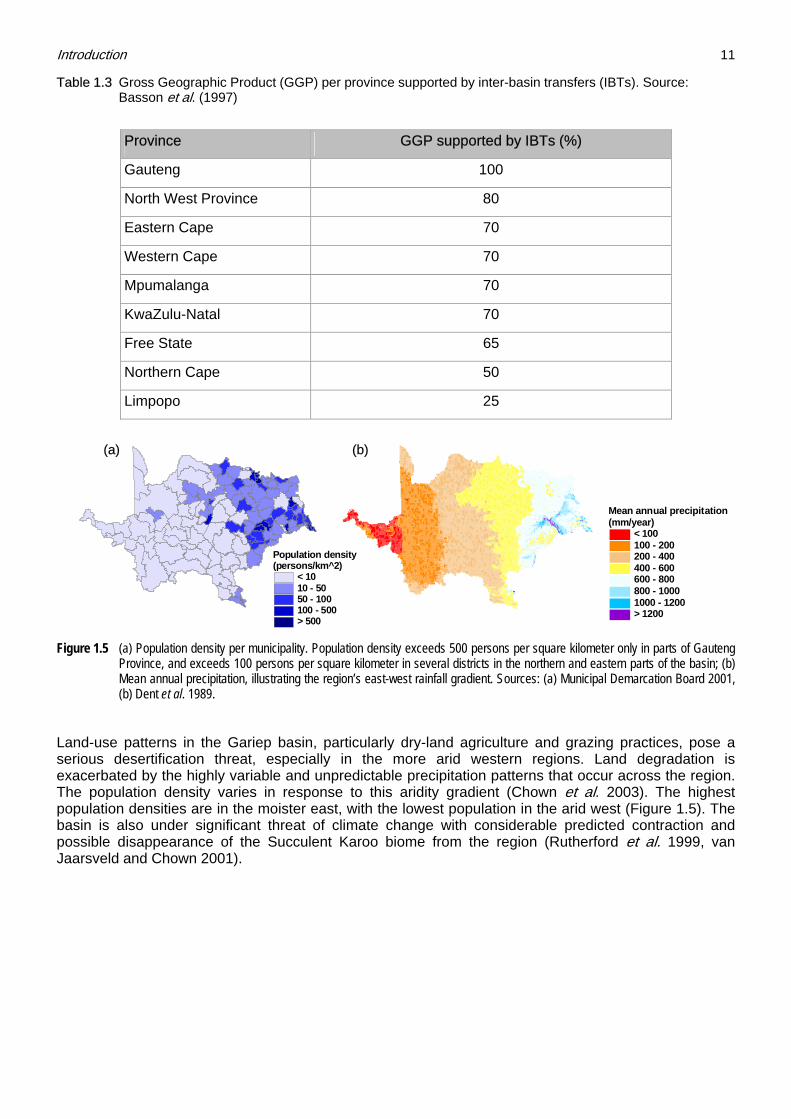
Figure 1.5 (a) Population density per municipality. Population density exceeds 500 persons per square kilometer only in parts of Gauteng Province, and exceeds 100 persons per square kilometer in several districts in the northern and eastern parts of the basin; (b) Mean annual precipitation, illustrating the region’s east-west rainfall gradient. Sources: (a) Municipal Demarcation Board 2001, (b) Dent et al. 1989.
Land-use patterns in the Gariep basin, particularly dry-land agriculture and grazing practices, pose a serious desertification threat, especially in the more arid western regions. Land degradation is exacerbated by the highly variable and unpredictable precipitation patterns that occur across the region. The population density varies in response to this aridity gradient (Chown et al. 2003). The highest population densities are in the moister east, with the lowest population in the arid west (Figure 1.5). The basin is also under significant threat of climate change with considerable predicted contraction and possible disappearance of the Succulent Karoo biome from the region (Rutherford et al. 1999, van Jaarsveld and Chown 2001).
Population density(persons/km^2)
< 1010 - 5050 - 100100 - 500> 500
Mean annual precipitation (mm/year)
< 100100 - 200200 - 400400 - 600600 - 800800 - 10001000 - 1200> 1200
(a) (b)

Ecosystem Services in the Gariep Basin 12
The governance of the area that forms the Gariep basin falls upon the shoulders of the four countries it drains. In South Africa alone it is also managed by six provincial governments and 139 local authorities, while in Lesotho, a parliamentary constitutional monarchy and ten administrative districts are recognised. In addition, the basin is subjected to a complex mix of private, tribal, and traditional local council tenure arrangements (Figure 1.6), which makes for a rich cultural diversity and heritage, yet further complicates the management of ecosystem services across the landscape.
Figure 1.6 Land tenure systems within the Gariep basin. Source: Municipal Demarcation Board 2001.
Assessment Objectives Collectively, these biophysical, social, economic, and political conditions precipitate change in ecosystem services and human well-being across the Gariep basin. The overarching objectives of this assessment are to:
• review our current understanding about the condition and trends of ecosystem services, human well-being, and biodiversity, or ecosystem integrity, across the Gariep basin and response options available to decision-makers to manage ecosystems (Chapter 2);
• assess the trade-offs inherent in decision-making in ecosystems (Chapter 3);
• identify the principle drivers of changes in ecosystem services and human well-being and explore what the future of the basin may look like with scenarios (Chapter 4);
• present a synthesis or “big picture” of ecosystem services and human well-being in the Gariep basin, and conclude with a discussion of lessons learned from the assessment process and recommendations for decision-making (Chapter 5).

Introduction 13
Box 1.4 Community Sketch of the Richtersveld (lower catchment)
The Richtersveld National Park (RNP) covers 162,445 ha in the arid region of the Namaqualand magisterial district of the Northern Cape Province. The Gariep River forms the northern boundary of RNP, north of which lies Namibia. The landscape is rugged and varies from sandy floodplains adjacent to the river to steep and stony mountains with little soil. The average temperature varies between 25oC during January and 14oC in June. Temperatures can easily rise above 50oC in the summer and plunge to freezing on winter nights. Mean annual rainfall varies between 50 and 150 mm, with extreme variability within years and between years. The Richtersveld area is one of the world’s richest succulent areas (Jürgens 1985, Cowling and Roux 1987, Hilton-Taylor and Le Roux 1989, von Willert et al. 1992, Cowling et al. 1999). It is located in the winter-rainfall part of southern Africa’s Succulent Karoo biome (Rutherford and Westfall 1986, Milton et al. 1997). Dominant families include the Mesembryanthemaceae, Asteraceae, Crassulaceae, Geraniaceae, Euphorbiaceae, and Asclepiadaceae (Cowling et al. 1999).
The majority of people living in the Richtersveld are descendants of the Namaqua pastoralists (Webley 1992, Boonzaier 1996), and locally they refer to themselves as Namas. The land is under communal tenure. The average household consists of five to six people. In total, 26 permanent and temporary farmers are allowed to graze inside the RNP under contractual agreements. The RNP, proclaimed in 1991, is unique in that it is the only completely Contractual National Park in southern Africa (Hendricks 2003a). South African National Parks initiated a 30-year lease in 1991 with the local communities surrounding the RNP. The aim of the Contractual National Park is to conserve the biotic diversity and manage the grazing resources of a portion of their communal area in cooperation with the local communities of the Richtersveld. The original inhabitants remain within the park and have agreed to limit the total number of livestock grazing within the confines of the park to 6600 small stock animals.
Within the RNP, there is little infrastructure for the pastoralist herders. Because they are semi-nomadic, bulk services cannot be supplied to them. The roads within the RNP are rough. In the greater Richtersveld area, four villages recently received electricity. Each has a clinic, and there is a mobile clinic service for the more distant areas.
The primary source of livelihood is herding of livestock, mainly Boer goats and a few sheep. These animals provide a limited source of meat and milk. Some stock is marketed on an ad hoc basis to buyers that come into the area, or to local butchers. The average income from selling goats and sheep for each farmer in the RNP was about R9000 per year for the last six years (Hendricks 2003b). There is no cropping due to lack of water, extreme heat, and damage by wildlife. There is an abundance of wild resources in the RNP, including edible and medicinal plants and fuelwood. Approximately 60 percent of households also receive cash income from other sources. This is in the form of state pensions or disability grants, or employment in the local diamond mines. One-third of the registered farmers in the RNP are employed by these mines. Many households also have members working further afield in regional and national centres who send home remittances.