chapter 1. introduction · component values vary depending on the method of preparation. in the...
TRANSCRIPT
1
Chapter 1. Introduction
1 Purpose and properties of the Standard Tables of Food Composition in Japan
1) Purpose Clarifying the nutrient components of food taken daily by people is extremely important for the maintenance and promotion of public health. It also is essential as the basis for planning to secure the stable supply of food. In Japan, since its first release in 1950, the Standard Tables of Food Composition in Japan (hereinafter referred to as “Food Composition Tables”) has played a role in providing the basic data on food components. The Food Composition Tables has been widely utilized for the purpose of management of food services (e.g., school lunches, hospital food), provision of nutrition instructions (e.g., dietary restrictions, therapeutic diet), as well as in daily life of general households interested in nutrition and health. Additionally, the Food Composition Tables is utilized for administrative purposes, as the basic information in formulating various important political measures including formulation of the Dietary Reference Intakes for Japanese (DRI-J) by the Ministry of Health, Labour and Welfare (MHLW), implementation of various surveys (e.g., National Health and Nutrition Examination Survey), and preparation of the Food Balance Sheet by the Ministry of Agriculture, Forestry and Fisheries (MAFF). Furthermore, the Food Composition Tables is utilized in the field of education (e.g., Department of Nutrition and Department of Food Science in higher education, Home Economics and Health and Physical Education in secondary education), as well as in the research fields of nutrition science, food science, domestic science, life science, medicine, agriculture, etc. Furthermore, in recent years, it has been utilized as the basic data for rationally estimating the nutrient composition for obligation of labeling nutritional components for prepared food etc. As mentioned above, the Food Composition Tables aims at providing basic data on the composition of food taken daily by people for a wide range of utilization in various fields.
2) Properties
The kinds of food taken daily by people are extremely diverse. The Food Composition Tables list standard component values for food normally used in Japan. Food used as raw material originates from an organism of eukaryotes, which belongs to the plant, fungus or animal kingdom, and it is often the case that its component values vary widely depending on various factors including the species type of plant/animal/fungus and the growing (habitat) environment. Additionally, in regard to processed products, the component values of product vary depending on the blending ratio of raw materials and the processing method. In prepared food, the component values vary depending on the method of preparation. In the Food Composition Tables, standard component values are determined based on the analysis values, literature values, etc. in accordance with a wide variety of use purposes mentioned above. One set of values is given for one food product in principle with careful consideration on these variation factors in the values. Here, standard component values refer to values derived based on the notion for representing the national average value of intake in a normal diet throughout the year in Japan.
2
3) Background The main revisions made in the Standard Tables of Food Composition in Japan - 2010 - (hereinafter referred to as “Composition Tables 2010”) released in December 2010 were to ensure the consistency with DRI-J by listing the component values of iodine, selenium, chromium, molybdenum and biotin, as well as to include the amount of protein (protein calculated as the sum of amino acid residue) and amount of lipid (triacylglycerol equivalents of fatty acids) derived by the methods preferred by the Report of a technical workshop released by the Food and Agricultural Organization of the United Nations (FAO) in 2003 (hereinafter referred to as “FAO Report”)1) as supplementary information. Prior to the release of the Composition Tables 2010, toward a revision of the Food Composition Tables, the Subdivision on Resources, the Council for Science and Technology, Ministry of Education, Culture, Sports, Science and Technology (MEXT) has promoted investigation on clarifying the composition of carbohydrates by directly analyzing monosaccharides, disaccharides and starches based on the methods preferred by the FAO Report, similar to proteins and lipids. The Subdivision also promoted investigation on organic acids to clarify their compositions by directly analyzing them. Furthermore, the Expert Committee on Food Components was established under the Subdivision, and consideration has been given on various issues including: [1] Expansion of the types of listed foods reflecting the newly marketed foods, effects of
selective breeding, compositional change due to cooking, etc.; [2] New creation of tables on the composition of carbohydrates and organic acids; and, [3] Improvement of information on amino acid composition and fatty acid composition.
As a result, in the current Composition Tables, the number of foods listed was increased for the first time in 15 years since the release of the Standard Tables of Food Composition in Japan Fifth Revised Edition (hereinafter referred to as “5th Composition Tables”) and the cooking methods for the listed foods were extended to tempura, karaage (floured and deep-fried), etc. Additionally, calculation methods for deriving the nutrient composition of prepared foods from the raw materials listed in the current Composition Tables were described using examples (Chapter 3 “3 Prepared dishes”). As a result of this, it is expected that the users of the current Composition Tables can accurately calculate the nutrient composition of prepared dishes etc. Additionally, for the composition of proteins, lipids and carbohydrates, Standard Tables of Food Composition in Japan - 2015 - (Seventh Revised Edition) - Amino Acids - (hereinafter referred to as “Amino Acids Composition Tables 2015”), Standard Tables of Food Composition in Japan - 2015 - (Seventh Revised Edition) - Fatty Acids - (hereinafter referred to as “Fatty Acids Composition Tables 2015”) and Standard Tables of Food Composition in Japan - 2015 - (Seventh Revised Edition) - Available Carbohydrates, Polyols and Organic Acids - (hereinafter referred to as “Carbohydrates Composition Tables 2015”) are provided as supplements, respectively. Furthermore, based on the values listed in the Carbohydrates Composition Tables 2015, available carbohydrates (expressed in monosaccharide equivalents) were newly listed in the current Composition Tables. These supplementary Tables would indicate the intake of proteins, lipids and carbohydrates in Japan more accurately. By using the information available in the current Composition Tables, it becomes possible to establish part of the basis that supports the new evaluation method for energy proposed by the FAO Report, and further accumulation of information in the future will enable evaluation of energy based on the method proposed by the FAO Report. The data in the Food Composition Tables were digitized and made available both in Japanese and in English for the purpose of further utilization of the Tables and promotion of worldwide information exchange. The name of the current Composition Tables was chosen to be “Standard Tables of Food Composition in Japan - 2015 - (Seventh Revised Edition)” from the viewpoint of clarifying the
3
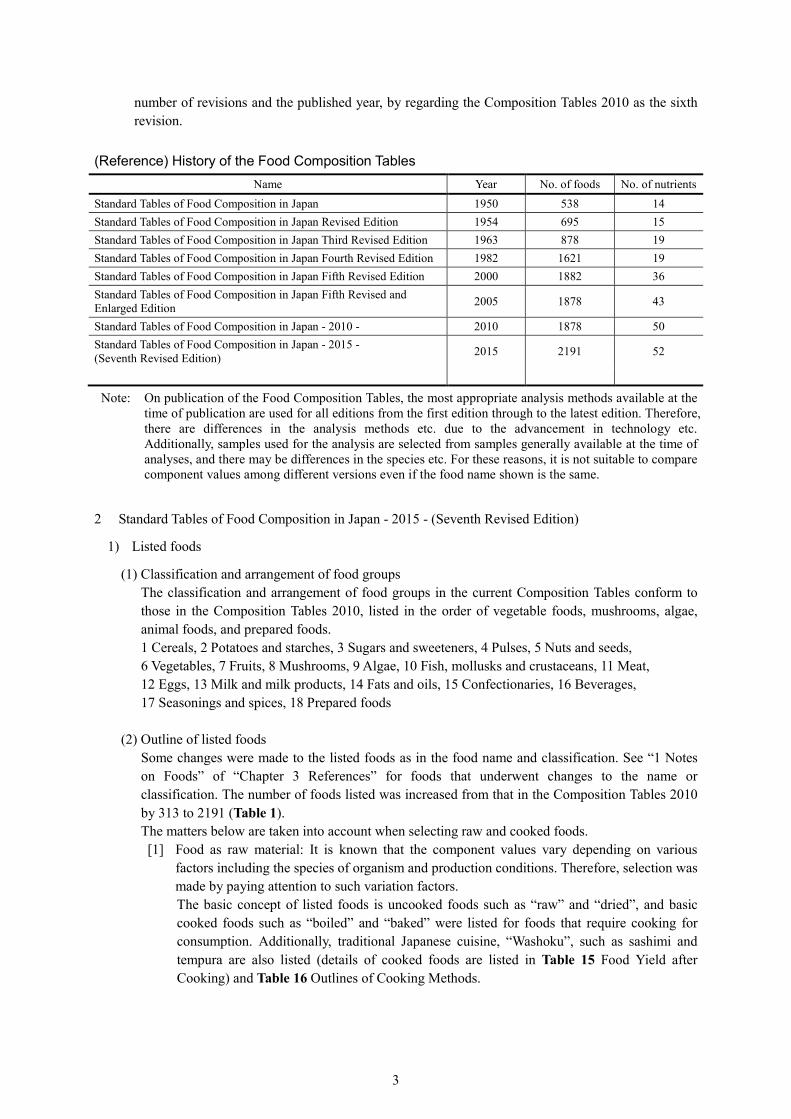
number of revisions and the published year, by regarding the Composition Tables 2010 as the sixth revision.
(Reference) History of the Food Composition Tables
Name Year No. of foods No. of nutrients Standard Tables of Food Composition in Japan 1950 538 14 Standard Tables of Food Composition in Japan Revised Edition 1954 695 15 Standard Tables of Food Composition in Japan Third Revised Edition 1963 878 19 Standard Tables of Food Composition in Japan Fourth Revised Edition 1982 1621 19 Standard Tables of Food Composition in Japan Fifth Revised Edition 2000 1882 36 Standard Tables of Food Composition in Japan Fifth Revised and Enlarged Edition 2005 1878 43
Standard Tables of Food Composition in Japan - 2010 - 2010 1878 50 Standard Tables of Food Composition in Japan - 2015 - (Seventh Revised Edition) 2015 2191 52
Note: On publication of the Food Composition Tables, the most appropriate analysis methods available at the time of publication are used for all editions from the first edition through to the latest edition. Therefore, there are differences in the analysis methods etc. due to the advancement in technology etc. Additionally, samples used for the analysis are selected from samples generally available at the time of analyses, and there may be differences in the species etc. For these reasons, it is not suitable to compare component values among different versions even if the food name shown is the same.
2 Standard Tables of Food Composition in Japan - 2015 - (Seventh Revised Edition)
1) Listed foods
(1) Classification and arrangement of food groups The classification and arrangement of food groups in the current Composition Tables conform to those in the Composition Tables 2010, listed in the order of vegetable foods, mushrooms, algae, animal foods, and prepared foods. 1 Cereals, 2 Potatoes and starches, 3 Sugars and sweeteners, 4 Pulses, 5 Nuts and seeds, 6 Vegetables, 7 Fruits, 8 Mushrooms, 9 Algae, 10 Fish, mollusks and crustaceans, 11 Meat, 12 Eggs, 13 Milk and milk products, 14 Fats and oils, 15 Confectionaries, 16 Beverages, 17 Seasonings and spices, 18 Prepared foods
(2) Outline of listed foods
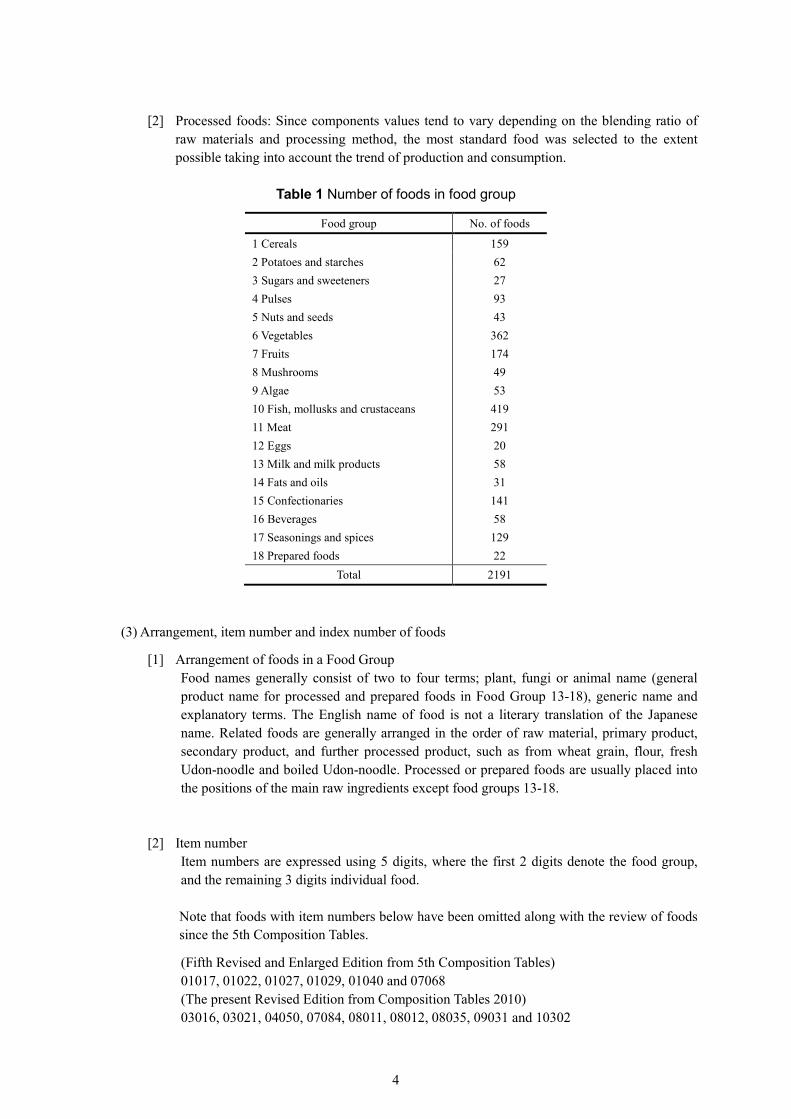
Some changes were made to the listed foods as in the food name and classification. See “1 Notes on Foods” of “Chapter 3 References” for foods that underwent changes to the name or classification. The number of foods listed was increased from that in the Composition Tables 2010 by 313 to 2191 (Table 1). The matters below are taken into account when selecting raw and cooked foods. [1] Food as raw material: It is known that the component values vary depending on various
factors including the species of organism and production conditions. Therefore, selection was made by paying attention to such variation factors. The basic concept of listed foods is uncooked foods such as “raw” and “dried”, and basic cooked foods such as “boiled” and “baked” were listed for foods that require cooking for consumption. Additionally, traditional Japanese cuisine, “Washoku”, such as sashimi and tempura are also listed (details of cooked foods are listed in Table 15 Food Yield after Cooking) and Table 16 Outlines of Cooking Methods.
4
[2] Processed foods: Since components values tend to vary depending on the blending ratio of
raw materials and processing method, the most standard food was selected to the extent possible taking into account the trend of production and consumption.
Table 1 Number of foods in food group
Food group No. of foods
1 Cereals 159 2 Potatoes and starches 62 3 Sugars and sweeteners 4 Pulses 5 Nuts and seeds 6 Vegetables 7 Fruits 8 Mushrooms 9 Algae 10 Fish, mollusks and crustaceans 11 Meat 12 Eggs 13 Milk and milk products 14 Fats and oils 15 Confectionaries 16 Beverages 17 Seasonings and spices 18 Prepared foods
27 93 43
362 174 49 53
419 291 20 58 31
141 58
129 22
Total 2191
(3) Arrangement, item number and index number of foods
[1] Arrangement of foods in a Food Group Food names generally consist of two to four terms; plant, fungi or animal name (general product name for processed and prepared foods in Food Group 13-18), generic name and explanatory terms. The English name of food is not a literary translation of the Japanese name. Related foods are generally arranged in the order of raw material, primary product, secondary product, and further processed product, such as from wheat grain, flour, fresh Udon-noodle and boiled Udon-noodle. Processed or prepared foods are usually placed into the positions of the main raw ingredients except food groups 13-18.
[2] Item number
Item numbers are expressed using 5 digits, where the first 2 digits denote the food group, and the remaining 3 digits individual food. Note that foods with item numbers below have been omitted along with the review of foods since the 5th Composition Tables.
(Fifth Revised and Enlarged Edition from 5th Composition Tables) 01017, 01022, 01027, 01029, 01040 and 07068 (The present Revised Edition from Composition Tables 2010) 03016, 03021, 04050, 07084, 08011, 08012, 08035, 09031 and 10302
5
[3] Index number
In the current Composition Tables, each food has a newly assigned index number. Index numbers are added as serial numbers to facilitate the searching of food. While 2191 foods are included in the current Composition Tables, the largest index number is 2198 because there are seven foods which are listed only in the Amino Acids Composition Tables 2015. A food generally appears only once in the current Composition Tables; some foods, however, may appear again near the related foods with the item number, index number for the user’s convenience.
(4) Food name
The name generally used in scientific literature or a common name is used as the food name for raw material, and common names or publicly specified names by food specifications or standards are used for processed and prepared foods. Widely used alternative names are included as synonyms. For English names, see the English version Composition Tables published on the following website (http://www.mext.go.jp/english/science_technology/1347490.htm). The English names and scientific names of plants, fungi and animals that appeared in the current Composition Tables are summarized in the material of Chapter 3.
2) Components
(1) Components and their arrangement
[1] For 854 foods, “available carbohydrates (expressed in monosaccharide equivalents)” are newly included as additional information by directly analyzing or estimating starch, monosaccharides, disaccharides and other saccharides. Weight-based available carbohydrate data are tabulated in Carbohydrates Composition Tables 2015.
[2] Components are arranged in the following order: refuse, energy, water, protein, protein calculated as the sum of amino acid residues, lipid, fatty acids expressed in triacylglycerol equivalents, fatty acid, cholesterol, carbohydrates, available carbohydrates (expressed in monosaccharide equivalents), dietary fiber, ash, minerals, vitamins, salt equivalents, and Remarks.
[3] Fatty acids consist of saturated, monounsaturated, and polyunsaturated fatty acids.
[4] Dietary fibers are classified into soluble, insoluble and total dietary fiber.
[5] Minerals are arranged in the following order: Sodium, potassium, calcium, magnesium, phosphorus, iron, zinc, copper, manganese, iodine, selenium, chromium and molybdenum, by taking into account the nutritious relevance of each mineral.
[6] Vitamins are arranged in the order of fat-soluble vitamins and water-soluble vitamins. Fat-soluble vitamins include vitamin A, vitamin D, vitamin E, and vitamin K, and water-soluble vitamins vitamin B1, vitamin B2, niacin, vitamin B6, vitamin B12, folate, pantothenic acid, biotin, and ascorbic acids (vitamin C). Of which, vitamin A consists of retinol, α- and β-carotene, β-cryptoxanthin, β-carotene equivalents, and retinol activity equivalents. Vitamin E comprises α-, β-, γ- and δ-tocopherol.
[7] Each nutrient is measured by the method conforming to the “Analytical Manual for Standard Tables of Food Composition in Japan 2015 (Seventh Revised Edition)” or methods that ensure performance equivalent to or better than the above method.
6
(2) Refuse and edible portion
Refuse is generally expressed as the weight ratio (%) of the refused portion to the entire food or purchased food in the usual dietary habit, and the refused portion is described in the Remarks. The edible portion is derived by subtracting the refused part from the entire food or the purchased food. Each nutrient in the current Composition Tables is shown as per 100 g of edible portion.
(3) Energy
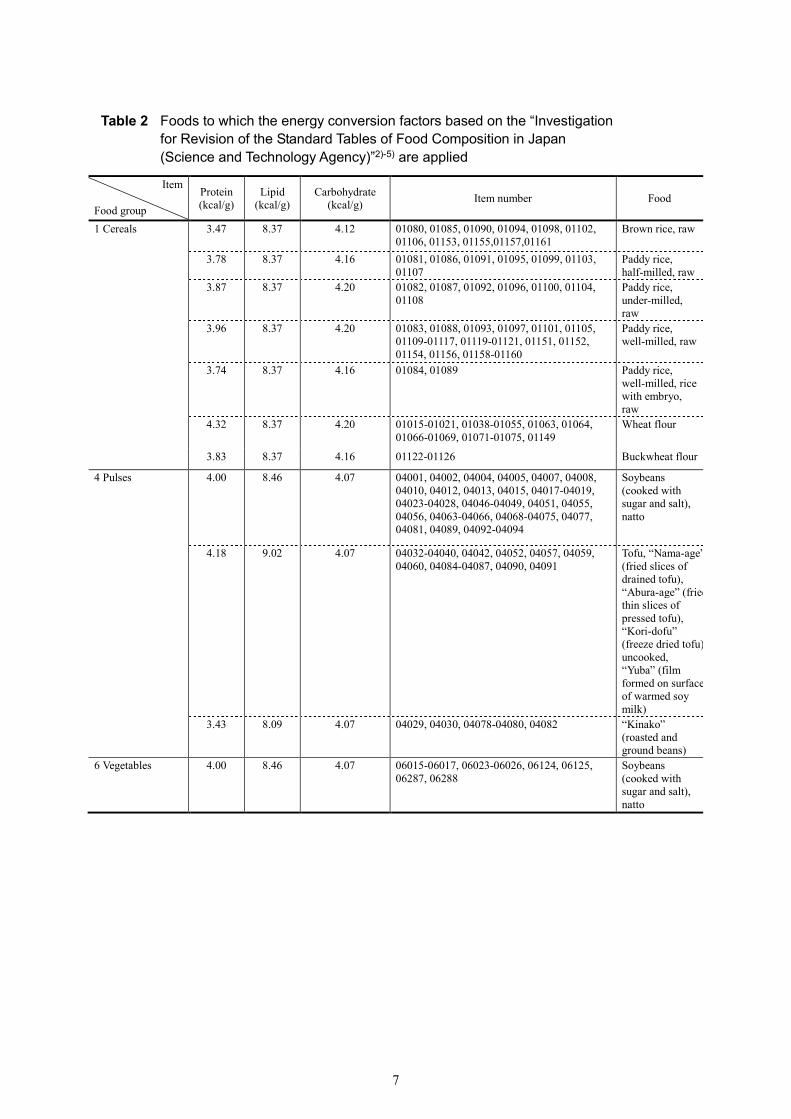
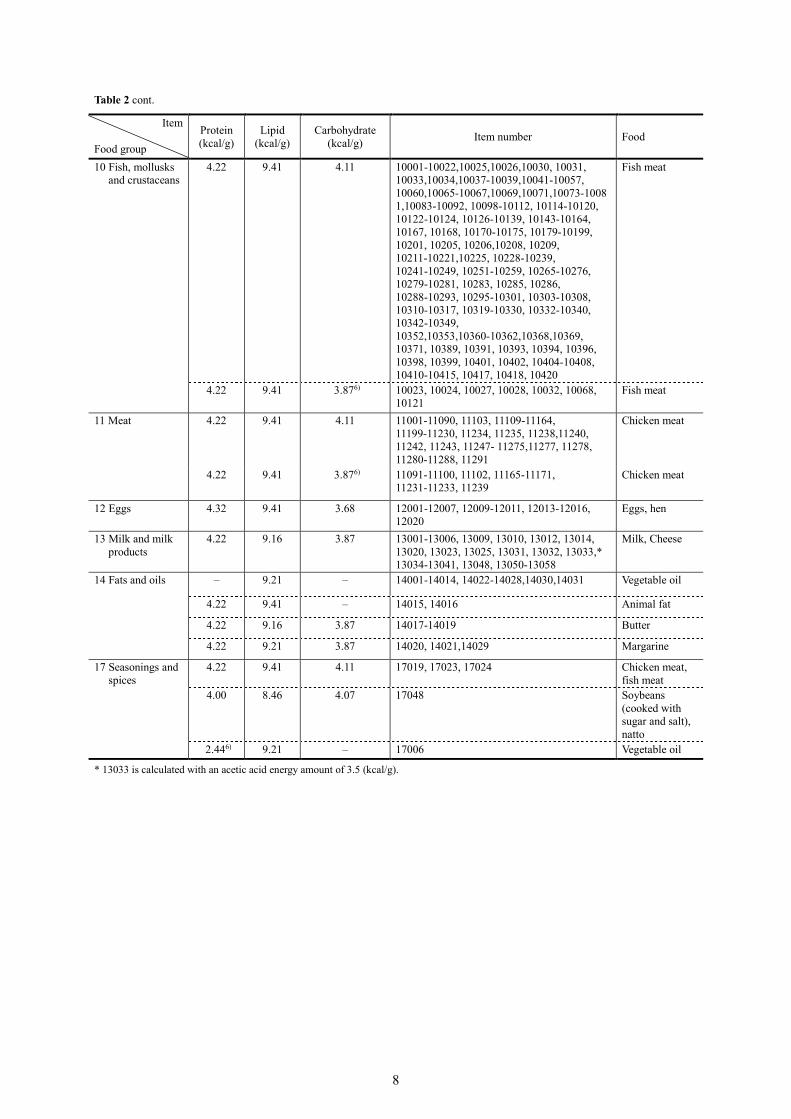
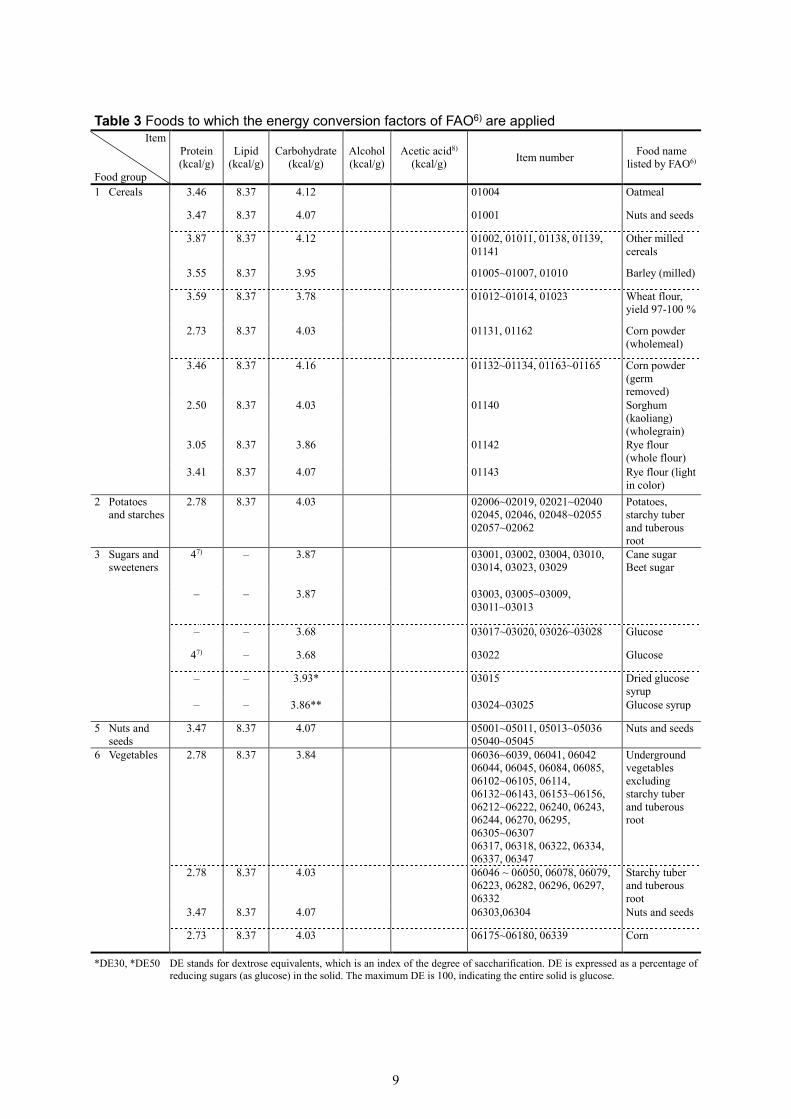
Energy of food is calculated by multiplying the amount (g) of proteins, lipids, and carbohydrates per 100 g of edible portion by the energy conversion factor of each energy-yielding component. General rules for the application of energy conversion factors to individual foods are as shown below. The applied energy conversion factors for food are shown in Table 2 to Table 5. It is noteworthy that energy conversion factors applied to foods and energy-yielding components are not globally standardized, and calculation of energy is affected by the energy conversion factors used.
[1] For major foods among Cereals, Animal foods, Fats and oils, Soybeans and soybean products, factors based on the conclusions in the “Investigation for Revision of the Standard Tables of Food Composition in Japan” (Reference Material created by the Resources Council, the Science and Technology Agency)2)-5) are applied (Table 2).
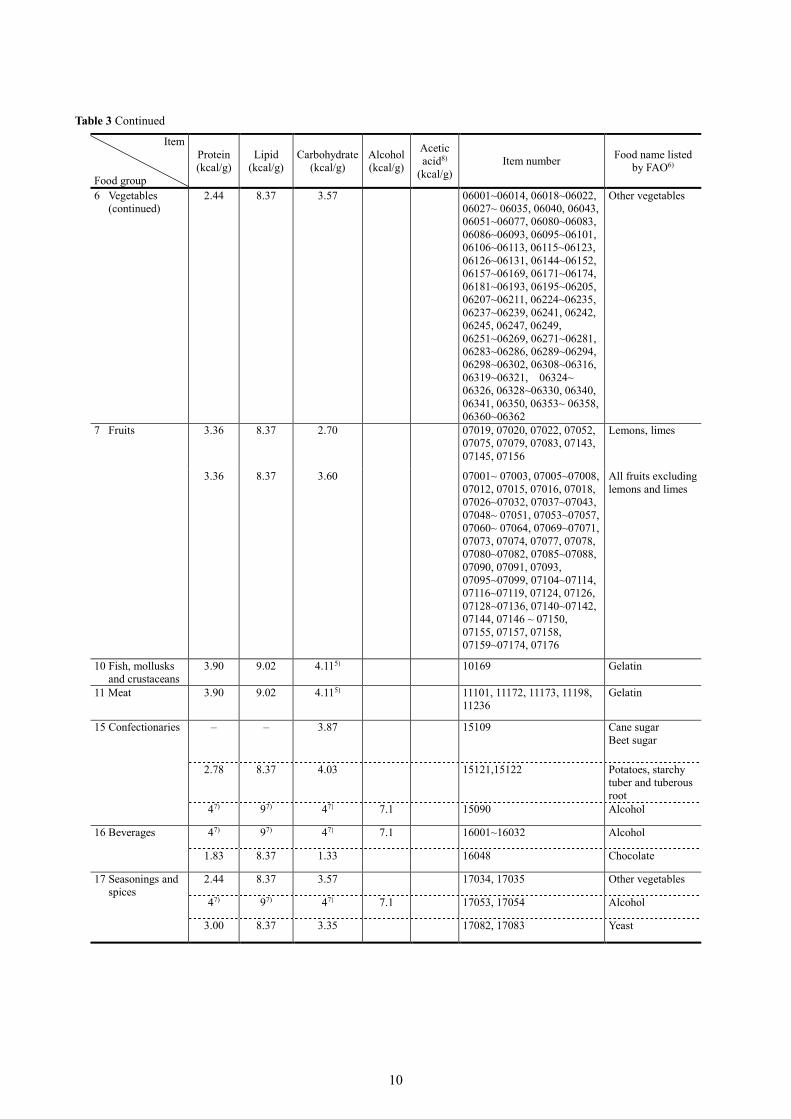
[2] For foods other than the above, the energy conversion factors in the Report of a Joint FAO/WHO (the World Health Organization) Ad Hoc Expert Committee6) are used (Table 3).
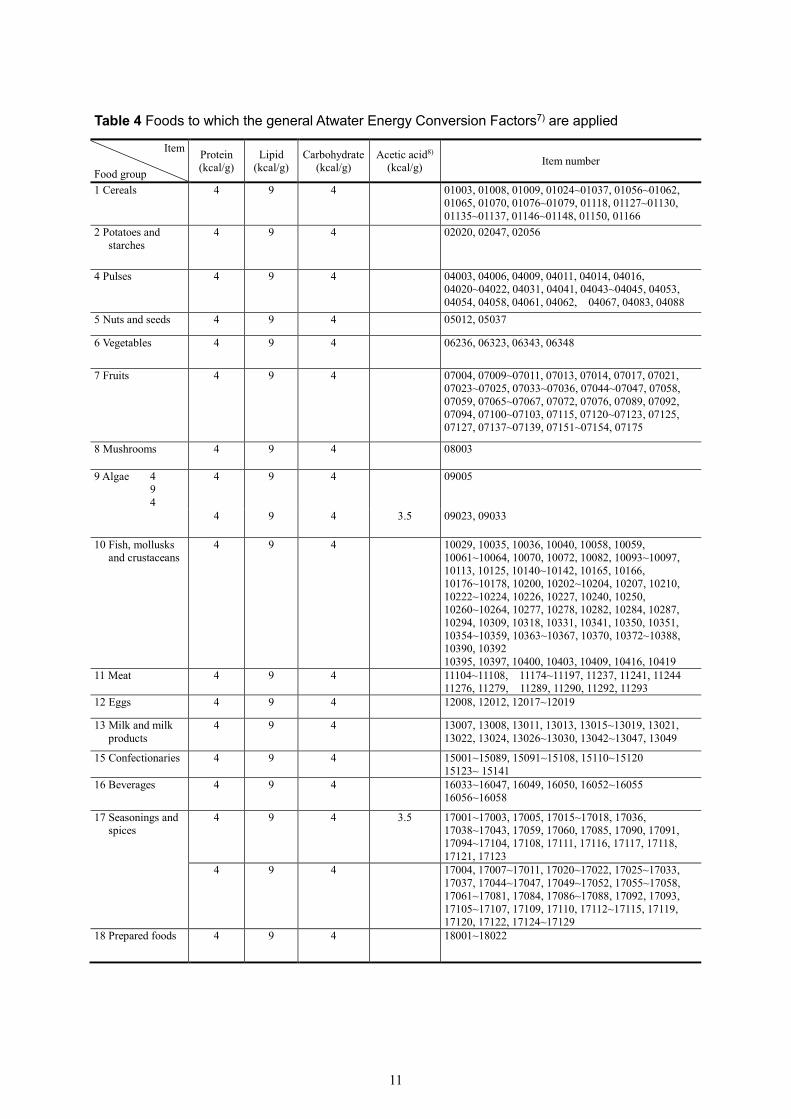
[3] For foods for which applicable energy conversion factors are unclear, the Atwater Factors7) are applied (Table 4).
[4] For prepared foods made from multiple raw materials, the Atwater Factors are used (Table 4).
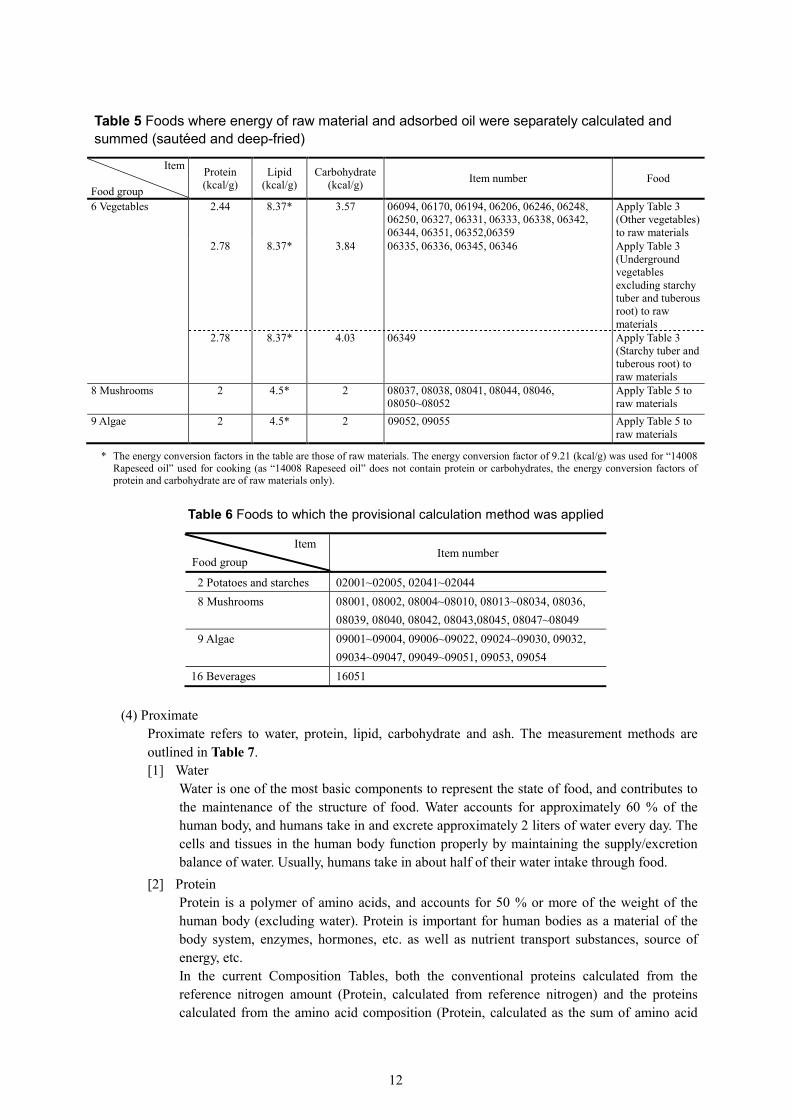
[5] For sautéed foods and deep-fried vegetables, conversion factors are applied to both the raw materials and adsorbed cooking oils (Table 5).
[6] For foods containing ethyl alcohol, the energy conversion factor of 7.1 kcal/g is used for alcohol in accordance with the Report of a Joint FAO/WHO Ad Hoc Expert Committee6).
[7] For foods containing a large amount of acetic acid, the acetic acid energy conversion factor of 3.5 kcal/g8) is used for acetic acid.
[8] For Jerusalem-artichoke and Konjac in “Potatoes and starches”, “Mushrooms”, “Algae”, and “Kobu-cha” (kombu powder used for a drink) in “Beverages”, the energy values were not calculated in the Standard Tables of Food Composition in Japan Fourth Revised Edition (hereinafter referred to as “4th Composition Tables”), because the results of “Measurement Survey on Available Energy in Japanese”2)-5) exhibited a wide variation in energy availability among subjects and it was difficult to determine the energy conversion factors.
However, there has been strong demand to provide energy values of such foods even as mere guidance. As a result of consideration in the Measurement Survey taking into account the availability by component for proteins, lipids and carbohydrates and the energy availability for the entire food, it was decided to calculate the energy using Atwater Factors and then multiplying by 0.5 as a provisional calculation method (Table 6).
Regarding the units of energy, both kilocalorie (kcal) and kilojoule (kJ) are used and shown side by side. In accordance with the Report of a Joint FAO/WHO Ad Hoc Expert Committee6), energy (kcal) is converted to energy (kJ) by the use of the following equation:
1 kcal = 4.184 kJ.
7
Table 2 Foods to which the energy conversion factors based on the “Investigation
for Revision of the Standard Tables of Food Composition in Japan (Science and Technology Agency)”2)-5) are applied
Item Food group
Protein (kcal/g)
Lipid (kcal/g)
Carbohydrate (kcal/g) Item number Food
1 Cereals 3.47 8.37 4.12 01080, 01085, 01090, 01094, 01098, 01102, 01106, 01153, 01155,01157,01161
Brown rice, raw
3.78 8.37 4.16 01081, 01086, 01091, 01095, 01099, 01103, 01107
Paddy rice, half-milled, raw
3.87 8.37 4.20 01082, 01087, 01092, 01096, 01100, 01104, 01108
Paddy rice, under-milled, raw
3.96 8.37 4.20 01083, 01088, 01093, 01097, 01101, 01105, 01109-01117, 01119-01121, 01151, 01152, 01154, 01156, 01158-01160
Paddy rice, well-milled, raw
3.74 8.37 4.16 01084, 01089 Paddy rice, well-milled, rice with embryo, raw
4.32 8.37 4.20 01015-01021, 01038-01055, 01063, 01064, 01066-01069, 01071-01075, 01149
Wheat flour
3.83 8.37 4.16 01122-01126 Buckwheat flour
4 Pulses 4.00 8.46 4.07 04001, 04002, 04004, 04005, 04007, 04008, 04010, 04012, 04013, 04015, 04017-04019, 04023-04028, 04046-04049, 04051, 04055, 04056, 04063-04066, 04068-04075, 04077, 04081, 04089, 04092-04094
Soybeans (cooked with sugar and salt), natto
4.18 9.02 4.07 04032-04040, 04042, 04052, 04057, 04059, 04060, 04084-04087, 04090, 04091
Tofu, “Nama-age” (fried slices of drained tofu), “Abura-age” (fried thin slices of pressed tofu), “Kori-dofu” (freeze dried tofu), uncooked, “Yuba” (film formed on surface of warmed soy milk)
3.43 8.09 4.07 04029, 04030, 04078-04080, 04082 “Kinako” (roasted and ground beans)
6 Vegetables 4.00 8.46 4.07 06015-06017, 06023-06026, 06124, 06125, 06287, 06288
Soybeans (cooked with sugar and salt), natto
8
Table 2 cont.
Item Food group
Protein (kcal/g)
Lipid (kcal/g)
Carbohydrate (kcal/g) Item number Food
10 Fish, mollusks and crustaceans
4.22 9.41 4.11 10001-10022,10025,10026,10030, 10031, 10033,10034,10037-10039,10041-10057, 10060,10065-10067,10069,10071,10073-10081,10083-10092, 10098-10112, 10114-10120, 10122-10124, 10126-10139, 10143-10164, 10167, 10168, 10170-10175, 10179-10199, 10201, 10205, 10206,10208, 10209, 10211-10221,10225, 10228-10239, 10241-10249, 10251-10259, 10265-10276, 10279-10281, 10283, 10285, 10286, 10288-10293, 10295-10301, 10303-10308, 10310-10317, 10319-10330, 10332-10340, 10342-10349, 10352,10353,10360-10362,10368,10369, 10371, 10389, 10391, 10393, 10394, 10396, 10398, 10399, 10401, 10402, 10404-10408, 10410-10415, 10417, 10418, 10420
Fish meat
4.22 9.41 3.876) 10023, 10024, 10027, 10028, 10032, 10068, 10121
Fish meat
11 Meat 4.22 9.41 4.11 11001-11090, 11103, 11109-11164, 11199-11230, 11234, 11235, 11238,11240, 11242, 11243, 11247- 11275,11277, 11278, 11280-11288, 11291
Chicken meat
4.22 9.41 3.876) 11091-11100, 11102, 11165-11171, 11231-11233, 11239
Chicken meat
12 Eggs
4.32 9.41 3.68 12001-12007, 12009-12011, 12013-12016, 12020
Eggs, hen
13 Milk and milk products
4.22 9.16 3.87 13001-13006, 13009, 13010, 13012, 13014, 13020, 13023, 13025, 13031, 13032, 13033,* 13034-13041, 13048, 13050-13058
Milk, Cheese
14 Fats and oils – 9.21 – 14001-14014, 14022-14028,14030,14031 Vegetable oil
4.22 9.41 – 14015, 14016 Animal fat
4.22 9.16 3.87 14017-14019 Butter
4.22 9.21 3.87 14020, 14021,14029 Margarine
17 Seasonings and spices
4.22 9.41 4.11 17019, 17023, 17024 Chicken meat, fish meat
4.00 8.46 4.07 17048 Soybeans (cooked with sugar and salt), natto
2.446) 9.21 – 17006 Vegetable oil
* 13033 is calculated with an acetic acid energy amount of 3.5 (kcal/g).
9
Table 3 Foods to which the energy conversion factors of FAO6) are applied
Item Food group
Protein (kcal/g)
Lipid (kcal/g)
Carbohydrate (kcal/g)
Alcohol (kcal/g)
Acetic acid8) (kcal/g) Item number Food name
listed by FAO6)
1 Cereals 3.46 8.37 4.12 01004 Oatmeal
3.47 8.37 4.07 01001 Nuts and seeds
3.87 8.37 4.12 01002, 01011, 01138, 01139, 01141
Other milled cereals
3.55 8.37 3.95 01005~01007, 01010 Barley (milled)
3.59 8.37 3.78 01012~01014, 01023 Wheat flour, yield 97-100 %
2.73 8.37 4.03 01131, 01162 Corn powder (wholemeal)
3.46 8.37 4.16 01132~01134, 01163~01165 Corn powder (germ removed)
2.50 8.37 4.03 01140 Sorghum (kaoliang) (wholegrain)
3.05 8.37 3.86 01142 Rye flour (whole flour)
3.41 8.37 4.07 01143 Rye flour (light in color)
2 Potatoes and starches
2.78 8.37 4.03 02006~02019, 02021~02040 02045, 02046, 02048~02055 02057~02062
Potatoes, starchy tuber and tuberous root
3 Sugars and sweeteners
47) – 3.87
03001, 03002, 03004, 03010, 03014, 03023, 03029
Cane sugar Beet sugar
– – 3.87 03003, 03005~03009, 03011~03013
– – 3.68 03017~03020, 03026~03028 Glucose
47) – 3.68 03022 Glucose
– – 3.93* 03015 Dried glucose syrup
– – 3.86** 03024~03025 Glucose syrup
5 Nuts and seeds
3.47 8.37 4.07 05001~05011, 05013~05036 05040~05045
Nuts and seeds
6 Vegetables 2.78 8.37 3.84 06036~6039, 06041, 06042 06044, 06045, 06084, 06085, 06102~06105, 06114, 06132~06143, 06153~06156, 06212~06222, 06240, 06243, 06244, 06270, 06295, 06305~06307 06317, 06318, 06322, 06334, 06337, 06347
Underground vegetables excluding starchy tuber and tuberous root
2.78 8.37 4.03 06046 ~ 06050, 06078, 06079, 06223, 06282, 06296, 06297, 06332
Starchy tuber and tuberous root
3.47 8.37 4.07 06303,06304 Nuts and seeds
2.73 8.37 4.03 06175~06180, 06339 Corn
*DE30, *DE50 DE stands for dextrose equivalents, which is an index of the degree of saccharification. DE is expressed as a percentage of reducing sugars (as glucose) in the solid. The maximum DE is 100, indicating the entire solid is glucose.
10
Table 3 Continued
Item Food group
Protein (kcal/g)
Lipid (kcal/g)
Carbohydrate (kcal/g)
Alcohol (kcal/g)
Acetic acid8)
(kcal/g) Item number Food name listed
by FAO6)
6 Vegetables (continued)
2.44 8.37 3.57 06001~06014, 06018~06022, 06027~ 06035, 06040, 06043, 06051~06077, 06080~06083, 06086~06093, 06095~06101, 06106~06113, 06115~06123, 06126~06131, 06144~06152, 06157~06169, 06171~06174, 06181~06193, 06195~06205, 06207~06211, 06224~06235, 06237~06239, 06241, 06242, 06245, 06247, 06249, 06251~06269, 06271~06281, 06283~06286, 06289~06294, 06298~06302, 06308~06316, 06319~06321, 06324~ 06326, 06328~06330, 06340, 06341, 06350, 06353~ 06358, 06360~06362
Other vegetables
7 Fruits 3.36 8.37 2.70 07019, 07020, 07022, 07052, 07075, 07079, 07083, 07143, 07145, 07156
Lemons, limes
3.36 8.37 3.60 07001~ 07003, 07005~07008, 07012, 07015, 07016, 07018, 07026~07032, 07037~07043, 07048~ 07051, 07053~07057, 07060~ 07064, 07069~07071, 07073, 07074, 07077, 07078, 07080~07082, 07085~07088, 07090, 07091, 07093, 07095~07099, 07104~07114, 07116~07119, 07124, 07126, 07128~07136, 07140~07142, 07144, 07146 ~ 07150, 07155, 07157, 07158, 07159~07174, 07176
All fruits excluding lemons and limes
10 Fish, mollusks and crustaceans
3.90 9.02 4.115) 10169 Gelatin
11 Meat 3.90 9.02 4.115) 11101, 11172, 11173, 11198, 11236
Gelatin
15 Confectionaries – – 3.87 15109 Cane sugar Beet sugar
2.78 8.37 4.03 15121,15122 Potatoes, starchy tuber and tuberous root
47) 97) 47) 7.1 15090 Alcohol
16 Beverages 47) 97) 47) 7.1 16001~16032 Alcohol
1.83 8.37 1.33 16048 Chocolate
17 Seasonings and spices
2.44 8.37 3.57 17034, 17035 Other vegetables
47) 97) 47) 7.1 17053, 17054 Alcohol
3.00 8.37 3.35 17082, 17083 Yeast
11
Table 4 Foods to which the general Atwater Energy Conversion Factors7) are applied
Item Food group
Protein (kcal/g)
Lipid (kcal/g)
Carbohydrate (kcal/g)
Acetic acid8) (kcal/g) Item number
1 Cereals 4 9 4 01003, 01008, 01009, 01024~01037, 01056~01062, 01065, 01070, 01076~01079, 01118, 01127~01130, 01135~01137, 01146~01148, 01150, 01166
2 Potatoes and starches
4 9 4 02020, 02047, 02056
4 Pulses 4 9 4 04003, 04006, 04009, 04011, 04014, 04016, 04020~04022, 04031, 04041, 04043~04045, 04053, 04054, 04058, 04061, 04062, 04067, 04083, 04088
5 Nuts and seeds 4 9 4 05012, 05037
6 Vegetables 4 9 4 06236, 06323, 06343, 06348
7 Fruits 4 9 4 07004, 07009~07011, 07013, 07014, 07017, 07021, 07023~07025, 07033~07036, 07044~07047, 07058, 07059, 07065~07067, 07072, 07076, 07089, 07092, 07094, 07100~07103, 07115, 07120~07123, 07125, 07127, 07137~07139, 07151~07154, 07175
8 Mushrooms 4 9 4 08003
9 Algae 4 9 4
4 9 4 09005
4 9 4 3.5 09023, 09033
10 Fish, mollusks and crustaceans
4 9 4 10029, 10035, 10036, 10040, 10058, 10059, 10061~10064, 10070, 10072, 10082, 10093~10097, 10113, 10125, 10140~10142, 10165, 10166, 10176~10178, 10200, 10202~10204, 10207, 10210, 10222~10224, 10226, 10227, 10240, 10250, 10260~10264, 10277, 10278, 10282, 10284, 10287, 10294, 10309, 10318, 10331, 10341, 10350, 10351, 10354~10359, 10363~10367, 10370, 10372~10388, 10390, 10392 10395, 10397, 10400, 10403, 10409, 10416, 10419
11 Meat 4 9 4 11104~11108, 11174~11197, 11237, 11241, 11244 11276, 11279, 11289, 11290, 11292, 11293
12 Eggs 4 9 4 12008, 12012, 12017~12019
13 Milk and milk products
4 9 4 13007, 13008, 13011, 13013, 13015~13019, 13021, 13022, 13024, 13026~13030, 13042~13047, 13049
15 Confectionaries 4 9 4 15001~15089, 15091~15108, 15110~15120 15123~ 15141
16 Beverages 4 9 4 16033~16047, 16049, 16050, 16052~16055 16056~16058
17 Seasonings and spices
4 9 4 3.5 17001~17003, 17005, 17015~17018, 17036, 17038~17043, 17059, 17060, 17085, 17090, 17091, 17094~17104, 17108, 17111, 17116, 17117, 17118, 17121, 17123
4 9 4 17004, 17007~17011, 17020~17022, 17025~17033, 17037, 17044~17047, 17049~17052, 17055~17058, 17061~17081, 17084, 17086~17088, 17092, 17093, 17105~17107, 17109, 17110, 17112~17115, 17119, 17120, 17122, 17124~17129
18 Prepared foods 4 9 4 18001~18022
12
Table 5 Foods where energy of raw material and adsorbed oil were separately calculated and summed (sautéed and deep-fried)
Item
Food group
Protein (kcal/g)
Lipid (kcal/g)
Carbohydrate (kcal/g) Item number Food
6 Vegetables 2.44 8.37* 3.57 06094, 06170, 06194, 06206, 06246, 06248, 06250, 06327, 06331, 06333, 06338, 06342, 06344, 06351, 06352,06359
Apply Table 3 (Other vegetables) to raw materials
2.78 8.37* 3.84 06335, 06336, 06345, 06346 Apply Table 3 (Underground vegetables excluding starchy tuber and tuberous root) to raw materials
2.78 8.37* 4.03 06349 Apply Table 3 (Starchy tuber and tuberous root) to raw materials
8 Mushrooms 2 4.5* 2 08037, 08038, 08041, 08044, 08046, 08050~08052
Apply Table 5 to raw materials
9 Algae 2 4.5* 2 09052, 09055 Apply Table 5 to raw materials
* The energy conversion factors in the table are those of raw materials. The energy conversion factor of 9.21 (kcal/g) was used for “14008 Rapeseed oil” used for cooking (as “14008 Rapeseed oil” does not contain protein or carbohydrates, the energy conversion factors of protein and carbohydrate are of raw materials only).
Table 6 Foods to which the provisional calculation method was applied
Item Food group
Item number
2 Potatoes and starches 02001~02005, 02041~02044 8 Mushrooms 08001, 08002, 08004~08010, 08013~08034, 08036,
08039, 08040, 08042, 08043,08045, 08047~08049 9 Algae 09001~09004, 09006~09022, 09024~09030, 09032,
09034~09047, 09049~09051, 09053, 09054 16 Beverages 16051
(4) Proximate
Proximate refers to water, protein, lipid, carbohydrate and ash. The measurement methods are outlined in Table 7. [1] Water
Water is one of the most basic components to represent the state of food, and contributes to the maintenance of the structure of food. Water accounts for approximately 60 % of the human body, and humans take in and excrete approximately 2 liters of water every day. The cells and tissues in the human body function properly by maintaining the supply/excretion balance of water. Usually, humans take in about half of their water intake through food.
[2] Protein Protein is a polymer of amino acids, and accounts for 50 % or more of the weight of the human body (excluding water). Protein is important for human bodies as a material of the body system, enzymes, hormones, etc. as well as nutrient transport substances, source of energy, etc. In the current Composition Tables, both the conventional proteins calculated from the reference nitrogen amount (Protein, calculated from reference nitrogen) and the proteins calculated from the amino acid composition (Protein, calculated as the sum of amino acid
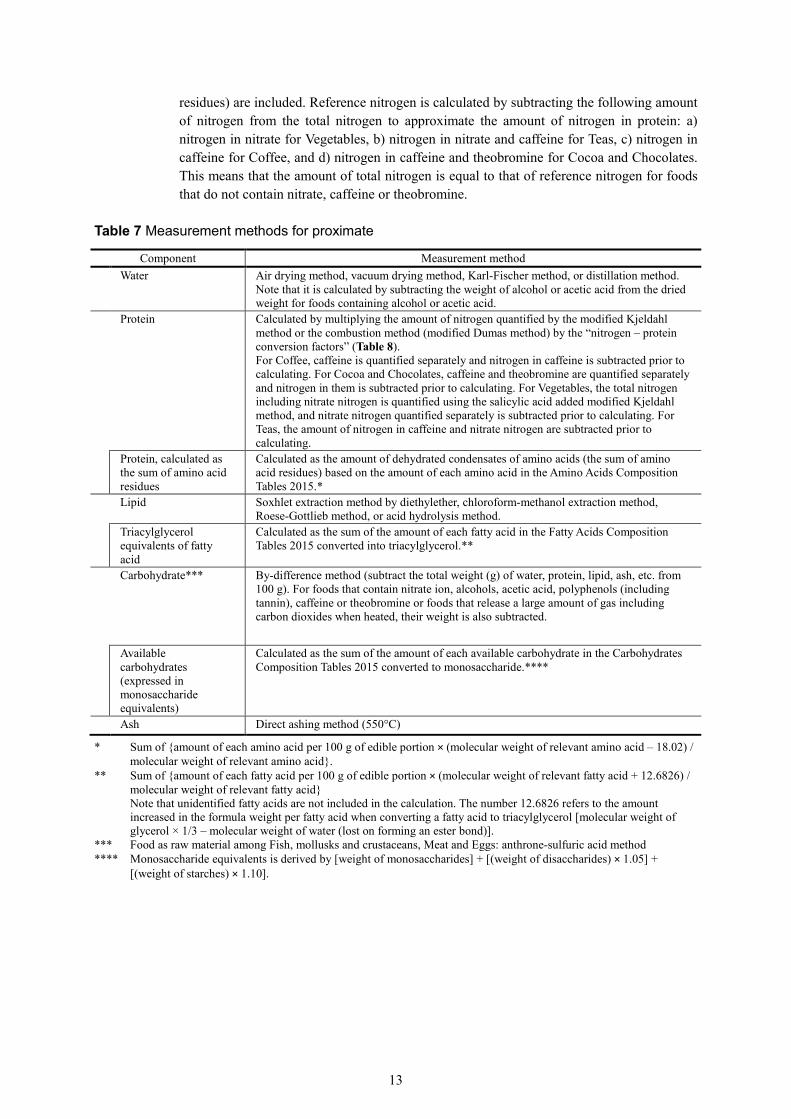
13
residues) are included. Reference nitrogen is calculated by subtracting the following amount of nitrogen from the total nitrogen to approximate the amount of nitrogen in protein: a) nitrogen in nitrate for Vegetables, b) nitrogen in nitrate and caffeine for Teas, c) nitrogen in caffeine for Coffee, and d) nitrogen in caffeine and theobromine for Cocoa and Chocolates. This means that the amount of total nitrogen is equal to that of reference nitrogen for foods that do not contain nitrate, caffeine or theobromine.
Table 7 Measurement methods for proximate
Component Measurement method Water Air drying method, vacuum drying method, Karl-Fischer method, or distillation method.
Note that it is calculated by subtracting the weight of alcohol or acetic acid from the dried weight for foods containing alcohol or acetic acid.
Protein Calculated by multiplying the amount of nitrogen quantified by the modified Kjeldahl method or the combustion method (modified Dumas method) by the “nitrogen – protein conversion factors” (Table 8). For Coffee, caffeine is quantified separately and nitrogen in caffeine is subtracted prior to calculating. For Cocoa and Chocolates, caffeine and theobromine are quantified separately and nitrogen in them is subtracted prior to calculating. For Vegetables, the total nitrogen including nitrate nitrogen is quantified using the salicylic acid added modified Kjeldahl method, and nitrate nitrogen quantified separately is subtracted prior to calculating. For Teas, the amount of nitrogen in caffeine and nitrate nitrogen are subtracted prior to calculating.
Protein, calculated as the sum of amino acid residues
Calculated as the amount of dehydrated condensates of amino acids (the sum of amino acid residues) based on the amount of each amino acid in the Amino Acids Composition Tables 2015.*
Lipid Soxhlet extraction method by diethylether, chloroform-methanol extraction method, Roese-Gottlieb method, or acid hydrolysis method.
Triacylglycerol equivalents of fatty acid
Calculated as the sum of the amount of each fatty acid in the Fatty Acids Composition Tables 2015 converted into triacylglycerol.**
Carbohydrate*** By-difference method (subtract the total weight (g) of water, protein, lipid, ash, etc. from 100 g). For foods that contain nitrate ion, alcohols, acetic acid, polyphenols (including tannin), caffeine or theobromine or foods that release a large amount of gas including carbon dioxides when heated, their weight is also subtracted.
Available carbohydrates (expressed in monosaccharide equivalents)
Calculated as the sum of the amount of each available carbohydrate in the Carbohydrates Composition Tables 2015 converted to monosaccharide.****
Ash Direct ashing method (550°C)
* Sum of {amount of each amino acid per 100 g of edible portion × (molecular weight of relevant amino acid – 18.02) / molecular weight of relevant amino acid}.
** Sum of {amount of each fatty acid per 100 g of edible portion × (molecular weight of relevant fatty acid + 12.6826) / molecular weight of relevant fatty acid}
Note that unidentified fatty acids are not included in the calculation. The number 12.6826 refers to the amount increased in the formula weight per fatty acid when converting a fatty acid to triacylglycerol [molecular weight of glycerol × 1/3 – molecular weight of water (lost on forming an ester bond)].
*** Food as raw material among Fish, mollusks and crustaceans, Meat and Eggs: anthrone-sulfuric acid method **** Monosaccharide equivalents is derived by [weight of monosaccharides] + [(weight of disaccharides) × 1.05] +
[(weight of starches) × 1.10].
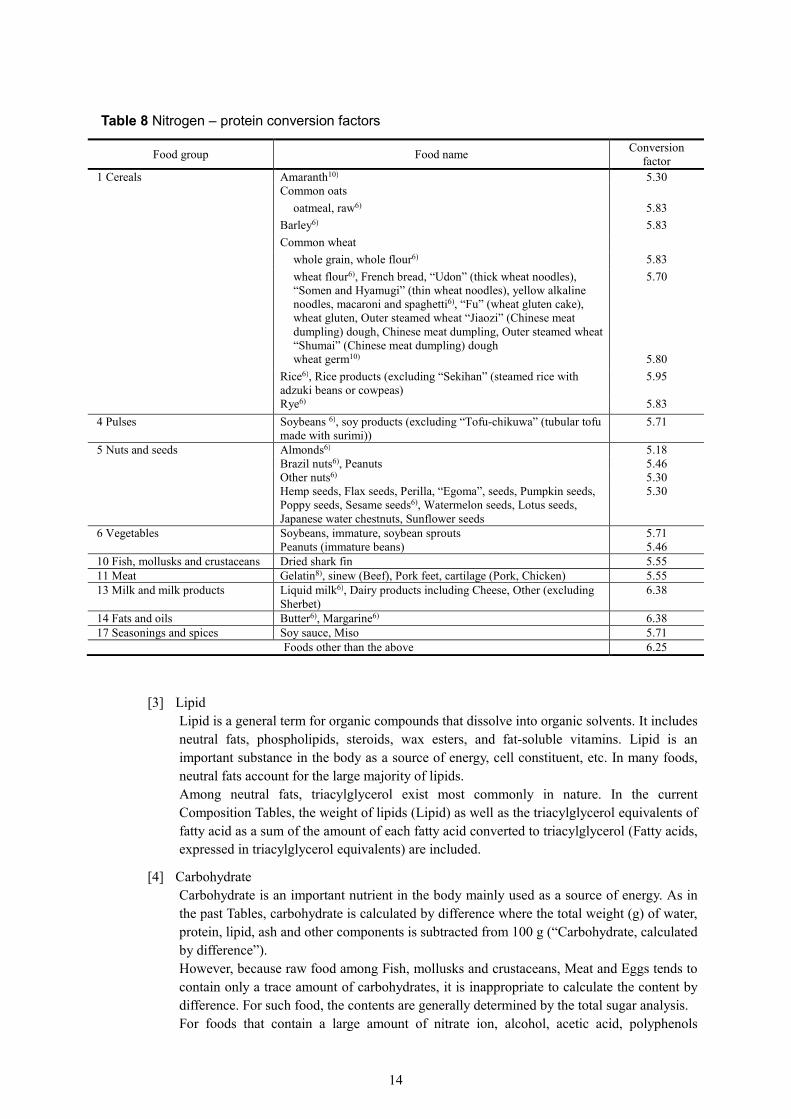
14
Table 8 Nitrogen – protein conversion factors
Food group Food name Conversion factor
1 Cereals Amaranth10) 5.30 Common oats oatmeal, raw6) 5.83 Barley6) 5.83 Common wheat whole grain, whole flour6) 5.83 wheat flour6), French bread, “Udon” (thick wheat noodles),
“Somen and Hyamugi” (thin wheat noodles), yellow alkaline noodles, macaroni and spaghetti6), “Fu” (wheat gluten cake), wheat gluten, Outer steamed wheat “Jiaozi” (Chinese meat dumpling) dough, Chinese meat dumpling, Outer steamed wheat “Shumai” (Chinese meat dumpling) dough
5.70
wheat germ10) 5.80 Rice6), Rice products (excluding “Sekihan” (steamed rice with
adzuki beans or cowpeas) 5.95
Rye6) 5.83 4 Pulses Soybeans 6), soy products (excluding “Tofu-chikuwa” (tubular tofu
made with surimi)) 5.71
5 Nuts and seeds Almonds6) 5.18 Brazil nuts6), Peanuts 5.46 Other nuts6) 5.30 Hemp seeds, Flax seeds, Perilla, “Egoma”, seeds, Pumpkin seeds,
Poppy seeds, Sesame seeds6), Watermelon seeds, Lotus seeds, Japanese water chestnuts, Sunflower seeds
5.30
6 Vegetables Soybeans, immature, soybean sprouts Peanuts (immature beans)
5.71 5.46
10 Fish, mollusks and crustaceans Dried shark fin 5.55 11 Meat Gelatin8), sinew (Beef), Pork feet, cartilage (Pork, Chicken) 5.55 13 Milk and milk products Liquid milk6), Dairy products including Cheese, Other (excluding
Sherbet) 6.38
14 Fats and oils Butter6), Margarine6) 6.38 17 Seasonings and spices Soy sauce, Miso 5.71
Foods other than the above 6.25
[3] Lipid Lipid is a general term for organic compounds that dissolve into organic solvents. It includes neutral fats, phospholipids, steroids, wax esters, and fat-soluble vitamins. Lipid is an important substance in the body as a source of energy, cell constituent, etc. In many foods, neutral fats account for the large majority of lipids. Among neutral fats, triacylglycerol exist most commonly in nature. In the current Composition Tables, the weight of lipids (Lipid) as well as the triacylglycerol equivalents of fatty acid as a sum of the amount of each fatty acid converted to triacylglycerol (Fatty acids, expressed in triacylglycerol equivalents) are included.
[4] Carbohydrate Carbohydrate is an important nutrient in the body mainly used as a source of energy. As in the past Tables, carbohydrate is calculated by difference where the total weight (g) of water, protein, lipid, ash and other components is subtracted from 100 g (“Carbohydrate, calculated by difference”). However, because raw food among Fish, mollusks and crustaceans, Meat and Eggs tends to contain only a trace amount of carbohydrates, it is inappropriate to calculate the content by difference. For such food, the contents are generally determined by the total sugar analysis. For foods that contain a large amount of nitrate ion, alcohol, acetic acid, polyphenols
15
(including tannin), caffeine or theobromine or foods that release a large amount of gas including carbon dioxides when heated, their content is also subtracted when calculating carbohydrates. The carbohydrate includes dietary fiber and organic acids excluding acetic acid. The dietary fiber is shown separately. Additionally, in the current Composition Tables, available carbohydrates in monosaccharide equivalents are newly included, as a total weight of starch, glucose, fructose, galactose, sucrose, maltose, lactose, trehalose and other saccharides determined by direct analysis or estimation (Carbohydrate, available; expressed in monosaccharide equivalents). Note that because a majority of available carbohydrates in the monosaccharide equivalents are determined by samples different from those used for other nutrients such as carbohydrate, these contents cannot be related or compared to each other.
[5] Ash Ash is residue obtained by ashing and is considered to be reflecting the total amount of minerals in food. The weight of ash is needed for calculating the carbohydrate by difference.
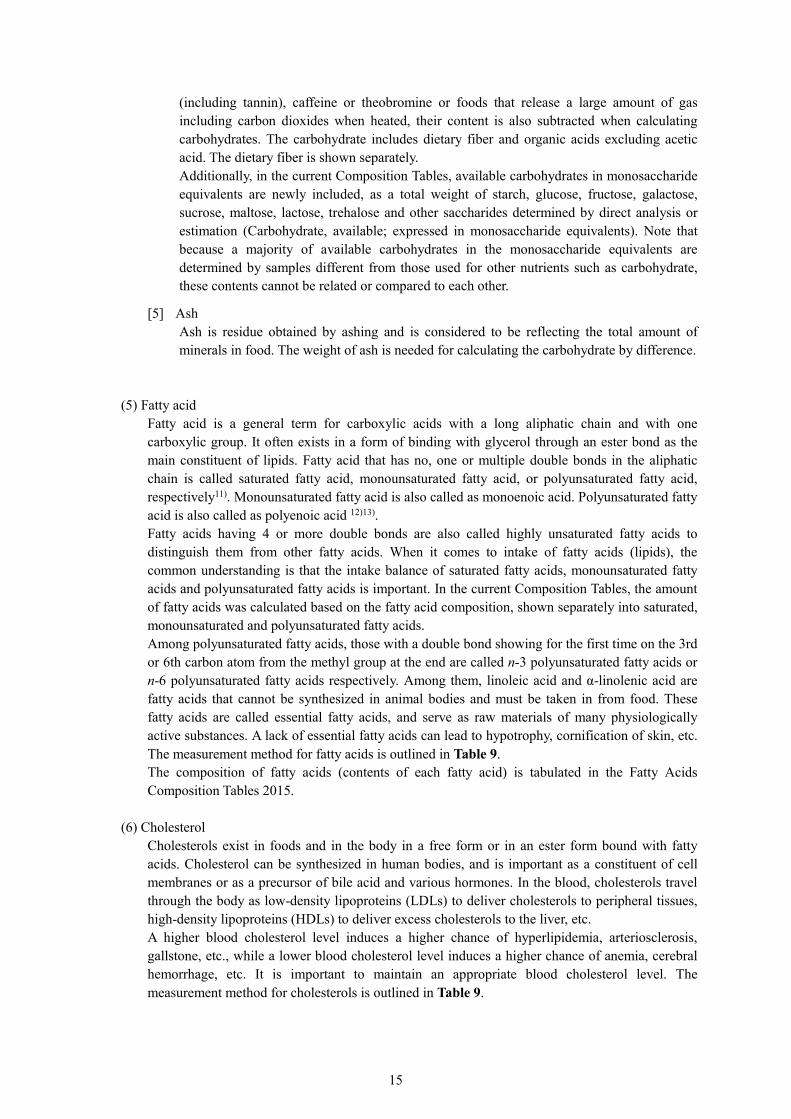
(5) Fatty acid Fatty acid is a general term for carboxylic acids with a long aliphatic chain and with one carboxylic group. It often exists in a form of binding with glycerol through an ester bond as the main constituent of lipids. Fatty acid that has no, one or multiple double bonds in the aliphatic chain is called saturated fatty acid, monounsaturated fatty acid, or polyunsaturated fatty acid, respectively11). Monounsaturated fatty acid is also called as monoenoic acid. Polyunsaturated fatty acid is also called as polyenoic acid 12)13). Fatty acids having 4 or more double bonds are also called highly unsaturated fatty acids to distinguish them from other fatty acids. When it comes to intake of fatty acids (lipids), the common understanding is that the intake balance of saturated fatty acids, monounsaturated fatty acids and polyunsaturated fatty acids is important. In the current Composition Tables, the amount of fatty acids was calculated based on the fatty acid composition, shown separately into saturated, monounsaturated and polyunsaturated fatty acids. Among polyunsaturated fatty acids, those with a double bond showing for the first time on the 3rd or 6th carbon atom from the methyl group at the end are called n-3 polyunsaturated fatty acids or n-6 polyunsaturated fatty acids respectively. Among them, linoleic acid and α-linolenic acid are fatty acids that cannot be synthesized in animal bodies and must be taken in from food. These fatty acids are called essential fatty acids, and serve as raw materials of many physiologically active substances. A lack of essential fatty acids can lead to hypotrophy, cornification of skin, etc. The measurement method for fatty acids is outlined in Table 9. The composition of fatty acids (contents of each fatty acid) is tabulated in the Fatty Acids Composition Tables 2015.
(6) Cholesterol
Cholesterols exist in foods and in the body in a free form or in an ester form bound with fatty acids. Cholesterol can be synthesized in human bodies, and is important as a constituent of cell membranes or as a precursor of bile acid and various hormones. In the blood, cholesterols travel through the body as low-density lipoproteins (LDLs) to deliver cholesterols to peripheral tissues, high-density lipoproteins (HDLs) to deliver excess cholesterols to the liver, etc. A higher blood cholesterol level induces a higher chance of hyperlipidemia, arteriosclerosis, gallstone, etc., while a lower blood cholesterol level induces a higher chance of anemia, cerebral hemorrhage, etc. It is important to maintain an appropriate blood cholesterol level. The measurement method for cholesterols is outlined in Table 9.
16
(7) Dietary fiber In the current Composition Tables, dietary fiber is defined as “all indigestible components in food that is not digested by a human’s digestive enzymes”, and the modified Prosky method was applied as the quantification method of dietary fiber. Its component values are shown for soluble dietary fiber, insoluble dietary fiber, and total dietary fiber as the sum of the two. For foods with a difficulty in quantification of soluble and insoluble dietary fiber separately, only the total amount is shown. Animal foods exclude dietary fiber from the Tables because they insignificantly contribute as a source of dietary fiber. The measurement method for dietary fibers is outlined in Table 9. Dietary fiber is known to have various physiological actions including promotion of digestive tract functions and peristaltic motion of intestines as well as slowing down of absorption of nutrients. It is considered that the physiological action of soluble dietary fiber is different from that of insoluble dietary fiber.
Table 9 Analytical methods for fatty acids, cholesterols and dietary fibers
Component Sample preparation method Measurement method Fatty acid Extract lipid and esterify Hydrogen flame ionization detection – gas chromatography
Cholesterol Saponify, then extract and separate unsaponified portion Hydrogen flame ionization detection – gas chromatography
Dietary fiber Remove fat if containing>5 % fat Enzyme – gravimetric method (modified Prosky method or
Prosky mehod)
(8) Mineral
All the minerals included in the current Composition Tables are those identified to be necessary for humans. The minerals are sodium, potassium, calcium, magnesium, phosphorus, iron, zinc, copper, manganese, iodine, selenium, chromium, and molybdenum. The amount of intake of the former five minerals (underlined) is roughly 100 mg or more per day for an adult, while that of the latter eight minerals is less than 100 mg. The methods for mineral analysis are outlined in Table 10.
[1] Sodium Sodium is involved with the maintenance of the osmotic pressure of extracellular fluids, absorption of sugars, action of the nervous system and muscle cells, etc., and contributes to the maintenance of the skeletal structure as a constituent of bone. In general, it is known that a lack of sodium can lead to a feeling of fatigue, low blood pressure, and excessive intake can lead to swelling, high blood pressure, etc. In some cases of reduced renal functions, restriction on the intake of sodium is required.
[2] Potassium Potassium plays a role in the maintenance of the intracellular osmotic pressure, maintenance of the activity of cells, etc. It is known that excessive intake of salt or aging can lead to a loss of potassium, resulting in reduced cell activities. Normally any excess potassium taken is excreted swiftly; if the potassium excretion ability is reduced due to reduced renal functions, restriction on the intake of potassium is required.
[3] Calcium Calcium is one of main constituents of bone, and almost all calcium exists in the bone and dental tissues. Although small in the intracellular amount, calcium is an essential component for many functions and activities of cells. Calcium is also involved with blood coagulation, and its concentration in the plasma is maintained at a certain level. A lack of calcium during the growth period suppresses the growth, and a lack of calcium after growth leads to brittle bones.
17
[4] Magnesium Magnesium is involved with the maintenance of the elasticity of bone, adjustment of potassium level in cells, and the maintenance of the form of nucleus, and is an essential component for cells to store and consume energy. Reduction in the magnesium level in the cells is observed for many cases of lifestyle-related diseases and alcoholism. Reduction in the renal functions can lead to hypermagnesemia.
[5] Phosphorus Phosphorus is a main constituent of bone along with calcium, and also is important as a constituent of phospholipids. Additionally, phosphorus is closely involved with the energy metabolism as high energy phosphate compounds. In some cases of reduced renal functions, restriction on the intake of phosphorus is required.
[6] Iron
Iron is preferentially distributed in red blood cells as a constituent of hemoglobin that transports oxygen and carbon dioxides in the body. Iron is also important as a constituent of myoglobin in muscles and cytochrome in cells. A lack of iron leads to anemia and reduced activity of tissues, and overdose of iron preparation occasionally results in pigmentation of iron (hemochromatosis, hemosiderosis).
[7] Zinc Zinc is important as a constituent of various enzymes including those involved with the synthesis of nucleic acids and proteins, insulin (blood sugar level controlling hormone), etc. A lack of zinc leads to growth disorders and dermatitis in children, and poor reproduction (e.g., skin, mucous, blood cells, liver), taste/smell disorders, as well as reduced ability to synthesize immune proteins in adults.
[8] Copper Copper is important as a constituent of catecholamine metabolism enzymes such as adrenaline. There are some inherent disorders known to exist involved with copper, such as Menkes disease that leads to copper deficiency and Wilson’s disease that induces copper accumulation.
[9] Manganese Manganese is important as a constituent for pyruvate carboxylase etc. Manganese also acts on the reaction of various enzymes involved with magnesium. While manganese can be seen abundantly in plants, the amount in humans and animals is small.
[10] Iodine Iodine is a constituent of thyroid hormones. A lack of iodine exacerbates the secretion of thyroid-stimulating hormones, leading to goiter.
[11] Selenium Selenium is a constituent of glutathione peroxidase and iodothyronine deiodinase. It is known that some symptoms considered to be mainly attributable to selenium deficiency are observed in people living in regions with extremely low soil selenium levels, leading to myocardial damage (Keshan disease).
[12] Chromium Chromium is involved with the metabolism of sugars, cholesterols, connective tissues, and proteins. It is known that chromium deficiency can be observed in some cases of long-term total parenteral nutrition (also known as central venous hyperalimentation), leading to reduced glucose tolerance, reduced body weight, peripheral neuropathy, etc.
18
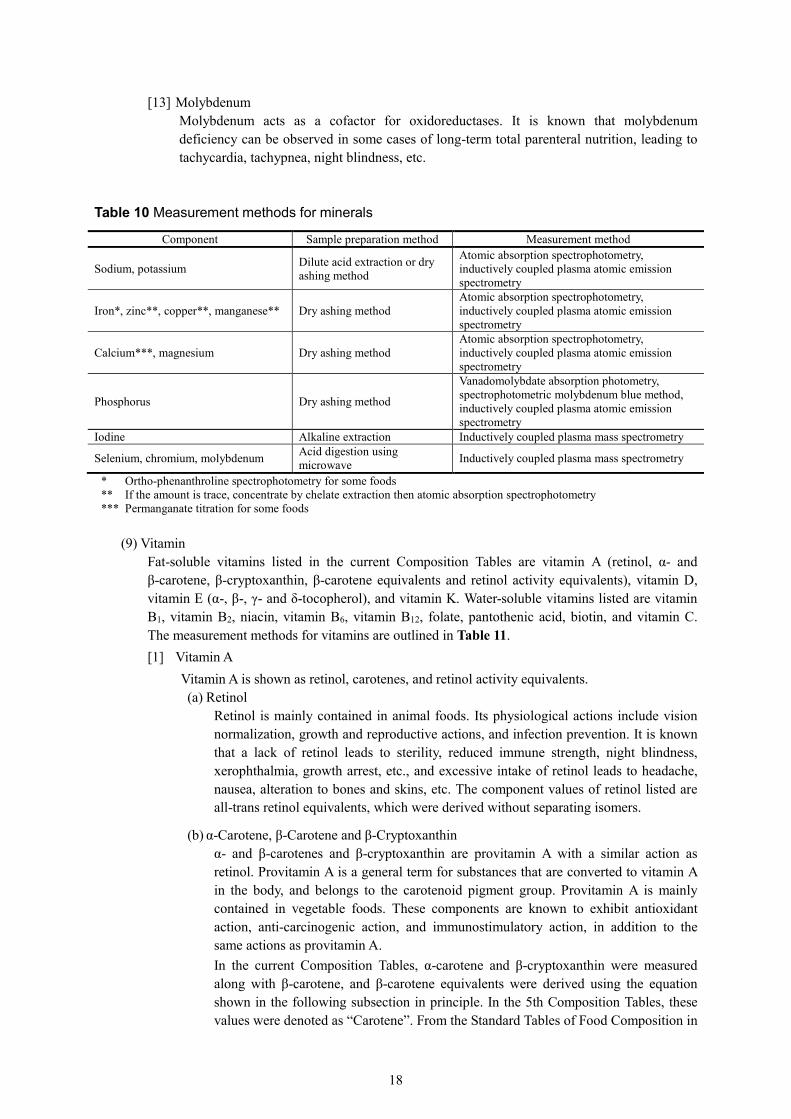
[13] Molybdenum Molybdenum acts as a cofactor for oxidoreductases. It is known that molybdenum deficiency can be observed in some cases of long-term total parenteral nutrition, leading to tachycardia, tachypnea, night blindness, etc.
Table 10 Measurement methods for minerals
Component Sample preparation method Measurement method
Sodium, potassium Dilute acid extraction or dry ashing method
Atomic absorption spectrophotometry, inductively coupled plasma atomic emission spectrometry
Iron*, zinc**, copper**, manganese** Dry ashing method Atomic absorption spectrophotometry, inductively coupled plasma atomic emission spectrometry
Calcium***, magnesium Dry ashing method Atomic absorption spectrophotometry, inductively coupled plasma atomic emission spectrometry
Phosphorus Dry ashing method
Vanadomolybdate absorption photometry, spectrophotometric molybdenum blue method, inductively coupled plasma atomic emission spectrometry
Iodine Alkaline extraction Inductively coupled plasma mass spectrometry
Selenium, chromium, molybdenum Acid digestion using microwave Inductively coupled plasma mass spectrometry
* Ortho-phenanthroline spectrophotometry for some foods ** If the amount is trace, concentrate by chelate extraction then atomic absorption spectrophotometry *** Permanganate titration for some foods
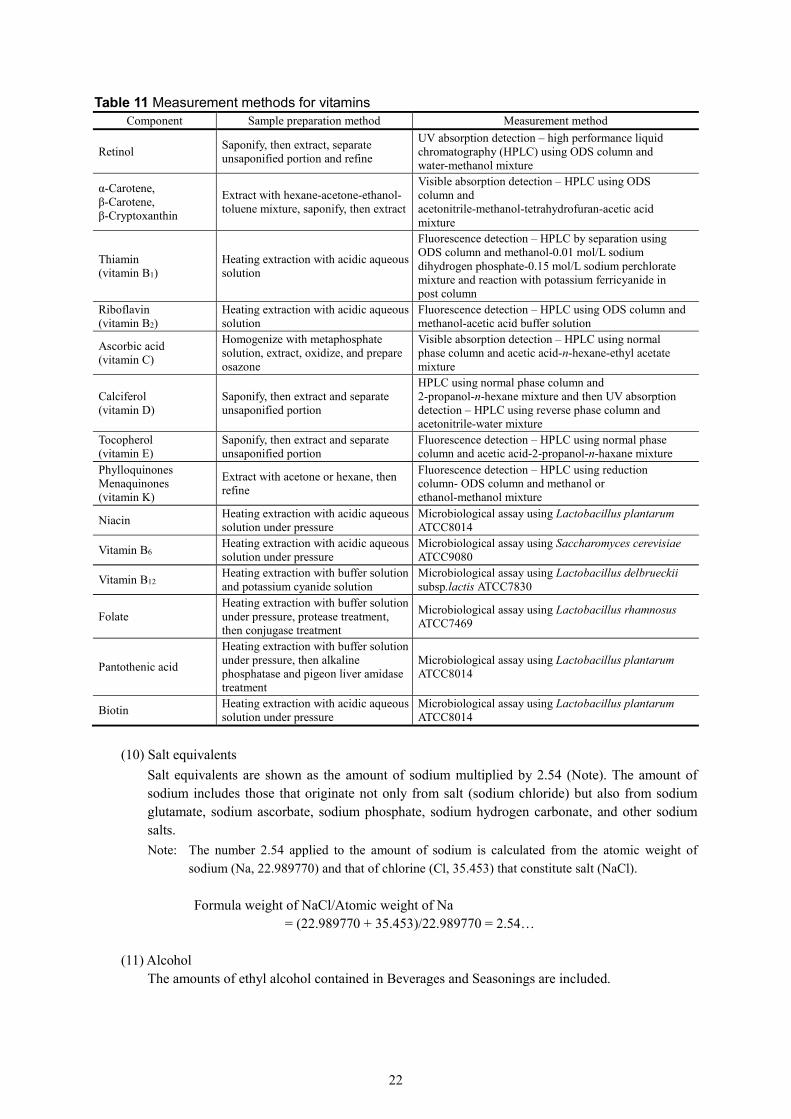
(9) Vitamin
Fat-soluble vitamins listed in the current Composition Tables are vitamin A (retinol, α- and β-carotene, β-cryptoxanthin, β-carotene equivalents and retinol activity equivalents), vitamin D, vitamin E (α-, β-, γ- and δ-tocopherol), and vitamin K. Water-soluble vitamins listed are vitamin B1, vitamin B2, niacin, vitamin B6, vitamin B12, folate, pantothenic acid, biotin, and vitamin C. The measurement methods for vitamins are outlined in Table 11. [1] Vitamin A
Vitamin A is shown as retinol, carotenes, and retinol activity equivalents. (a) Retinol
Retinol is mainly contained in animal foods. Its physiological actions include vision normalization, growth and reproductive actions, and infection prevention. It is known that a lack of retinol leads to sterility, reduced immune strength, night blindness, xerophthalmia, growth arrest, etc., and excessive intake of retinol leads to headache, nausea, alteration to bones and skins, etc. The component values of retinol listed are all-trans retinol equivalents, which were derived without separating isomers.
(b) α-Carotene, β-Carotene and β-Cryptoxanthin α- and β-carotenes and β-cryptoxanthin are provitamin A with a similar action as retinol. Provitamin A is a general term for substances that are converted to vitamin A in the body, and belongs to the carotenoid pigment group. Provitamin A is mainly contained in vegetable foods. These components are known to exhibit antioxidant action, anti-carcinogenic action, and immunostimulatory action, in addition to the same actions as provitamin A. In the current Composition Tables, α-carotene and β-cryptoxanthin were measured along with β-carotene, and β-carotene equivalents were derived using the equation shown in the following subsection in principle. In the 5th Composition Tables, these values were denoted as “Carotene”. From the Standard Tables of Food Composition in
19
Japan Fifth Revised and Enlarged Edition (hereinafter referred to as “5th Enlarged Composition Tables”) onward, they have been denoted as “β-Carotene equivalents” and component values of α- and β-carotenes and β-cryptoxanthin not listed in the 5th Composition Tables are also included. For some foods the component values in the 4th Composition Tables are used. For these, component values of α- and β-carotenes and β-cryptoxanthin are not listed since these components are not quantified separately.
(c) β-Carotene equivalents β-Carotene equivalents are calculated using the following equation:
β-Carotene equivalents (μg)
= β-Carotene (μg) +21 α-Carotene (μg) +
21
β-Cryptoxanthin (μg).
(d) Retinol activity equivalents (RAE)
These values were denoted as “Retinol equivalents” in the Composition Tables 2010, but are changed to “Retinol activity equivalents” in the current Composition Tables in accordance with the change in the name of unit in the Dietary Reference Intakes for Japanese (2015 Edition). Same as in the Composition Tables 2010, RAE is calculated based on the following equation14):
Retinol activity equivalents (μgRAE)
= Retinol (μg) +121
β-Carotene equivalents (μg).
β-Carotene equivalents and RAE are calculated using unrounded analytical values of each component. Therefore, equivalents calculated using the values listed in the current Composition Tables may not be the same as the equivalents listed in the Tables.
[2] Vitamin D Vitamin D (calciferol) is involved with absorption and use of calcium, calcification of bones, etc. Vitamin D contained in vegetable foods is vitamin D2 (ergocalciferol), and in animal foods vitamin D3 (cholecalciferol). Their molecular weights are different, yet both vitamin D2 and D3 exhibit almost identical physiological action to humans. It is known that a lack of vitamin D leads to rickets in children, osteomalacia in adults, etc. Provitamin D2 (ergosterol) and provitamin D3 (7-dehydrocholesterol) are converted to vitamin D by irradiation of UV, not in the small intestines.
[3] Vitamin E Vitamin E is involved with prevention of peroxidation of lipids as well as maintenance of functions of cell walls and biological membranes. It is known that a lack of vitamin E leads to reduced neurological functions, myasthenia, infertility, etc.
Vitamin E contained in foods is mainly 4 types of tocopherols, namely, α-, β-, γ- and δ-tocopherols. In the 5th Composition Tables the item name was changed from the conventional “Vitamin E Potency” to “Vitamin E”, and the values were listed as α-tocopherol equivalents (mg). From the 5th Enlarged Composition Tables, the component values of α-, β-, γ- and δ-tocopherols are listed as vitamin E.15)
20
[4] Vitamin K
Vitamin K includes vitamin K1 (phylloquinone) and vitamin K2 (menaquinones), and both vitamin K1 and K2 exhibit almost identical physiological action to humans. Vitamin K is involved with promotion of blood coagulation, formation of bone, etc. It is known that a lack of vitamin K leads to intracranial hemorrhage in newborns, etc. The contents of vitamin K are generally shown as the sum of vitamin K1 and vitamin K2 (menaquinone-4). However, because “Itohiki-natto” (fermented whole soybean) (item number 04046), “Hikiwari-natto” (fermented dehulled and split soybean) (04047), “Goto-natto” (natto fermented with rice-koji and salt) (04048), “Tera-natto” (koji-molded, salted, steamed soybeans) (04049), “Kinzanji-miso” (fermented roasted soybeans, barley or wheat, vegetable and salt with koji mold) (04061) and “Hishio-miso” (fermented soybeans, barley or wheat, and vegetable with koji mold) (04062) contain a large amount of menaquinone-7, the weight of menaquinone-7 is converted to menaquinone-4 by multiplying with 444.7/649.0 and added to the content of vitamin K.
[5] Vitamin B1 (thiamin) Vitamin B1 (thiamin) is essential for the metabolism of sugars and branched chain amino acids as coenzyme of various enzymes. It is known that a lack of vitamin B1 leads to malaise, anorexia, beriberi associated with swelling etc., Wernicke’s encephalopathy, Korsakoff’s syndrome, etc. The component values are shown as thiamin hydrochloride equivalents.
[6] Vitamin B2 (riboflavin) Vitamin B2 (riboflavin) is involved with the metabolism of almost all nutrients as a constituent of coenzymes of flavin enzymes. It is known that a lack of vitamin B2 leads to stomatitis, ophthalmitis, seborrheic dermatitis, growth disorders, etc.
[7] Niacin Niacin is a general term for nicotinic acid, nicotinic-acid amide, etc. that have the same action inside the body. Niacin is important as a constituent of coenzyme of oxidoreductases, and exits the body in large quantities. It is known that a lack of niacin leads to dermatitis, diarrhea, pellagra associated with psychoneurotic disorders, growth disorders, etc. The component values of niacin are shown as nicotinic acid equivalents. In addition to intake from foods, niacin is partially synthesized from tryptophan in the body, where the action of tryptophan is reported to be 1/60 of that of niacin.
[8] Vitamin B6
Vitamin B6 is a general term for more than 10 kinds of compounds with similar action, including pyridoxine, pyridoxal, and pyridoxamine. Vitamin B6 is involved with the metabolism of amino acids and lipids, generation of neurotransmitters, etc. as coenzyme of aminotransferases, decarboxylases, etc. It is known that a lack of vitamin B6 leads to dermatitis, atherosclerotic vascular disorders, anorexia, etc. The component values of vitamin B6 are shown as pyridoxine equivalents.
[9] Vitamin B12
Vitamin B12 is a general term for compounds with similar action, including cyanocobalamin, methylcobalamin, adenosylcobalamin, and hydroxocobalamin. Their physiological action is important as a coenzyme of enzymes involved with the metabolism of amino acids, odd-numbered fatty acids, nucleic acids, etc., and they are involved with normalization of neurological functions and synthesis of hemoglobin. It is known that a lack of vitamin B12 leads to pernicious anemia, neurological disorders, etc. The component values of vitamin B12 are shown as cyanocobalamin equivalents.
21
[10] Folate
Folate is involved with the biosynthesis of purine nucleotides and the metabolism of pyridine nucleotides as a coenzyme. Folate is also involved with the generation of methionine, serine-glycine interconversion system, etc. along with vitamin B12 in the metabolism of amino acids and proteins. Folate is an important nutrient especially for embryos and fetus with active cell differentiation. It is known that a lack of folate leads to megaloblastic anemia, glossitis, neuropsychiatric abnormalities including spina bifida, etc.
[11] Pantothenic acid Pantothenic acid is a constituent of coenzyme A and acyl carrier proteins, and is widely involved with enzyme reactions in the metabolism of sugars and fatty acids. It is known that a lack of pantothenic acid leads to dermatitis, adrenal disorders, peripheral neuropathy, failure in antibody production, growth disorders, etc.
[12] Biotin Biotin is involved with carbon-fixation reactions and carbon metastasis as a coenzyme of carboxylases. Biotin deficiency is observed when a large amount of raw egg white is consumed over a long period of time, leading to skin disorders including hair loss and rashes, glossitis, conjunctivitis, anorexia, hypotonia, etc.
[13] Vitamin C (ascorbic acid) Vitamin C is involved with the metabolism, especially redox reactions, of various substances in the body. Vitamin C also has the function to generate and retain collagen. Additionally, vitamin C is closely involved with the generation of catecholamine and lipid metabolism related to the tyrosine metabolism. It is known that a lack of vitamin C leads to scurvy, etc. Vitamin C exists in foods in forms of L-ascorbic acid (reduced form) and L-dehydroascorbic acid (oxidized form). The efficiencies of these substances are considered to be identical based on the opinion of the Vitamin C Research Committee of the Vitamin Society of Japan to the inquiry from the Resources Council, the Science and Technology Agency (February 1976), and the component values of vitamin C are shown as a sum of L-ascorbic acid and L-dehydroascorbic acid.
22
Table 11 Measurement methods for vitamins Component Sample preparation method Measurement method
Retinol Saponify, then extract, separate unsaponified portion and refine
UV absorption detection – high performance liquid chromatography (HPLC) using ODS column and water-methanol mixture
α-Carotene, β-Carotene, β-Cryptoxanthin
Extract with hexane-acetone-ethanol- toluene mixture, saponify, then extract
Visible absorption detection – HPLC using ODS column and acetonitrile-methanol-tetrahydrofuran-acetic acid mixture
Thiamin (vitamin B1)
Heating extraction with acidic aqueous solution
Fluorescence detection – HPLC by separation using ODS column and methanol-0.01 mol/L sodium dihydrogen phosphate-0.15 mol/L sodium perchlorate mixture and reaction with potassium ferricyanide in post column
Riboflavin (vitamin B2)
Heating extraction with acidic aqueous solution
Fluorescence detection – HPLC using ODS column and methanol-acetic acid buffer solution
Ascorbic acid (vitamin C)
Homogenize with metaphosphate solution, extract, oxidize, and prepare osazone
Visible absorption detection – HPLC using normal phase column and acetic acid-n-hexane-ethyl acetate mixture
Calciferol (vitamin D)
Saponify, then extract and separate unsaponified portion
HPLC using normal phase column and 2-propanol-n-hexane mixture and then UV absorption detection – HPLC using reverse phase column and acetonitrile-water mixture
Tocopherol (vitamin E)
Saponify, then extract and separate unsaponified portion
Fluorescence detection – HPLC using normal phase column and acetic acid-2-propanol-n-haxane mixture
Phylloquinones Menaquinones (vitamin K)
Extract with acetone or hexane, then refine
Fluorescence detection – HPLC using reduction column- ODS column and methanol or ethanol-methanol mixture
Niacin Heating extraction with acidic aqueous solution under pressure
Microbiological assay using Lactobacillus plantarum ATCC8014
Vitamin B6 Heating extraction with acidic aqueous solution under pressure
Microbiological assay using Saccharomyces cerevisiae ATCC9080
Vitamin B12 Heating extraction with buffer solution and potassium cyanide solution
Microbiological assay using Lactobacillus delbrueckii subsp.lactis ATCC7830
Folate Heating extraction with buffer solution under pressure, protease treatment, then conjugase treatment
Microbiological assay using Lactobacillus rhamnosus ATCC7469
Pantothenic acid
Heating extraction with buffer solution under pressure, then alkaline phosphatase and pigeon liver amidase treatment
Microbiological assay using Lactobacillus plantarum ATCC8014
Biotin Heating extraction with acidic aqueous solution under pressure
Microbiological assay using Lactobacillus plantarum ATCC8014
(10) Salt equivalents
Salt equivalents are shown as the amount of sodium multiplied by 2.54 (Note). The amount of sodium includes those that originate not only from salt (sodium chloride) but also from sodium glutamate, sodium ascorbate, sodium phosphate, sodium hydrogen carbonate, and other sodium salts. Note: The number 2.54 applied to the amount of sodium is calculated from the atomic weight of
sodium (Na, 22.989770) and that of chlorine (Cl, 35.453) that constitute salt (NaCl).
Formula weight of NaCl/Atomic weight of Na = (22.989770 + 35.453)/22.989770 = 2.54…
(11) Alcohol
The amounts of ethyl alcohol contained in Beverages and Seasonings are included.
23
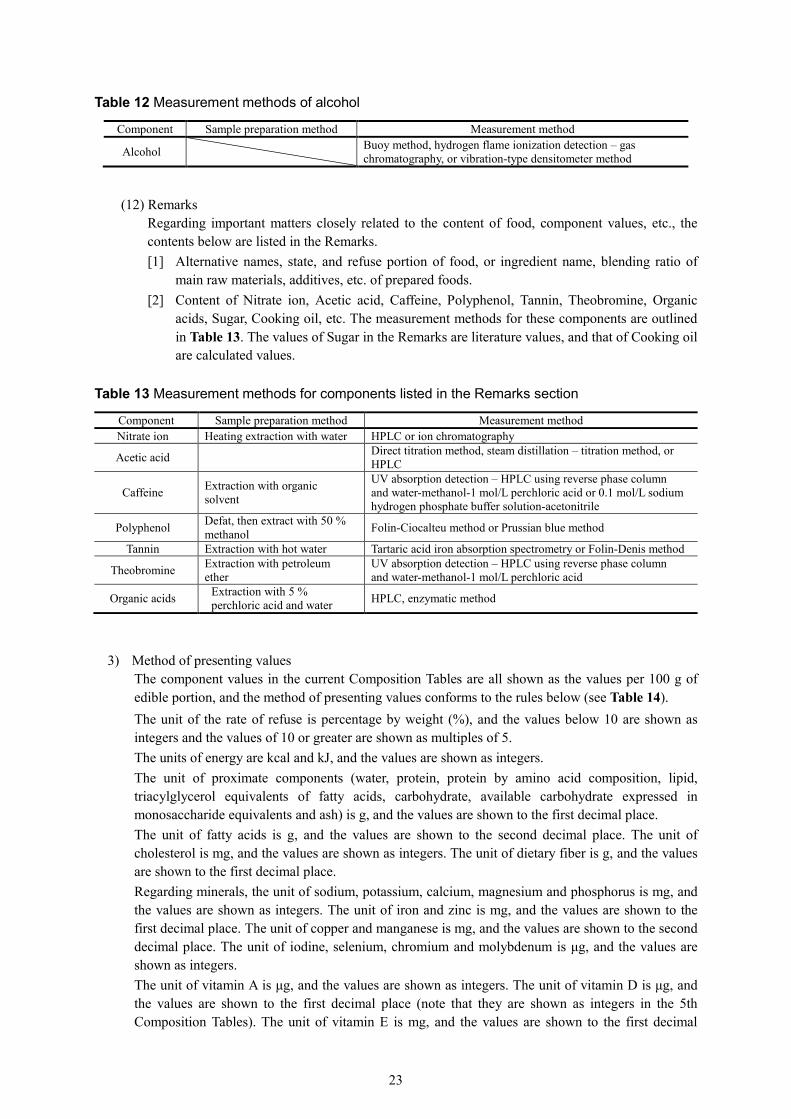
Table 12 Measurement methods of alcohol
Component Sample preparation method Measurement method
Alcohol Buoy method, hydrogen flame ionization detection – gas chromatography, or vibration-type densitometer method
(12) Remarks Regarding important matters closely related to the content of food, component values, etc., the contents below are listed in the Remarks. [1] Alternative names, state, and refuse portion of food, or ingredient name, blending ratio of
main raw materials, additives, etc. of prepared foods. [2] Content of Nitrate ion, Acetic acid, Caffeine, Polyphenol, Tannin, Theobromine, Organic
acids, Sugar, Cooking oil, etc. The measurement methods for these components are outlined in Table 13. The values of Sugar in the Remarks are literature values, and that of Cooking oil are calculated values.
Table 13 Measurement methods for components listed in the Remarks section
Component Sample preparation method Measurement method Nitrate ion Heating extraction with water HPLC or ion chromatography
Acetic acid Direct titration method, steam distillation – titration method, or HPLC
Caffeine Extraction with organic solvent
UV absorption detection – HPLC using reverse phase column and water-methanol-1 mol/L perchloric acid or 0.1 mol/L sodium hydrogen phosphate buffer solution-acetonitrile
Polyphenol Defat, then extract with 50 % methanol Folin-Ciocalteu method or Prussian blue method
Tannin Extraction with hot water Tartaric acid iron absorption spectrometry or Folin-Denis method
Theobromine Extraction with petroleum ether
UV absorption detection – HPLC using reverse phase column and water-methanol-1 mol/L perchloric acid
Organic acids Extraction with 5 % perchloric acid and water HPLC, enzymatic method
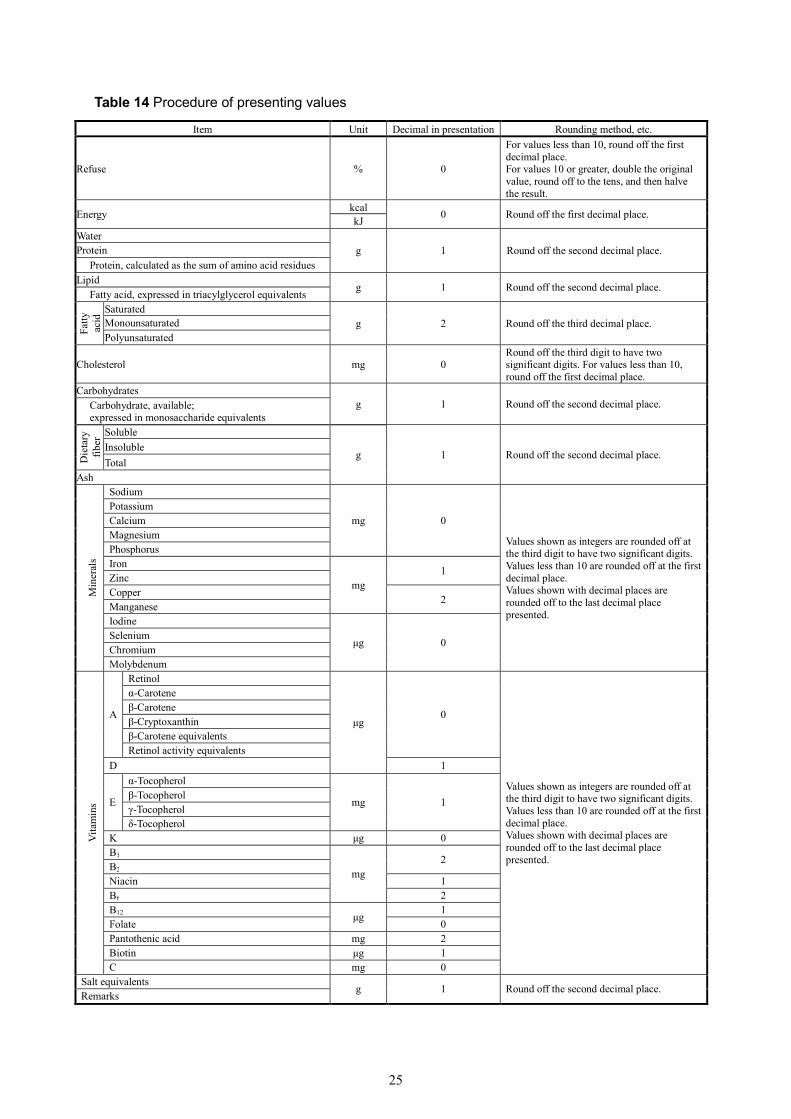
3) Method of presenting values The component values in the current Composition Tables are all shown as the values per 100 g of edible portion, and the method of presenting values conforms to the rules below (see Table 14). The unit of the rate of refuse is percentage by weight (%), and the values below 10 are shown as integers and the values of 10 or greater are shown as multiples of 5. The units of energy are kcal and kJ, and the values are shown as integers. The unit of proximate components (water, protein, protein by amino acid composition, lipid, triacylglycerol equivalents of fatty acids, carbohydrate, available carbohydrate expressed in monosaccharide equivalents and ash) is g, and the values are shown to the first decimal place. The unit of fatty acids is g, and the values are shown to the second decimal place. The unit of cholesterol is mg, and the values are shown as integers. The unit of dietary fiber is g, and the values are shown to the first decimal place. Regarding minerals, the unit of sodium, potassium, calcium, magnesium and phosphorus is mg, and the values are shown as integers. The unit of iron and zinc is mg, and the values are shown to the first decimal place. The unit of copper and manganese is mg, and the values are shown to the second decimal place. The unit of iodine, selenium, chromium and molybdenum is μg, and the values are shown as integers. The unit of vitamin A is μg, and the values are shown as integers. The unit of vitamin D is μg, and the values are shown to the first decimal place (note that they are shown as integers in the 5th Composition Tables). The unit of vitamin E is mg, and the values are shown to the first decimal
24
place. The unit of vitamin K is μg, and values are shown as integers. The unit of vitamin B1, vitamin B2, vitamin B6 and pantothenic acid is mg, and the values are shown to the second decimal place. The unit of niacin is mg, and the values are shown to the first decimal place. The unit of vitamin C is mg, and the values are shown as integers. The unit of vitamin B12 and biotin is μg, and values are shown to the first decimal place. The unit of folate is μg, and the values are shown as integers. The unit of salt equivalents is g, and the values are shown to the first decimal place. The unit of components listed in the Remarks is g in principle, and the values are shown to the first decimal place. Values shown with decimal places are rounded off to the last decimal place presented. Values shown as integers (except energy) are in principle rounded off at the third digit from the left to have two significant digits. For each component, “–” indicates unmeasured, “0” indicates the value being less than 1/10 of the minimum listing value in the Food Composition Tables (3/10 for iodine, selenium, chromium and molybdenum and 4/10 for biotin; the same applies hereinafter) or not detected, and “Tr (trace)” indicates the value contained is 1/10 or greater of the minimum value listed yet less than 5/10. Note that “0” for Salt equivalents indicates the calculated value was less than 5/10 of the minimum listing value (0.1 g). For components considered not contained according to references etc., it is often the case that measurements are not carried out. However, there are strong requests to show certain values for such components, and “(0)” is shown as an estimated value. Similarly, “(Tr)” is used for those estimated to be contained in a trace amount. Regarding “Protein, calculated as the sum of amino acid residues”, “Fatty acid, triacylglycerol equivalents” and “Carbohydrate, available; expressed in monosaccharide equivalents”, “–” is used for foods not listed in the Amino Acids Composition Tables 2015, Fatty Acids Composition Tables 2015 or the Carbohydrates Composition Tables 2015. Composition values estimated based on values listed in the food composition tables of foreign countries, raw material blending ratio recipe, etc. are indicated by placing them in parentheses. For some of Cereals, Fruits and Mushrooms, composition values derived from estimation or calculation using the listed values of similar foods are indicated by placing them in parentheses.
25
Table 14 Procedure of presenting values
Item Unit Decimal in presentation Rounding method, etc.
Refuse % 0
For values less than 10, round off the first decimal place. For values 10 or greater, double the original value, round off to the tens, and then halve the result.
Energy kcal 0 Round off the first decimal place. kJ Water
g 1 Round off the second decimal place. Protein Protein, calculated as the sum of amino acid residues
Lipid g 1 Round off the second decimal place.
Fatty acid, expressed in triacylglycerol equivalents
Fatty
ac
id Saturated
g 2 Round off the third decimal place. Monounsaturated Polyunsaturated
Cholesterol mg 0 Round off the third digit to have two significant digits. For values less than 10, round off the first decimal place.
Carbohydrates g 1 Round off the second decimal place. Carbohydrate, available;
expressed in monosaccharide equivalents
Die
tary
fib
er Soluble
g 1 Round off the second decimal place. Insoluble Total
Ash
Min
eral
s
Sodium
mg 0
Values shown as integers are rounded off at the third digit to have two significant digits. Values less than 10 are rounded off at the first decimal place. Values shown with decimal places are rounded off to the last decimal place presented.
Potassium
Calcium
Magnesium
Phosphorus Iron
mg 1 Zinc
Copper 2 Manganese Iodine
μg 0 Selenium
Chromium
Molybdenum
Vita
min
s
A
Retinol
μg 0
Values shown as integers are rounded off at the third digit to have two significant digits. Values less than 10 are rounded off at the first decimal place. Values shown with decimal places are rounded off to the last decimal place presented.
α-Carotene β-Carotene β-Cryptoxanthin β-Carotene equivalents Retinol activity equivalents
D 1
E
α-Tocopherol
mg 1 β-Tocopherol γ-Tocopherol δ-Tocopherol
K μg 0 B1
mg 2 B2
Niacin 1 B6 2 B12 μg 1 Folate 0 Pantothenic acid mg 2 Biotin μg 1 C mg 0
Salt equivalents g 1 Round off the second decimal place. Remarks
26
4) “Mass” and “Weight” In the International System of Units (SI), the basic quantity with the symbol “g” to express the unit is mass. Meanwhile, weight represents a quantity with a similar character as force, and stands for a product of mass and the acceleration of gravity. In various fields, replacement of “weight” by “mass” is promoted for cases where “weight” is used to mean the mass. Correction of “weight” to “mass” for the Food Composition Tables was discussed at working groups of the Expert Committee on Food Components, and the conclusion was that it is an issue requiring further consideration since it is a change to a term which users are not familiar with. Therefore, although “weight” in the current Composition Tables should be corrected to “mass” in many cases, “weight” is used as has been in the past.
5) Cooking conditions of food
For the cooking conditions of food, basic cooking conditions were determined assuming general cooking (small-scale cooking). The cooking conditions of each food are outlined in Table 16, Chapter 3. Cookware used was glass etc., and consideration is given on avoidance of effect of minerals to the food. Cooking methods listed in the current Composition Tables are boiled, steamed, baked, sautéed, and deep-fried, as well as those newly added in this revision, namely, oil-roasted and floured and deep fried for Fish, mollusks and crustaceans, “Tonkatsu” (breaded and fried pork) and floured and deep-fried for Meat, tempura for Sweet potato, Eggplant and Fish, mollusks and crustaceans, microwaved sweet corn and glazed carrot. Unheated preparation methods listed are bleached in water, soaked in water, salted pickles, and “Nukamiso-zuke” (pickled in salty rice bran paste). Normally, preparation of food accompanies the addition of condiments, yet condiments are not added except for boiled Macaroni and spaghetti, glazed carrot, salted pickles and “Nukamiso-zuke” (pickled in salty rice bran paste) since it was difficult to determine the type and amount of condiments to be used. Boiling is carried out as preparation of cooking, and the broth is discarded. Traditionally, vegetables are processed after boiling in Japanese cuisine. The “boiled” in the current Composition Tables includes such preparations. The boiling and preparation process for each vegetable are outlined in Table 16 Outline of Cooking Method. For instance, immature bean vegetables and fruit vegetables are drained after boiling, and stem and leaf vegetables are cooled down with water and manually squeezed after boiling. Salted pickles and “Nukamiso-zuke” (pickled in salty rice bran paste) listed are foods after washing with water, and stem and leaf vegetables are further squeezed manually. Like these examples, for food whose preparation process is not readily imaginable from the cooking name, the cooking process was described in the Remarks in addition to Table 16 Outline of Cooking Method. When food is cooked, bleaching in water or heating results in elution of components to water or alteration of the components, and the weight of food changes because of adsorption of water or oil used in the cooking. The weight change rate of food by cooking in the current Composition Tables is shown in Table 15 of Chapter 1. The component values of prepared foods in the current Composition Tables are calculated in principle by deriving the component alteration rate by cooking and multiplying the rate by the component values prior to cooking, taking into account the consistency with the component values of food prior to cooking.
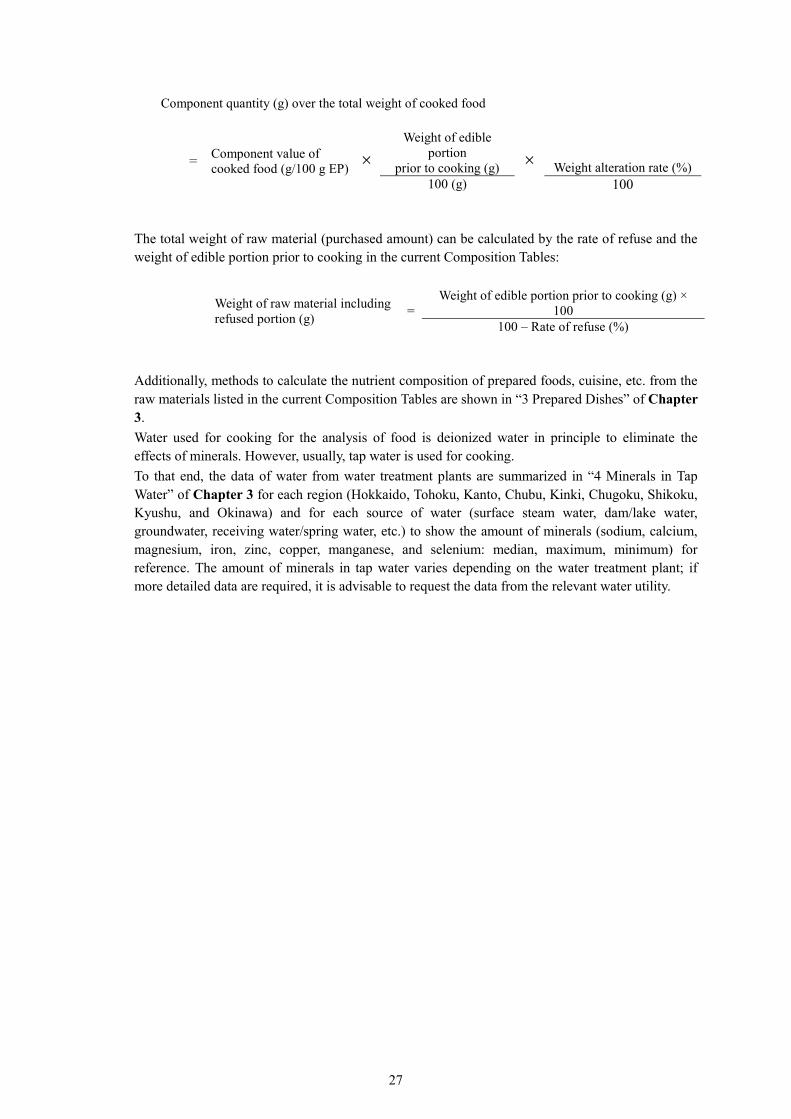
On calculation of nutrients, the component quantity over the total weight of cooked food can be calculated using the equation below by using the component values of cooked food (per 100 g of edible portion) in the current Composition Tables and the weight of edible portion of the food prior to cooking:
27
Component quantity (g) over the total weight of cooked food
= Component value of cooked food (g/100 g EP)
Weight of edible portion
prior to cooking (g) Weight alteration rate (%) 100 (g) 100
The total weight of raw material (purchased amount) can be calculated by the rate of refuse and the weight of edible portion prior to cooking in the current Composition Tables:
Weight of raw material including refused portion (g) =
Weight of edible portion prior to cooking (g) × 100
100 – Rate of refuse (%)
Additionally, methods to calculate the nutrient composition of prepared foods, cuisine, etc. from the raw materials listed in the current Composition Tables are shown in “3 Prepared Dishes” of Chapter 3. Water used for cooking for the analysis of food is deionized water in principle to eliminate the effects of minerals. However, usually, tap water is used for cooking. To that end, the data of water from water treatment plants are summarized in “4 Minerals in Tap Water” of Chapter 3 for each region (Hokkaido, Tohoku, Kanto, Chubu, Kinki, Chugoku, Shikoku, Kyushu, and Okinawa) and for each source of water (surface steam water, dam/lake water, groundwater, receiving water/spring water, etc.) to show the amount of minerals (sodium, calcium, magnesium, iron, zinc, copper, manganese, and selenium: median, maximum, minimum) for reference. The amount of minerals in tap water varies depending on the water treatment plant; if more detailed data are required, it is advisable to request the data from the relevant water utility.
28
References 1) Food and Agricultural Organization of the United Nations: Food energy - methods of analysis and
conversion factors. Report of a technical workshop. FAO Food and Nutrition Paper 77, p. 3-6 (2003)
2) Resources Council, Science and Technology Agency: Investigation for Revision of the Standard Tables of Food Composition in Japan - Survey Results on Measurement of Energy Used in Soybeans and Soybean Products in Japan -. Material Edited by Resources Council, Science and Technology Agency No.70 (1979)
3) Resources Council, Science and Technology Agency: Investigation for Revision of the Standard Tables of Food Composition in Japan - Survey Results on Measurement of Energy Used in Animal Foods in Japan -. Material Edited by Resources Council, Science and Technology Agency No.73 (1980)
4) Resources Council, Science and Technology Agency: Investigation for Revision of the Standard Tables of Food Composition in Japan - Survey Results on Measurement of Energy Used in Cereals in Japan -. Material Edited by Resources Council, Science and Technology Agency No.92 (1981)
5) Resources Council, Science and Technology Agency: Investigation for Revision of the Standard Tables of Food Composition in Japan - Survey Results on Measurement of Energy Used in Fats and Oils in Japan -. Material Edited by Resources Council, Science and Technology Agency No.99 (1982)
6) FAO/WHO: Energy and protein requirements. Report of a Joint FAO/WHO Ad Hoc Expert Committee. WHO Technical Report Series, No. 522; FAO Nutrition Meetings Report Series. No. 52 (1973)
7) W.O. Atwater: Principles of nutrition and nutritive value of foods. United States Department of Agriculture. Farmers' Bulletin. No. 142, p. 48 (1910)
8) Merrill, A.L. and Watt, B.K.: Energy value of foods-basis and derivation-. Agricultural Research Service United States Department of Agriculture. Agriculture Handbook. No. 74 (1955)
9) Resources Council, Science and Technology Agency: Investigation for Revision of the Standard Tables of Food Composition in Japan - Survey Results on Measurement of Energy Used in Algae and Mushrooms in Japan -. Material Edited by Resources Council, Science and Technology Agency No.82 (1980)
10) FAO: Amino acid content of foods and biological data on proteins. Nutritional Studies. No. 24 (1970)
11) Medical Term Management Committee, Japanese Association of Medical Sciences: Dictionary of Medical Terms, Japanese Association of Medical Sciences English-Japanese. 3rd Edition, P. 692, P. 847 (2007)
12) Tadashi Noguchi (author and editor): Eiyo Seikagaku Jiten Fukyu Ban [Dictionary of Nutrition and Biochemistry, Popular Edition]. P. 564, P. 596-597 (2011)
13) Kazutomo Imahori, Tamio Yamakawa (eds.): Seikagaku Jiten [Dictionary of Biochemistry] (4th Edition). P. 812 (2007)
14) National Academy of Sciences, Institute of Medicine. Dietary reference intakes: Vitamin A, vitamin K, arsenic, boron, chromium, copper, iodine, iron, manganese, molybdenum, nickel, silicon, vanadium, and zinc. National Academy Press (2001)
15) National Academy of Sciences, Institute of Medicine. Dietary reference intakes: Vitamin C, vitamin E, selenium, and carotenoids. National Academy Press (2000)