chapter 1 exam a - testbanklive.com · chapter 1 exam a name_____ short answer. write the word or...
TRANSCRIPT
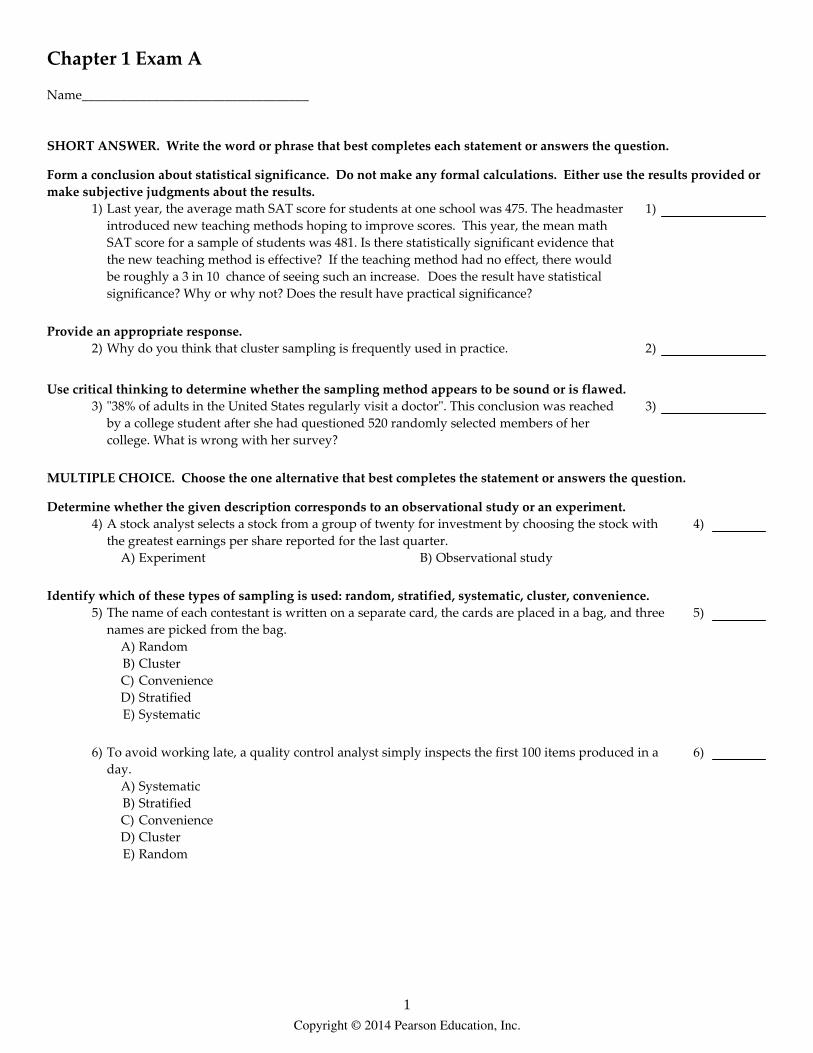
Chapter 1 Exam A
Name___________________________________
SHORT ANSWER. Write the word or phrase that best completes each statement or answers the question.
Form a conclusion about statistical significance. Do not make any formal calculations. Either use the results provided ormake subjective judgments about the results.
1) Last year, the average math SAT score for students at one school was 475. The headmasterintroduced new teaching methods hoping to improve scores. This year, the mean mathSAT score for a sample of students was 481. Is there statistically significant evidence thatthe new teaching method is effective? If the teaching method had no effect, there wouldbe roughly a 3 in 10 chance of seeing such an increase. Does the result have statisticalsignificance? Why or why not? Does the result have practical significance?
1)
Provide an appropriate response.2) Why do you think that cluster sampling is frequently used in practice. 2)
Use critical thinking to determine whether the sampling method appears to be sound or is flawed.3) "38% of adults in the United States regularly visit a doctor". This conclusion was reached
by a college student after she had questioned 520 randomly selected members of hercollege. What is wrong with her survey?
3)
MULTIPLE CHOICE. Choose the one alternative that best completes the statement or answers the question.
Determine whether the given description corresponds to an observational study or an experiment.4) A stock analyst selects a stock from a group of twenty for investment by choosing the stock with
the greatest earnings per share reported for the last quarter.A) Experiment B) Observational study
4)
Identify which of these types of sampling is used: random, stratified, systematic, cluster, convenience.5) The name of each contestant is written on a separate card, the cards are placed in a bag, and three
names are picked from the bag.A) RandomB) ClusterC) ConvenienceD) StratifiedE) Systematic
5)
6) To avoid working late, a quality control analyst simply inspects the first 100 items produced in aday.
A) SystematicB) StratifiedC) ConvenienceD) ClusterE) Random
6)
Copyright © 2014 Pearson Education, Inc.
1
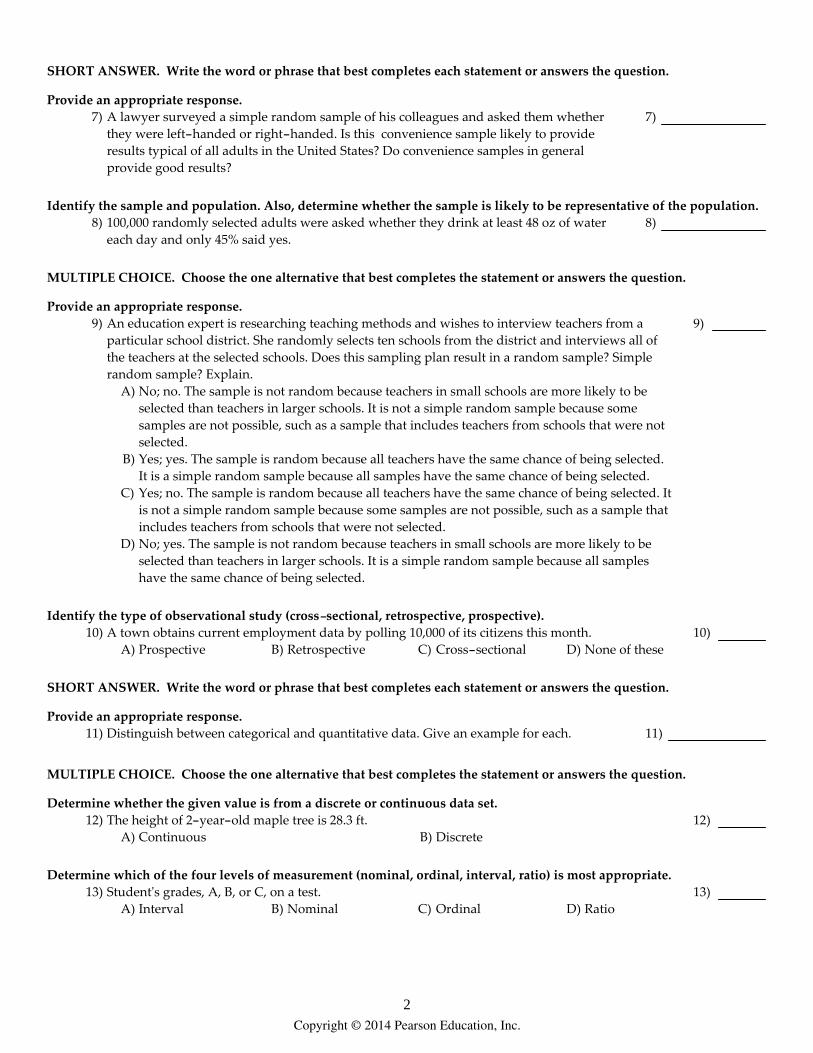
SHORT ANSWER. Write the word or phrase that best completes each statement or answers the question.
Provide an appropriate response.7) A lawyer surveyed a simple random sample of his colleagues and asked them whether
they were left-handed or right-handed. Is this convenience sample likely to provideresults typical of all adults in the United States? Do convenience samples in generalprovide good results?
7)
Identify the sample and population. Also, determine whether the sample is likely to be representative of the population.8) 100,000 randomly selected adults were asked whether they drink at least 48 oz of water
each day and only 45% said yes.8)
MULTIPLE CHOICE. Choose the one alternative that best completes the statement or answers the question.
Provide an appropriate response.9) An education expert is researching teaching methods and wishes to interview teachers from a
particular school district. She randomly selects ten schools from the district and interviews all ofthe teachers at the selected schools. Does this sampling plan result in a random sample? Simplerandom sample? Explain.
A) No; no. The sample is not random because teachers in small schools are more likely to beselected than teachers in larger schools. It is not a simple random sample because somesamples are not possible, such as a sample that includes teachers from schools that were notselected.
B) Yes; yes. The sample is random because all teachers have the same chance of being selected.It is a simple random sample because all samples have the same chance of being selected.
C) Yes; no. The sample is random because all teachers have the same chance of being selected. Itis not a simple random sample because some samples are not possible, such as a sample thatincludes teachers from schools that were not selected.
D) No; yes. The sample is not random because teachers in small schools are more likely to beselected than teachers in larger schools. It is a simple random sample because all sampleshave the same chance of being selected.
9)
Identify the type of observational study (cross-sectional, retrospective, prospective).10) A town obtains current employment data by polling 10,000 of its citizens this month.
A) Prospective B) Retrospective C) Cross-sectional D) None of these10)
SHORT ANSWER. Write the word or phrase that best completes each statement or answers the question.
Provide an appropriate response.11) Distinguish between categorical and quantitative data. Give an example for each. 11)
MULTIPLE CHOICE. Choose the one alternative that best completes the statement or answers the question.
Determine whether the given value is from a discrete or continuous data set.12) The height of 2-year-old maple tree is 28.3 ft.
A) Continuous B) Discrete12)
Determine which of the four levels of measurement (nominal, ordinal, interval, ratio) is most appropriate.13) Student's grades, A, B, or C, on a test.
A) Interval B) Nominal C) Ordinal D) Ratio13)
Copyright © 2014 Pearson Education, Inc.
2

SHORT ANSWER. Write the word or phrase that best completes each statement or answers the question.
Provide an appropriate response.14) Use the data in the table to answer the question. The x-values are amounts of saturated fat
(in grams) in various regular two-ounce muffins. The y-values are amounts of saturatedfat (in grams) in various "low fat" two-ounce muffins.
Amounts of Saturated Fat in Regular and Low-Fat Muffins x 3.7 4.9 4.3 6.4 4.2 4.5 y 1.2 2.1 2.2 1.9 1.4 2.4
Is each x-value matched with a corresponding y-value? That is, is each x-value associatedwith the corresponding y-value in some meaningful way? If the x- and y-values are notmatched, does it make sense to use the difference between each x-value and the y-valuethat is in the same column?
14)
15) Explain the difference between stratified and cluster sampling. 15)
MULTIPLE CHOICE. Choose the one alternative that best completes the statement or answers the question.
Identify which of these types of sampling is used: random, stratified, systematic, cluster, convenience.16) A tax auditor selects every 1000th income tax return that is received.
A) StratifiedB) SystematicC) RandomD) ClusterE) Convenience
16)
SHORT ANSWER. Write the word or phrase that best completes each statement or answers the question.
Use critical thinking to develop an alternative conclusion.17) A study shows that adults who work at their desk all day weigh more than those who do
not. Conclusion: Desk jobs cause people to gain weight.17)
Provide an appropriate response.18) Would an observational study or an experiment be more appropriate to investigate the
effects on humans of a substance known to be toxic? Explain.18)
MULTIPLE CHOICE. Choose the one alternative that best completes the statement or answers the question.
Determine whether the given value is a statistic or a parameter.19) After inspecting all of 55,000 kg of meat stored at the Wurst Sausage Company, it was found that
45,000 kg of the meat was spoiled.A) Statistic B) Parameter
19)
SHORT ANSWER. Write the word or phrase that best completes each statement or answers the question.
Provide an appropriate response.20) Explain what is meant by the term "confounding" and give an example of an experiment
in which confounding is likely to be a problem.20)
Copyright © 2014 Pearson Education, Inc.
3

MULTIPLE CHOICE. Choose the one alternative that best completes the statement or answers the question.
Determine whether the given value is from a discrete or continuous data set.21) The temperature of a cup of coffee is 67.3°F.
A) Continuous B) Discrete21)
Solve the problem.22) On a test, 74% of the questions are answered correctly. If 111 questions are correct, how many
questions are on the test?A) 37 B) 67 C) 150 D) 74
22)
Identify the type of observational study (cross-sectional, retrospective, prospective).23) Researchers collect data by interviewing athletes who have won olympic gold medals from 1992 to
2008.A) Retrospective B) Cross-sectionalC) Prospective D) None of these
23)
SHORT ANSWER. Write the word or phrase that best completes each statement or answers the question.
Form a conclusion about statistical significance. Do not make any formal calculations. Either use the results provided ormake subjective judgments about the results.
24) Charlie's teacher claims that he does not study and just guesses on exams. On an examwith 201 true-false questions, Charlie answered 53.7% of the questions correctly.Calculations using these results show that if he were really just guessing, there would beroughly 1 chance in 7 that he would do this well. Is there statistically significant evidenceagainst the teacher's claim that Charlie is just guessing? Why or why not?
24)
MULTIPLE CHOICE. Choose the one alternative that best completes the statement or answers the question.
Provide an appropriate response.25) A psychology student wishes to investigate differences in political opinions between business
majors and political science majors at her college. She randomly selects 100 students from the 260business majors and 100 students from the 180 political science majors. Does this sampling planresult in a random sample? Simple random sample? Explain.
A) Yes; yes. The sample is random because all students have the same chance of being selected.It is a simple random sample because all samples of size 200 have the same chance of beingselected.
B) No; yes. The sample is not random because political science majors have a greater chance ofbeing selected than business majors. It is a simple random sample because all samples of size200 have the same chance of being selected.
C) No; no. The sample is not random because political science majors have a greater chance ofbeing selected than business majors. It is not a simple random sample because some samplesare not possible, such as a sample consisting of 50 business majors and 150 political sciencemajors.
D) Yes; no. The sample is random because all students have the same chance of being selected. Itis not a simple random sample because some samples are not possible, such as a sampleconsisting of 50 business majors and 150 political science majors.
25)
Copyright © 2014 Pearson Education, Inc.
4

Answer KeyTestname: CHAPTER 1 EXAM A
1) No. The new mean SAT score is not substantially higher. Even if the new teaching method had no effect, a smallincrease such as this could easily be seen just by chance. No. The increase is not sufficient to be of practicalsignificance.
2) Answers will vary. Possible answer: Cluster sampling can save time and money and be more efficient, especiallywhen the clusters are geographically far apart from each other. For example, if a researcher wishes to interview asample of high school teachers in a school district, it will be easier to interview all the teachers at a few schools than tointerview a few teachers from many different schools.
3) The sample is biased. College students are not representative of the U.S. population as a whole.4) B5) A6) C7) Yes. There is nothing about left-handedness or right-handedness that would affect being one of the lawyer's
colleagues. In terms of left- or right-handedness, a simple random sample of the lawyer's colleagues is likely to berepresentative of all adults in the United States. Convenience samples in general do not tend to provide good resultsas the sample is often not representative of a broader population.
8) Sample: the 100,000 selected adults; population: all adults; representative9) C
10) C11) Qualitative data can be separated into categories that are distinguished by nonnumeric characteristics. Quantitative
data consist of numbers representing counts or measurements. Examples will vary.12) A13) C14) The x-values are not matched with the y-values, so it does not make sense to use the differences between each
x-value and the y-value that is in the same column.15) In both cluster sampling and stratified sampling, sub-groups (clusters or strata) are formed. However, in stratified
sampling, all strata are used and a sample is selected from each strata. In cluster sampling, a sample of the clusters isfirst selected, then all members of those clusters are selected.
16) B17) Desk job workers are confined to their chairs for most of their work day. Other jobs require standing or walking
around which burns calories. It is probably the lack of exercise that causes higher weights, not the desk job itself.Avoid causality altogether by saying lack of walking and exercise is associated with higher weights.
18) An observational study would be more appropriate. An experiment would not be appropriate because it would beunethical to administer as a treatment a substance known to be toxic. However a retrospective observational study,for example, could be carried out by examining records from the past and observing the effects where the substancehad been accidentally ingested.
19) B20) Confounding occurs in an experiment when the effects of two or more variables cannot be distinguished from each
other. Examples will vary. One example is that of a school district that conducts a study regarding whether thescience laboratory approach or the computer simulation approach is better for learning chemistry among seniors. Astandardized achievement test is used to measure learning, and the results of the two schools are compared. Unlesscontrolled in the study, two confounding variables are teaching expertise and student motivation.
21) A22) C23) A24) No; The exam result of 53.7% is not substantially greater than 50%. Even if Charlie were just guessing, he could easily
do this well just by chance.25) C
Copyright © 2014 Pearson Education, Inc.
5

Chapter 1 Exam B
Name___________________________________
SHORT ANSWER. Write the word or phrase that best completes each statement or answers the question.
Form a conclusion about statistical significance. Do not make any formal calculations. Either use the results provided ormake subjective judgments about the results.
1) A manufacturer of laptop computers claims that only 1% of their computers are defective.In a sample of 600 computers, it was found that 3% were defective. If the proportion ofdefectives were really only 1%, there would be less than 1 chance in 1000 of getting such alarge proportion of defective laptops in the sample. Is there statistically significantevidence against the manufacturer's claim? Why or why not?
1)
MULTIPLE CHOICE. Choose the one alternative that best completes the statement or answers the question.
Identify which of these types of sampling is used: random, stratified, systematic, cluster, convenience.2) A pollster uses a computer to generate 500 random numbers, then interviews the voters
corresponding to those numbers.A) ConvenienceB) SystematicC) ClusterD) RandomE) Stratified
2)
SHORT ANSWER. Write the word or phrase that best completes each statement or answers the question.
Provide an appropriate response.3) A hip hop radio show broadcast in the city of Puddelton asked people to call in and
express their opinions on the new mayor. Are the results likely to be representative of alladults in Puddelton? Of all listeners to the hip hop show? Why or why not?
3)
4) Use the data in the table to answer the question. The x-values are amounts of saturated fat(in grams) in various regular two-ounce muffins. The y-values are amounts of saturatedfat (in grams) in various "low fat" two-ounce muffins.
Amounts of Saturated Fat in Regular and Low-Fat Muffins x 4.5 3.5 3.7 5.2 4.9 3.9 y 1.2 2.1 2.2 1.8 1.6 2.2
Note that the table lists measured amounts of saturated fat in two different types ofmuffin. Given these data, what issue can be addressed by conducting a statistical analysisof the values?
4)
5) At a school there are two different math classes of the same age. The two classes havedifferent teachers. The school principal is interested in gauging the effectiveness of twodifferent teaching methods and asks each teacher to try one of the methods. At the end ofthe semester both classes are given the same test and the results are compared. In thisexperiment, what is the variable of interest? Give some examples of variables which couldbe confounding variables.
5)
Copyright © 2014 Pearson Education, Inc.
6

MULTIPLE CHOICE. Choose the one alternative that best completes the statement or answers the question.
Determine whether the given value is a statistic or a parameter.6) After taking the first exam, 15 of the students dropped the class.
A) Statistic B) Parameter6)
Determine which of the four levels of measurement (nominal, ordinal, interval, ratio) is most appropriate.7) Student's grades, A, B, or C, on a test.
A) Ratio B) Ordinal C) Nominal D) Interval7)
8) Nationalities of survey respondents.A) Ratio B) Nominal C) Interval D) Ordinal
8)
SHORT ANSWER. Write the word or phrase that best completes each statement or answers the question.
Provide an appropriate response.9) The table shows the weights (in pounds) and monthly incomes (in dollars) of nine
randomly selected women between the ages of 18 and 65. Assume that the x -values arethe weights and the y-values are the monthly incomes.
Weight (lb) 113 132 155 122 166 140 118 129 185Monthly Income (dollars) 1420 3650 5475 2310 4710 2910 1720 2460 4115
If we use statistical methods to conclude that there is a correlation (or relationship orassociation) between the weights of women and their monthly incomes, can we concludethat by increasing her weight a woman can increase her monthly income?
9)
MULTIPLE CHOICE. Choose the one alternative that best completes the statement or answers the question.
Identify which of these types of sampling is used: random, stratified, systematic, cluster, convenience.10) A tax auditor selects every 1000th income tax return that is received.
A) StratifiedB) ConvenienceC) RandomD) ClusterE) Systematic
10)
SHORT ANSWER. Write the word or phrase that best completes each statement or answers the question.
Provide an appropriate response.11) A lawyer surveyed a simple random sample of his colleagues and asked them whether
they were left-handed or right-handed. Is this convenience sample likely to provideresults typical of all adults in the United States? Do convenience samples in generalprovide good results?
11)
12) A teacher was interested in knowing how much tax people pay in the United States. Sheselected a simple random sample of her friends and asked them about their taxes. Is thissample likely to be representative of all adults in the United States?
12)
13) Would an observational study or an experiment be more appropriate to investigate theeffects on humans of a substance known to be toxic? Explain.
13)
Copyright © 2014 Pearson Education, Inc.
7

Form a conclusion about statistical significance. Do not make any formal calculations. Either use the results provided ormake subjective judgments about the results.
14) Charlie's teacher claims that he does not study and just guesses on exams. On an examwith 201 true-false questions, Charlie answered 53.7% of the questions correctly.Calculations using these results show that if he were really just guessing, there would beroughly 1 chance in 7 that he would do this well. Is there statistically significant evidenceagainst the teacher's claim that Charlie is just guessing? Why or why not?
14)
Provide an appropriate response.15) A coach uses a new technique in training middle distance runners. The times, in seconds,
for 8 different athletes to run 800 meters before and after this training are shown below.Athlete A B C D E F G HBefore 115.2 114 116.4 119.8 110.9 112.4 111.5 117.3
After 112.9 112.7 114 120.6 109.1 109.1 107.9 113.4Does the conclusion that the technique is effective appear to be supported with statisticalsignificance? Does the conclusion that the technique is effective appear to have practicalsignificance?
15)
16) Why do you think that cluster sampling is frequently used in practice. 16)
Form a conclusion about statistical significance. Do not make any formal calculations. Either use the results provided ormake subjective judgments about the results.
17) Last year, the average math SAT score for students at one school was 475. The headmasterintroduced new teaching methods hoping to improve scores. This year, the mean mathSAT score for a sample of students was 481. Is there statistically significant evidence thatthe new teaching method is effective? If the teaching method had no effect, there wouldbe roughly a 3 in 10 chance of seeing such an increase. Does the result have statisticalsignificance? Why or why not? Does the result have practical significance?
17)
MULTIPLE CHOICE. Choose the one alternative that best completes the statement or answers the question.
Determine whether the given description corresponds to an observational study or an experiment.18) A political pollster reports that his candidate has a 10% lead in the polls with 10% undecided.
A) Experiment B) Observational study18)
Identify the type of observational study (cross-sectional, retrospective, prospective).19) A town obtains current employment data by polling 10,000 of its citizens this month.
A) Cross-sectional B) Prospective C) Retrospective D) None of these19)
Determine whether the given description corresponds to an observational study or an experiment.20) A doctor performs several diagnostic tests to determine the reason for a patient's illness.
A) Observational study B) Experiment20)
SHORT ANSWER. Write the word or phrase that best completes each statement or answers the question.
Identify the sample and population. Also, determine whether the sample is likely to be representative of the population.21) An employee at the local ice cream parlor asks three customers if they like chocolate ice
cream.21)
Copyright © 2014 Pearson Education, Inc.
8
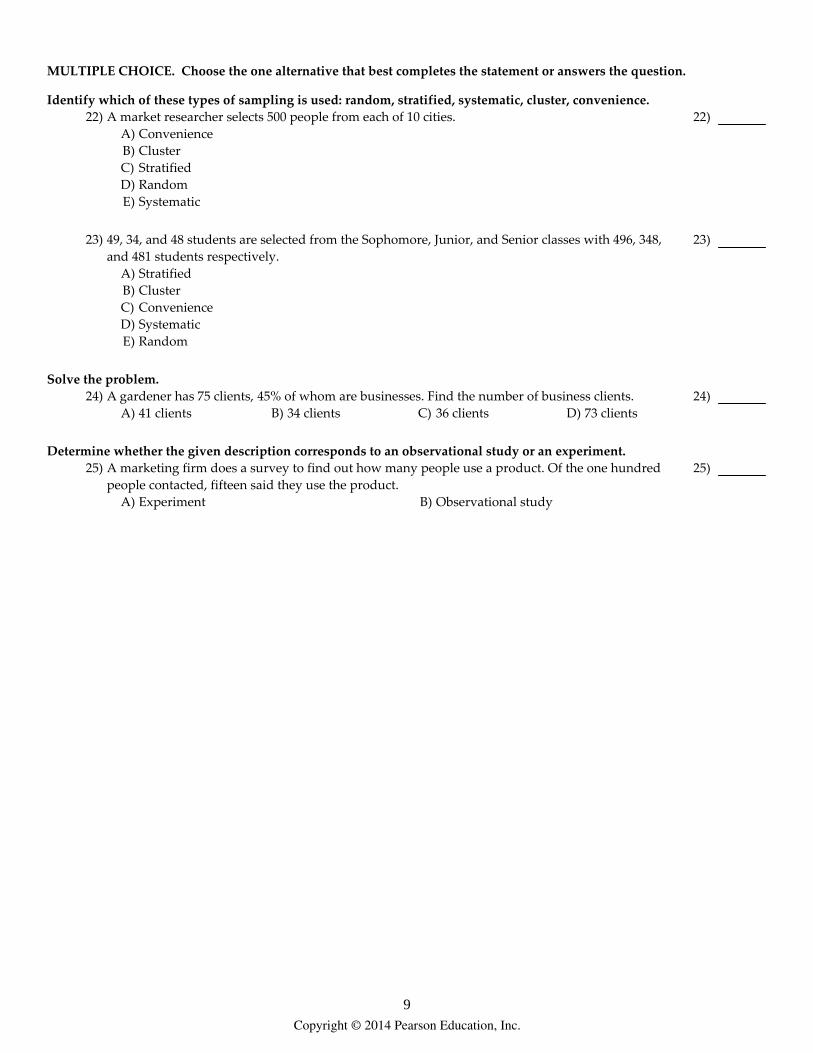
MULTIPLE CHOICE. Choose the one alternative that best completes the statement or answers the question.
Identify which of these types of sampling is used: random, stratified, systematic, cluster, convenience.22) A market researcher selects 500 people from each of 10 cities.
A) ConvenienceB) ClusterC) StratifiedD) RandomE) Systematic
22)
23) 49, 34, and 48 students are selected from the Sophomore, Junior, and Senior classes with 496, 348,and 481 students respectively.
A) StratifiedB) ClusterC) ConvenienceD) SystematicE) Random
23)
Solve the problem.24) A gardener has 75 clients, 45% of whom are businesses. Find the number of business clients.
A) 41 clients B) 34 clients C) 36 clients D) 73 clients24)
Determine whether the given description corresponds to an observational study or an experiment.25) A marketing firm does a survey to find out how many people use a product. Of the one hundred
people contacted, fifteen said they use the product.A) Experiment B) Observational study
25)
Copyright © 2014 Pearson Education, Inc.
9
Answer KeyTestname: CHAPTER 1 EXAM B
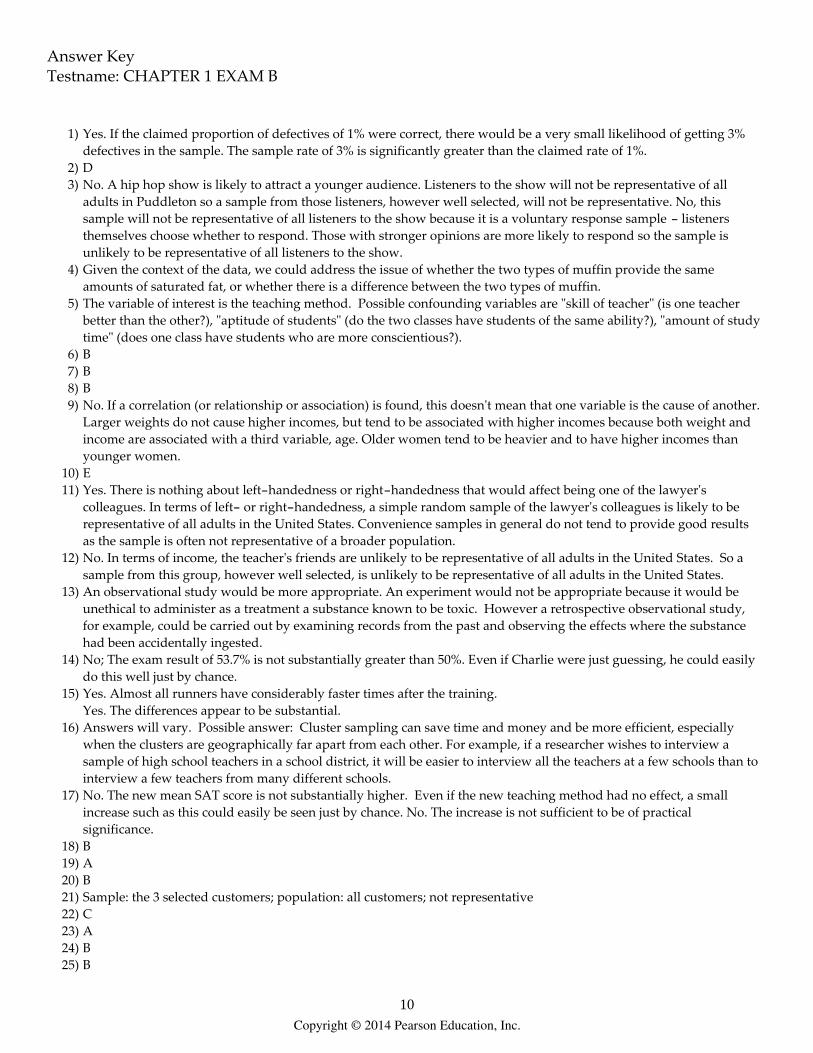
1) Yes. If the claimed proportion of defectives of 1% were correct, there would be a very small likelihood of getting 3%defectives in the sample. The sample rate of 3% is significantly greater than the claimed rate of 1%.
2) D3) No. A hip hop show is likely to attract a younger audience. Listeners to the show will not be representative of all
adults in Puddleton so a sample from those listeners, however well selected, will not be representative. No, thissample will not be representative of all listeners to the show because it is a voluntary response sample - listenersthemselves choose whether to respond. Those with stronger opinions are more likely to respond so the sample isunlikely to be representative of all listeners to the show.
4) Given the context of the data, we could address the issue of whether the two types of muffin provide the sameamounts of saturated fat, or whether there is a difference between the two types of muffin.
5) The variable of interest is the teaching method. Possible confounding variables are "skill of teacher" (is one teacherbetter than the other?), "aptitude of students" (do the two classes have students of the same ability?), "amount of studytime" (does one class have students who are more conscientious?).
6) B7) B8) B9) No. If a correlation (or relationship or association) is found, this doesn't mean that one variable is the cause of another.
Larger weights do not cause higher incomes, but tend to be associated with higher incomes because both weight andincome are associated with a third variable, age. Older women tend to be heavier and to have higher incomes thanyounger women.
10) E11) Yes. There is nothing about left-handedness or right-handedness that would affect being one of the lawyer's
colleagues. In terms of left- or right-handedness, a simple random sample of the lawyer's colleagues is likely to berepresentative of all adults in the United States. Convenience samples in general do not tend to provide good resultsas the sample is often not representative of a broader population.
12) No. In terms of income, the teacher's friends are unlikely to be representative of all adults in the United States. So asample from this group, however well selected, is unlikely to be representative of all adults in the United States.
13) An observational study would be more appropriate. An experiment would not be appropriate because it would beunethical to administer as a treatment a substance known to be toxic. However a retrospective observational study,for example, could be carried out by examining records from the past and observing the effects where the substancehad been accidentally ingested.
14) No; The exam result of 53.7% is not substantially greater than 50%. Even if Charlie were just guessing, he could easilydo this well just by chance.
15) Yes. Almost all runners have considerably faster times after the training.Yes. The differences appear to be substantial.
16) Answers will vary. Possible answer: Cluster sampling can save time and money and be more efficient, especiallywhen the clusters are geographically far apart from each other. For example, if a researcher wishes to interview asample of high school teachers in a school district, it will be easier to interview all the teachers at a few schools than tointerview a few teachers from many different schools.
17) No. The new mean SAT score is not substantially higher. Even if the new teaching method had no effect, a smallincrease such as this could easily be seen just by chance. No. The increase is not sufficient to be of practicalsignificance.
18) B19) A20) B21) Sample: the 3 selected customers; population: all customers; not representative22) C23) A24) B25) B
Copyright © 2014 Pearson Education, Inc.
10

Chapter 2 Exam A
Name___________________________________
SHORT ANSWER. Write the word or phrase that best completes each statement or answers the question.
Provide an appropriate response.1) Create an example displaying data in a pie chart. Display the same data in a Pareto chart.
Which graph is more effective? List at least two reasons in support of your choice.1)
Use the given data to construct a frequency distribution.2) A school district performed a study to find the main causes leading to its students
dropping out of school. Thirty cases were analyzed, and a primary cause was assigned toeach case. The causes included unexcused absences (U), illness (I), family problems (F),and other causes (O). The results for the thirty cases are listed below:
U U U I F O O U I F F O U I I F I I O U I F F U U I I O F U
Construct a table summarizing the frequency distribution of the primary causes leading tostudent dropout.
Cause Frequency
2)
Provide an appropriate response.3) Use the high closing values of Naristar Inc. stock from the years 1992 - 2003 to construct a
time-series graph. (Let x = 0 represent 1992 and so on.) Identify a trend.
Year High Year High1992 48 1998 621993 53 1999 601994 47 2000 681995 55 2001 421996 58 2002 511997 61 2003 78
x
y
x
y
3)
MULTIPLE CHOICE. Choose the one alternative that best completes the statement or answers the question.
Use the given paired data to construct a scatterplot.
Copyright © 2014 Pearson Education, Inc.
11
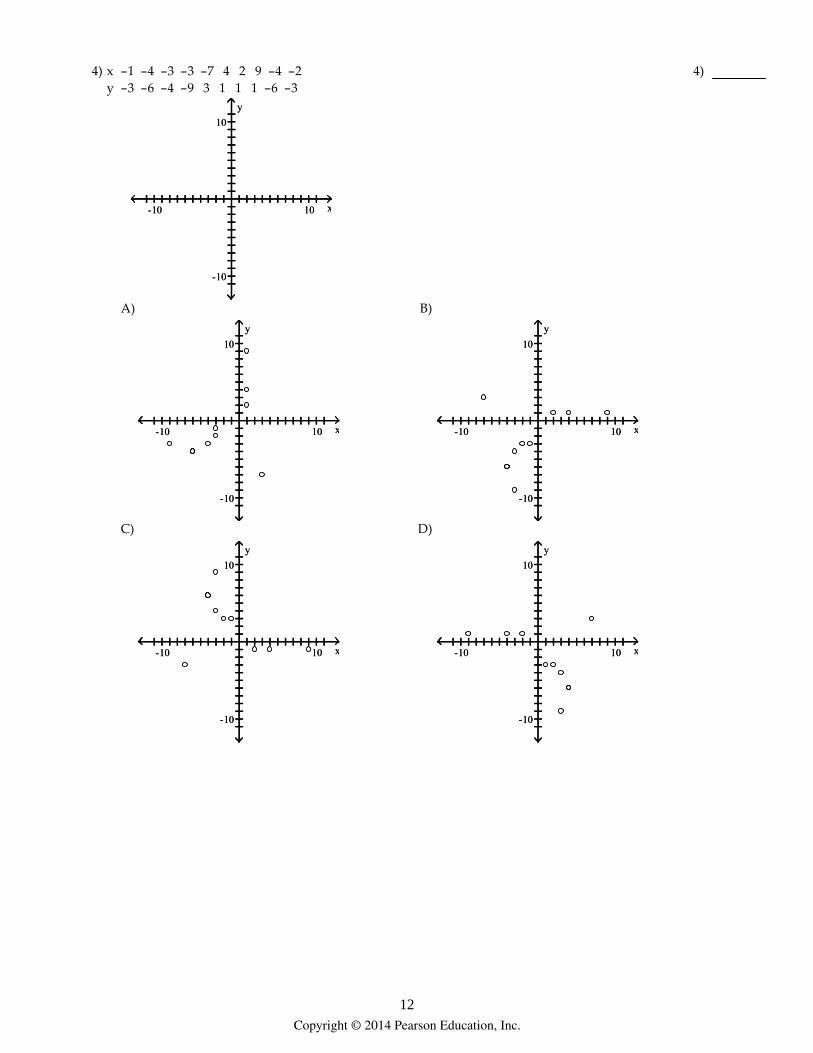
4) x -1 -4 -3 -3 -7 4 2 9 -4 -2y -3 -6 -4 -9 3 1 1 1 -6 -3
x-10 10
y
10
-10
x-10 10
y
10
-10
A)
x-10 10
y
10
-10
x-10 10
y
10
-10
B)
x-10 10
y
10
-10
x-10 10
y
10
-10
C)
x-10 10
y
10
-10
x-10 10
y
10
-10
D)
x-10 10
y
10
-10
x-10 10
y
10
-10
4)
Copyright © 2014 Pearson Education, Inc.
12
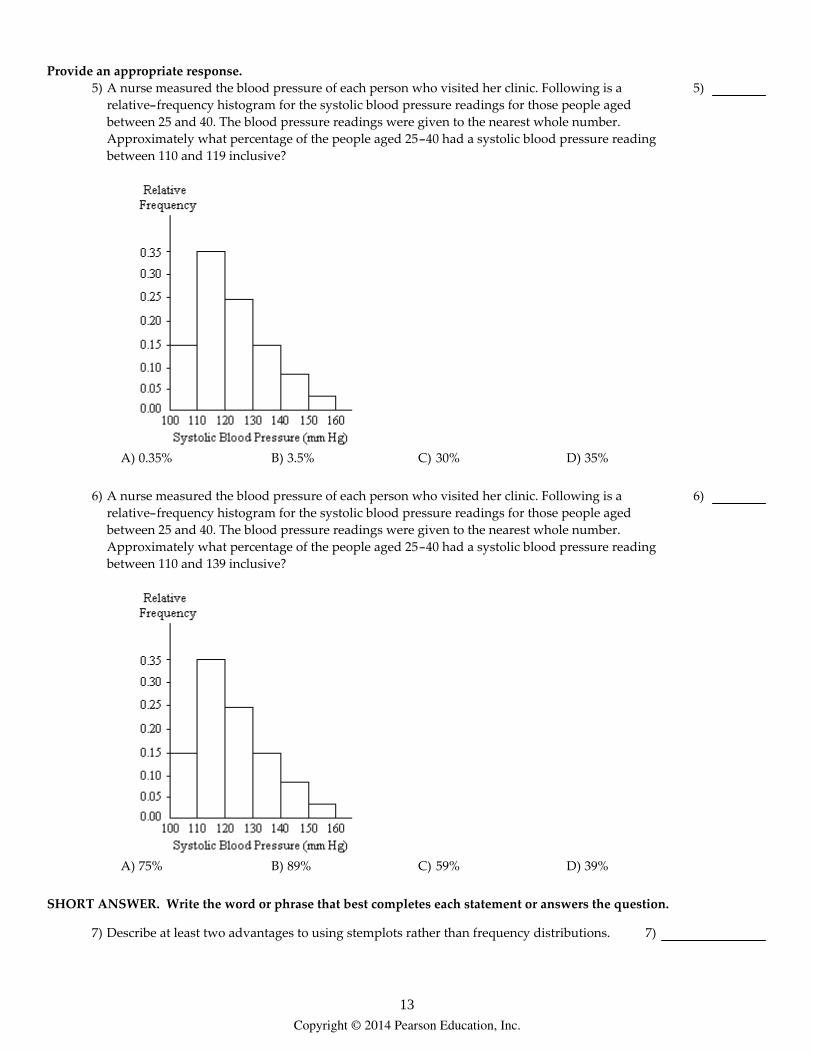
Provide an appropriate response.5) A nurse measured the blood pressure of each person who visited her clinic. Following is a
relative-frequency histogram for the systolic blood pressure readings for those people agedbetween 25 and 40. The blood pressure readings were given to the nearest whole number.Approximately what percentage of the people aged 25-40 had a systolic blood pressure readingbetween 110 and 119 inclusive?
A) 0.35% B) 3.5% C) 30% D) 35%
5)
6) A nurse measured the blood pressure of each person who visited her clinic. Following is arelative-frequency histogram for the systolic blood pressure readings for those people agedbetween 25 and 40. The blood pressure readings were given to the nearest whole number.Approximately what percentage of the people aged 25-40 had a systolic blood pressure readingbetween 110 and 139 inclusive?
A) 75% B) 89% C) 59% D) 39%
6)
SHORT ANSWER. Write the word or phrase that best completes each statement or answers the question.
7) Describe at least two advantages to using stemplots rather than frequency distributions. 7)
Copyright © 2014 Pearson Education, Inc.
13

MULTIPLE CHOICE. Choose the one alternative that best completes the statement or answers the question.
Solve the problem.8) The Kappa Iota Sigma Fraternity polled its members on the weekend party theme. The vote was as
follows: six for toga, four for hayride, eight for beer bash, and two for masquerade. Display thevote count in a Pareto chart.
A) B)
C) D)
8)
Copyright © 2014 Pearson Education, Inc.
14

Construct the dotplot for the given data.9) A store manager counts the number of customers who make a purchase in his store each day. The
data are as follows.10 11 8 14 7 10 10 11 8 7
5 10 15A)
5 10 15
B)
5 10 15C)
5 10 15
D)
5 10 15
9)
Use the data to create a stemplot.10) The following data show the number of laps run by each participant in a marathon.
46 65 55 43 51 48 57 30 43 49 32 56A)
3456
0 2 3 3 6 8 9 1 5 6 7 5
B)
3446
0 2 3 6 8 9 1 3 5 6 7 5
10)
Provide an appropriate response.11) The frequency distribution below summarizes employee years of service for Alpha Corporation.
Find the class boundaries for class 26-30.
Years of service Frequency1-5 56-10 2011-15 2516-20 1021-25 526-30 3
A) 26.5, 30.5 B) 26.5, 29.5 C) 25.5, 30.5 D) 25.5, 20.5
11)
Copyright © 2014 Pearson Education, Inc.
15
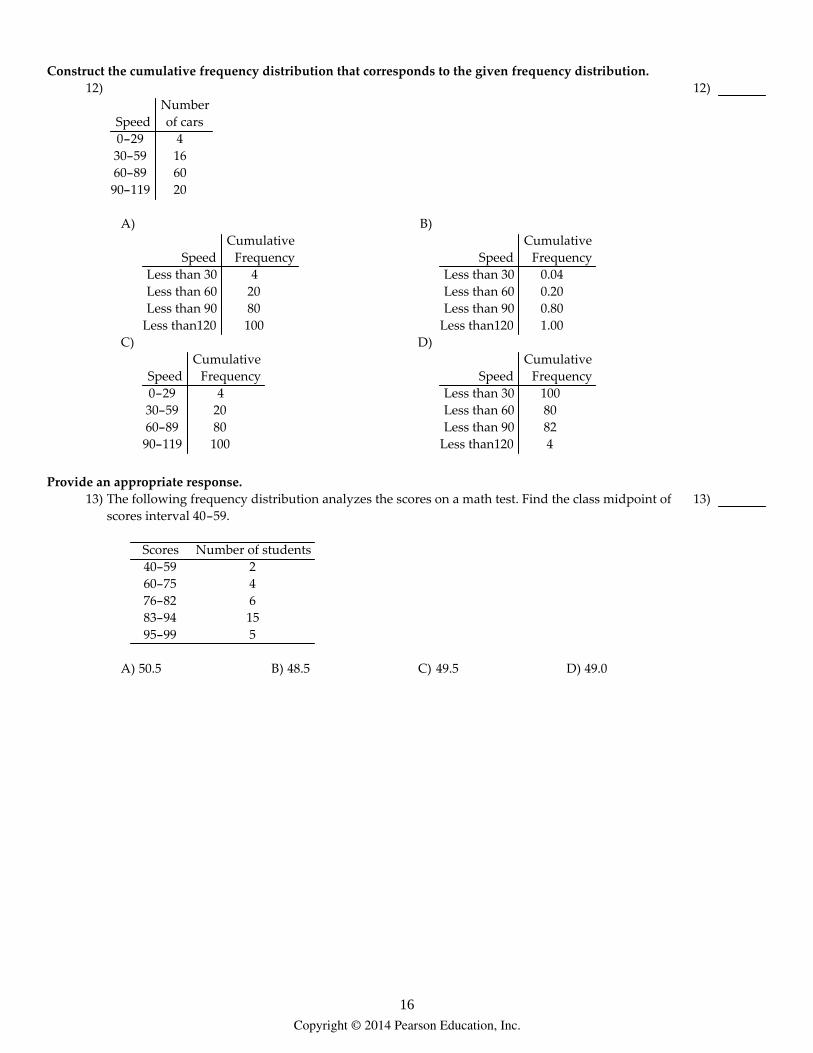
Construct the cumulative frequency distribution that corresponds to the given frequency distribution.12)
Speed Number of cars
0-29 430-59 1660-89 6090-119 20
A)
Speed Cumulative
FrequencyLess than 30 4Less than 60 20Less than 90 80
Less than120 100
B)
Speed Cumulative
FrequencyLess than 30 0.04Less than 60 0.20Less than 90 0.80
Less than120 1.00C)
Speed Cumulative
Frequency0-29 430-59 2060-89 8090-119 100
D)
Speed Cumulative
FrequencyLess than 30 100Less than 60 80Less than 90 82
Less than120 4
12)
Provide an appropriate response.13) The following frequency distribution analyzes the scores on a math test. Find the class midpoint of
scores interval 40-59.
Scores Number of students40-59 260-75 476-82 683-94 1595-99 5
A) 50.5 B) 48.5 C) 49.5 D) 49.0
13)
Copyright © 2014 Pearson Education, Inc.
16

14) The histogram below represents the number of television sets per household for a sample of U.S.households. What is the minimum number of households having the same number of televisionsets?
1 2 3 4 5
50
40
30
20
10
Number of TV Sets
Fre
quen
cy
1 2 3 4 5
50
40
30
20
10
Number of TV Sets
Fre
quen
cy
A) 1 B) 100 C) 20 D) 5
14)
Use the data to create a stemplot.15) The weights of 22 members of the varsity football team are listed below.
144 152 142 151 160 152 131 164 141 153 140144 175 156 147 133 172 159 135 159 148 171
A)
1314151617
1 3 5 0 1 2 4 4 7 8 1 2 2 3 6 9 9 0 4 1 2 5
B)
1314151617
1 3 5 1 2 2 3 6 9 9 0 1 2 4 4 7 8 0 4 1 2 5
15)
Copyright © 2014 Pearson Education, Inc.
17
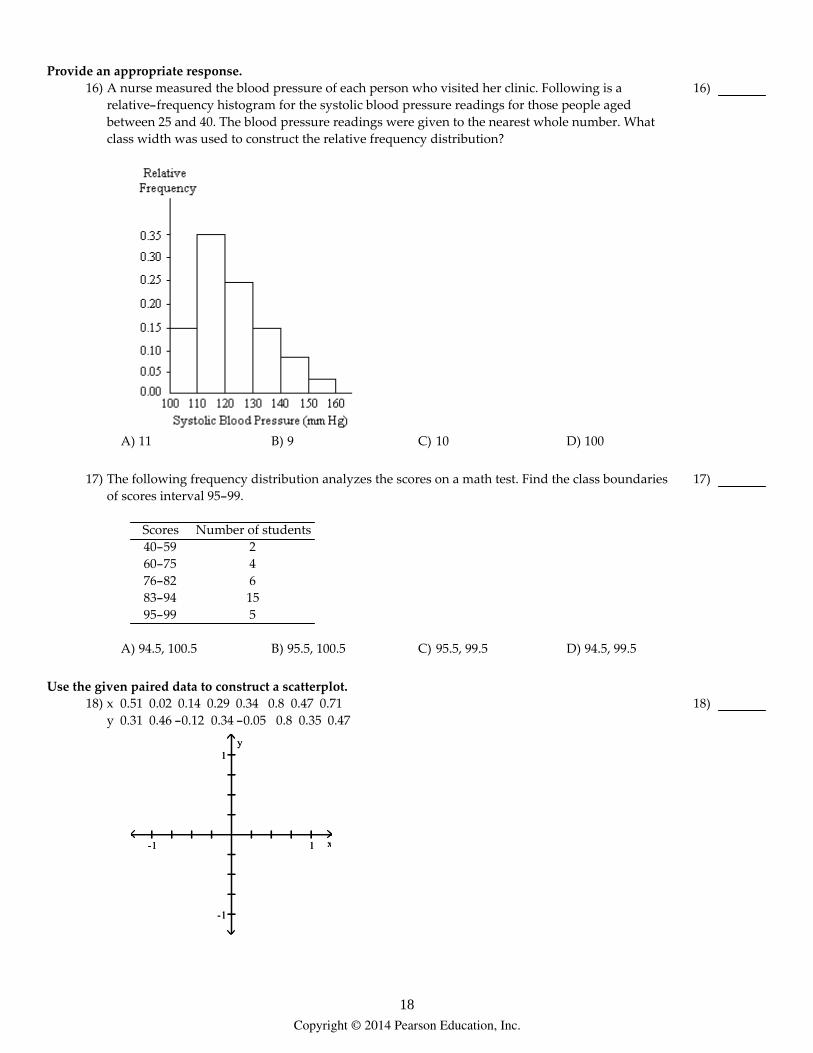
Provide an appropriate response.16) A nurse measured the blood pressure of each person who visited her clinic. Following is a
relative-frequency histogram for the systolic blood pressure readings for those people agedbetween 25 and 40. The blood pressure readings were given to the nearest whole number. Whatclass width was used to construct the relative frequency distribution?
A) 11 B) 9 C) 10 D) 100
16)
17) The following frequency distribution analyzes the scores on a math test. Find the class boundariesof scores interval 95-99.
Scores Number of students40-59 260-75 476-82 683-94 1595-99 5
A) 94.5, 100.5 B) 95.5, 100.5 C) 95.5, 99.5 D) 94.5, 99.5
17)
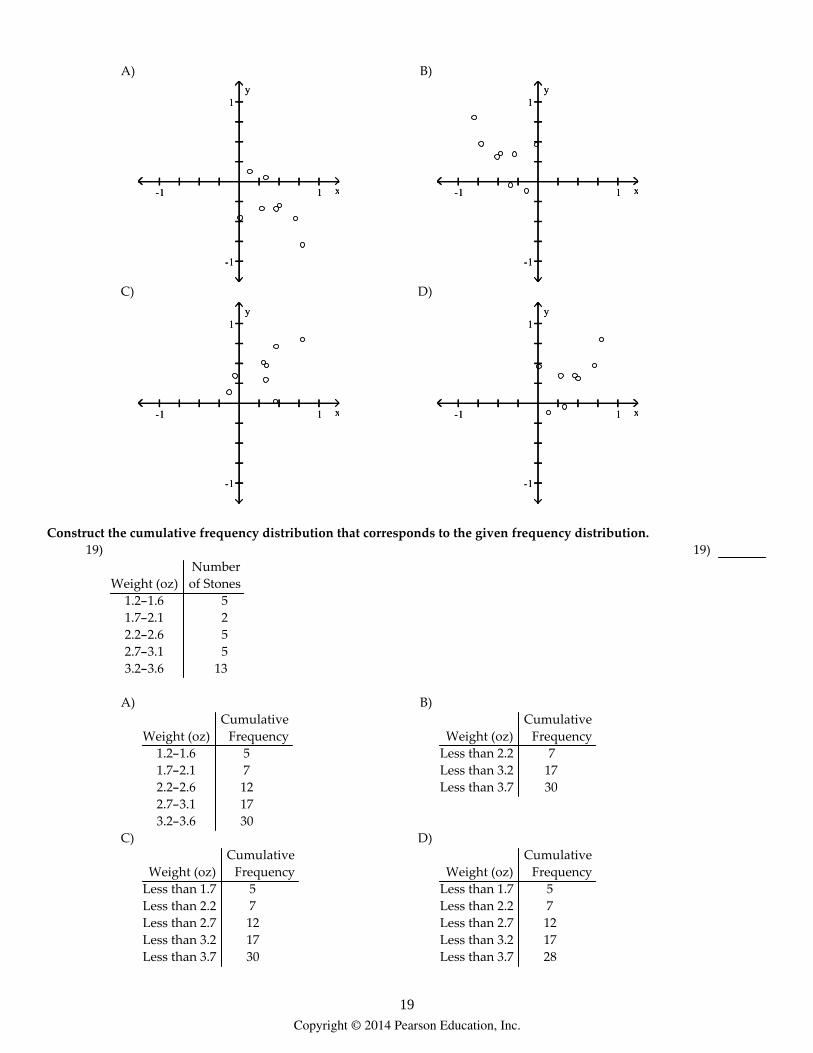
Use the given paired data to construct a scatterplot.18) x 0.51 0.02 0.14 0.29 0.34 0.8 0.47 0.71
y 0.31 0.46 -0.12 0.34 -0.05 0.8 0.35 0.47
x-1 1
y1
-1
x-1 1
y1
-1
18)
Copyright © 2014 Pearson Education, Inc.
18
A)
x-1 1
y1
-1
x-1 1
y1
-1
B)
x-1 1
y1
-1
x-1 1
y1
-1
C)
x-1 1
y1
-1
x-1 1
y1
-1
D)
x-1 1
y1
-1
x-1 1
y1
-1
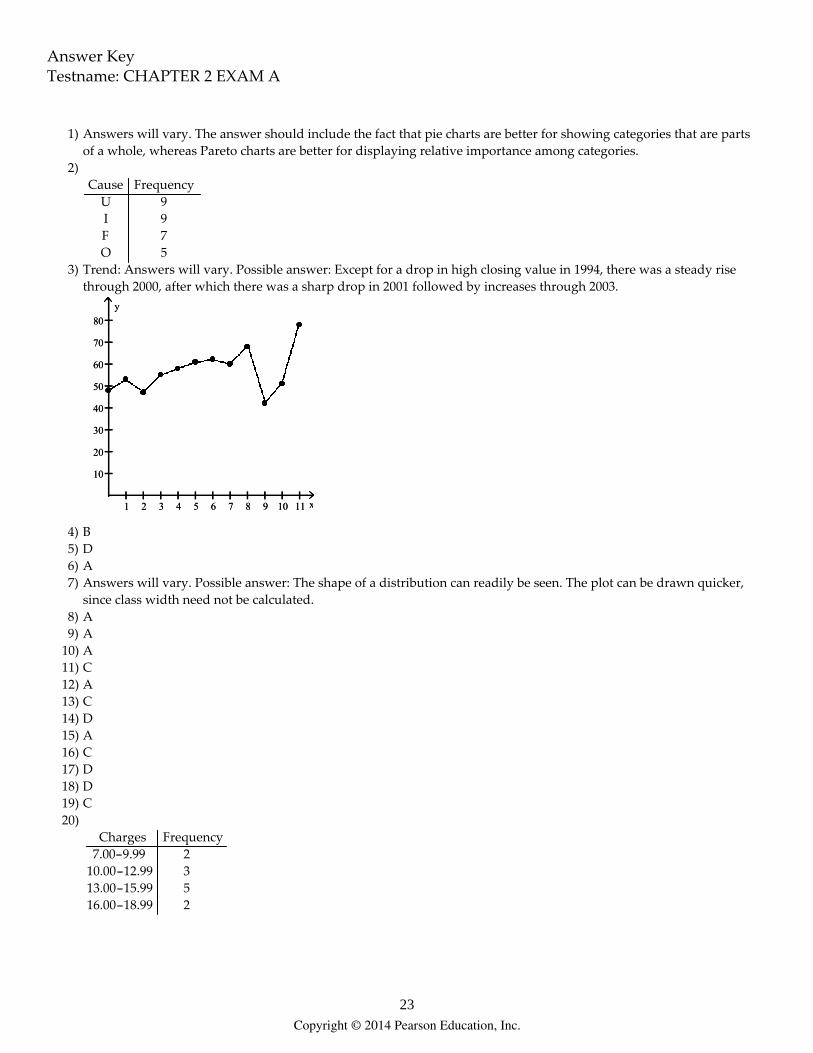
Construct the cumulative frequency distribution that corresponds to the given frequency distribution.19)
Weight (oz) Number of Stones
1.2-1.6 51.7-2.1 22.2-2.6 52.7-3.1 53.2-3.6 13
A)
Weight (oz) Cumulative
Frequency1.2-1.6 51.7-2.1 72.2-2.6 122.7-3.1 173.2-3.6 30
B)
Weight (oz) Cumulative
FrequencyLess than 2.2 7Less than 3.2 17Less than 3.7 30
C)
Weight (oz) Cumulative
FrequencyLess than 1.7 5Less than 2.2 7Less than 2.7 12Less than 3.2 17Less than 3.7 30
D)
Weight (oz) Cumulative
FrequencyLess than 1.7 5Less than 2.2 7Less than 2.7 12Less than 3.2 17Less than 3.7 28
19)
Copyright © 2014 Pearson Education, Inc.
19

SHORT ANSWER. Write the word or phrase that best completes each statement or answers the question.
Use the given data to construct a frequency distribution.20) The following figures represent Jennifer's monthly charges for long distance telephone
calls for the past twelve months.
7.12 10.40 14.70 18.24
10.48 16.47 7.53 15.45
13.04 15.48 13.33 12.56Construct a frequency distribution with 4 classes.
Charges Frequency
20)
Solve the problem.21) The data shows the roundtrip mileage that 43 randomly selected students drive to school
each day. Construct a frequency polygon. Applying a loose interpretation of therequirements for a normal distribution, do the mileages appear to be normallydistributed? Why or why not?
Miles Frequency10-1415-1920-2425-2930-34
069217
5 10 15 20 25 30 35 40
18
16
14
12
10
8
6
4
2
5 10 15 20 25 30 35 40
18
16
14
12
10
8
6
4
2
21)
Copyright © 2014 Pearson Education, Inc.
20

Provide an appropriate response.22) The graph below shows the number of car accidents occurring in one city in each of the
years 2001 through 2006. The number of accidents dropped in 2003 after a new speed limitwas imposed. Does the graph distort the data? How would you redesign the graph to beless misleading?
22)
MULTIPLE CHOICE. Choose the one alternative that best completes the statement or answers the question.
Use the data to create a stemplot.23) The attendance counts for this season's basketball games are listed below.
227 239 215 219221 233 229 233235 228 245 231
A)
21222324
5 9 1 7 8 9 1 3 3 5 9 5
B)
21222324
5 7 9 1 8 9 1 3 3 5 9 5
23)
Provide an appropriate response.24) The frequency distribution below summarizes employee years of service for Alpha Corporation.
Find the class midpoint for class 1-5.
Years of service Frequency1-5 56-10 2011-15 2516-20 1021-25 526-30 3
A) 3.5 B) 3.0 C) 5.0 D) 2.5
24)
Copyright © 2014 Pearson Education, Inc.
21

SHORT ANSWER. Write the word or phrase that best completes each statement or answers the question.
25) In a survey, 26 voters were asked their ages. The results are shown below. Construct ahistogram to represent the data (with 5 classes beginning with a lower class limit of 19.5and a class width of 10). What is the approximate age at the center?
43 56 28 63 67 66 52 48 37 51 40 60 62 66 45 21 35 49 32 53 61 53 69 31 48 59
25)
Copyright © 2014 Pearson Education, Inc.
22
Answer KeyTestname: CHAPTER 2 EXAM A
1) Answers will vary. The answer should include the fact that pie charts are better for showing categories that are partsof a whole, whereas Pareto charts are better for displaying relative importance among categories.
2) Cause Frequency
U 9I 9F 7O 5
3) Trend: Answers will vary. Possible answer: Except for a drop in high closing value in 1994, there was a steady risethrough 2000, after which there was a sharp drop in 2001 followed by increases through 2003.
x1 2 3 4 5 6 7 8 9 10 11
y
80
70
60
50
40
30
20
10
x1 2 3 4 5 6 7 8 9 10 11
y
80
70
60
50
40
30
20
10
4) B5) D6) A7) Answers will vary. Possible answer: The shape of a distribution can readily be seen. The plot can be drawn quicker,
since class width need not be calculated.8) A9) A
10) A11) C12) A13) C14) D15) A16) C17) D18) D19) C20)
Charges Frequency7.00-9.99 2
10.00-12.99 313.00-15.99 516.00-18.99 2
Copyright © 2014 Pearson Education, Inc.
23

Answer KeyTestname: CHAPTER 2 EXAM A
21) The frequency polygon appears to roughly approximate a normal distribution. The frequencies increase to amaximum and then decrease, and the graph is symmetric with the left half being roughly a mirror image of the righthalf.
miles5 10 15 20 25 30 35 40 45 50 55 60
freq222018161412108642
miles5 10 15 20 25 30 35 40 45 50 55 60
freq222018161412108642
22) The graph distorts the data because the the vertical scale starts at 60 rather than 0, giving the impression of a largedifference in the number of accidents, when actually the number of accidents only varies from 90 to 120. To make thegraph less misleading, change the vertical scale so that it begins at 0 and increases in increments of 20.
23) A24) B25) The approximate age at the center is 50.
Copyright © 2014 Pearson Education, Inc.
24
Chapter 2 Exam B
Name___________________________________
MULTIPLE CHOICE. Choose the one alternative that best completes the statement or answers the question.
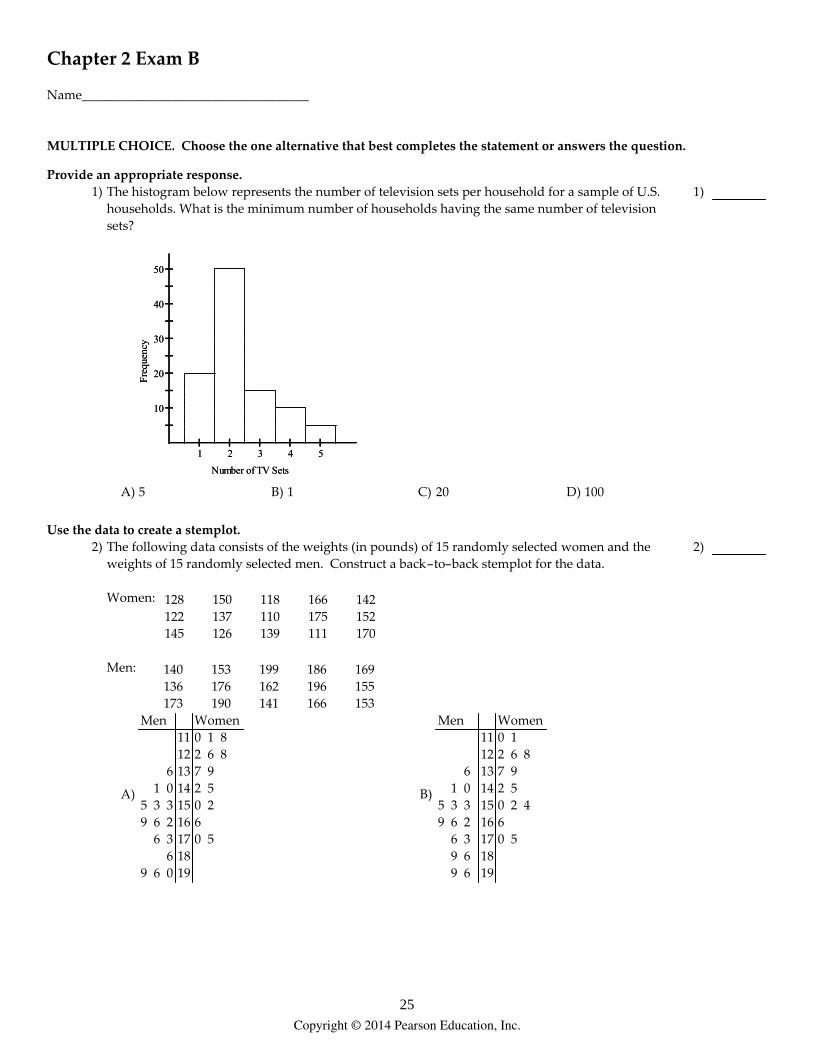
Provide an appropriate response.1) The histogram below represents the number of television sets per household for a sample of U.S.
households. What is the minimum number of households having the same number of televisionsets?
1 2 3 4 5
50
40
30
20
10
Number of TV Sets
Fre
quen
cy
1 2 3 4 5
50
40
30
20
10
Number of TV Sets
Fre
quen
cy
A) 5 B) 1 C) 20 D) 100
1)
Use the data to create a stemplot.2) The following data consists of the weights (in pounds) of 15 randomly selected women and the
weights of 15 randomly selected men. Construct a back-to-back stemplot for the data.
Women:
128 150 118 166 142122 137 110 175 152145 126 139 111 170
Men:
140 153 199 186 169136 176 162 196 155173 190 141 166 153
A)
Men Women11 0 1 812 2 6 8
6 13 7 9 1 0 14 2 55 3 3 15 0 29 6 2 16 6 6 3 17 0 5 6 189 6 0 19
B)
Men Women11 0 112 2 6 8
6 13 7 9 1 0 14 2 55 3 3 15 0 2 49 6 2 16 6 6 3 17 0 5 9 6 18 9 6 19
2)
Copyright © 2014 Pearson Education, Inc.
25
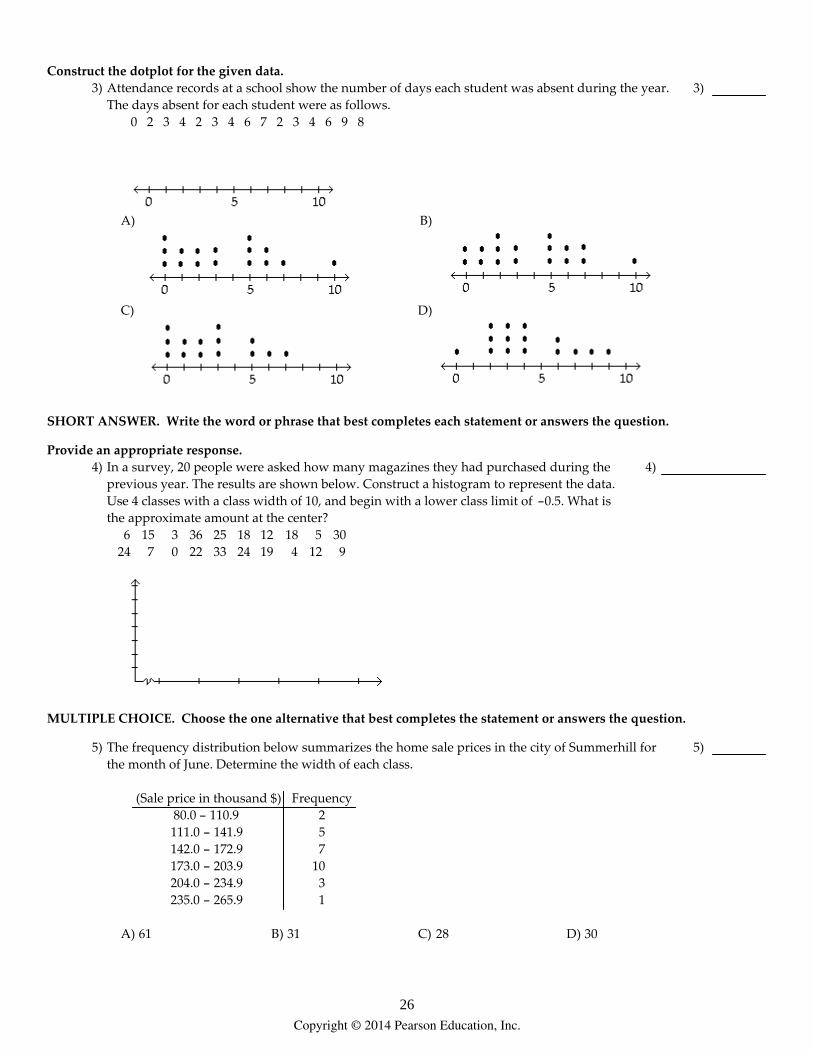
Construct the dotplot for the given data.3) Attendance records at a school show the number of days each student was absent during the year.
The days absent for each student were as follows.0 2 3 4 2 3 4 6 7 2 3 4 6 9 8
A) B)
C) D)
3)
SHORT ANSWER. Write the word or phrase that best completes each statement or answers the question.
Provide an appropriate response.4) In a survey, 20 people were asked how many magazines they had purchased during the
previous year. The results are shown below. Construct a histogram to represent the data.Use 4 classes with a class width of 10, and begin with a lower class limit of -0.5. What isthe approximate amount at the center?
6 15 3 36 25 18 12 18 5 3024 7 0 22 33 24 19 4 12 9
4)
MULTIPLE CHOICE. Choose the one alternative that best completes the statement or answers the question.
5) The frequency distribution below summarizes the home sale prices in the city of Summerhill forthe month of June. Determine the width of each class.
(Sale price in thousand $) Frequency80.0 - 110.9 2111.0 - 141.9 5142.0 - 172.9 7173.0 - 203.9 10204.0 - 234.9 3235.0 - 265.9 1
A) 61 B) 31 C) 28 D) 30
5)
Copyright © 2014 Pearson Education, Inc.
26

6) A nurse measured the blood pressure of each person who visited her clinic. Following is arelative-frequency histogram for the systolic blood pressure readings for those people agedbetween 25 and 40. The blood pressure readings were given to the nearest whole number.Approximately what percentage of the people aged 25-40 had a systolic blood pressure readingbetween 110 and 139 inclusive?
A) 59% B) 39% C) 89% D) 75%
6)
7) The following frequency distribution analyzes the scores on a math test. Find the class midpoint ofscores interval 95-99.
Scores Number of students40-59 260-75 476-82 683-94 1595-99 5
A) 97.5 B) 97.0 C) 96.5 D) 98.0
7)
Use the data to create a stemplot.8) The ages of the 45 members of a track and field team are listed below. Construct an expanded
stemplot with about 8 rows.21 18 42 35 32 21 44 25 38 48 14 19 23 22 2832 34 27 31 17 16 41 37 22 24 33 32 21 26 3022 27 32 30 20 18 17 21 15 26 36 31 40 16 25
A)
11223344
4 5 6 6 7 7 8 8 9 0 1 1 1 1 2 2 2 3 4 5 5 6 6 7 7 8 0 0 1 1 2 2 2 2 3 4 5 6 7 8 0 1 2 4 8
B)
11223344
4 5 5 6 6 7 7 8 8 9 0 1 1 1 1 2 2 2 3 4 5 5 5 5 6 6 7 7 8 0 0 1 1 2 2 2 2 3 4 5 5 6 7 8 0 1 2 4 8
8)
Copyright © 2014 Pearson Education, Inc.
27
SHORT ANSWER. Write the word or phrase that best completes each statement or answers the question.
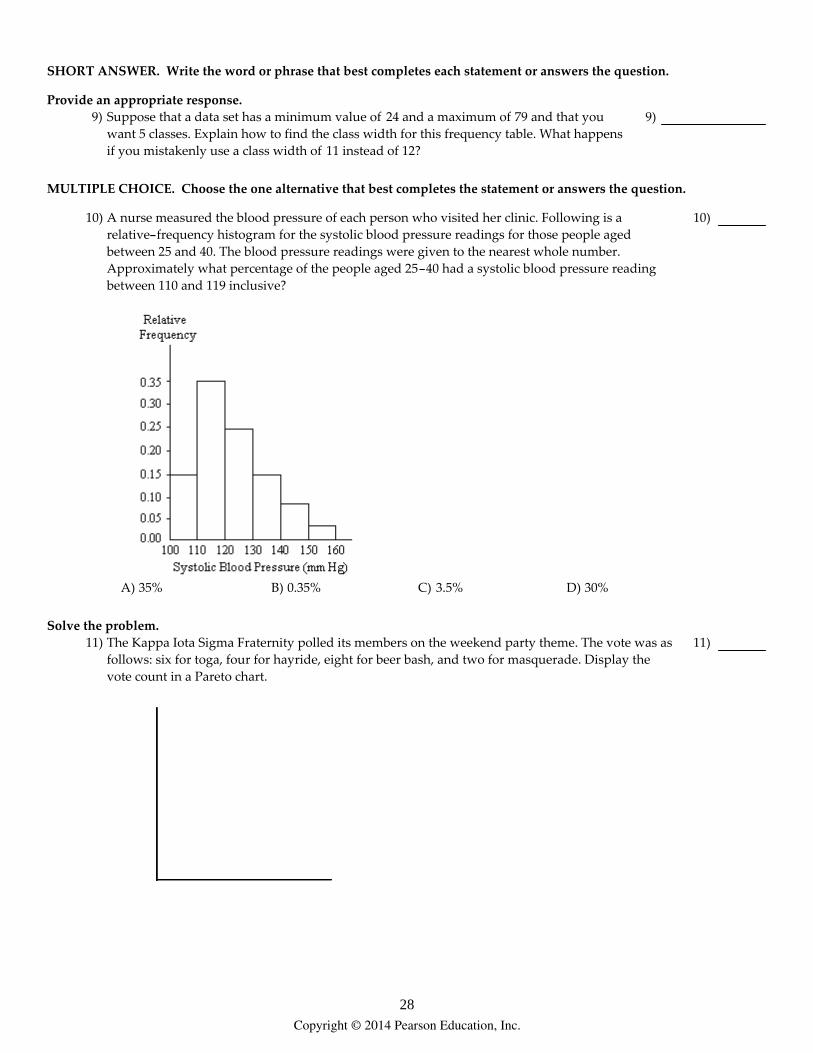
Provide an appropriate response.9) Suppose that a data set has a minimum value of 24 and a maximum of 79 and that you
want 5 classes. Explain how to find the class width for this frequency table. What happensif you mistakenly use a class width of 11 instead of 12?
9)
MULTIPLE CHOICE. Choose the one alternative that best completes the statement or answers the question.
10) A nurse measured the blood pressure of each person who visited her clinic. Following is arelative-frequency histogram for the systolic blood pressure readings for those people agedbetween 25 and 40. The blood pressure readings were given to the nearest whole number.Approximately what percentage of the people aged 25-40 had a systolic blood pressure readingbetween 110 and 119 inclusive?
A) 35% B) 0.35% C) 3.5% D) 30%
10)
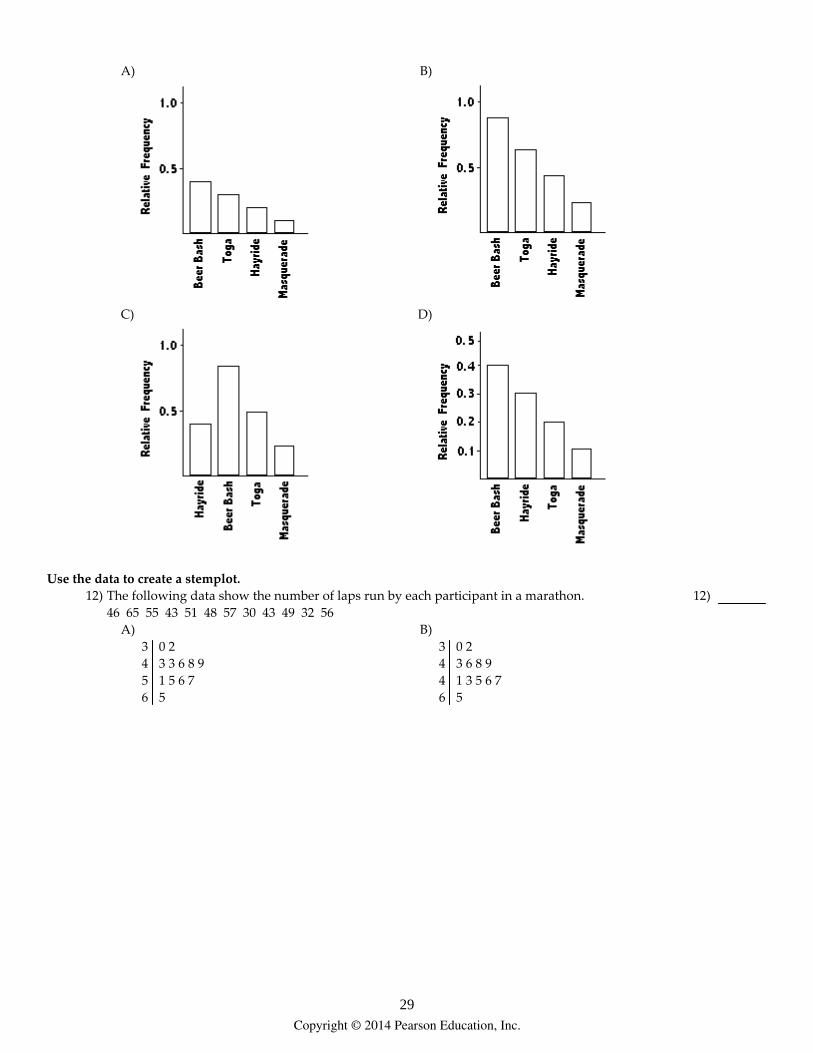
Solve the problem.11) The Kappa Iota Sigma Fraternity polled its members on the weekend party theme. The vote was as
follows: six for toga, four for hayride, eight for beer bash, and two for masquerade. Display thevote count in a Pareto chart.
11)
Copyright © 2014 Pearson Education, Inc.
28
A) B)
C) D)
Use the data to create a stemplot.12) The following data show the number of laps run by each participant in a marathon.
46 65 55 43 51 48 57 30 43 49 32 56A)
3456
0 2 3 3 6 8 9 1 5 6 7 5
B)
3446
0 2 3 6 8 9 1 3 5 6 7 5
12)
Copyright © 2014 Pearson Education, Inc.
29
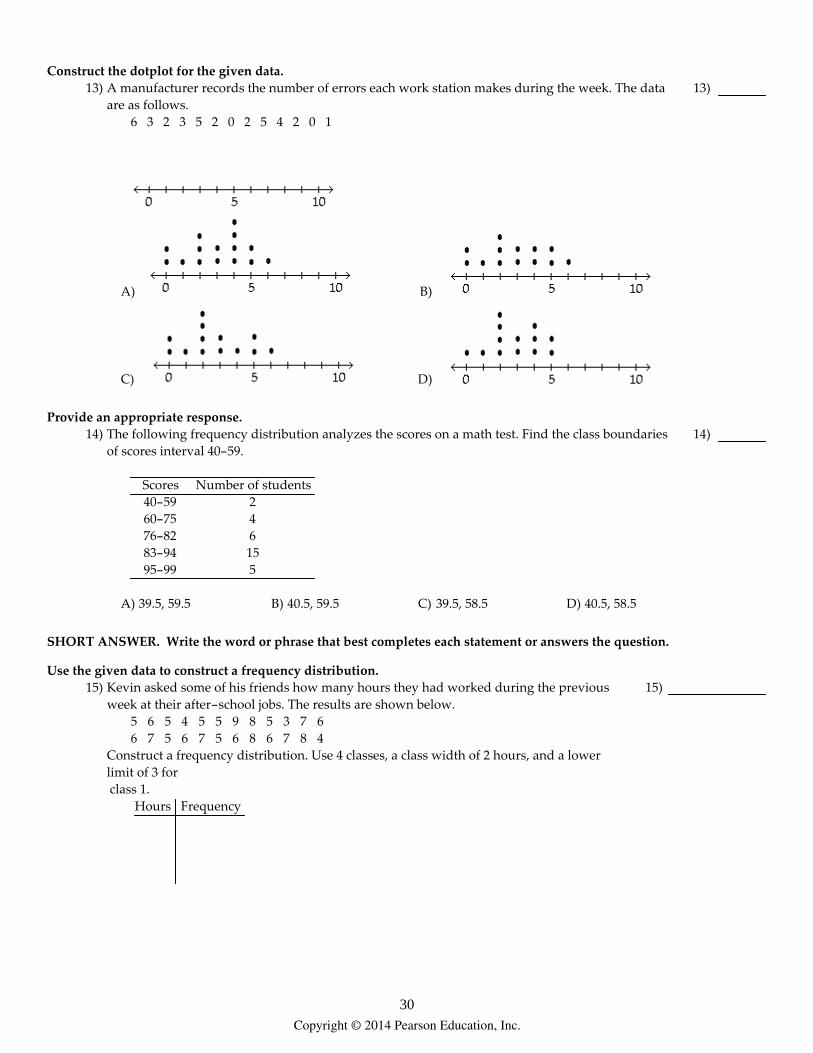
Construct the dotplot for the given data.13) A manufacturer records the number of errors each work station makes during the week. The data
are as follows.6 3 2 3 5 2 0 2 5 4 2 0 1
A) B)
C) D)
13)
Provide an appropriate response.14) The following frequency distribution analyzes the scores on a math test. Find the class boundaries
of scores interval 40-59.
Scores Number of students40-59 260-75 476-82 683-94 1595-99 5
A) 39.5, 59.5 B) 40.5, 59.5 C) 39.5, 58.5 D) 40.5, 58.5
14)
SHORT ANSWER. Write the word or phrase that best completes each statement or answers the question.
Use the given data to construct a frequency distribution.15) Kevin asked some of his friends how many hours they had worked during the previous
week at their after-school jobs. The results are shown below.5 6 5 4 5 5 9 8 5 3 7 66 7 5 6 7 5 6 8 6 7 8 4
Construct a frequency distribution. Use 4 classes, a class width of 2 hours, and a lowerlimit of 3 for class 1.
Hours Frequency
15)
Copyright © 2014 Pearson Education, Inc.
30
MULTIPLE CHOICE. Choose the one alternative that best completes the statement or answers the question.
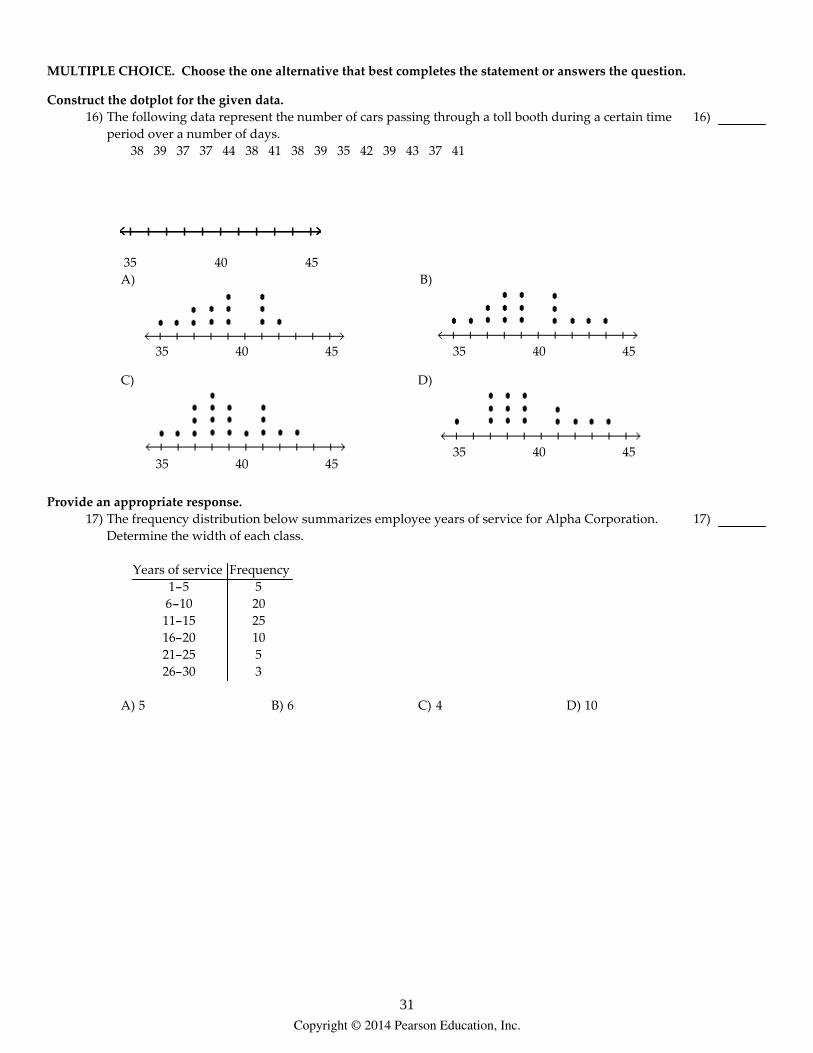
Construct the dotplot for the given data.16) The following data represent the number of cars passing through a toll booth during a certain time
period over a number of days.38 39 37 37 44 38 41 38 39 35 42 39 43 37 41
35 40 45A)
35 40 45
B)
35 40 45
C)
35 40 45
D)
35 40 45
16)
Provide an appropriate response.17) The frequency distribution below summarizes employee years of service for Alpha Corporation.
Determine the width of each class.
Years of service Frequency1-5 56-10 2011-15 2516-20 1021-25 526-30 3
A) 5 B) 6 C) 4 D) 10
17)
Copyright © 2014 Pearson Education, Inc.
31

SHORT ANSWER. Write the word or phrase that best completes each statement or answers the question.
18) Use the high closing values of Naristar Inc. stock from the years 1992 - 2003 to construct atime-series graph. (Let x = 0 represent 1992 and so on.) Identify a trend.
Year High Year High1992 48 1998 621993 53 1999 601994 47 2000 681995 55 2001 421996 58 2002 511997 61 2003 78
x
y
x
y
18)
MULTIPLE CHOICE. Choose the one alternative that best completes the statement or answers the question.
Solve the problem.19) Wagenlucht Ice Cream Company is always trying to create new flavors of ice cream. They are
market testing three kinds to find out which one has the best chance of becoming popular. Theygive small samples of each to 20 people at a grocery store. 4 ice cream tasters preferred theStrawberry Cream, 12 preferred Choco-Nuts, and 4 loved the Orange Mint. Construct a Paretochart to represent these preferences. Choose the vertical scale so that the relative frequencies arerepresented.
19)
Copyright © 2014 Pearson Education, Inc.
32

A) B)
C) D)
Copyright © 2014 Pearson Education, Inc.
33
SHORT ANSWER. Write the word or phrase that best completes each statement or answers the question.
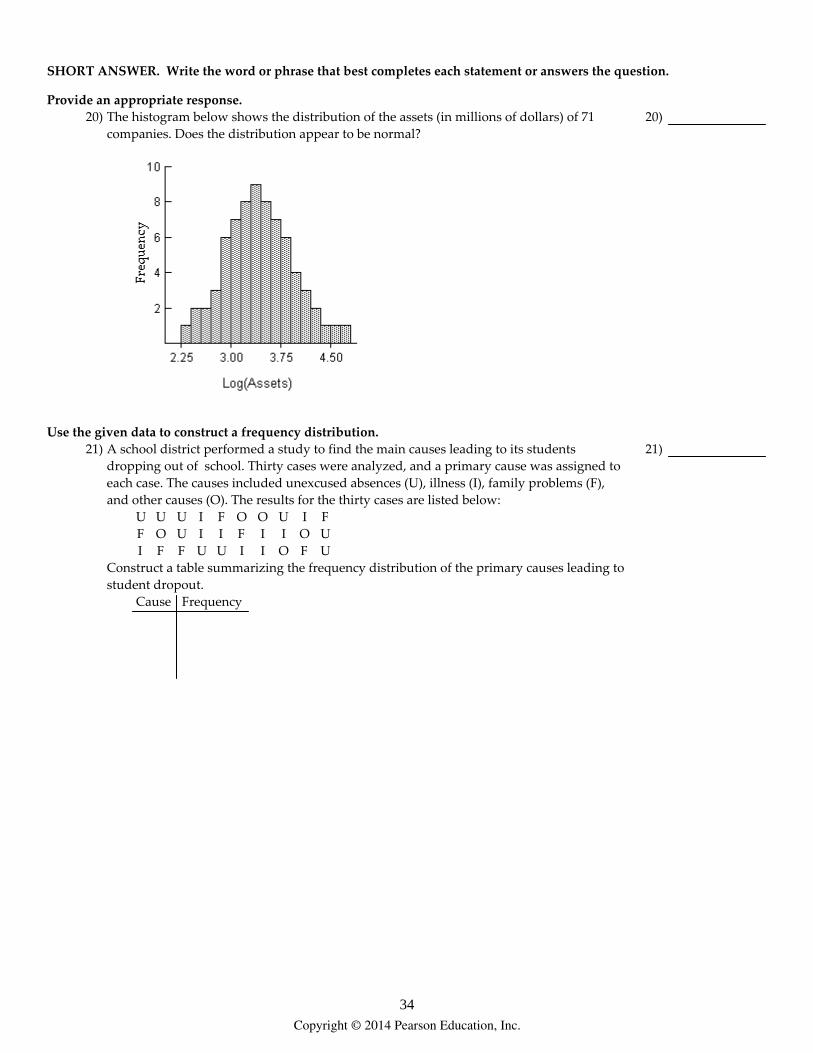
Provide an appropriate response.20) The histogram below shows the distribution of the assets (in millions of dollars) of 71
companies. Does the distribution appear to be normal?20)
Use the given data to construct a frequency distribution.21) A school district performed a study to find the main causes leading to its students
dropping out of school. Thirty cases were analyzed, and a primary cause was assigned toeach case. The causes included unexcused absences (U), illness (I), family problems (F),and other causes (O). The results for the thirty cases are listed below:
U U U I F O O U I F F O U I I F I I O U I F F U U I I O F U
Construct a table summarizing the frequency distribution of the primary causes leading tostudent dropout.
Cause Frequency
21)
Copyright © 2014 Pearson Education, Inc.
34
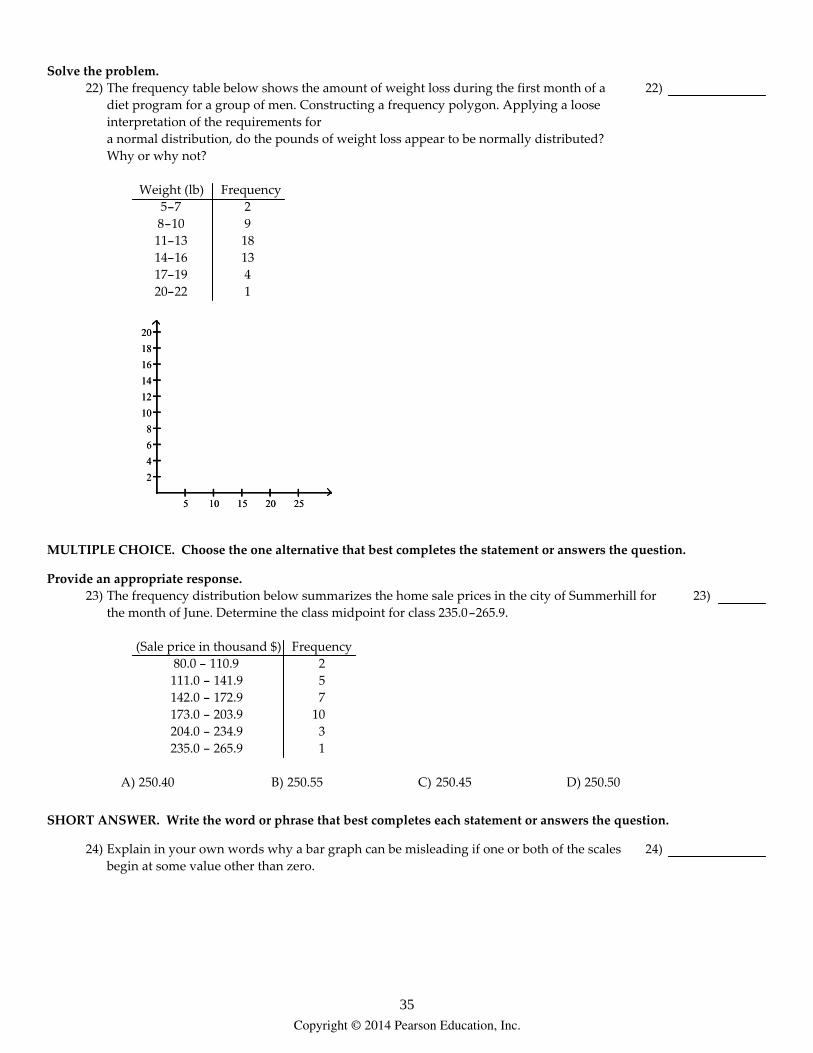
Solve the problem.22) The frequency table below shows the amount of weight loss during the first month of a
diet program for a group of men. Constructing a frequency polygon. Applying a looseinterpretation of the requirements fora normal distribution, do the pounds of weight loss appear to be normally distributed?Why or why not?
Weight (lb) Frequency5-78-1011-1314-1617-1920-22
29181341
5 10 15 20 25
20
18
16
14
12
10
8
6
4
2
5 10 15 20 25
20
18
16
14
12
10
8
6
4
2
22)
MULTIPLE CHOICE. Choose the one alternative that best completes the statement or answers the question.
Provide an appropriate response.23) The frequency distribution below summarizes the home sale prices in the city of Summerhill for
the month of June. Determine the class midpoint for class 235.0-265.9.
(Sale price in thousand $) Frequency80.0 - 110.9 2111.0 - 141.9 5142.0 - 172.9 7173.0 - 203.9 10204.0 - 234.9 3235.0 - 265.9 1
A) 250.40 B) 250.55 C) 250.45 D) 250.50
23)
SHORT ANSWER. Write the word or phrase that best completes each statement or answers the question.
24) Explain in your own words why a bar graph can be misleading if one or both of the scalesbegin at some value other than zero.
24)
Copyright © 2014 Pearson Education, Inc.
35