changing the face of geography 2014 -...
TRANSCRIPT

21 aniversari LIGIT, Bellaterra, 3 d’octubre de 2008
Dr. Roger F. TomlinsonCM, DSc, PhD, FRGS
Changing the face of GeographyGeographic Information Systems: Past, present and future

TOMLINSON ASSOCIATES
1
CHANGING THE FACE OF GEOGRAPHY:
Dr. Roger F. Tomlinson Tomlinson Associates Ltd. Consulting Geographers
17 Kippewa Drive, Ottawa, Canada K1S 3G3 Geographers have as their task the description and explanation of the living space of
humans and of the resulting spatial structure of society. The development of formal
views of these concerns forms the basis for the modern science of Geography. The
extent and complexity of the world we live in makes this task hard. The volumes of data
that result from even cursory global investigation are a serious impediment to our
understanding. Fifty years ago, it was not possible to handle any large set of the
hardcopy maps and data that were being gathered, much less analyze them in any
efficient way. The resulting inability, indeed the failure, to ask questions, let alone
consider in depth the role of various interacting influences shaping the individual and
societal factors left us with a deep and generally unrecognized ignorance of space and
time behaviour.
The advent of computers as information processing tools and the development of
geographic information systems (GIS) has measurably assisted geographers in their
work. These new tools are being added to the discipline. Just as the advent of the
telescope by Galileo increased the knowledge of the heavens and the concepts of
space, and as the advent of the tool of the microscope revolutionized biology with its
ability to add resolution and depth to enquiry, so the advent of the tools of GIS has
impacted the discipline of geography. The quality of questions asked is rising and the
scope and use of spatial analysis is becoming more sophisticated. We are digging
deeper into the spatial variables in considering factors that otherwise would not be
explored. The trade-off between effort and enquiry is shifting in favour of enquiry.
Workers are able to exchange their reasoning (decision models) very easily. This is
contributing to the awareness of geography and the growing number of people
becoming involved in the field. There is increasing exchange of ideas and methods. As
a result, the study of geography is changing significantly and beneficially, and in
particular expanding outside of the academic confines. Geography as a discipline is no

TOMLINSON ASSOCIATES
2
longer encompassed by academic geography. It is not principally reductionist, curiosity-
driven, with a goal to produce general laws (although that is a long established scientific
method with great virtue). There is an urgent demand for the use of geographic science
in governments, relative to society, and to address the pressing issues facing the world.
The theme of this congress emphasizes this direction. Geographers have major
contributions to make to these issues.
There is, for example, broad agreement in the scientific community that the earth’s
climate is changing and that it is part human induced. Very little is known, however,
about the societal impacts of climate change, and there are very important geographical
questions that need to be answered about the changes in bio-geo-chemical cycles,
ecosystems, water resources, resource utilization, continued atmospheric pollution, and
the overall economic, political and social implications. Geographers can contribute to
the body of knowledge about climate change by synthesizing, analyzing and modeling
possible impacts.
Similarly, with respect to human health and well-being, understanding of a population’s
health, the distribution of disease in an area, and the environment’s effect on health and
disease is central to human existence and a quintessentially geographical problem.
There are also significant issues about the accessibility to health care and spatial
distribution of health care providers.
Globalization is about interaction and integration among people, companies and
governments of different nations, a process driven by international trade and
investment, and aided by information technology. It has effects on the environment,
culture, political systems, economic development and prosperity, and human physical
well-being in societies around the world. Again, the analysis of these conditions has a
strong spatial component.
Societal security is an essential goal of all governments, and one which has become
increasingly difficult to fulfill in recent years. In an area of asymmetric warfare, socio-

TOMLINSON ASSOCIATES
3
political solutions have become ever more complex and their impacts affect different
communities and socio-economic groups in different ways.
Sustainability entails meeting the needs of the present without compromising the ability
of future generations to meet their own needs, and still remains a problem, especially in
the light of accelerated environmental change and the current food crisis. Geographers
have a great deal to contribute to understanding and solving this complex, multi-
dimensional, essentially spatial problem.
Underpinning Social Diversity means understanding and generalizing the processes of
spatial heterogeneity: that of defining characteristics of patterns and processes on the
surface of the earth. Understanding these processes, which account for social diversity,
difference and inequality, is key to good governance.
The following are illustrations of some of the ways in which GIS are being used to
examine spatial situations.
Climate
The map on the right shows the magnitude of occurrence per unit area of all East Pacific
and North Atlantic Basin tropical cyclones. Data extend back to 1851 in the North
Atlantic and to 1949 in the East Pacific. The Palmer Drought Severity Index is the
basis for agricultural relief for farmers in major distress in the USA. Of particular
interest is the analysis of drought on nuclear power plants. They require large
volumes of water for cooling purposes and sustained drought means that they
have to be closed down, removing their supply of electricity in the states
concerned.
Human Impact
The first human impact map is of global population density, inset with two
hemispheres showing the CO2 emissions in the atmosphere using real time Jet
Propulsion Laboratory satellite sensor information.

Palmer Drought Severity Index – NOAA NCDC
Tropical Cyclones – NOAA, NWS, NCEP, National Hurricane Center
Nuclear Power Plants Affected by Drought –Department of Energy, Remote Sensing Lab, Las Vegas
Climate
Barcelona 2008

Human Impact
Western Hemisphere
Population Density
CO2 Emissions in the Atmosphere Europe & Africa Barcelona 2008
TOMLINSON ASSOCIATES
4
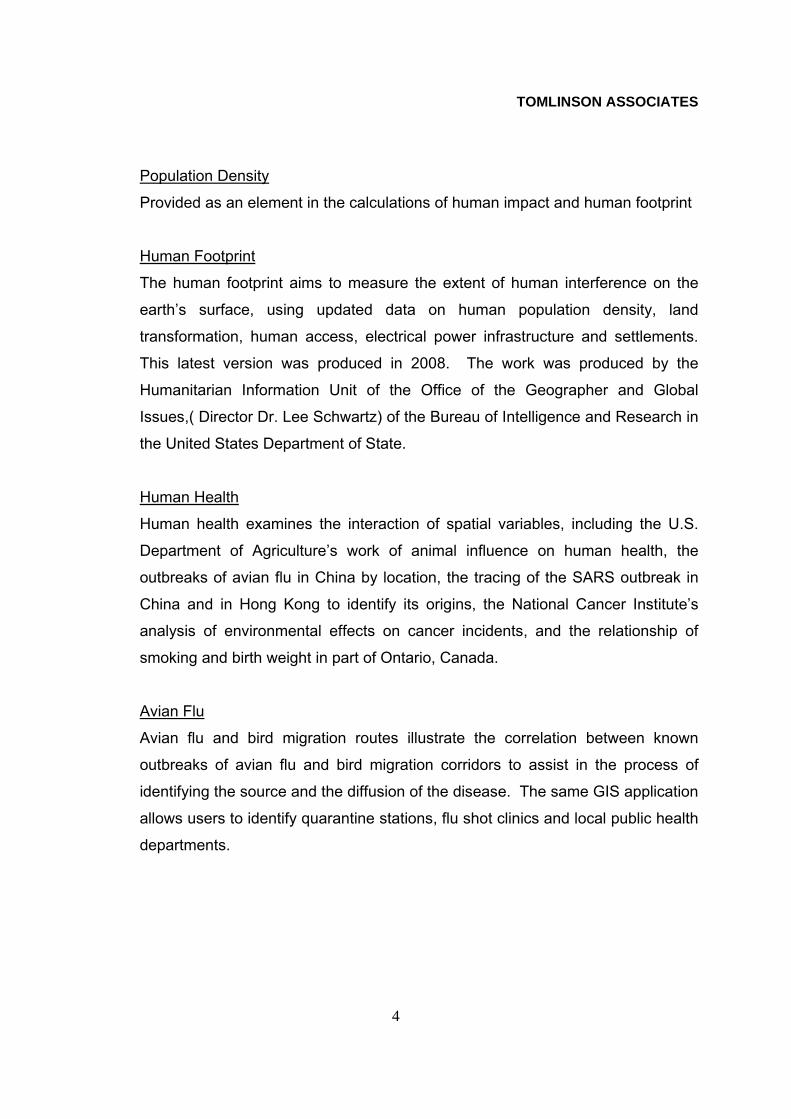
Population Density
Provided as an element in the calculations of human impact and human footprint
Human Footprint
The human footprint aims to measure the extent of human interference on the
earth’s surface, using updated data on human population density, land
transformation, human access, electrical power infrastructure and settlements.
This latest version was produced in 2008. The work was produced by the
Humanitarian Information Unit of the Office of the Geographer and Global
Issues,( Director Dr. Lee Schwartz) of the Bureau of Intelligence and Research in
the United States Department of State.
Human Health
Human health examines the interaction of spatial variables, including the U.S.
Department of Agriculture’s work of animal influence on human health, the
outbreaks of avian flu in China by location, the tracing of the SARS outbreak in
China and in Hong Kong to identify its origins, the National Cancer Institute’s
analysis of environmental effects on cancer incidents, and the relationship of
smoking and birth weight in part of Ontario, Canada.
Avian Flu
Avian flu and bird migration routes illustrate the correlation between known
outbreaks of avian flu and bird migration corridors to assist in the process of
identifying the source and the diffusion of the disease. The same GIS application
allows users to identify quarantine stations, flu shot clinics and local public health
departments.

Population Density
Barcelona 2008
Human Footprint
Barcelona 2008

Human Health
Barcelona 2008
Animal Influence in Humans
Smoking & Birth WeightAvian Flu,
China
SARS, Hong KongCancer

Avian Flu & Bird Migration Routes
Barcelona 2008

TOMLINSON ASSOCIATES
5
Ambulance Location
The process of pre-positioning ambulances for better service is examined.
Contours of actual demand (call density) and the existing position of ambulances
to meet that demand are calculated from which to optimize response travel times
affecting the efficiency of ambulance organization and survival rate in the area.
Flu Vaccine Distribution
Access to influenza vaccine distributions compares population distribution with
access buffer zones of one mile radius and two mile radius around points of
distribution of vaccines. Similar analysis is being used in preparation for avian flu
epidemics.
AIDS (2 slides)
The progress on the President’s emergency plan for AIDS relief (EPPA) in sub-
Saharan Africa is illustrated as a basis for policy change. Also included are
results in Vietnam and Guyana. Further analysis and understanding of the AIDS
epidemic in Africa, particularly Kenya, Uganda, Tanzania and Zambia and
Malawi are examined by gender showing the percent HIV positive in four
categories (2-5%, 5-10%, 10-15% and more than 15% of the population).
Similarly, the HIV prevalence among youth by first order administrative divisions
in the countries concerned, again as a percent of the general population and by
gender. These studies underpin the effective delivery of AIDS relief in sub-
Saharan Africa and the monitoring and analysis of program effectiveness.
Life and death in Africa is an analysis with broad scope. It includes infant
mortality, access to drinking water, overall AIDS infections, gross national income
and the resulting life expectancy by country. Bringing these variables together
over a continent allows workers better to understand the measures necessary to
improve the national condition.

Pre-Positioning Ambulances for Better Service
Barcelona 2008

Access to Vaccine Distributions
Barcelona 2008

AIDS
Barcelona 2008

AIDS
Barcelona 2008

Life & Death in Africa
Barcelona 2008
TOMLINSON ASSOCIATES
6
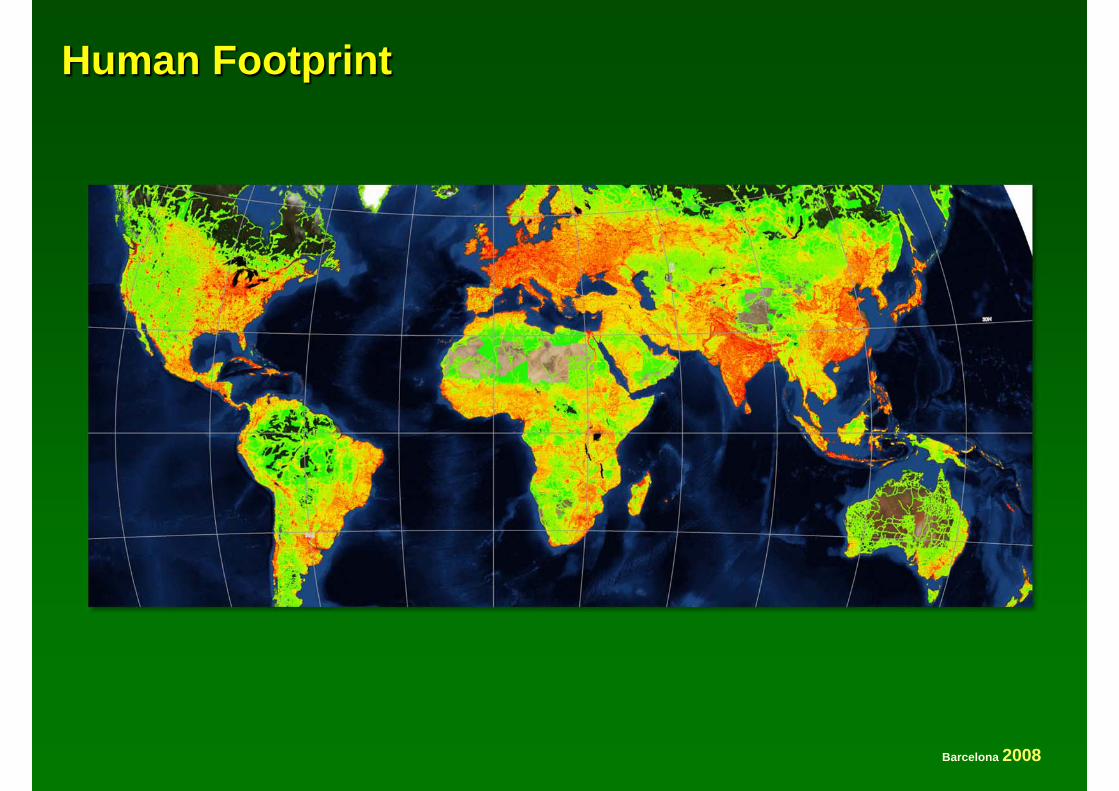
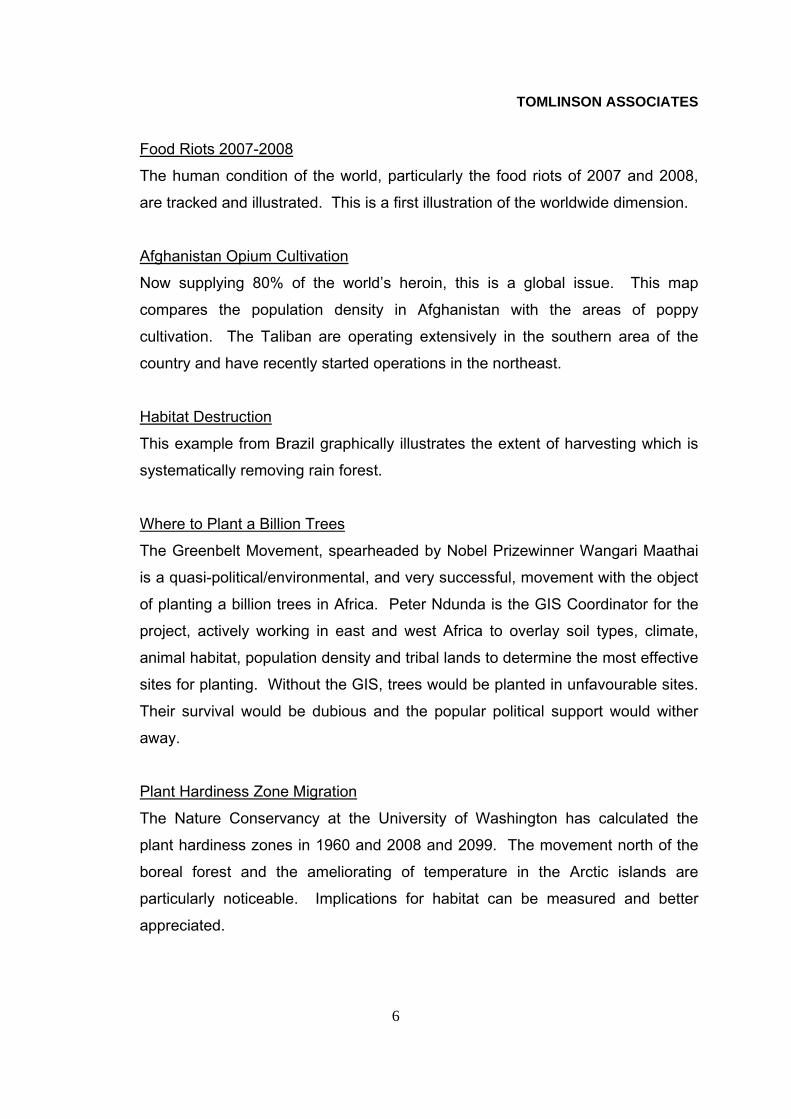
Food Riots 2007-2008
The human condition of the world, particularly the food riots of 2007 and 2008,
are tracked and illustrated. This is a first illustration of the worldwide dimension.
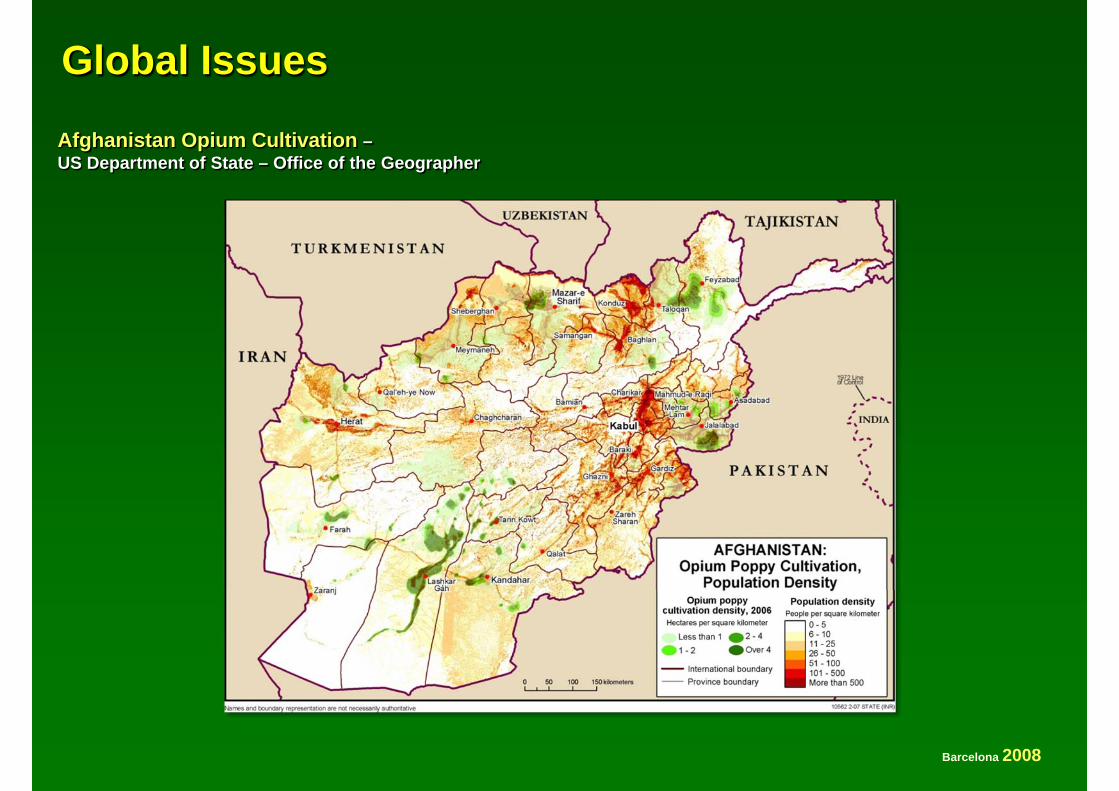
Afghanistan Opium Cultivation
Now supplying 80% of the world’s heroin, this is a global issue. This map
compares the population density in Afghanistan with the areas of poppy
cultivation. The Taliban are operating extensively in the southern area of the
country and have recently started operations in the northeast.
Habitat Destruction
This example from Brazil graphically illustrates the extent of harvesting which is
systematically removing rain forest.
Where to Plant a Billion Trees
The Greenbelt Movement, spearheaded by Nobel Prizewinner Wangari Maathai
is a quasi-political/environmental, and very successful, movement with the object
of planting a billion trees in Africa. Peter Ndunda is the GIS Coordinator for the
project, actively working in east and west Africa to overlay soil types, climate,
animal habitat, population density and tribal lands to determine the most effective
sites for planting. Without the GIS, trees would be planted in unfavourable sites.
Their survival would be dubious and the popular political support would wither
away.
Plant Hardiness Zone Migration
The Nature Conservancy at the University of Washington has calculated the
plant hardiness zones in 1960 and 2008 and 2099. The movement north of the
boreal forest and the ameliorating of temperature in the Arctic islands are
particularly noticeable. Implications for habitat can be measured and better
appreciated.
Human Condition of the World (Food Riots 2007–2008)
Barcelona 2008
Source: Janes Information Group
Global Issues
Barcelona 2008
Afghanistan Opium Cultivation –US Department of State – Office of the Geographer

Habitat Destruction
Barcelona 2008

Where to Plant a Billion Trees?
Barcelona 2008

Plant Hardiness Zones Through Time
Barcelona 2008

TOMLINSON ASSOCIATES
7
Arctic Sea Ice
The Arctic sea ice conditions are put into perspective. NASA data show that
Arctic perennial sea ice, which normally survives the summer melt season and
remains year-round, shrunk abruptly by 14 percent between 2004 and 2005. The
loss of perennial ice in the East Arctic Ocean was even higher, nearing 50
percent during that time as some of the ice moved from the East Arctic to the
West. The overall decrease in winter Arctic perennial sea ice totals 720,000
square kilometers (280,000 square miles) − an area the size of Texas. Perennial
ice can be 3 or more meters (10 or more feet) thick. It was replaced by new,
seasonal ice only about 0.3 to 2 meters (one to seven feet) thick that is more
vulnerable to summer melt. The decrease in the perennial ice raises the
possibility that Arctic sea ice will retreat to another record low extent this year.
This follows a series of very low ice-cover years observed over the past four
summers from active and passive microwave satellite data.
Travel History
Travel history is illustrated. Tracking the flights of one company over the course
of a year allows an understanding of the environmental impact enroute, the use
of increasingly high-cost fuel and the distribution of future corporate
locations/regional offices .
Hydro Watershed
The hydro-watershed of the Neuse River in North Carolina is a sophisticated
exercise in flood probability and control based on rainfall and evaporation over
the course of a year.

Arctic Sea Ice Conditions
Barcelona 2008

Travel History
Barcelona 2008

Hydrowatershed
Barcelona 2008

TOMLINSON ASSOCIATES
8
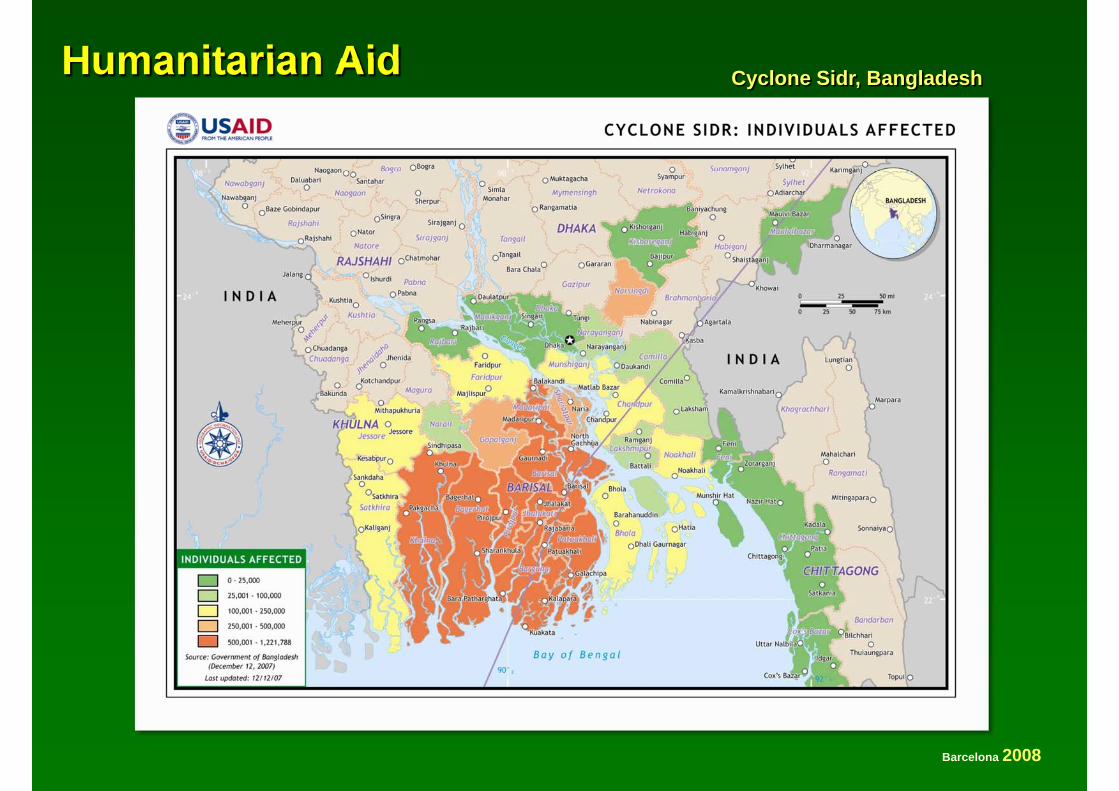
Humanitarian Aid (4 slides)
The first humanitarian aid slide is one used by USAID to determine the location
of individuals affected by cyclone activity in Bangladesh. This analysis was used
as a basis for extensive aid being provided in the right locations.
The second example of humanitarian aid produced by the Office of Foreign
Disaster Assistance in the USAID concerns the Greek wildfires of 2007. The
principal map is the result of daily identification of five boundaries. In particular,
the analysis concentrated on the degree of soil-burn severity in the Kladios Basin
which allowed the focus of aid to be directed to those communities most affected
by long-term damage and in the most desperate need of assistance.
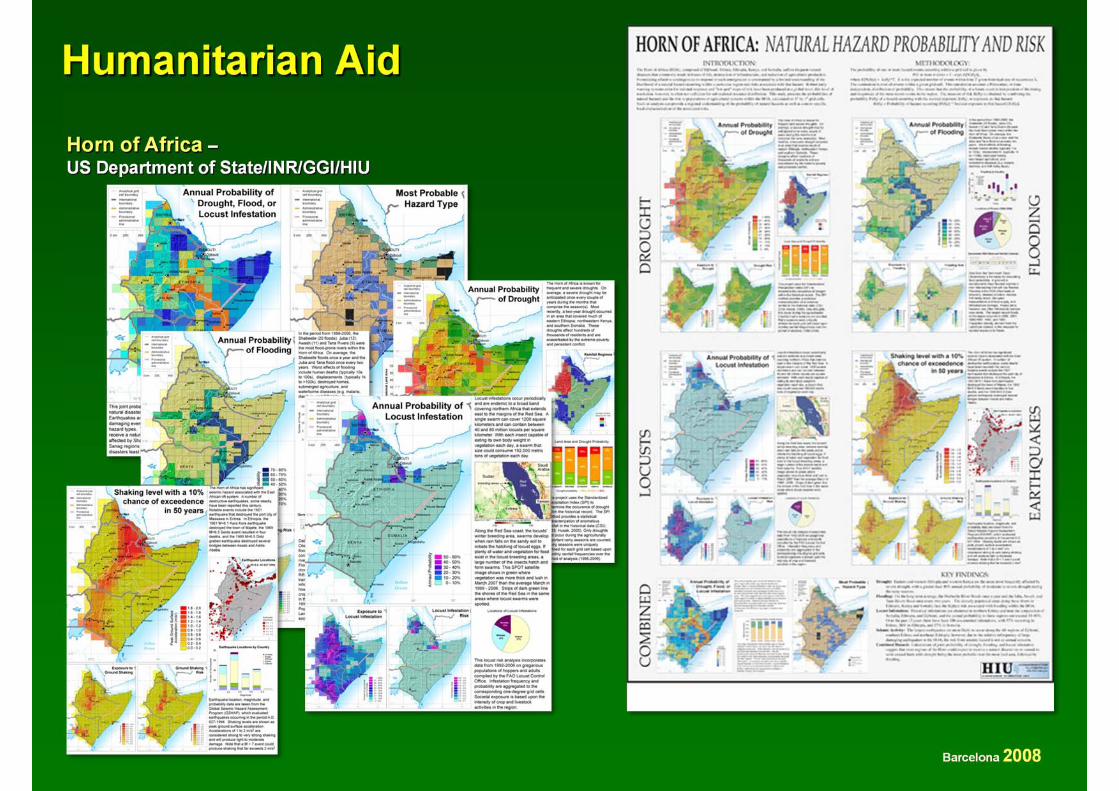
Humanitarian aid provided by the U.S. Department of State in the Horn of Africa
is concerned with the potential interaction of drought, locusts, flooding and
earthquakes, providing measures of the probability by hazard type to provide
policy guidance for assistance in this area.
Humanitarian aid for water supplies in Afghanistan. This is the frequently
minimized side of the U.S. Department of Defense using mobile GIS in identifying
the needs and building the facilities for water supply in Afghanistan.
The Press Response
The Press takes note of geography in action. There has been a series of
newspaper headlines concerning GIS utilization in city operations, police
department activities, real estate transactions, riverine studies and so on.
Humanitarian Aid
Barcelona 2008
Cyclone Sidr, Bangladesh

Humanitarian Aid
Barcelona 2008
Greek Wildfires – USAID – Office of Foreign Disaster Assistance
Humanitarian Aid
Barcelona 2008
Horn of Africa –US Department of State/INR/GGI/HIU

Humanitarian Aid
Barcelona 2008

GIS: Geography in Action
Barcelona 2008
TOMLINSON ASSOCIATES
9
Commercial Applications
Commercial store locations give the illustration of increasing use of geography in
the business community, analyzing how specific retail outlets are located with
respect to the drive distance in mile from their nearest competitors and the
subsequent analysis of areas with access to more than one store to ensure that
new store locations do not compete in the trade area of existing stores.

Commercial Store Locations
Barcelona 2008
Showing retailers how to beat the competition . . . without competing with themselves

TOMLINSON ASSOCIATES
10
Summary
GIS combines the ability to manage stores of geographical data, perform spatial
analysis and modeling to visualize the output and disseminate the results and
methods.
It is not surprising that GIS and geographical analysis are being widely used. But the
diffusion of geographical analysis methodology throughout the real world is quite
remarkable. Based on GIS licensing records, there are few countries or government
departments in the world that area not using GIS. At least 5 million people in over
300,000 institutions in over 155 countries are doing geography using geographical
methods in their work daily.
The largest campuses investigating geographical analysis are not in academia but are
in the private sector. The ESRI company alone, in Redlands, California, has 4,000
worldwide employees, 100 Ph. D.s, 1,500 Masters, and adds 500 new graduates each
year.
Using the assumption that every $1 million of investment of data and GIS systems
requires at least one trained person to for the investment to be used effectively, then
there is shortfall of at least 3,000 trained people per year in North America alone,
compared to the output from all universities and technical colleges in North America.
Students are realizing that geography offers career opportunities and interesting jobs
throughout the working world.
Interest in the discipline is everywhere growing. Academic geography may be
splintering into quasi-named departments and sub-specialties, but students who are
trained in geographical analysis and can use the modern tools of GIS are in high
demand. The growth of this interest is exemplified in the growth of the Association of
American Geographers which has increased significantly in size (by 50%) in the past

TOMLINSON ASSOCIATES
11
decade alone and whose yearly conferences are attended by more people than ever
before.
. ASSOCIATION OF AMERICAN GEOGRAPHERS
Growth in Membership
1998 - 6,910 1999 - 6,527 2000 - 6,497 2001 - 6,731 2002 - 7,004 2003 - 8,475 2004 - 9,041 2005 - 9,478 2006 - 10,086 2007 - 10,346
Similarly indicative is the reintroduction of Geography at Harvard after an absence of 60
years in the new Center for Geographical Analysis .At its inauguration the President of
Harvard said “Geographic Information Systems will let us change the nature of
questions that are asked in a wide diversity of science and humanity”
Indeed a wide variety of problems have already been illustrated and are being
addressed, but a wide variety of broad-based issues demand the attention of
geographers.
There is a geography of security and terrorism that is multifaceted and comparatively
little researched and understood, in spite of the fact that it could contribute enormously
to this pressing problem. There is great scope in this area for the development of
critical theories to examine alternative geographies.
The extensive development of quantitative geography in the 1960s and 1970s
addressing the problems of analyzing and modeling space need to be integrated with
the GIS capabilities of today and brought together to develop wider and more generally
applicable models of geographic space and time focusing on interactions and dynamics.

TOMLINSON ASSOCIATES
12
We still have no adequate models for major cities, much less for the world itself. I am
convinced that we will have, or at very least our grandchildren will have, but there are
many research questions that remain to be investigated on the way to creating Al
Gore’s “digital earth”. There are questions that touch on many aspects of geography,
including representation, efficiency of information management, appropriate scientific
visualization of issues, applications, and policy implications. I have no doubt that GIS
will be at the core of this progress and that the future will be rich and productive.
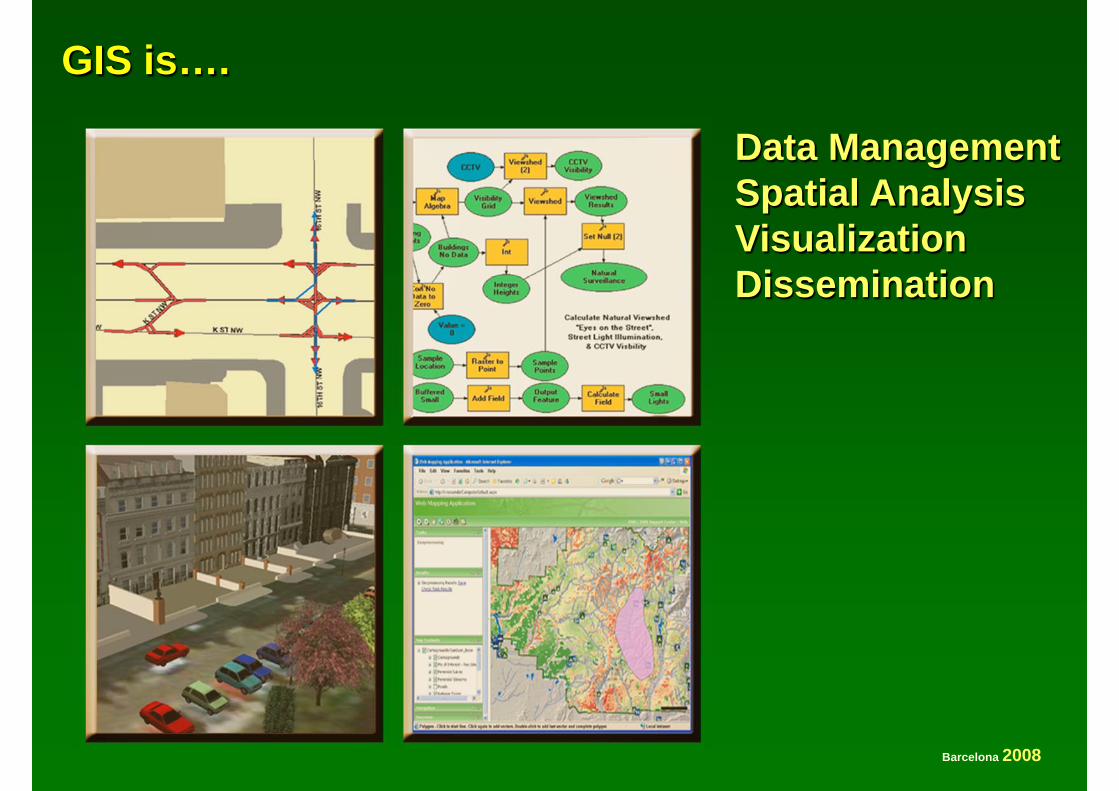
GIS is….
Barcelona 2008
Data ManagementSpatial AnalysisVisualizationDissemination

ASSOCIATION OF AMERICAN GEOGRAPHERSGrowth in Membership
1998 - 6,910
1999 - 6,527
2000 - 6,497
2001 - 6,731
2002 - 7,004
2003 - 8,475
2004 - 9,041
2005 - 9,478
2006 - 10,086
2007 - 10,346Barcelona 2008

BIOGRAFÍA DE ROGER F. TOMLINSON Roger F. Tomlinson CM, B.Sc., M.Sc., Ph.D., D.Sc. (h.c.) nascut el 17 de novembre de 1933, geògraf, va ser el creador del primer Sistema d’Informació Geogràfica (SIG). El Doctor Tomlinson va néixer a Cambridge, i abans d’anar a la universitat va servir a la Royal Air Force des del 1951 fins al 1954 com a pilot i oficial aeri. Després del servei militar, el Doctor Tomlinson va estudiar a la University of Nottingham i a la Acadia University en dues diplomatures en geografia i geologia respectivament. Va obtenir el títol de Master en Geografia per la McGill University on es va especialitzar en la geomorfologia glaciar del Labrador. La seva tesis doctoral a la University College London va ser titulada :” The application of electronic computing methods and techniques to the storage, compilation, and assessment of mapped data.” Els seus primers passos professionals van ser com a professor a l’Acadia University, treballant com a cap de la divisió de cartografia digital a la Spartan Air Services a Ottawa, Ontario (continuant amb els seus estudis a la McGill University), i treballant amb el govern del Canadà, primer com a consultor i després com a director del pla de sistemes regionals amb el Departament Forestal i Desenvolupament Rural (Department of Forestry and Rural Development). Va ser durant la seva col·laboració amb el govern federal a la dècada dels 60 quan el doctor Tomlimson va iniciar, planificar i dirigir el desenvolupament de la “Canada Geographic Information System”, el primer SIG de la història. Des de la dècada del 1970 fins a l’actualitat, el Dr. Tomlinson ha treballat com a consultor per diferents sectors privats, governs i ONG’s, mitjançant la seva companyia amb seu principal a Ottawa, Tomlinson’s Associates Ltd., i amb seus a Canada, Austràlia i Estats Units. Va ser president de la International Geographical Union GIS Commission durant dotze anys. Com a president del l’IGU Global Database Planning Project, l’any 1988, va ser pioner en l’introducció del concepte de l’accés universal a dades geogràfiques. Com a president de la Canadian Association of Geographers va rebre el guardó en honor al servei a la seva profesió (Service to the Profession). La Associació Americana de Geògrafs (Association of American Geographers) dels Estats Units va otorgar- li el premi “James R. Anderson Medal of Honor for Applied Geography” l’any 1995 i va ser el primer en rebre el premi “Robert T. Aangeenbrug Distinguished Career Award” l’any 2005. El Dr. Tomlimson és membre honorífic de la “Royal Geographical Society” i guanyador del seu guardó “Murchinson Award” pel Desenvolupament dels Sistemes d’Informació Geogràfica. L’any 1996 va ser premiat amb el “GIS World Lifetime Achievement Award” per la seva feina amb els Sistemes d’Informació Geogràfica i va rebre el primer “ESRI Lifetime Achievement Award” l’any 1997. Recentment, va entrar a formar part de la University College London i va rebre el Doctorat en Ciències per la University of Nottingham i la McGill University. Va ser premiat amb la medalla d’or de la Royal Canadian Geographical Society i amb l’ordre del Canadà pel Govern General per "changing the face of geography as a discipline."