changing international trade rules for textiles and …pdf.usaid.gov/pdf_docs/pnade945.pdf ·...
TRANSCRIPT

F I N A L R E P O R T
Changing International Trade Rules for Textiles and Apparel Egyptian Market Access
P R E P A R E D B Y ATR P ro j e c t S U B M I T T E D T O Ministry of Foreign Trade USAID/Cairo S U B M I T T E D B Y Nathan Associates U N D E R C O N T R A C T N O .PCE-I-00-98-00016 Task Order 827
January, 2004
w w w . n a t h a n i n c . c
i

This report was prepared through support provided by the U.S. Agency for International Development, under the terms of Contract No.PCE-I-00-98-00016-00 Task Order 827. The opinions expressed herein are those of the author(s) and do not necessarily reflect the views of the U.S. Agency for International Development

Acknowledgement The author would like to thank the staff of the Egyptian Ministry of Foreign Trade, WTO Division for their kind assistance, especially Ms. Imann Raffat and Mrs. Eman
Ahmed, who carried out calculations for the section on the impacts of quota elimination, and Mr. Ali El Nebway and Mrs. Heddy Amin, who assisted with the calculation of quota
premiums. The section on preferential trade agreements and EU rules of origin benefited
from discussions the author had with Mrs. Thanna Goher, Director General, Rules of Origin Department, Ministry of Foreign Trade. Finally, the author would like to thank all
of the staff of the USAID-Assistance for Trade Reform Project (ATR). All errors and omissions are the sole responsibility of the author.
Firms interviewed for the study included: Golden Tex Group Company; Wagdy Momen,
Weaving Mill; Swiss Garment Company (SGC); Misr American Carpet Mills; World Trading Company; Cotton and Textiles Holding Company; HayTex Weaving Compan;
Sahara Group; and Egyptian Company for Knit Wears.
i


Contents
Executive Summary v
1. Introduction 1
2. Quota Elimination in Major Developed Markets 5
A. Background 5
B. Impact of Textile and Apparel Quota Elimination on Egyptian Exports and Employment 11
3. Preferential Arrangements and Agreements 15
A. Background 15
B. EU and U.S. Preferences Contrasted 16
C. Implications of Expanding Preferential and Free Trade 20
4. WTO Zero-for-Zero Proposal 31
A. Background 31
B. Implications of Zero-for-Zero 33
5. Conclusion and Adjustment Strategies 41
A. Engaging in the Doha Round of Negotiations 42
B. Negotiating Free Trade Agreements 43
C. Liberalizing Egypt’s Domestic Textile and Apparel Markets 44
D. Focus on Value Chains 44
E. Regional Integration 46
F. Customs 46
G. Transportation 47
References 49
i

II
Contents (continued) Appendix A. Overview of Apparel Rules of Origin
Appendix B. EU Textiles and Apparel Import Data
Appendix C . EU Trade Agreement Partners and Beneficiaries
Appendix D. Sub-Saharan African Countries with AGOA Benefits
Appendix E. Data on U. S. Import Market Shares
Appendix F. Data on Egyptian Textile and Apparel Import Duties
Appendix G. Description of the Model
ILLUSTRATIONS
Tables
Table 2-1. Stages of ATC Textile and Clothing Quota Phase-out, U.S. and EU 5 Table 2-2. U.S. Imports of Textiles and Apparel from Egypt and U.S. Quota-Constrained
Suppliers 2002 7 Table 2-3. Export Tax Equivalent of Selected U.S. Textile and Apparel Quotas 2002 8 Table 2-4. EU Imports of Textiles and Apparel from Egypt and Quota-constrained Suppliers
2002 9 Table 2-5. Export Tax Equivalent of Selected EU Textile and Apparel Quotas 2002 10 Table 2-6. Impact of Quota Elimination on U.S. Imports from Egypt ($ million) 13 Table 2-7. Impact of Quota Elimination on EU Imports from the Egypt ($ million) 13 Table 3-1. Use of Benefits under U.S. Preferential Arrangements and Free Trade
Agreements, 2002 (US$ million) 17 Table 3-2. EU Preferential Trade Arrangements and Agreements and Benefits 18 Table 3-3. U.S. Preferential Trade Arrangements and Agreements and Corresponding
Benefits 19 Table 3-4. Euro-Med Partners and Association Agreements 22 Table 3-5. U.S. Preferential Trade Arrangements and Agreements Market Shares by
Product, 2002 26
III
Contents (continued) Table 3-6. Central American and Dominican Republic Preferential Access Under the
CBTPA, 2002 28 Table 4-1. Egypt’s Applied 2003 Duties, WTO Accession Commitments 35 Table 4-2. Percent of Egypt’s 2002 Imports by Product and Chief Fiber Type 36 Table 5-1. Ocean Vessel Shipping Time between Major U.S. and World Ports 48
Figures
Figure 2-1. EU and U.S. Imports of Textiles and Apparel from Egypt, 2002 6 Figure 3-1. EU Imports of Textiles and Apparel--Preferential Arrangements and
Agreements, 2002 20
Figure 3-2. U.S. Textiles and Apparel Imports--Preferential Arrangements and Agreements, 2002 20
Figure 3-3. U.S. Import Market Shares for Cotton Trousers and Shorts 1996-2003 25
Figure 3-4. U.S. Import Market Shares for Cotton Knit Shirts 1996-2003 26 Figure 4-1. Relative Labor Costs for Spinning and Weaving, Egypt and Selected Asian
Producers 38
Exhibits
Exhibit 3-1. Rules of Origin: The Fine Print of Trade Agreements 22 Exhibit 4-1. U.S. Proposal for a Tariff Free World in Textiles and Apparel (Zero-for-Zero) 32 Exhibit 4-2. What about Egyptian Cotton? 37


Executive Summary By January 2005, U.S. and EU textile and apparel quotas will be completely phased out,
which will produce considerable changes in these markets. While low-cost suppliers in Asia
will no longer confront a significant barrier to their exports, Egypt will lose the benefit of liberal quota access to U.S. and EU markets.1 Employment in Egypt’s textile and apparel
industries is projected to drop by 22,185 direct jobs (approximately 0.5% of industrial
employment), and shipments are expected to drop by US$203.9 million or about 4% of non-oil exports. This represents 19 percent of textile and apparel exports to these markets for
2002.
Losses in U.S. markets alone will equal $136.5 million in exports and 14,858 in direct jobs, totaling two-thirds of Egypt’s projected losses. In the EU market, Egypt will lose $67.3
million in exports and 7,327 direct jobs, making up the other one-third of total losses from
quota elimination. Apparel exports are at greatest risk of lost sales from quota elimination, with some product categories declining by 50 percent or more. Certain textile products such
as home furnishings and cotton yarns, however, exhibit the greatest resilience to quota
removal, with projected declines below the average of 19 percent.
Egypt’s losses in exports may worsen if EU and U.S. free trade negotiations continue to
expand the number of preferential suppliers. The United States has announced free trade
negotiations with no fewer than a dozen countries seeking permanent market access for textile and apparel products.2 These countries seek to match permanent duty-free access
with investment security and rapid response times on smaller orders to ensure their
positions in the evolving retail climate. By contrast, Egypt, which is not a party to free trade negotiations with the United States, will continue to face high average duties of 17 to 33
percent and an uncertain environment for investment.
The European Union also has been advancing agreements with preferential suppliers. Furthermore, 10 countries in Eastern Europe will accede to the European Union in May
2004. Unlike with the United States, Egypt does have preferential access to the EU market.
Egypt recently concluded a free trade agreement with the European Union that could pave
1 The primary benefits of Egyptian preferential access to the EU market are (1) reduced or zero duties and (2) unrestricted (quota-free) access for garments meeting the rule of origin. Because Egypt does not fill its U.S. textile and apparel quotas to more than 90 percent of their limit, it too benefits from liberal quota access to the U.S. market and restrictions on Asian producers.
v
2 On December 17, 2003, the United States announced the agreement of four Central American countries to a draft free trade agreement to be ratified in 2004.

VI INTERNATIONAL TRADE RULES FOR TEXTILES AND APPAREL
the way to improved market access. It is not likely, however, that the Euro-Med agreement
will provide improved export opportunities for Egyptian products unless Egypt adopts a strategy that integrates the textile and apparel industries within the Euro-Med region.
In contrast to other countries that are rapidly liberalizing their markets and realigning
themselves in the global marketplace, Egypt has fiercely protected its domestic market with often-prohibitive duties and non-tariff barriers on products of importance to Egyptian
producers. This has resulted in Egypt's tariff's being challenged as failing to meet WTO
commitments in these industries. Furthermore, as a result of this protective stance, large segments of Egypt’s domestic industry may be out of alignment with world production
standards for cost, quality, and service. The implications of current WTO proposals to
eliminate tariff and non-tariff barriers on textile and apparel products throughout the world would likely be devastating to Egyptian producers, whose exclusive focus is the domestic
market. If Egypt does not liberalize its domestic textile and apparel markets and transform
the industries to meet global standards, Egypt will have difficulty attracting the foreign investment necessary to maintain a position in the global market.
Egypt’s cotton textile-garment industry has two sub-sectors that have very different
characteristics and require different policies. Fine, high quality, light-weight, tightly woven, soft-to- the-touch fabric is made from the long and extra long-staple cotton grown
in Egypt. Most of these fabrics and the garments made from them are exported. They are
designer or quality branded shirts, blouses, and bed linens. In the world marketplace, quality-made garments from fine Egyptian cotton are the best that money can buy followed
by slightly inferior Pima cotton from the US and Indian cotton that is inferior to the US
Pima cotton. Consumers pay a high price for the products made from extra long-staple Egyptian cotton, providing manufacturers with good margins. Egypt, however, exports
more of the raw high quality cotton it grows than it actually uses in its local industry.
The other sub-sector that is important in Egypt is medium-grade apparel made from imported cotton or wool, yarn, and fabrics. These materials are knitted into fabrics for
casual wear, sportswear, underwear, etc., and are both sold domestically or exported. The
prices of these garments are relatively low, the margins are low, and global competition is high. This sub-sector has been protected by high tariffs that were reduced in January 2004,
and will be reduced further under free trade agreements.
The world market for apparel changes continually. According to a survey, U.S. apparel buyers plan to halve the number of producers from whom they source when the quotas
expire.3 These buyers have indicated their interest in the full-package capabilities of large
firms, such as design shops, floor-ready merchandise, and other value-added services4. This move would reduce opportunities for basic cut-make-and-trim operations and small and
medium enterprises and would require different market strategies. Adjusting to this new
trade environment may require adopting the following strategies:
3 U.S. Department of Commerce, Office of Textiles and Apparel. 4 Full-package services include design capabilities, logistics, fabric sourcing, product selection, and customer
service. Many Asian firms already offer these services, and their importance is expected to grow in a quota-free competitive environment.

EXECUTIVE SUMMARY VII
• Engage in the Doha Round of WTO negotiations to establish a rules-based trading system
with the goal of creating sustainable development and boost light industry and employment in smaller, less-developed countries;
• Participate in free trade negotiations and advance a strategy of regional trade built on
permanent market access, investment, short orders, and high levels of service;
• Cluster small and medium enterprises, improving coordination among themselves and
sharing resources and knowledge, to improve their competitiveness with large,
integrated textile firms, obtain access to capital, and partner with buyers;
• Develop a manufacturing strategy that integrates the often-conflicting strategies of
domestic producers, exporters, importers, and textile and apparel industries;
• Create a regional trade strategy by establishing a sourcing hub in Egypt and the region and improve producers’ knowledge of complex rules of origin;
• Automate customs procedures to meet new rules-of-origin documentation requirements
and rapid shipment needs for producers;
• Reduce transport and lead times while improving reliability by incorporating state-of-
the-art information technologies.
Textile producer countries that risk being marginalized as of 2005 are also in danger of losing an important light manufacturing industry—textiles and apparel.

1. Introduction The textile and garments sector is a key component of the Egyptian economy, contributing
approximately LE18.9 billion to GDP in 2001, representing approximately 2% of total
output or about 11% of the output of the manufacturing sector. It is also a significant employer, with 321,494 employees in 1998 accounting for roughly 8% of all industrial
workers or approximately 2% of total labor, including agricultural and government
workers.
In terms of exports, the textile and garments sector is second only to petroleum in its
importance to Egypt. In 2002, Egypt’s textile and garments exports amounted to US $801
million or approximately 13% of Egypt’s total exports in 2002. When figures for raw cotton exports are included, the 2002 figure for the cotton, garments and textile sector reaches
approximately 22% of Egypt’s total exports. The Egyptian government considers textiles
and apparel to be a priority sector because of its potential for expansion, not only in terms of current employment and export strength, but also because of its potential for
regenerating Egypt’s export dynamism.
Thus any threat to the sector deserves careful attention. On January 1, 2005, a significant threat to the sector will be implemented when the United States and the European Union
conclude a decade-long phase-out of textile and apparel quotas, ending nearly 45 years of
trade regulation and relative stability in these industries. Low-cost suppliers, principally in Asia, will benefit from the elimination of quotas, which have sharply constrained their
exports to the United States and the European Union. Meanwhile, Egypt, not currently
constrained by quotas, will encounter greater competition in its major export markets for many products. The elimination of textile and apparel quotas is projected to reduce Egypt’s
exports of these products to the United States by 29 percent and to the European Union by
14 percent. An important implication of these declines in shipments will be the loss of jobs these industries support.
At the same time that quotas are being eliminated, many countries are seeking shelter from
competitive Asian suppliers through preferential trade agreements and arrangements. They seek to match permanent duty free access with investment security and rapid response
times on small orders to ensure their positions in the major export markets. Average EU
and U.S. tariffs on cotton apparel from cost-competitive Asian suppliers will remain at 12 and 17 percent respectively; the waiver of these duties can provide a lifeline to less-
1

2 INTERNATIONAL TRADE RULES FOR TEXTILES AND APPAREL
competitive suppliers. The list of preferential competitors continues to grow:
• In 2001, 19 suppliers from sub-Saharan Africa received preferential access to U.S markets under the African Growth and Opportunity Act (AGOA);
• Suppliers in the Andean counties received preferential access to the United States in late
2002;
• Ratified in 2001, the U.S.-Jordan free trade agreement provides permanent duty free
access for Jordan to the United States and a source of competition to Egypt;
• Central American countries started negotiations with the United States for a free trade agreement in early 2003 and were recently joined by the Dominican Republic;5
• Three countries in the Andean group announced plans to negotiate a free trade
agreement with the United States in November 2003;
• The EU Everything But Arms arrangement eliminated duties on imports from least-
developed countries (LDC);
• Mexico concluded a free trade agreement with the European Union in 2002; and
• Ten Eastern European countries voted to accede to the European Union in 2004.
Low-cost producers in Asia and the growing number of preferential trade agreements force
Egypt to take action to ensure the viability of its textile and apparel industry.
Although Egypt recently ratified a free trade agreement with the European Union, Egypt
will be able to benefit from this agreement only with a regional export strategy. The
expansion of preferential trade among other countries will threaten Egypt’s exports. Egypt’s success will depend on its ability to move forward with a global and regional trade
strategy in textile and apparel products at home and abroad.
The rapidly changing trade environment will surely result in a world market that looks different than it does today. Textile and apparel buyers will be looking to reduce the
number of suppliers from which they purchase apparel.6 Buyers will seek suppliers who
can provide value-added services and broad product lines. Egyptian suppliers can take the following steps to meet these challenges:
• Engage in the Doha Round of negotiations to improve market access and rules-based
trade regimes
• Negotiate free trade agreements to move ahead with regional trade integration
• Develop a national trade and industry strategy that integrates and harmonizes the often-
conflicting strategies of textile and apparel producers
• Incorporate up-to-date information technologies in marketing and resource planning
systems
5 The U.S. recently announced agreement with four Central American countries on a draft free trade agreement to be ratified in 2004. The Dominican Republic and Costa Rica are expected to join soon.
6 A U.S. department of commerce survey concluded U.S. buyers would reduce by one-half the number of suppliers they currently buy from soon after the elimination of quotas.

INTRODUCTION 3
• Increase textile and dyeing capacities to meet strict rule-of-origin requirements
• Enhance Egyptian producers and officials knowledge of regional fabric sources
• Streamline customs processes to meet the challenges of new U.S. and EU antiterrorism
procedures.
Egyptian producers would benefit from developing a strategy to respond to the new retail environment emphasizing low inventories and fast turnaround. The Egyptian government
can formulate a national strategy and lines of action supporting the integration of the textile
and apparel industries into global value chains rather than continuing to focus on local markets and following the path of isolation, high cost, and low productivity. The goal of
government policy can be to present a clear predictable framework within which workers,
producers, and investors can feel confident in their undertakings. In this way, Egypt can promote long-term growth by consolidating a secure place in the global textile and apparel
market.
In the following chapters, we first estimate the potential impact of quota elimination on Egyptian exports to the European Union and United States on a product-specific basis.
Next, we assess the potential effects of preferential trade arrangements and agreements on
Egypt in both the EU and U.S. markets. Finally, we conduct a review of the Egyptian domestic textile and apparel industries in relation to the WTO zero-for-zero proposals on
textiles and apparel. In the concluding chapter, we review several strategies that place
Egypt in line with global trends dominating production and competitiveness in key employment-generating industries.


2. Quota Elimination in Major Developed Markets
A. Background
Trade-distorting quotas have governed the textiles and clothing industries for most of the
past half century. The WTO’s Agreement on Textiles and Clothing (ATC), negotiated
during the Uruguay Round and effective January 1995, is the basis for reintegrating textiles and apparel into the world trading system, which generally prohibits non-tariff barriers
such as quotas. Under the ATC, the 10-year, four-stage transition to quota-free textile and
apparel trade will end December 31, 2004 (Table 2-1).
Table 2-1 Stages of ATC Textile and Clothing Quota Phase-out, U.S. and EU
Stage % of U.S. Textile and Apparel Trade to Be
Free of Quota a Annual % increase in quota
growth levels
I. 1995−1997 16 16
II. 1998−2001 17 25
III. 2002−2004 18 27
IV. 2005 (final) 49 No quotas left
a Based on 1990 quantities
SOURCE: U.S. Department of Commerce Office of Textiles and Apparel: http://otexa.ita.doc.gov.
The first two stages of quota elimination (1995–1997 and 1998–2001) had no sizeable effect on either exporting or importing markets because quotas were removed principally from
products that had not been constrained by the quotas, so imports were generally below
quota levels. Changes during the third stage, 2002–2004, are expected to have substantial effects, however. Tariff lines accounting for 49 percent of trade, including the most
restrictive quota categories (based on 1990 import volume), will be liberalized only in the
tenth year.
Knowing which product categories and countries are quota-constrained and which are not
5

6 INTERNATIONAL TRADE RULES FOR TEXTILES AND APPAREL
is crucial to understanding how Egypt will fare in the final stage of quota elimination.
Many countries and products are included in the quota system, but only a small number are actually constrained by quotas because many countries, including Egypt, do not
completely fill their quotas.7 Eliminating an unfilled, non-constraining quota has little effect
on a country’s ability to export because the country could have continued to export until reaching the quota in any case. However, when a constraining quota is removed, non-
constrained producers experience a marked increase in competition from exports by
previously constrained competitors.
Today, 84 percent of Egypt’s exports of textiles and clothing are in categories for which it
will confront increasing competition when quotas are eliminated on constrained suppliers
on January 1, 2005.8 The remaining 16 percent of exports are product groups for which the United States and the European Union do not have quotas or for which quotas are not
constraining.9
Although the U.S. and EU markets are of similar size, the composition of exports differs in important ways (Figure 2-1.). Egypt’s exports to the United States are concentrated in the
apparel sector (74 percent), whereas Egypt’s exports to the European Union are diversified
among yarn, fabric, apparel (52 percent), and home furnishings. Egypt’s dependence on a relatively narrow range of apparel exports to the United States makes it particularly
vulnerable to the elimination of quotas in that market.
Figure 2-1 EU and U.S. Imports of Textiles and Apparel from Egypt, 2002
SOURCE: EuroStat and OTEXA data. Compilations by the author and the Egyptian Ministry of Foreign Trade (MOFT).
7A quota is considered constraining if it is 85–90 percent filled because complexities in the quota management system can make it difficult to fill a quota completely (USITC 2002).
8 Egypt’s exports to the U.S. and EU markets make up about 85 percent of its textiles and clothing exports. Approximately 13 percent goes to Asia, with the remaining 2 percent going to the rest of the world.
9 The overwhelming majority of Egyptian products not affected by the removal of U.S. and EU quotas are wool and synthetic carpets and rugs.

QUOTA ELIMINATION IN MAJOR DEVELOPED MARKETS 7
U.S. MARKET
The U.S market for Egypt’s textile and clothing exports is more vulnerable than the EU
market. Of the $472 million in 2002 exports to the United States, 88 percent was in categories in which competitive suppliers in Asia were constrained by quotas (Table 2-2).
U.S. textiles and apparel quotas constrain 13 countries on average in each category.
Considerable variation exists in the number of countries quota-constrained. For cotton trousers and knit shirts 16 and 17 countries respectively are quota-constrained. Meanwhile,
only three cotton yarn exporters to the United States were quota-constrained.
Another factor influencing the impact of quota elimination is the market share of quota-constrained producers. Considering only product categories that are constrained by quotas,
quota-constrained producers have, on average, one-third of the market share of U.S.
imports. Again, considerable variation exists by product. Synthetic-fiber coats and trousers and cotton coats lead in categories based in the market shares of quota-constrained
importers—all approximately 50 percent of U.S. imports. In contrast, quota-constrained
imports of cotton yarn represent just 9 percent of U.S. imports.
Table 2-2 U.S. Imports of Textiles and Apparel from Egypt and U.S. Quota-Constrained Suppliers 2002
U.S. Imports from Egypt 2002 Constrained Suppliers
Quota Category Product
Value (US$1,000)
Percent of Egyptian
Trade
Number of Countries
Constrained by Quotas a
Percent of U.S. Imports
Constrained by Quota
347/348 Cotton trousers 176,318 37.2 16 32.5
338/339 Cotton knit shirts 79,499 16.8 17 36.3
300/301 Cotton yarn 29,165 6.2 3 9.0
340/341 Cotton woven shirts 19,927 4.2 8 45.4
635/634 Synthetic fiber coats 19,446 4.1 12 52.2
647/648 Synthetic fiber trousers 8,930 1.9 16 47.9
334/335 Cotton coats 7,698 1.6 12 47.7
340/341 Synthetic fiber knit shirts 5,344 1.1 8 25.8
-- Other quota-constrained 70,636 14.9 23 30.0
Subtotal constrained 416,963 88.0 13 33.2
Unconstrained 55,952 12.0 -- --
Total 472,926 100.0 -- --
SOURCE: U.S. Department of Commerce, Office of Textiles and Apparel. Calculations by author.
a A country is defined as quota-constrained if it filled its quota by 90% or more.
Figure 2-1 illustrated that three-quarters of Egypt’s exports of textile and apparel products to the United States are apparel. Breaking that down further, 55 percent of Egypt’s apparel
exports to the United States are in just two apparel categories—cotton trousers and cotton

8 INTERNATIONAL TRADE RULES FOR TEXTILES AND APPAREL
knit shirts. The lack of diversity presents a high risk, because these categories benefit from
tight U.S. quotas constraining 16 and 17 Asian countries respectively. One clear way Egyptian exporters could reduce the impacts of quota elimination is to diversify into
products for which quotas are not currently an important determinant of market access.
Egyptian exports not facing increased competition from quota elimination include synthetic and wool carpets10 and babies’ garments.
The cost of quotas to constrained exporters provides a final measure of the restrictive extent
of quotas. Because the European Union and United States allow exporting countries to administer their quota systems, including the revenue obtained from quota allocation, it is
possible to calculate the cost of quotas to exporters in quota-constrained countries. In this
case, the quota can be compared to an export tax. Limited (constraining) quotas combined with low-cost production generally result in high quota costs as producers bid up prices to
obtain the license to export under the quota. Some countries, including China and Hong
Kong, sell their quotas on the open market and the costs are directly observed. For other countries, the quota costs must be inferred from other data sources (Francois et al. 2000).
Estimates of export tax equivalents of U.S. textile and apparel quotas presented in Table 2-3
often exceed the most-favored nation (MFN) duty.11 Therefore, the elimination of quotas will have an impact equal to or greater than the elimination of duties on Asian suppliers.
Table 2-3 Export Tax Equivalent of Selected U.S. Textile and Apparel Quotas 2002
Cost of Purchasing Asian Quotas as a Percent of Factory Costs
Quota Cate-gory Description China
Weighted Average of Constrained
Countries
Trade weighted MFN Duty
347/348 Cotton trousers 63.6 21.3 16.6%
338/339 Cotton knit shirts 60.3 19.4 17.9%
300/301 Cotton yarn -- 31.6 7.6%
340/341 Cotton woven shirts 50.3 26.3 18.2%
635/634 Synthetic coats 21.1 13.1 15.2%
647/648 Synthetic trousers 27.7 14.8 9.3%
239 Babies' garments cloth. access a. 191.9 -- 10.4%
369 Other cotton manufactures 20.0 -- 6.2%
334/335 Cotton coats 33.3 22.8 11.0%
638/639 Synthetic knit shirts 46.7 20.6 32.2%
SOURCE: Author's and MOFT calculations.
a Most quotas on baby garments were removed in the second and third stages of quota removal, however, a small number of quotas remained on several products lines of importance to the U.S. industry.
10 Egyptian producers revealed in interviews that they fill a niche market for specialty rugs using propriety production techniques and design capabilities that are only recently being replicated by Asian producers.
11 MFN duties are extended to all WTO members.

QUOTA ELIMINATION IN MAJOR DEVELOPED MARKETS 9
Interestingly, U.S. export tax equivalents on China are more than double the average for all
countries. This result is consistent with U.S. textile quota data for China that show low (sometimes negative) quota growth rates for Chinese goods since 1996. The conclusion,
therefore, is that China’s role in the U.S. market could increase dramatically with the
removal of U.S. quotas. China’s role in U.S. markets has to be considered carefully because its WTO accession agreement provides for textile and apparel–specific safeguards.
EU MARKET
The European Union is Egypt’s most important market for textile and apparel exports.
Products to be affected by the elimination of EU quotas comprise 81 percent of this trade (Table 2-4).
Table 2-4 EU Imports of Textiles and Apparel from Egypt and Quota-constrained Suppliers 2002
EU Imports from Egypt Quota-constrained Suppliersa
Quota Cate-gory Product
Value (Euros 1,000)
Percent of Egyptian
Trade
No. of Countries
Quota-constrained
Percent of EU Imports from Constrained
Suppliers
4 T-shirts lightweight fine knit roll polo or turtle necked jumpers and pullovers
88,190 16.7 4 16.2
1 Cotton yarn not put up for retail sale 83,837 15.9 2 23.2
13 Men's or boys' underpants and briefs cotton or MMF Knit
52,452 9.9 2 28.6
9 Terry toweling and similar woven terry fabrics of cotton; toilet linen
24,707 4.7 2 21.7
6 Cotton and MMF trousers and shorts 24,697 4.7 12 21.7
20 Bed linen other than knit 22,965 4.3 2 39.4
39 Table linen other than knit or Terry 22,724 4.3 1 39.4
2 Woven fabrics of cotton other than gauze terry fabrics pile fabrics
19,597 3.7 2 16.6
68 Babies' garments and clothing accessories other than knit c
15,123 2.9 1 0.7
35 Woven Fabrics of Synthetic Fibers 13,483 2.6 2 10.8
Other All other constrained b 59,960 11.4 11 24.2
Subtotal quota-constrained 427,735 81.0 4 22.6
Unconstrained 81,270 19.0 N\A N\A
Total 509,005
SOURCE: Europa statistics for quota fill rates. Trade data from EuroStat. Calculations by author. a A country is defined as quota-constrained if it filled its quota by 90% or more. b Number of countries quota-constrained represents the largest single number of countries quota-constrained for a category in which Egypt exports.
c Under the ATC, baby garments were integrated in earlier years, current quotas are against non-WTO Members.

10 INTERNATIONAL TRADE RULES FOR TEXTILES AND APPAREL
On average, EU quotas constrain four countries in each product category, far fewer than the
average of 13 in the U.S. market. Like in the United States, considerable variation exists among EU product categories. On the high side, twelve countries exporting trousers to the
European Union are quota-constrained whereas on the low side, only two suppliers of
cotton yarn (India and Pakistan) have their exports quota-constrained. In all cases, the producers constrained are major low-cost producers of textiles and apparel, most often
including China, Pakistan, India, and Vietnam.12
EU quotas not only constrain fewer countries than U.S. quotas, but the market shares of quota-constrained suppliers are lower. The average import market share of quota-
constrained importers in the European Union is 23 percent, nearly one-third lower than in
the United States (33 percent). The lower market shares of quota-constrained importers to the European Union will reduce the impacts of quota elimination. Table 2-5 illustrates the
export tax equivalent of EU quotas on constrained supplying countries.
Table 2-5 Export Tax Equivalent of Selected EU Textile and Apparel Quotas 2002
Cost of Purchasing Asian Quotas as a Percent of Factory Costs
Quota Cate-gory Description China
Weighted Average of Constrained
Countries
Trade-weighted MFN Duty
4 Shirts T-shirts lightweight fine knit roll polo or turtle necked jumpers and pullovers
19.4 23.2 12.0
1 Cotton yarn not put up for retail sale -- 53.6 4.0
13 Men's or boys' underpants and briefs cotton or synthetic knit
8.9 8.9 11.6
9 Terry toweling and similar woven terry fabrics of cotton; toilet linen
12.8 12.6 12.0
6 Cotton and synthetic trousers and shorts 40.1 19.0 12.1
20 Bed linen other than knit 9.3 11.8 12.0
39 Table linen other than knit other than terry 9.2 37.4 12.0
2 Woven fabrics of cotton other than gauze terry fabrics pile fabrics chenille fabrics tulle and other net fabrics
34.1 24.4 8.1
68 Babies' garments and clothing accessories other than knit
-- 15.9 11.5
35 Woven fabrics of synthetic fibers -- 9.8 8.1
SOURCE: Author's calculations.
The weighted average export tax equivalent of quotas exceeds the MFN duty. When quotas are eliminated, constrained suppliers will not need to pay this added cost and will improve
12 Vietnam, which is outside the WTO, is not entitled to ATC benefits, including the phasing-out of quotas. It is likely that quotas on Vietnam will remain after they have been eliminated for other countries.

QUOTA ELIMINATION IN MAJOR DEVELOPED MARKETS 11
their competitiveness vis-à-vis unconstrained producers such as Egypt. Table 2-5 also
indicates product categories that China may dominate—cotton and synthetic trousers and cotton woven fabrics—with average export tax equivalents of quotas exceeding the average
by a large margin. In other cases, such as cotton yarns and linens, significant competition is
expected to come from other Asian sources such as India and Pakistan.
B. Impact of Textile and Apparel Quota Elimination on Egyptian Exports and Employment
ASSUMPTIONS TO ESTIMATE IMPACTS
Many variables can affect the performance of an industry, and no economic model
attempting to estimate impacts of trade policies can account for all the possibilities generated in the course of everyday life. War, disease, and the threat of terrorism, for
example, all affect world trade. Several assumptions specific to the textile and apparel
industry also need to be made. One assumption is that long-term adjustments in the market have taken place. In the short term (approximately 1–3 years), buyers may be reluctant to
switch producers to diversify their sourcing base for fear of losing a reliable supplier.
Likewise, producers may sell products below cost for some time, expecting an improvement in market conditions. However, with the passage of time, buyers and
producers adapt. Buyers find new suppliers, and unprofitable producers go out of business.
(The partial equilibrium model used to make impact assessments is described briefly in Appendix F.)
The impact of quota elimination on Egypt will also depend on the assumed product mix on
January 1, 2005. For example, if Egyptian producers move toward exporting more yarn and fewer trousers to the United States, the impact of quota elimination will be reduced. The
simulation also assumes that the European Union and the United States do not apply trade
remedies such as antidumping duties or safeguards (such as those restricting U.S. and EU steel imports). It also assumes that Europe and the United States do not use safeguards
provided for in China’s WTO accession agreement. This point is of particular importance in
respect to the U.S. market, where China’s role will be more important than any other importing country (Table 2-3). Estimates of impacts show that between one-third and one-
half of Egyptian sales and employment losses will result from competition with China
alone. Therefore, this assumption must be given careful consideration.
China’s accession agreement to the WTO includes provisions that WTO members may
invoke in response to import surges of Chinese products.13 The most important of these is a
sector-specific safeguard affecting textiles and apparel that allows the United States to apply constraints on import surges that are “due to market disruption, threatening to
13 WTO Working Party Report on the Accession of China, paragraph 242 (a).

12 INTERNATIONAL TRADE RULES FOR TEXTILES AND APPAREL
impede the orderly development of trade in these textiles and apparel products.14 It
provides one year of protection and can be renewed after the restricted level of trade is increased by 7.5 percent. The textile and apparel safeguard will be available through 2008,
and China will not have a right to retaliate.15
ESTIMATED SHIPMENT IMPACTS
The effects of quota elimination on U.S. imports from Egypt are shown in Table 2-6. Total U.S. imports of textiles and garments from Egypt are projected to decline by 29 percent. The
effects are not shared equally among product groups. Shipments of cotton and synthetic
trousers are projected to decline by between 35 and 41 percent. This is in part because of the high export-tax estimates of the quotas for these products—cotton trousers have among the
highest—and the market shares of constrained suppliers. The impact on shipments of
cotton coats and cotton woven shirts will also be high, with shipments reduced by over 50 percent. Again, in this simulation, the large market share of quota-constrained suppliers,
coupled with high export tax premiums, greatly affected Egypt’s shipments.
The direct impact on U.S. imports of cotton yarn exhibits a high resilience to losses deriving from quota removal. This is, in part, due to the low market shares of quota-constrained
suppliers. However, the simulation result for cotton yarn needs to be considered carefully
with respect to the indirect losses that shipments of cotton yarn will undergo because of reduced demand in end products such as trousers, shirts, home furnishings, and industrial
textiles. Indirect losses to producing industries are not estimated here because calculating
such losses depends on knowing which U.S. producers and products use Egyptian yarns.16
The impact of quota removal on Egypt’s exports of textiles and apparel to the European
Union are shown in Table 2-7. Total export shipments are projected to decline 13.9 percent.
Impacts on specific products vary between a decline of 22.4 percent on cotton trousers and shorts to less than one percent on baby garments. The average impacts of quota removal on
the European Union are, in part, based on the relatively high prevalence of textiles and
home furnishing products, for which the impacts of quota elimination are on average lower (10 percent). Quotas on baby garments were largely eliminated in earlier years and so the
impacts in 2005 will be low, less than 1 percent.
The aggregate impact of all quota elimination is a decline in textile and garment exports of approximately $204 million or about 6% of manufactured exports.
14 WTO Working Party Report on the Accession of China, section 13. 15 A detailed discussion of safeguards included in China’s WTO accession agreement can be found in the
trade capacity building report by Nathan Associates and USAID titled “Changes in Global Trade Rules for Textiles and Apparel: Implications for Developing Countries,” Chapter 3 (Minor 2002).
16 U.S. producers of home furnishings, such as sheets, curtains, carpets, and industrial textiles are generally competitive and will not be heavily penalized by quota elimination, while U.S. production of apparel is expected to be negatively affected by quota removal.

QUOTA ELIMINATION IN MAJOR DEVELOPED MARKETS 13
Table 2-6 Impact of Quota Elimination on U.S. Imports from Egypt ($ thousands)
Impact of Quota Elimination Quota
Category Product U.S. Imports from Egypt,
2002 (US$1,000) Value Percent
347/348 Cotton trousers 176,318 -61,685 -35.0
338/339 Cotton knit shirts 79,499 -31,568 -39.7
300/301 Cotton yarn 29,165 -383 -1.3
340/341 Cotton woven shirts 19,927 -11,661 -58.5
635/634 Synthetic fiber coats 19,446 -6,364 -32.7
647/648 Synthetic fiber trousers 8,930 -3,732 -41.8
334/335 Cotton coats 7,698 -4,117 -53.5
340/341 Synthetic fiber knit shirts 5,344 -1,677 -31.4
-- Other 70,636 -15,355 -21.7
Total affected by quotas 416,963 -136,541 -32.7
Total unaffected by quotas 56,000 -- --
Total 472,963 -136,541 -28.9
SOURCE: Author's calculations from partial equilibrium model (see Appendix F for details).
Table 2-7 Impact of Quota Elimination on EU Imports from Egypt ($ million)
Impact of Quota Elimination Quota
Cate-gory Product
2002 EU Imports from Egypt
(US$ 1,000) Value Percent
4 Shirts T-shirts lightweight fine knit roll polo or turtle necked jumpers and pullovers
88,190 -18,255 -20.7
1 Cotton yarn not put up for retail sale 83,837 -11,905 -14.2
13 Men's or boys' underpants and briefs cotton or MMF Knit
52,452 -7,553 -14.4
9 Terry toweling and similar woven terry fabrics of cotton; toilet linen
24,707 -1,927 -7.8
6 Cotton and MMF Trousers and Shorts 24,697 -5,532 -22.4
20 Bed linen other than knit 22,965 -2,067 -9.0
39 Table linen other than knit other than terry 22,724 -1,136 -5.0
2 Woven fabrics of cotton other than gauze terry fabrics pile fabrics chenille fabrics tulle and other net fabrics
19,597 -1,783 -9.1
68 Babies' garments and clothing accessories other than knit
15,123 -91 -0.64
-- Other 148,645 -17,094 -11.50
Total all Products 502,937 -67,344 -13.90
SOURCE: Author's calculations from partial equilibrium model.

14 INTERNATIONAL TRADE RULES FOR TEXTILES AND APPAREL
ESTIMATED EMPLOYMENT IMPACTS
Employment data in Egypt’s textile and apparel industries have been collected according to
the International Standard Industry Classification (ISIC) system. ISIC categorizes output according to the primary activity of an establishment. Because the textile and apparel
industries are often, but not always, conducted on the same premises, difficulties in
classifying employment and output between theses two industries are inevitable. For example, many knit garment producers produce their own fabric in the same factory where
the cutting and sewing of garments takes place. Because the value added in knitting and
dyeing is usually greater than in cutting and sewing, the value added and employment of cutting and sewing are categorized by the primary activity—the manufacture of textiles, not
apparel. The distinction is further blurred because many Egyptian textile and apparel
producers are state owned and under the same establishment (management). Therefore, an estimate of employment impacts must be generalized to total textile and apparel
employment.
The estimated impact of quota elimination on direct employment in the Egyptian textile and apparel industries, according to an output-to-employment ratio derived from 1998
CAPMAS data, is 22,185 direct jobs, or about 7 percent of total textile and apparel
employment of 321,494 jobs (in 1998) or less than 0.5% of total employment. These estimates may be conservative because quota elimination will affect labor-intensive products, such as
trousers and shirts, more than capital-intensive textile products, such as fabric and yarns.
These estimates do not include indirect employment losses in other sectors that depend on exports of textiles and apparel, such as utilities, transportation, and services. Additional
jobs will also be lost in the informal sector (such as childcare and street vending) that
employees of apparel firms support. Indirect employment in other countries is often estimated to be two to three times the direct employment levels.

3. Preferential Arrangements and Agreements
A. Background
In anticipation of impending quota elimination, many countries are seeking shelter from
competitive Asian suppliers through preferential trade agreements and arrangements. They
seek to match permanent duty free access with investment security and rapid response times on small orders to ensure their positions in the major export markets. Average EU
and U.S. tariffs on cotton apparel from cost-competitive Asian suppliers will remain at 12
and 17 percent respectively; the waiver of these duties can provide a lifeline to less-competitive suppliers. Non-preferential importers face significantly higher duties and/or
restrictive quotas (the margin of preference) than preferential suppliers.17 Several trends
indicate the rapidly changing benefits from preferential access:
• Liberalization of quotas (as with the ATC);
• Tariff reductions;
• Increasing numbers of preferential suppliers; and • Changing rules of origin.
The landscape of preferential trade is shifting, and successful exporters must re-evaluate
and leverage their competitive positions accordingly. Current average MFN duties on selected cotton textile and apparel products are presented below.
Product European Union United States
Yarn 4.0 6.2
Fabric or sheeting 8.0 7.6
Knit shirts 12.0 17.8
Trousers 12.0 16.7
15
17 In the case of textiles and apparel products, the margin of preference is usually the MFN duty plus the tariff equivalent of quotas. Therefore, the elimination of EU and U.S. quotas will eliminate a margin of preference provided to Egyptian producers, which do not face restrictive quotas.
16 INTERNATIONAL TRADE RULES FOR TEXTILES AND APPAREL
Peak U.S. duties on apparel reach 32 percent, but these high duties apply principally to
products made of synthetic materials. Peak duties on chiefly cotton knit apparel are 24 percent and on chiefly cotton woven apparel, 20 percent.
A complex net of preferential agreements and arrangements provides access to U.S. and EU
textile and apparel markets. Some are reciprocal free trade agreements in which partner countries agree to open their markets to each other. Others are preferential trading
arrangements, usually between developed and developing countries, such as the
Generalized System of Preferences (GSP) and the European Union’s Cotonou Agreement⎯the successor to the Lome Convention and the European Cooperation
Agreements.18 A third type of arrangement, production-sharing arrangements, provides
unilateral market access to a developed country with benefits defined for a limited time. Producers taking advantage of production-sharing agreements frequently seek short-term
benefits from the “assembly” of apparel parts cut in the importing country. All of these
types of agreements have proliferated in recent years in both the U.S. and EU markets.19
Since 1977, Egypt has maintained preferential quota and duty access to the EU markets for
textiles and apparel under the EU Cooperation Agreement. Egypt does not enjoy
preferential duty access to the United States, but has not been significantly constrained by U.S. quotas since 2000, when its quotas for important products were increased beyond
binding levels achieved in 1999.20
B. EU and U.S. Preferences Contrasted
Significant differences exist between the preferences granted by the European Union and
the United States. First, the margins of preference offered by duties and quotas in the two markets differ substantially. U.S. quotas on Asian suppliers were, on average, 50 percent
more restrictive than EU quotas in 2002. Similarly, as the data show, U.S. duties on textiles
are, on average, 33 percent higher than EU duties and 50 percent higher on apparel. Secondly, preferential access to the U.S. market is granted to fewer countries (Tables 3-2
and 3-3). The gap between preferential and non-preferential suppliers (such as Egypt) in the
United States is considerably greater then the gap in the European Union. In other words, EU preferential benefits are less important than U.S. preferential benefits.
18 The United States does not generally include textiles and apparel in its GSP program, but institutes special acts of Congress that provide textile and apparel benefits to specified countries. This stands in contrast to the EU program that excludes only a limited number of countries (including China, Taiwan, and South Korea) from its GSP program for textiles and apparel. Furthermore, the EU Everything But Arms program is a subset of GSP provisions only for designated least-developed countries.
19 With the expansion of association agreements in the Pan-Euro area, production-sharing arrangements have declined in importance. The U.S. industry has, likewise, begun to move away from production sharing in the CBTPA and ATPDEA arrangements, which shift the production of certain textile manufacturing capabilities to those regions (especially knitting). Despite this shift toward regional production, production sharing remains important in the global textile and apparel trades.
20 In 2000, Egypt filled its quota on cotton knit shirts (338/339). In 1999, Egypt filled several quota categories including cotton trousers, knit shirts, and cotton yarn.

PREFERENTIAL ARRANGEMENTS AND AGREEMENTS 17
A final contrast between the two markets is that U.S. preferential trade arrangements
generally exclude textiles (yarns, fabrics, and home furnishings) from duty benefits (table 3-1).21 So, although Egypt is excluded from preferential duty access to the U.S. textile market,
many other preferential suppliers are too. In fact, only free trade partners with significant
textile capacities (Mexico and Canada) benefit significantly from duty and quota free access to U.S. textile markets. The European Union provides preferential access to its textile
markets for a broad range of less-developed countries meeting the rule of origin, yet
excludes several large textile producers from having preferential access to its textile market.
Rules of origin for textiles require significantly greater levels of investment and technical
knowledge than those required for apparel production, and many less-developed countries
lack the capacity to meet rules of origin for textiles (Brenton 2003). Egypt is one of very few developing countries22 outside Asia that can meet strict rules of origin for textile yarns and
fabrics to benefit from quota and tariff preferences. Whether or not Egypt can leverage this
advantage depends on the price and quality of Egyptian products and the ability of the Egyptian government to gain preferential status for Egyptian products. (Egyptian textiles
are not qualified for use by lesser-developed countries, and the current status of EU
cumulation rules exclude Egyptian textiles from preferential access through third-country, Euro-Med producers or Eastern Europe.)
Preferential access programs for apparel are of greater concern for Egyptian exporters than
are programs for textiles. As we have seen, duties on apparel products of export interest to Egypt are higher than duties for textile products. Also, a broader range of countries can
claim preferential access to the EU and U.S. apparel markets. These include exporters under
both preferential arrangements and free trade agreements (see Tables 3-2 and 3-3). The result of these two facts is that a non-preferential apparel supplier (such as Egypt in the U.S.
market) encounters a significant disadvantage in market access. When a producer does
receive preferential status, the benefits are lesser because of the number of countries receiving preferences (as is the case of Egypt in the EU market for apparel).
Table 3-1 Use of Benefits under U.S. Preferential Arrangements and Free Trade Agreements, 2002 (US$ million)
General Imports a Preferential Arrangementsb Free Trade Agreementsc
Product Total Value of Imports Value Share Value Share Value Share
Textiles 16,065 12,285 76% 197 1% 3,584 22%
Apparel 63,715 48,401 76% 7,483 12% 7,831 12%
SOURCE: Author's calculations from U.S. Department of Commerce data. a No duty preference. b Include AGOA, CBTPA, ATPDEA, and QIZ. c Include NAFTA, U.S.-Israel, and U.S.-Jordan.
21 Exceptions are made for certain folk law items and hand-loomed textiles. 22 Other significant producers of textiles outside Asia include South Africa, Mauritius, Turkey, Mexico,
Brazil and Colombia.

18 INTERNATIONAL TRADE RULES FOR TEXTILES AND APPAREL
Table 3-2 EU Preferential Trade Arrangements and Agreements and Benefits
Benefitsa Cumulation
P R E F E R E N T I A L A R R A N G E M E N T S A N D A G R E E M E N T S
Generalized System of Preferences:b All developing countries except China, Taiwan, Hong Kong, Singapore and South Korea
20% duty reduction on qualifying textiles and apparel (Rules of Origin: double transformation; circular knit apparel require triple transformation)
Limited to four regional groups including ASEAN, CACM, Andean Community and SAARC
Everything But Arms: All least developed countries
Zero duty on qualifying textiles and apparel (Rules of Origin: double transformation; circular knit apparel require triple transformation)
None
Cooperation Agreements: Algeria, Egypt, Jordan, Lebanon, and Syria
Zero duty on qualifying textiles and apparel (Rules of Origin: double transformation; circular knit apparel require triple transformation)
Significant transformation (value added must exceed that of the imported inputs)
Cotonou Agreement: African, Caribbean and Pacific Countries (ACP)
Zero duty on qualifying textiles and apparel (Rules of Origin: double transformation; circular knit apparel require triple transformation)
Full cumulation among the ACP countries for most products
F R E E T R A D E A G R E E M E N T S
Europe Agreements: Bulgaria, the Czech Republic, Estonia, Hungary, Latvia, Lithuania, Poland, Romania, Slovakia, Slovenia
Zero duty on qualifying textiles and apparel (Rules of Origin: double transformation; circular knit apparel require triple transformation )
Pan-Euro Rules*
Euro-Mediterranean Association Agreements: Israel, Morocco, Palestinian Authority, Tunisia
Zero duty on qualifying textiles and apparel (Rules of Origin: double transformation; circular knit apparel require triple transformation)
Pan-Euro Rulesc and separate Bi-lateral rules (full cumulation for Tunisia and Morocco)
Other Free-Trade Agreements: Denmark (Faroe Islands), Iceland, Liechtenstein, Mexico, Norway, South Africa, Switzerland, Cyprus, Malta, Turkey
Zero duty on qualifying textiles and apparel (Rules of Origin: double transformation; circular knit apparel require triple transformation)
Pan-Euro Rules* for Eastern European and Mediterranean counties, Bilateral for all others (e.g., Mexico)
a The preferential EU rule of origin for apparel is generally single yarn forward for apparel (exceptions for artificial fibers and items of tubular knit are subject to more restrictive rules) and fiber forward for textiles.
b GSP generally applies to less developed countries; however, China, Hong Kong, Taiwan, Singapore and South Korea are specifically excluded from the enjoying EU GSP benefits in the textile and apparel sectors. Future revision of the EU GSP program will no doubt seek to “graduate” suppliers with competitive textile capacities.
c Pan-Euro rules of origin apply only if a partner is a signatory of the Pan-Euro Protocol of Origin.
Note: Least-developed countries have incomes below $1,200 per capita.
Double transformation requires that apparel be constructed of fabric knit or woven in the beneficiary countries; for textiles, double transformation requires that fabrics and yarns be spun, woven and knit in a beneficiary country.
SOURCE: WTO Secretariat and compilation by the author.

PREFERENTIAL ARRANGEMENTS AND AGREEMENTS 19
Table 3-3 U.S. Preferential Trade Arrangements and Agreements and Corresponding Benefits
Benefits Cumulation
P R E F E R E N T I A L A R R A N G E M E N T S A N D
A G R E E M E N T S a
CBERAb (Caribbean countries and Central America—excluding Belize)
Zero duty on apparel if constructed from U.S. woven fabrics; knit goods subject to a cap; short supply list
None
ATPDEAc (Peru, Colombia, Ecuador)
Zero duty on apparel if constructed from U.S. yarns and U.S. formed woven fabrics; knit goods constructed of local yarns subject to a cap; short supply list
None
AGOAd (there are over 30 AGOA countries, but only 19 have been approved for apparel benefits)
Zero duty on apparel. South Africa and Mauritius must use U.S. and regional originating yarns and fabrics (triple transformation). Least developed counties (LDCs) may use non-regional yarns and fabric subject to a cap; short supply lists (single transformation)
Among AGOA countries; least developed country provision provides for third country fabrics subject to a cap.
Qualified Industrial Zones (QIZ-Jordan, Israel, West Bank and Gaza)
Zero duty on qualifying apparel based on value added
Among the QIZs (mandatory use of Jordanian and Israeli value contents in designated proportions)
F R E E T R A D E A G R E E M E N T S
Mexico, Canada, Israel, Jordan, Chile,
Singapore
Duty and quota free for qualifying textiles and apparel; Rule of Origin: triple transformation (yarn originating) for most apparel products; fabrics double transformation (yarn forward) on cotton woven fabrics; triple transformation on cotton and synthetic knit products (fiber forward).f
Only among NAF TA countries-- United States, Mexico and Canada
a U.S. preferential trade agreements are permitted by the WTO enabling clause, which provides for GSP benefits. Therefore, U.S. preferential agreements are more accurately considered to be extensions of the U.S. GSP arrangement, made available to only specified countries in “enabling” legislation outside the General GSP scheme.
b CBERA-Caribbean Economic Recovery Act (2000)
c ATPDEA-Andean Trade Preference Act (2001);
dAGOA-African Growth and Opportunity Act (2000—but first textile benefit granted in 2001 see Appendix D); QIZ – 1996.
SOURCE: Author’s compilations.

20 INTERNATIONAL TRADE RULES FOR TEXTILES AND APPAREL
Figure 3-1 EU Imports of Textiles and Apparel--Preferential Arrangements and Agreements, 2002
Tunisia4%
Morocco4%
Turkey13%
Acceding13%
Association7%
Everything But Arms5%
Ordinary GSP and Non-Preferential Producers
49%
Egypt1%
FTAs3%
ACP1%
SOURCE: Author’s Calculations Based on Euro-Stat Data for 2002. Only products exported by Egypt are included in market share analysis.
Figure 3-2 U.S. Textiles and Apparel Imports--Preferential Arrangements and Agreements, 2002
Non-Preferential 77%
Egypt0%
AGOA1%
ATPDEA1%
NAFTA11%
QIZ1%
CAFTA9%
SOURCE: Author’s calculations based on OTEXA Data for 2002. Only products exported by Egypt are included in the market share analysis. CAFTA countries are the principal apparel exporters of the Caribbean (CBERA) region in negotiations for a free trade area with the United States. Egypt is not a preferential supplier to the U.S. market, but is listed for demonstrative purpose.
C. Implications of Expanding Preferential and Free Trade
The World Trade Organization estimated that 42 per cent of world trade takes place on a
preferential basis (1993–1997), and it is likely that the share is now close to 50 percent.23 The
impending elimination of textile and apparel quotas has given urgency to advancing
23 See the WTO home page for further analysis: www.wto.org/.

PREFERENTIAL ARRANGEMENTS AND AGREEMENTS 21
preferential trade agreements and arrangements for small producers that will not be able to
compete with large low-cost Asian producers. Countries such as Sri Lanka, Thailand, Morocco, and in Central America are seeking to secure permanent tariff-free access to the
major textile and apparel markets with improved rules of origin to enhance their
competitiveness.
In advance of the new wave of competition from Asia, the European Union has thrown a
lifeline to Eastern European and Mediterranean producers in the form of association
agreements (free trade agreements), accessions, and new Pan-Euro protocols of origin.24 These measures hold the promise of creating a regional industry, geographically close to
the core EU markets. Likewise, the United States is negotiating free trade agreements with
Central America, the Caribbean, and Africa, before quotas are eliminated.25 Like EU negotiators, U.S. negotiators are giving serious consideration to new rules of origin and
cumulation among its free trade partners.26
For Egypt, this trend both creates opportunities and poses threats. If Egypt does not engage in the progressive liberalization of textile and apparel trade at the regional or global level it
will risk becoming marginalized by the large exporters of Asia and the regional suppliers to
Europe and the United States. Attracting investment and technology will become a continual challenge.
EUROPEAN UNION
Egypt completed negotiations with the European Union for a Euro-Med Association
Agreement on June 25, 2001.27 The Euro-Med Association Agreement is a free trade agreement that provides permanent duty free access to the European Union for textiles and
apparel meeting rules of origin. The agreement requires Egypt to open its domestic textiles
and apparel markets to EU goods.28 Because Egypt currently enjoys duty free access under the Euro-Med Cooperation Agreement, the principal benefit of the association agreement
will be new rules of origin and a new investment climate that can attract long-term
investment.
Rules of origin define products (Exhibit 3-1) certified for preferential duties and hence the
products eligible for duty free treatment. The new Euro-Med Association Agreement
changes the Egypt-EU rule of origin by paving the way for Egypt to join the Pan-Euro
24 The Pan-Euro rules of origin were approved in the Protocol of Origin reached on July 7, 2003, in Palermo, Italy. The Euro-Med Association Agreements and the Protocol on Origin are integral parts of the Barcelona process initiated in 1995, which has the goal of creating a free trade bloc in the Euro-Med region.
25 http://www.ustr.gov/new/fta/. 26 The recently concluded free trade agreement between the United States and four Central American
countries includes a rule of cumulation permitting the use of NAFTA inputs. Products excluded from the U.S. general rules of origin can be found in the NAFTA sort supply list at www.doc\otexa.gov.
27 Although the negotiations were concluded and approved by the EU Parliament, ratification of the agreement by all member states of the EU-15 is still pending. The ratification of the agreement by all EU members is expected to require several years to complete. See http://www.eu-delegation.org.eg/EUEGAg.htm.
28 The Euro-Med Agreement will require Egypt to eliminate all non-tariff barriers, including import bans, immediately and then to phase out and eliminate duties on textiles and apparel over a period of 12 years.

22 INTERNATIONAL TRADE RULES FOR TEXTILES AND APPAREL
Protocol of Origin, which will permit diagonal cumulation among Euro-Med partners
(Table 3-4).
Exhibit 3-1 Rules of Origin: The Fine Print of Trade Agreements
Rules of origin are a pivotal part of textile and
apparel preferential trade arrangements and
agreements. They restrict the use of non-regional
components in goods claiming preferential
treatment. In apparel trade, rules of origin usually
require double or triple transformation
necessitating the spinning, knitting, weaving
dyeing, finishing, and making up of garments by
the parties to the agreement. Similarly, fabrics and
yarns eligible for preferential treatment can require
that fibers originate from the parties to the
agreement. Many exceptions exist, reflecting the
diverse production processes in the industries
today. The European Union maintains the “One
List” of requirements, while the United States relies
on general rules, and lists exceptions.
Many producers find meeting the rules of origin
difficult and so the extent of uptake of preferential
benefits varies by country and product. Interviews
with apparel producers in Egypt raised the
possibility that Egyptian producers do not benefit
extensively from EU preferential arrangements,
since many use imported yarns and fabrics, which
are cheaper and of higher quality, for exported
apparel
Rules of origin can hinder Egypt’s indirect exports
of yarns and fabrics to the United States and
European Union. For example, Turkey would
generally be prohibited from buying Egyptian
fabrics if it wanted to claim preferential access for
its apparel destined for the European Union.
However, if Egypt and Turkey implemented the
requirements of the Pan-Euro Protocol of Origin,
Egypt’s fabrics and yarns could receive indirect
market access to the European Union (assuming
Egypt’s products were competitively priced and
met quality standards).
Table 3-4 Euro-Med Partners and Association Agreements
Country Signed In Force (After Ratification)
Algeria Apr-02 Pending
Egypt Jun-01 Pending
Jordan Nov-97 May-02
Lebanon Interim agreement 3/2003 Pending
Morocco Feb-96 Mar-00
Syria In Discussions --
Tunisia Jul-95 Mar-98
Israel Jun-00
Turkey Jan-96
West Bank/Gaza Strip Interim agreement 2/1997 Pending
Note: Cyprus and Malta, two Euro-Med members, will accede to the European Union in May 2004.

PREFERENTIAL ARRANGEMENTS AND AGREEMENTS 23
Cumulation is the process by which preferential suppliers can claim non-originating inputs
from free trade partners towards meeting the rules of origin.29 Most free trade agreements provide for bilateral cumulation, which permit the reciprocal use of inputs from countries
party to a free trade agreement. By providing for diagonal cumulation, trade partners can
count third-party inputs (countries not a party to a particular trade agreement) to follow the rule of origin.
Pan-Euro rules of origin enable a region wide market, that go beyond simple bilateral trade
flows, leveraging the industrial infrastructure of neighboring countries and others in the region. To participate in diagonal cumulation with the European Union, free trade partners
must meet three conditions:
• All members (European Union, Egypt and third parties), must have completed a free trade agreement with the European Union and with each other, although they need not
be the identical trade agreement;
• Rules of origin implemented in the cumulation process must be identical;
• Notification and approval by the European Union of the intent to cumulate with other
free trade partners.
Figure 3-1 shows that Egypt is a relatively small exporter to the European Union, compared to its potential regional partners, such as Turkey, the 10 acceding countries, Morocco, and
Tunisia. As reviewed above, Egyptian textile products, including woven fabrics and yarns
for certain knit products, have considerable potential because Egyptian yarns and fabrics could be claimed as regional inputs, conferring duty free access on the final products of
partner countries’ exports to the European Union. Of course, this presupposes that
Egyptian textiles are of adequate quality and competitively priced. Likewise, Egyptian apparel producers could utilize yarns and fabrics not available in Egypt. Of course, the
benefits of wider market access would come at the cost of liberalizing Egypt’s domestic
market for apparel, since a free trade agreement between all partners is pre-requisite.30
Although these new rules of cumulation offer Egypt the possibility of expanded trade
opportunities, they will only do so if Egypt and its partners implement a regional
integration strategy. Diagonal cumulation provisions will provide benefits only if the governments and industry take the final steps. Member states have significant work ahead
to leverage the full advantages of the Pan-Euro rules of origin. These include:
• Educating producers of the advantages and complex requirements of diagonal cumulation;
• Improving customs cooperation between partner countries;
• Spreading knowledge of regional materials and sourcing;
• Standardizing and automating verification procedures, including certificates of origin;
29 See UNCTAD/DITC/TNCD/4 “Improving Market Access for Least Developed Countries”, UN May 2001 for an explanation of cumulation terminology and concepts.
30 Egypt, Tunisia, Jordon and Morocco have recently completed the Agadir free trade agreement completing an essential step in the process of regional integration and pan-euro cumulation.

24 INTERNATIONAL TRADE RULES FOR TEXTILES AND APPAREL
• Enabling local legislation and regulations to encourage investment in new cost-
competitive capacities.
If Egypt chooses not to pursue a regional strategy, it must face the possibility that industries
and governments in neighboring countries will. In this case, Egypt’s exports to the
European Union will come under increasing competition as other preferential suppliers in the Pan-Euro area gain from productivity and specialization efficiencies (costs, services, and
quality) and new investments.
The Euro-Med Agreements are not likely to provide advantages without a high degree of cooperation between members. Cooperation can reasonably be expected only if Euro-Med
partners liberalize their domestic textile and apparel markets in meaningful ways, or
cooperation will likely turn into consternation and isolation.
UNITED STATES
The United States recently concluded negotiations for a free trade agreement with four
Central American countries (Guatemala, Nicaragua, El Salvador and Honduras). Costa Rica
and the Dominican Republic are expected to join these Central American countries in 2004. Morocco and Southern African countries (SACU members) have advanced their
negotiations to the point where they are likely to conclude in 2004. The United States
recently notified the U.S. Congress of its intention to negotiate free trade agreements with three Andean countries. In the near future, the United States is expected to announce
negotiations with Sri Lanka and Thailand. Combined, these countries accounted for more
than 20 percent of U.S. apparel imports in 2002 (even more in products of export interest to Egypt, see Appendix E). When these agreements are concluded, they will no doubt change
the landscape of the U.S. textile and apparel markets. Their future success probably will
come at the expense of countries such as Egypt. However, new agreements, recently concluded are already altering the shape of Egypt’s textile and apparel exports to the
United States.
Today, Egypt’s leading apparel exports to the United States are affected by the U.S.-Jordan free trade agreement and the AGOA preferential arrangement with the countries of sub-
Saharan Africa.31 While these agreements and arrangements have had only minimal effects
on the overall U.S. import markets for apparel, the regional proximity of their members to Egypt raises the possibilities of trade diversion (Figures 3-3 and 3-4) from Egypt to its
regional competitors. Jordan, Israel, and the Qualified Industrial Zones all enjoy average
duty advantages of 17–18 percentage points over Egypt.32 Jordan’s status as a U.S. free trade partner brings other advantages such as the certainty of U.S. market access and new
investment. While the AGOA beneficiaries do not enjoy the same permanent U.S. market
access as Jordan, least-developed countries in sub-Saharan Africa have the advantage of a liberal rule of origin permitting the use of nonregional (mostly Asian) fabrics and yarns.
31 See appendix IV for a list of AGOA countries and the dates of their eligibilities to export apparel to the United States duty free.
32 Only on products which meets the rule of origin.

PREFERENTIAL ARRANGEMENTS AND AGREEMENTS 25
The provision for least-developed countries to use nonregional fabrics and yarns is set to
expire in September 2004 but may be extended.33
Figure 3-3 U.S. Import Market Shares for Cotton Trousers and Shorts 1996-2003 (million square meters)
0.0
1.0
2.0
3.0
4.0
5.0
6.0
7.0
1996 1997 1998 1999 2000 2001 2002 2003-Aug
EGYPT Jordon-Egypt-QIZ AGOA
US-Jordon FTA and AGOA effectively
implemented
While regional preferential suppliers in sub-Saharan Africa and the Middle East are
threatening the growth of Egypt’s exports to the United States, as Table 3-5 illustrates, other
preferential suppliers, closer to the U.S. market, are also of concern. In fact, for the two leading Egyptian apparel products exported to the United States (cotton trousers and cotton
knit shirts), preferential suppliers hold more than half of the import market (54 and 64
percent respectively).
33 Legislation extending the AGOA third part fabric provision for LDC countries was introduced to the U.S. congress in November of 2003 (AGOA-III).

26 INTERNATIONAL TRADE RULES FOR TEXTILES AND APPAREL
Figure 3-4 U.S. Import Market Shares for Cotton Knit Shirts 1996-2003 (million square meters)
0.0
0.5
1.0
1.5
2.0
2.5
3.0
3.5
4.0
4.5
1996 1997 1998 1999 2000 2001 2002 2003-Aug
Egypt Jordon-Israel-QIZ AGOA
US-Jordon FTA and AGOA effectively
implemented
Table 3-5 U.S. Preferential Trade Arrangements and Agreements Market Shares by Product, 2002
Share of U.S. Imports (Percent based in square meter equivalents)
Product
Share of Egypt's Exports to the
U.S. NAFTA CAFTA
+ a AGOA ATPDEA
Jordan-Israel-
QIZ Total
Cotton trousers 37.2 25.9 19.7 5.2 1.4 1.4 54.2
Cotton knit shirts 16.8 19.1 35.1 3.9 2.7 1.9 64.4
Cotton woven shirts 4.2 15.4 16.3 1.9 0.1 0.8 35.5
Cotton yarn 6.2 29.1 1.7 0.0 0.2 0.0 31.0
Synthetic coats 4.1 13.4 5.8 0.8 0.1 1.3 21.4
Synthetic trousers 1.9 20.5 18.8 2.2 0.2 1.0 42.8
Cotton jackets and coats 1.6 7.2 5.7 1.5 0.5 0.8 15.7
SOURCE: U.S. Department of Commerce data and authors calculations.
a The U.S.-CAFTA includes four countries that have concluded free trade negotiations with the United States and two countries expected to conclude negotiations for a free trade agreement in 2004. These countries currently have preferential access to the U.S. market under the Caribbean Basin Trade Preference Act for apparel products only, with a strict rule of origin requiring the use of U.S. materials and components. See http://otexa.ita.doc.gov/Trade_Act_2000.htm#CBTPA and http://www.ustr.gov/new/fta/cafta.htm.
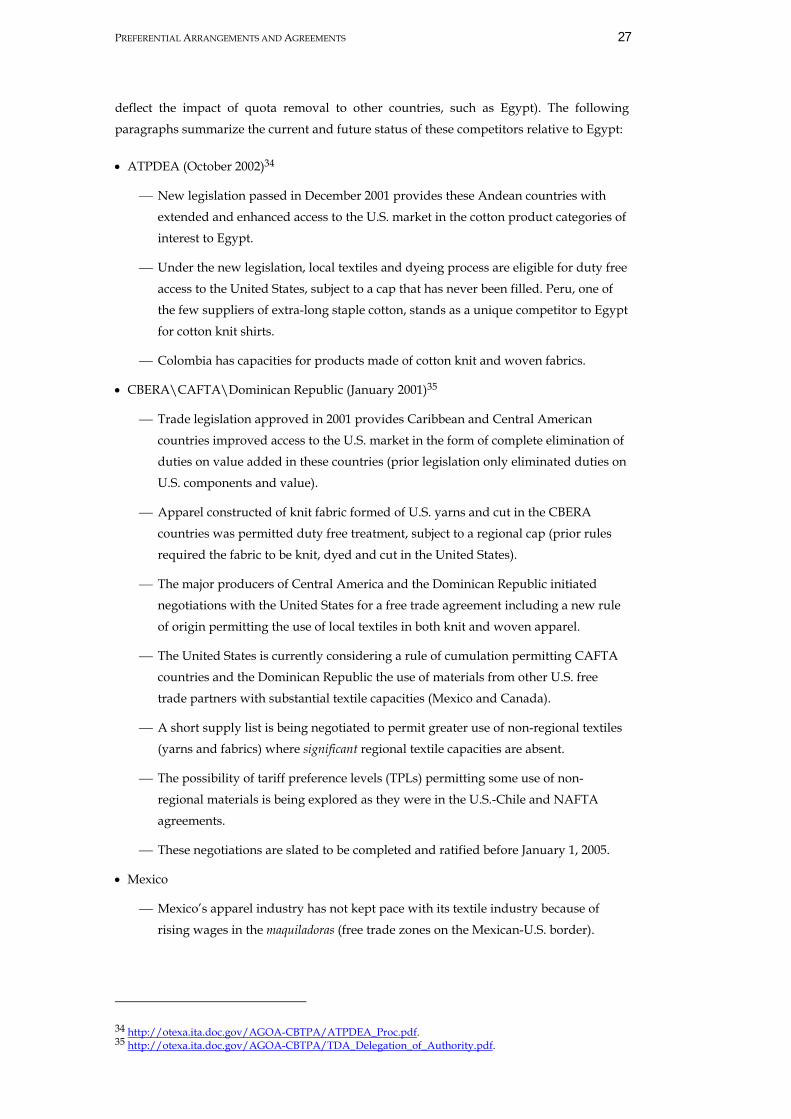
Recently concluded arrangements and ongoing negotiations hold a great deal of potential for these major suppliers to expand their hold on the U.S. market for these products (or
PREFERENTIAL ARRANGEMENTS AND AGREEMENTS 27
deflect the impact of quota removal to other countries, such as Egypt). The following
paragraphs summarize the current and future status of these competitors relative to Egypt:
• ATPDEA (October 2002)34
⎯ New legislation passed in December 2001 provides these Andean countries with
extended and enhanced access to the U.S. market in the cotton product categories of interest to Egypt.
⎯ Under the new legislation, local textiles and dyeing process are eligible for duty free
access to the United States, subject to a cap that has never been filled. Peru, one of the few suppliers of extra-long staple cotton, stands as a unique competitor to Egypt
for cotton knit shirts.
⎯ Colombia has capacities for products made of cotton knit and woven fabrics.
• CBERA\CAFTA\Dominican Republic (January 2001)35
⎯ Trade legislation approved in 2001 provides Caribbean and Central American
countries improved access to the U.S. market in the form of complete elimination of duties on value added in these countries (prior legislation only eliminated duties on
U.S. components and value).
⎯ Apparel constructed of knit fabric formed of U.S. yarns and cut in the CBERA countries was permitted duty free treatment, subject to a regional cap (prior rules
required the fabric to be knit, dyed and cut in the United States).
⎯ The major producers of Central America and the Dominican Republic initiated negotiations with the United States for a free trade agreement including a new rule
of origin permitting the use of local textiles in both knit and woven apparel.
⎯ The United States is currently considering a rule of cumulation permitting CAFTA countries and the Dominican Republic the use of materials from other U.S. free
trade partners with substantial textile capacities (Mexico and Canada).
⎯ A short supply list is being negotiated to permit greater use of non-regional textiles (yarns and fabrics) where significant regional textile capacities are absent.
⎯ The possibility of tariff preference levels (TPLs) permitting some use of non-
regional materials is being explored as they were in the U.S.-Chile and NAFTA agreements.
⎯ These negotiations are slated to be completed and ratified before January 1, 2005.
• Mexico
⎯ Mexico’s apparel industry has not kept pace with its textile industry because of
rising wages in the maquiladoras (free trade zones on the Mexican-U.S. border).
34 http://otexa.ita.doc.gov/AGOA-CBTPA/ATPDEA_Proc.pdf. 35 http://otexa.ita.doc.gov/AGOA-CBTPA/TDA_Delegation_of_Authority.pdf.

28 INTERNATIONAL TRADE RULES FOR TEXTILES AND APPAREL
⎯ New rules of origin being negotiated for the CAFTA and Dominican Republic
agreements hold the hope that competitive Mexican textiles will be certified for duty free treatment into the CAFTA region and other free trade areas under a
cumulation clause
⎯ If Mexico’s textiles receive market access to regional suppliers to the United States in the form of a new rule of origin, Egyptian textiles (yarns and fabrics) could be
diverted away from U.S. markets, since they would not carry the benefit of
conferring duty free status to apparel constructed in the North and Central American region.
To appreciate the potential impacts of a U.S.-CAFTA (including the Dominican Republic),
the benefits of the current preferential arrangement (CBTPA) need to be evaluated in light of the current rules of origin for these countries. Table 3-6 lists each of the countries in
negotiations for the U.S.-CAFTA and their current uptake of preferential duty free benefits
provided by the CBTPA. The uptake of duty free benefits (linked to meeting rules of origin requiring the use of U.S. yarns and woven fabrics), vary between 31 and 89 percent.
The impacts of a U.S.-CAFTA on Egypt’s exports depend on several factors in addition to
the new rules of origin being negotiated:
• Up to one-third of these countries’ exports to the United States could enjoy a price drop
because of a reduction in duties averaging 17 percent;
• A new rule of origin could also provide for lower cost and broader range of textiles, since new suppliers would bring competition to the market for regional yarns and fabrics,
further improving their competitive advantage; and
• The current high concentration of Egypt’s apparel exports (more than one-half) in product categories where potentially new U.S.–free trade agreement partners already
hold a significant share of the U.S. import market (Table 3-6).
Table 3-6 Central American and Dominican Republic Preferential Access Under the CBTPA, 2002
U.S. Imports
Country
Value (US$ million ]
Duty Free (%)a
Nicaragua 433 31
Honduras 2,502 80
Guatemala 1,659 36
El Salvador 1,675 72
Costa Rica 727 80
Total CA-5 6,997 65
Dominican Republic 2,133 89
a. U.S. imports meeting the U.S. rule of origin under the CBTPA are duty free.
SOURCE: U.S. Department of Commerce Imports of Merchandise Trade 2002.

PREFERENTIAL ARRANGEMENTS AND AGREEMENTS 29
To counter this trend of expanding market access, Egypt could pursue several strategies:
• Diversify its textile and apparel exports away from categories exposed to expanding preferential trade arrangements (cotton trousers and knit shirts) to
products such as non-knit cotton shirts and cotton jackets, yarns and fabrics;
• Improve knowledge of fabrics and materials on short supply lists to improve exports of yarns and fabrics to the region (for example, the United States permits
the use of certain nonregional fine count cotton fabrics and linens in apparel
eligible for duty preferences);
• Engage in processes of market liberalization, including the negotiation of a free
trade agreement with the United States.

4. WTO Zero-for-Zero Proposal
A. Background
The recent round of multilateral trade negotiations in the World Trade Organization (WTO) formally began in Doha Qatar on November 14, 2001. The Doha Round affirmed the WTO’s
commitment to the special interests of developing countries through the Doha
Development Agenda. The Doha Development Agenda recognizes the fact that the majority of WTO members are developing economies and that a consensus is required to reach any
new agreement. It also acknowledges that international trade can play an important role in
poverty reduction. A broad set of issues were included in the Doha negotiating schedule, including the reduction of barriers to trade in textile and apparel products to be completed
by January 1, 2005. The collapse of the Cancun trade negotiations in September 2003 means
this deadline is sure to be missed. Still, the Doha Round offers a unique opportunity for WTO Members to resolve important and complex market access issues in the textile and
apparel industries.
The Doha Round comes at a time of accelerating liberalization in global textile and apparel trade including the elimination of quotas and expansion of preferential trade. Still, average
tariffs in the textile and apparel industries in developed and developing countries remain
high. Peak tariffs often exceed 20 percent in developed countries such as the United States, and more than 100 percent in developing countries such as Egypt, India, and Brazil. While
the elimination of quotas has reduced non-tariff barriers, many developing countries have
replaced quotas with new forms of non-tariff protection such as labeling requirements and import pricing schemes. Subsidies are more the rule than the exception. The Doha Round
offers challenging opportunities to address a wide number of issues affecting these
employment-generating industries, with enormous possibilities for improving welfare and reducing poverty in developing countries.
By the time negotiations in Cancun collapsed in September 2003, few concrete proposals for
market access negotiations in textiles and apparel had been presented.36 One ambitious
31
36 People’s Republic of China, European Communities, India, Korea and the United States submitted specific proposals for tariff reductions. Two proposals apply a Swiss formula with the Coefficient defined by each developing countries needs. India proposed a liner reduction of duties, with deeper cuts by developed
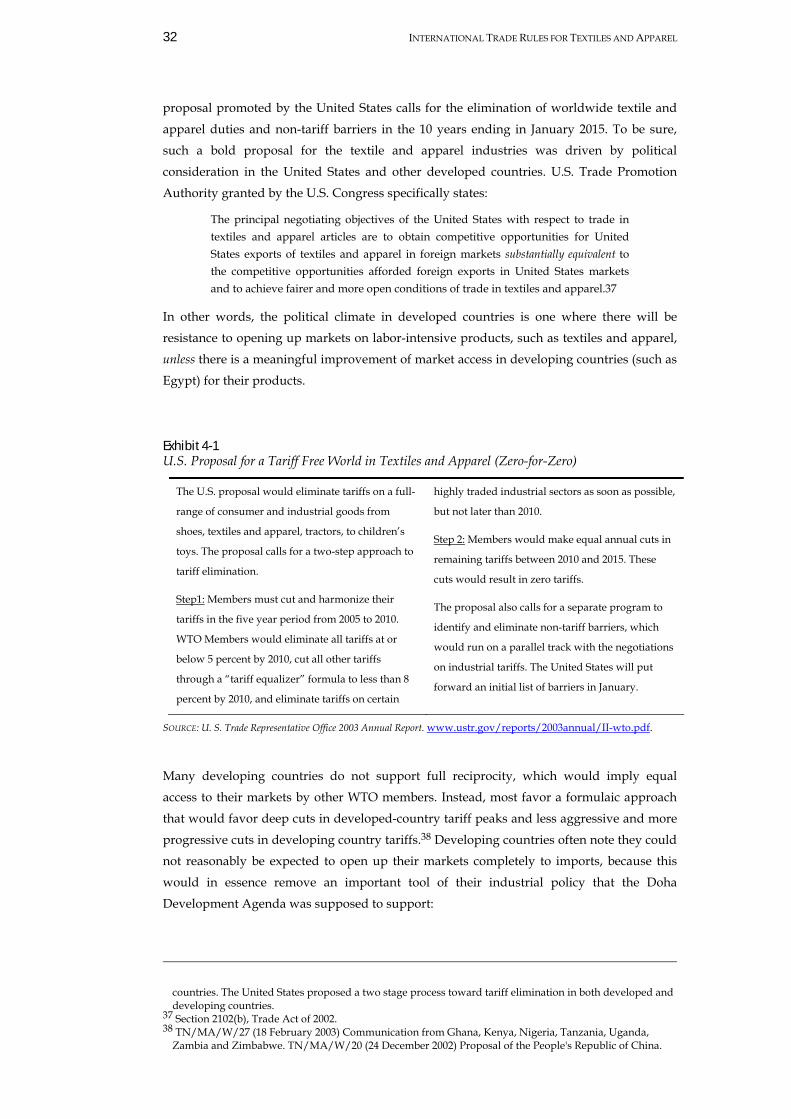
32 INTERNATIONAL TRADE RULES FOR TEXTILES AND APPAREL
proposal promoted by the United States calls for the elimination of worldwide textile and
apparel duties and non-tariff barriers in the 10 years ending in January 2015. To be sure, such a bold proposal for the textile and apparel industries was driven by political
consideration in the United States and other developed countries. U.S. Trade Promotion
Authority granted by the U.S. Congress specifically states:
The principal negotiating objectives of the United States with respect to trade in textiles and apparel articles are to obtain competitive opportunities for United States exports of textiles and apparel in foreign markets substantially equivalent to the competitive opportunities afforded foreign exports in United States markets and to achieve fairer and more open conditions of trade in textiles and apparel.37
In other words, the political climate in developed countries is one where there will be resistance to opening up markets on labor-intensive products, such as textiles and apparel,
unless there is a meaningful improvement of market access in developing countries (such as
Egypt) for their products.
Exhibit 4-1 U.S. Proposal for a Tariff Free World in Textiles and Apparel (Zero-for-Zero)
The U.S. proposal would eliminate tariffs on a full-
range of consumer and industrial goods from
shoes, textiles and apparel, tractors, to children’s
toys. The proposal calls for a two-step approach to
tariff elimination.
Step1: Members must cut and harmonize their
tariffs in the five year period from 2005 to 2010.
WTO Members would eliminate all tariffs at or
below 5 percent by 2010, cut all other tariffs
through a “tariff equalizer” formula to less than 8
percent by 2010, and eliminate tariffs on certain
highly traded industrial sectors as soon as possible,
but not later than 2010.
Step 2: Members would make equal annual cuts in
remaining tariffs between 2010 and 2015. These
cuts would result in zero tariffs.
The proposal also calls for a separate program to
identify and eliminate non-tariff barriers, which
would run on a parallel track with the negotiations
on industrial tariffs. The United States will put
forward an initial list of barriers in January.
SOURCE: U. S. Trade Representative Office 2003 Annual Report. www.ustr.gov/reports/2003annual/II-wto.pdf.
Many developing countries do not support full reciprocity, which would imply equal access to their markets by other WTO members. Instead, most favor a formulaic approach
that would favor deep cuts in developed-country tariff peaks and less aggressive and more
progressive cuts in developing country tariffs.38 Developing countries often note they could not reasonably be expected to open up their markets completely to imports, because this
would in essence remove an important tool of their industrial policy that the Doha
Development Agenda was supposed to support:
countries. The United States proposed a two stage process toward tariff elimination in both developed and developing countries.
37 Section 2102(b), Trade Act of 2002. 38 TN/MA/W/27 (18 February 2003) Communication from Ghana, Kenya, Nigeria, Tanzania, Uganda,
Zambia and Zimbabwe. TN/MA/W/20 (24 December 2002) Proposal of the People's Republic of China.

WTO ZERO-FOR-ZERO PROPOSAL 33
The negotiations shall take fully into account the special needs and interests of developing and least-developed country participants, including through less than full reciprocity in reduction commitments, in accordance with the relevant provisions of Article XXVIII bis of GATT 1994.
When negotiations ceased in Cancun, the opposing agendas of developed and developing countries for liberalization of trade in textile and apparel products had not been reconciled.
In fact, the differences between developed and developing countries agendas for textile and
apparel negotiations were overshadowed by differences between developing countries themselves.
Preferential trade has grown to be an important mechanism of industrial development for
developing countries and least-developed countries. Eliminating developed countries’ duties on textiles and apparel would eliminate those preferences. Not surprisingly, non-
preferential suppliers, such as India and China, would prefer to have these preferences
reduced or eliminated.
The divide between developing countries does not stop with the split between preferential
and non-preferential suppliers. Some developing countries, because they do not have
appreciable domestic industries, favor elimination of duties. Others have large domestic textile and apparel industries they wish to protect. Egypt is a country that currently
maintains a highly protected domestic market for textile and apparel products. The most
recent estimates of the size of Egypt’s domestic textile and apparel industries indicate that sales to the domestic market accounted for two-thirds of Egypt’s textile and apparel
production.39 The prospect of liberalizing trade in markets, such as Egypt’s, that have
limited experience with open competition of international markets could have far-reaching impacts on employment and industrial policies in these countries. The following section
explores the implication of a zero-for-zero agreement on Egypt’s domestic textile and
apparel industries.
B. Implications of Zero-for-Zero
When considering the implications of new trade agreements, economists often use economic models. An example of this approach was found in the analysis of quota
elimination. However, before making such estimates, economists must consider the
appropriateness of these models and the data that will represent the changes they are to calculate. By necessity, economic models rely on a handful of important variables such as
market shares, estimates of tariff and non-tariff barriers, and industry structure (such as
supply and demand responses). In the case of international competition in textiles and apparel, it was assumed that markets would behave perfectly and competitively, and that
the changes, while large, would not affect the overall structure of the industry and the
39 According to CAPMASS data from 1999, Egypt’s production of textile and clothing were EL 5 billion to the domestic market and LE 3 billion to exports.

34 INTERNATIONAL TRADE RULES FOR TEXTILES AND APPAREL
institutions that support them—although it certainly has implications on the locations of
industry.
There are several reasons, however, why such assumptions are not tenable for evaluating
the impacts of a zero-for-zero agreement on Egypt’s domestic textile and apparel markets.
Understanding violations of the reasonable (normal) assumptions of markets and data can shed considerable light and promote better understanding of the potential impacts of a
zero-for-zero agreement on Egypt’s domestic industry.
Several variables of importance must be considered to evaluate the implication of a WTO zero-for-zero agreement on Egypt’s domestic industry:
• Egypt's current applied levels of tariff and non-tariff barriers, in contrast to its WTO
obligations;
• The absence of imports;
• The current structure of Egypt's domestic textile and apparel industries and their ability
to compete in global markets;
• The requirements for a globally competitive textile and apparel industry and what Egypt
would have to do to succeed in it.
Each of these major variables will be considered in turn.
EGYPT’S TARIFF AND NON-TARIFF BARRIERS TO TRADE
The WTO zero-for-zero proposal requires that members eliminate all tariff and all non-tariff
barriers to trade in textiles and apparel. Upon acceding to the WTO in 1995, Egypt
committed to eliminating certain non-tariff barriers, such as import quotas, and to bind its tariffs at new levels by January 1, 2005,40 Egypt’s progress in meeting these commitments
have been mixed. Shown in Table 4-1 are Egypt’s applied 2003 tariffs, its WTO
commitments, and the differences between the two. In two textile sectors, industrial products and carpets and rugs, Egypt’s applied duties are below its accession
commitments, and Egypt therefore has met its obligations. The home furnishings sector is
close to meeting its obligation by 2005, requiring only a 3.8 percent reduction in today’s applied rates.
In contrast, Egypt is behind schedule in its WTO obligations for yarn, thread, fabrics and
apparel. For yarn, thread, and fabric, Egypt would have to reduce its 2003 applied duties 40 percent or more to meet its accession obligations. For clothing, Egypt’s conversion of quotas
to specific duties averaging 800 percent acts as a virtual import ban. It appears unlikely
Egypt will meet its scheduled obligations by January 1, 2005.
40 Duties were to be reduced in 10 equal increments.

WTO ZERO-FOR-ZERO PROPOSAL 35
Table 4-1 Egypt’s Applied 2003 Duties, WTO Accession Commitments
Product
Egyptian Imports 2002
(US$ 1,000)
Simple Average of
Applied
Duties 2003 a
(1)
Egypt's Average WTO Commitment
to Bind Duties (2)
Difference between
Egypt’s Applied and
Bound Duties (3) =(1) - (2)
Clothing 458 800 40 759.6
Carpets and rugs 2,178 39 58 -19.2
Industrial products and tire cord 27,356 22 34 -11.7
Fabric 13,976 50 30 19.8
Home furnishings 3,315 31 27 3.8
Yarns and thread 135,785 28 15 12.5
Source: Author's calculations from official Egyptian import statistic and tariff schedule.
Note: Egypt imposes a surcharge on imports that ranges from 2-3 percent of the assessed import value. (a) Specific duties were converted to ad valorem equivalents.
Prohibitive duties on apparel are an obvious barrier to imports. However, duties on non-clothing products, such as yarns and fabric, while high, are not prohibitive,41 Yet more than
two-thirds of Egypt’s tariff lines for these products did not record economically significant
trade in 2002.42 Refatt (2003) and the U.S. Trade Representative (2003) report that numerous non-tariff barriers confront Egyptian importers and are a major concern in the textile and
apparel sectors. Non-tariff barriers commonly cited include quality control and inspections,
customs valuation procedures, layers of red tape including complex customs rules, customs surcharges, and costly and complex marking requirements, such as having the name of the
importer woven into the fabric every 30 meters.43
The U.S. Trade Representative reports that standards and testing committees in Egypt are often at the root of many technical import barriers seeking to protect local producers. Table
4-2 shows Egypt’s imports of textile and apparel products by chief fiber types. Products
made of chiefly cotton and wool fibers comprised less than 4 percent of Egypt’s textile imports, while synthetic and other fibers comprise 96 percent. In fact, over 70 percent of
Egypt’s textile and apparel imports are non-cotton, non-wool yarns and thread. This high
concentration is in spite of the fact that duties on cotton and non-cotton products are largely similar.
41 Rafatt (2003) reports effective rates of protection in the apparel industry to be in excess of 600 percent. It is unlikely that the high tariffs on imported yarns and fabrics would be non-economically viable, since apparel producers are in a solid position to recuperate their costs.
42 Significant trade was defined as $5,000 or more in imports from all sources. 43 The American Textile Manufactures Institute cites Egypt 14 times in 22 categories for applying “WTO
compliant ways to restrict imports” A report titled “Failure of the WTO and the U.S. Government to Provide Market Access for U.S. Textile Products Six Years into the World Trade Organization”
www.atmi.org .

36 INTERNATIONAL TRADE RULES FOR TEXTILES AND APPAREL
Table 4-2 Percent of Egypt’s 2002 Imports by Product and Chief Fiber Type
Product Wool Cotton Other Synthetic Total
N.E.C. -- -- 0.1 -- 0.1
Clothing 0.0 0.0 0.1 0.2 0.2
Carpets and rugs 0.7 -- 0.5 -- 1.2
Fabric (knit and woven)
0.0 0.3 4.6 2.7
7.6
Industrial textiles (tire cord etc.) -- -- 14.9 -- 14.9
Home Furnishing -- -- 2.0 -- 2.0
Yarns and thread 0.3 2.1 3.5 68.0 73.9
Total 0.9 2.5 25.8 70.8 100.0
SOURCE: Author's compilation from Egyptian import statistics.
Tariffs alone are not likely to be an adequate measure of the impact of a zero-for-zero
agreement. First, because a significant portion of tariff reduction Egypt would have to make were already agreed to in its WTO accession agreement.44 Untangling the effects of Egypt’s
prior WTO commitments and new ones under a zero-for-zero agreement is not likely to
provide reliable results. Second, the fact that little or negligible imports exist in products of particular importance in Egypt’s domestic market is especially worth noting. Without
meaningful import volumes, it is impossible to gauge the sensitivity of Egypt’s domestic
industry to the competitive impacts of imports.45 Finally, Egypt’s non-tariff barriers are likely as significant as its WTO binding duties and these barriers vary by product and
material types. No reasonable estimates of these barriers exist.
STRUCTURE OF EGYPT’S INDUSTRY
While exports to the major markets comprise about one-third of Egyptian production, the remaining two-thirds are sales to the domestic market (CAPMAS 1999). Interviews of
Egyptian textile and apparel producers carried out for this study indicated an industry that
is split between firms with an export orientation and those that produce primarily for the domestic market. 46 Recent research into apparel and textile industries in developing
countries has shown that producers with a predominant focus on highly protected domestic
markets are often ill-suited to competing in global markets (Gibbon 2003). Egypt’s domestic industry is molded by the demands of its highly protected local market. The characteristics
common to this segment of the industry are likely to include: a predominance of small to
medium enterprises; short product runs; greater variety; higher costs; and lower quality (Gibbon 2003).
44 A zero-for-zero agreement would likely take Egypt’s bound tariffs as a starting point for any formulaic reduction in duties. Therefore, in the first year of any agreement, Egypt would be obligated to reduce its duties by the amounts listed in column three of table 14.
45 Although Egypt has concluded negotiations with several free trade partners, it has not yet reduced its tariffs to major trade partners, such as the EU.
46 Most producers interviewed admitted to selling in both the import and export market, but the majority of their sales were to one or the other sales channels.

WTO ZERO-FOR-ZERO PROPOSAL 37
In contrast, producers concentrating on export markets often emphasize higher volumes,
limited product ranges, cost savings in scale, and higher quality47. These firms often participate in local markets to some extent for reasons of market diversification and to
dispose of textiles and clothing of second quality.
Exhibit 4-2 What about Egyptian Cotton?
Egyptian cotton has been widely recognized for
thousands of years for its high quality and unique
characteristics. This perception continues with the
branding of textiles as “Egyptian Cotton.”
However, Egyptian cotton does not equate to
Egyptian formed and dyed textile products, since
any producer can buy Egyptian cotton. A limited
survey by the author of home furnishing products
advertised as “Egyptian Cotton” at a major U.S.
retailer found not a single made-in-Egypt label.
China was the most common manufacturer,
followed by Pakistan and Turkey. At least one
product admitted to using a “blend” of Egyptian
cotton (25%) with synthetic fibers in the
manufacture label (the United States, unlike many
countries, requires a label including fiber contents).
To understand the advantage of Egyptian cotton,
one needs to consider the technical aspects of
cotton that go beyond the name. Cotton comes in a
number lengths and densities. Egyptian cotton, in
its finest form, is extra-long staple cotton, not
widely found.
Producers interviewed for this report unanimously
agreed that Egyptian long staple cotton provides
only limited advantages in international markets.
This is because the extra-long staple cotton costs
more to buy and finish and is desirable in its pure
form in only selected, high-end products
commanding premiums. Producers cited a recent
trend toward importing cheaper medium staple
cottons for export.
Therefore, reducing Egypt’s high duties in the textile and apparel sector to zero, and
eliminating non-tariff barriers, even over an extended period of five to ten years, would require a drastic restructuring of Egypt’s production technology, expertise, and institutions
into a global industry focused on cutting pennies from a fabric’s or garment’s price on the
basis of enormous volumes.
Egyptian producers also face significant technical hurdles because large-scale investment in
the industry has been absent for many years.48 Problems most often cited by producers are
significant deficits in the dyeing and finishing capabilities of local firms and textile machinery capable of processing only low yarn counts (coarse yarns). Significant
investment in the industry would have to be attracted to meet these demands.
Finally, although Egypt is often considered to be among the low-labor-cost countries of the Euro-Med area, data for wage costs and non-wage costs indicate that the Egyptian labor
market is expensive compared to the Asian market (see Figure 4-1).
47 Large volume production allows textile and apparel production engineers to learn by doing specific product. As illustrated by Gibbon (2003), these saving might only be pennies on a garment, but can be the crucial factor in gaining sales in a global market.
48 Egypt’s industry was nationalized in the 1950s. Recent attempts by the Egyptian spinning and weaving holding company to privatize its companies were given a cool reception by investors when only three of the 42 companies for sale were purchased (Emerging Textiles, March 2003).

38 INTERNATIONAL TRADE RULES FOR TEXTILES AND APPAREL
Figure 4-1 Relative Labor Costs for Spinning and Weaving, Egypt and Selected Asian Producers
0.00
0.20
0.40
0.60
0.80
1.00
China CostalAreas
India Indonesia ChinaMainland
Sri Lanka Pakistan Bangladesh
(US
$)/H
our
Egyptian spining and weaving labor costs
US$ 0.81/hour
Note: all costs originally published by Werner International have been maintained, but all were updated for exchange rate changes through the first quarter of 2003. Therefore, much of the relative devaluation in the Egyptian pound has been accounted for in the analysis.
Source: Werner International data for June 2002.
It should come as no surprise then that the impacts of a zero-for-zero agreement on Egypt’s
textiles and apparel industry will be determined largely by the industry’s ability to restructure, which in turn will be determined by a number of actors inside and outside
Egypt—governments, local manufacturers, labor unions, and foreign investors.
REQUIREMENTS OF A GLOBALLY COMPETITIVE INDUSTRY
The preceding section illustrated how Egypt’s domestic textile and apparel industries are not likely to be suited to a globally competitive market. A host of factors would need to be
aligned with world standards to ensure the survival and prosperity of the Egyptian textile
and apparel industries, including harmonizing Egypt’s foreign direct investment, tax, labor and intellectual property laws, among other major changes.
Moreover, extensive tax holidays (sometimes of 10 years or more), exemptions from import
duties on capital equipment; exemptions from sales taxes; rediscount facilities for lowering the cost of borrowing; government-supplied meals, housing, production, and training
facilities; and direct payments to textile and apparel producers are often employed to
maintain competitiveness and employment in these industries throughout the world. Without matching the supports offered by other countries, it is unlikely that Egypt’s textiles
or apparel industry could survive in the face of mass-produced, cheap, higher-quality
imports produced from often-subsidized production.
Without global coordination and agreement in the global textiles and apparel industries,
development agendas risk being transformed into beggar-thy-neighbor policies of

WTO ZERO-FOR-ZERO PROPOSAL 39
escalating subsidies and declining labor and environmental conditions (referred to by some
as “the race to the bottom”). Market conditions could divert sound, sustainable, investments to the highest bidders with the lowest standards. The chill on investment
Egypt feels today could be the start of a long winter. A broad mandate and agreement in
the textile and apparel sectors could be the bold vision required for an industry that comprises more than one-quarter of Egypt’s manufacturing employment (CAPMAS 1998).
The Doha Development Agenda, although it appears far in the distance, is too important to
ignore and demands careful consideration. A balanced agreement could aid Egypt’s transition into the global economy only if it addresses the special needs of Egypt’s industry
and the realities of today’s market.

5. Conclusion and Adjustment Strategies The Egyptian textile and apparel industries are confronted with a world that is becoming increasingly globalized. Egypt must consider adjustment strategies to respond to this trend
for producers for both its domestic and export markets. Adjustment strategies will enable
the Egyptian textile and apparel industries to make the most of globalizing trends by improving their competitiveness.
Forty years of U.S. and EU quotas created a world market in which smaller, less-
competitive textile and apparel exporters, such as those in Egypt, could count on stable export earnings. Governments and producers have not needed to reinvest in new capital
equipment, retrain workers, or build and maintain infrastructure. With the removal of
quotas as of January 2005, however, industry will face new challenges. Governments and producers willing to implement aggressive strategies to confront the new global trade
environment will likely prosper. In this new environment, success will be ensured by
industry that innovates and faces the risk of competition, and government institutions that become active partners with industry.
Producers will have to develop new production strategies, customers, and services. In the
past, producers could rely on orders from buyers 3-6 months ahead of delivery dates and a steady flow of orders diverted from quota-constrained countries. Fabrics and yarns sourced
from Asian suppliers with 6–10-week lead times could easily be arranged ahead of delivery
dates.
In the post-quota world, suppliers will not be assured of the arrival of orders diverted from
Asian suppliers by quotas. Buyers seeking to lower inventories and garment costs will look
for producers that can offer lower initial volumes and rapid re-orders with frequent product cycles and changes in dyes and finishes.49 Managing the tradeoffs between low-
cost Asian fabrics with longer lead times against higher-cost local or regional fabrics will
become a highly valued asset in firms that can master it. Although it is not immediately apparent today, the deployment of information technologies will be essential for managing
41
49 The development of local dyeing and finishing capacities offers a way to reduce lead times and increase flexibility because griege materials could be inventoried at lower costs and to be ready for rapid conversion to garments, when they are needed.

42 INTERNATIONAL TRADE RULES FOR TEXTILES AND APPAREL
costs and materials and ensuring fluid delivery flows and communication with retailers.50
Egyptian textile suppliers will be required to find new customers in the Euro-Med region and Egyptian apparel producers will seek new material suppliers among its neighbors to
broaden product lines.
The Egyptian government will be required to negotiate new trade agreements and implement existing ones effectively. These agreements and their rules of origin will be more
complex and require a more detailed knowledge of value chains than prior agreements.
Negotiators and government officials would do well to familiarize themselves with the complex production process of fiber, textile, and apparel production.
Ensuring that customs procedures support all aspects of the supply chain and regional
trade strategies will require staff retraining and new regulations and technology. Meeting rules of origin while reducing documentation burdens and ensuring rapid shipments will
require automation, coordination, and harmonization of customs procedures among free
trade partners. Low-level corruption in government agencies that was tolerated before will become a concern of EU and U.S. officials interested in cargo security. Developing security
and integrity into the customs offices will be required, or time-sensitive shipments face
being diverted to secure ports for inspection.
The period before quota elimination on January 1, 2005, may be the high-water mark for
employment in the Egyptian textile and apparel industries. The losses of shipments and
employment resulting from quota elimination are not likely to be recovered from Egypt’s local markets alone. In globally competitive textile and apparel industries, if the industry is
not growing rapidly, jobs are likely being shed by continual demands for higher
productivity. Greater efficiency will require fewer, more productive workers to maintain costs at competitive levels. Therefore, a competitive industry that is maintaining output is
likely shedding jobs. This trend must be countered with worker re-training programs and
encouragement of small and medium enterprises in supplier industries such as packaging, design and pattern shops, and finance and information technologies.
While Egypt’s share of world markets for textile and apparel products may diminish in the
near future, the importance of the jobs and opportunities they generate will not.
The policies recommended for adjustment strategies are detailed in the following
paragraphs.
A. Engaging in the Doha Round of Negotiations
Perhaps the best opportunity to improve Egypt’s foreign market access was lost when
recent WTO negotiations collapsed in Cancun. The shifting tides and trends in the global
50 The use of electronic data exchange is rapidly becoming the norm for U.S. buyers, retailers, and suppliers. EU buyers and retailers are reported to be less reliant on technology and electronic data interchange; but many suggest that the trends are inevitable and the EU will soon follow suit.

CONCLUSION AND ADJUSTMENT STRATEGIES 43
textile and apparel industries are largely a multilateral issue that is being addressed only
haphazardly at the regional level in the form of preferential trade arrangements and agreements. Multilateral trade negotiations, such as the Doha Round, offer a chance for
Egypt to develop an environment that will be conducive to long-term growth and
investment in these key employment-generating industries. Without a global approach, markets will continue to be plagued by uncertainty and rapid shifts in the competitive
positions of producers: Today’s leaders could be tomorrow’s losers. Seeking a framework
for sustainable trade in these industries should be at the top of the WTO negotiating agenda. Considerable opportunities exist to rebalance trade opportunities so they benefit all
countries, not just the largest.
Reducing high tariff and non-tariff barriers in developing countries presents perhaps the greatest opportunity for Egyptian exporters. In particular, the largest exporters of textiles
and apparel that are expected to gain from quota elimination still maintain prohibitive tariff
and non-tariff barriers. Countries such as India, Pakistan and China, with substantial domestic markets, still limit imports of textiles and garments from other developing
countries. As their exports to developed markets grow with the elimination of quotas,
smaller producers of textiles and apparel could gain if market access to these large markets was provided. This quid pro quo was not negotiated in the Uruguay Round, but it is
certainly at the core of the Doha Development Agenda that smaller developing countries
benefit from trade liberalization.
World trade in textiles and apparel is currently dominated by countries that often subsidize
their exports. Whether it is tax-free treatment for exporters, forgiveness of state loans,
exchange rate manipulations, or outright payments based on export volumes, subsidies that cost huge sums of scarce government revenues are lost, and consumers in developed
countries profit from cheap goods. For countries with large domestic markets, such as
Egypt, these subsidies present a two-fold threat. First, it will be difficult to fully liberalize imports unless these subsidies can be addressed. Second, Egypt’s major export markets will
continue to be dominated by producers with the greatest capabilities in subsidizing exports.
Bringing textile and apparel industries into a new, multilateral, rules-based trading system will no doubt take significant negotiating effort that is beyond the scope of this study. This
is also the prerequisite for broad-based trade liberalization with the potential to improve
labor standards, welfare, and sustainable development and promote distortion-free investment.
B. Negotiating Free Trade Agreements
The conclusion of multilateral trade negotiations in the WTO is highly uncertain. The
collapse of negotiations in Cancun underscored the difficulty of bringing together a diverse
set of countries on diverse issues. Therefore, Egypt should consider a two track approach to ensure improved market access. The Euro-Med agreement forms a crucial stepping stone
for a regional free trade strategy. To take full advantage of this regional approach, Egypt is
required to have free trade agreements not only with the European Union, but important

44 INTERNATIONAL TRADE RULES FOR TEXTILES AND APPAREL
partner states, such as Turkey. The potential for a regional free trade area that extends
beyond the Euro-Med countries to Eastern Europe should not be overlooked.
Egypt does not have preferential access to the U.S. market, except in the form of non-
constraining quotas, which will be eliminated in January 2005. In contrast, Egypt’s regional
competitors, such as Jordan, Israel, and the sub-Saharan Africa countries enjoy duty free access on products for which the United States levies tariffs of between 17 and 33 percent.
Furthermore, U.S. rules of origin exclude Egyptian textile yarns and fabrics from use by its
preferential suppliers. Currently, the United States is considering a cumulation rule, granting duty free access to the U.S. market for apparel constructed from yarn and fabrics
from its free trade partners, such as Mexico and Canada.
C. Liberalizing Egypt’s Domestic Textile and Apparel Markets
Liberalization of Egypt’s domestic textile and apparel markets is not only required by its
WTO accession obligations, but it is prerequisite for the industry to survive and grow in the
long run. Today, Egypt’s domestic textile and apparel industries depend on prohibitive import barriers and have little incentive to improve efficiency, lower operating costs, raise
prices, and improve service. By gradually and predictably lowering Egypt’s textile and
apparel tariffs to the levels required in its WTO accession agreement, necessary competition can be brought to the domestic market. The Egyptian government will be required to
address a number of challenges to achieve this goal:
• Converting Egypt’s prohibitive specific duties to ad valorem equivalents that provide meaningful market access to importers, while meeting domestic concerns about the speed
in which this adjustment takes place;
• Eliminating unnecessary non-tariff barriers in customs and standards agencies; and
• Addressing real concerns about illegal shipments, under-invoicing, and dumping.
As legal trade in these products grows, illegal imports will be displaced, and customs
revenues can be expected to increase. Directing these funds to trade adjustment programs could lessen the impact of trade liberalization and the conversion of the Egyptian industry
to an efficient, high-quality industry.
D. Focus on Value Chains
Coordination between the textile and apparel industries, while theoretically attractive, is a
practical challenge that can have implications for market liberalization and the
competitiveness of Egyptian industries. The objectives of these two industries, while closely tied, can be opposed. Textile producers desire policies to protect their investments,
including restricting domestic apparel producers to domestic textile products even if the
apparel manufacturer loses sales because of higher costs and lower quality. In contrast, in a

CONCLUSION AND ADJUSTMENT STRATEGIES 45
competitive market, apparel producers seek flexibility to source new fabrics and colors at
the most competitive prices. Avoiding conflicts between these two industries is essential for smooth movement to a competitive industry. An integrated manufacturing strategy can
reduce these conflicts as Egypt introduces competition to its local markets. An integrated
manufacturing strategy can bring harmony by clearly defining the role of each sector in the national strategy.
VERTICAL INTEGRATION OF TEXTILES AND APPAREL
Many of the world’s most cost-competitive textile and apparel suppliers benefit from close
coordination of products, materials, designs (dyeing and patterns), quality improvements, geographic proximity, and production cycles. This coordination is best illustrated by
complete vertical integration, in which garments, fabrics, and yarns are all created in the
same establishment.
While complete vertical integration is extreme, cost savings and competitive elements can
still be achieved through close coordination of independent yarn, fabric and garment
producers in Egypt. By defining which garments could best use locally manufactured yarns and fabrics and the volumes available, trade policy (tariffs) can be brought into harmony
with manufacturing capacity. The goal of an integrated manufacturing strategy should be
to balance these interests, stimulating investment and increasing value added, competition, and innovation while avoiding over-protecting any particular product segment, especially
any segment for which local capacity is lacking.
“VIRTUAL” VERTICAL INTEGRATION OF TEXTILES AND APPAREL
No textile industry can produce all fabrics, patterns, and finishes required by domestic and international consumers. Therefore, where domestic textile industry cannot reasonably
provide on-time, high-quality, cost-competitive materials, apparel producers should have
access to imported yarns and materials in the most efficient manner possible with the lowest possible trade restrictions. “Virtual integration” recognizes the importance of the
core elements of true vertical integration, but seeks to achieve those goals through
technology, management, and services, rather than domestic production. Domestic garment manufactures would rely on information technology to monitor deliveries, and customs
offices would provide rapid clearance of shipments. In this way, domestic apparel
producers can reduce costs and compete more effectively with imports. Exporters would gain from rapid access to competitively priced materials.
Finally, an integrated manufacturing strategy would recognize that the success of the textile
and apparel industries depends on materials suppliers, such as cotton and filament producers, chemical manufacturers, and the services sectors. Government policies affecting
these industries also would be coordinated to ensure a globally competitive textile and
apparel industry.

46 INTERNATIONAL TRADE RULES FOR TEXTILES AND APPAREL
E. Regional Integration
The Egyptian domestic market is estimated to be about one-tenth of the total Euro-Med
region. A key handicap of Egypt’s textile and apparel industries is the size of its local
market, which can sustain only a large number of smaller producers, which produce the broad array of products required by the Egyptian market, but at a high cost. As quotas trim
Egypt’s exports to its major markets, the ability of Egyptian manufacturers to maintain the
industrial scale and gains from specialization will be further reduced. The Euro-Med area, and its promise of a duty free region with a market ten times the size of Egypt’s own,
should be a welcome reprieve for Egyptian producers. However, Egypt’s industry is
unlikely to welcome opening up local markets unless gains in other markets can be achieved. In order for Egyptian manufactures to gain from regional integration, they will be
required to learn a new way of trading, including negotiating the complex web of rules of
origin and locating new customers and suppliers. Several strategies can help Egypt’s industry benefit from a regional export strategy, including:
• Improving industry knowledge of rules of origin;
• Promoting Egyptian textiles and apparel in the Euro-Med area;
• Creating a regional fabric sourcing center so apparel producers can locate other Euro-
Med textile producers, and textile producers can market their products to other Euro-
Med partners; and
• Preparing Egyptian customs for efficient management of new rules of origin, including
automation of certificates of origin, and ensuring that regional materials move swiftly
thorough customs to local producers.
F. Customs
Transportation and business executives agree that the ability of a producer to get garments to market quickly is a major competitive advantage. They also agree that the reliability of
transit and shipment times is of equal importance. For example, although shipments may
average six days between port of embarkation and destination, if half the shipments take ten days and half take two days, there is cause for concern because the garments cannot be
delivered reliably. Because ocean freight vessels adhere to strict arrival and departure
schedules, the principal causes of delayed shipments (apart from production delays) are in the customs procedures of the exporting and importing nations. The threat of terrorism and
the potential for a container to contain dangerous material have given a new sense of
urgency and uncertainty to customs officials. New rules implemented by the U.S. Customs Service could cause significant shipping delays if not implemented properly. Several new
areas will require cooperation between Egyptian producers and customs authorities.

CONCLUSION AND ADJUSTMENT STRATEGIES 47
24-HOUR RULE
As of December 2, 2002, carriers must submit a cargo declaration 24 hours before cargo is
laden aboard a vessel at a foreign port. As of May 4, 2003, ports are permitted to load only cargo that is on the 24-hour list. Shipments identified as a risk can be issued a “do not load”
order from U.S. customs while in Egyptian ports, causing a delayed shipment. Shipments
not properly registered on the 24-hour list are not permitted to be laden aboard or risk being diverted to secure ports for inspection.
If customs officials, shipping agents, and suppliers fail to coordinate, shipments will be
delayed. Coordination could be improved through electronic transmission of shipping manifests and identifying cargo attributes that lead to suspicion and “do not load” orders.
CONTAINER SHIPMENT INITIATIVE
U.S. Customs has set the goal of assigning agents in foreign ports to inspect containers
before they depart for the United States. Suspect containers can be inspected while awaiting loading, resulting in little or no delivery delay. Alternatively, containers identified as a
security risk will be required to be diverted to inspection facilities in the United States,
possibly adding time to delivery. Currently, U.S. customs officials have targeted 20 foreign ports from which merchandise is exported to the United States for the initiation of this
program. Expansion of this program is expected, and foreign officials’ willingness to
participate will help determine the selection of ports. Security enhancements will improve the reliability of shipments and shorten delivery times.
CUSTOMS TRADE PARTNERSHIP AGAINST TERRORISM
The Customs Trade Partnership Against Terrorism program is a voluntary program that
foreign ports can join to reduce the threat of terrorism and enhance the security of container shipments. The program allows ports to adopt the most advanced technology and
implement new regulations in advance of official schedules to secure the rapid and safe
transport of air- and ocean-vessel cargo.
Participation in this program is the first step toward a competitive customs program.
Executing it reliably and cost-effectively will be the challenge of exporters and customs and
government officials alike.
G. Transportation
Transportation costs can comprise 2–20 percent of a garment’s final cost. Moreover, time in transit can reduce the value of shipments considerably. For example, the price of a knit shirt
one week after Christmas could be 50 percent less than it was one week before Christmas.
Although extreme, this example illustrates an important market dynamic. Table 5-1 shows transit times between some world ports and U.S. ports.

48 INTERNATIONAL TRADE RULES FOR TEXTILES AND APPAREL
Table 5-1 Ocean Vessel Shipping Time between Major U.S. and World Ports (Shipping Days)
Inbound to United States
Outbound from United States
Port Pair Shipping
Days
Average Wait
(Days) Total
Shipping Days
Average Wait
(Days) Total
Total Transit
Time (Days)
Puerto Plata–Miami/Port Everglade
3 2 5 3 2 5 10
Port Said, Egypt—New York
21 4 25 -- -- -- --
Nairobi, Kenya–New York
48 13 61 45 17 62 123
Cape Town, South Africa–New York
21 4 25 28 6 34 59
Hong Kong–Long Beach 12 0 12 18 0 18 30
Cartagena, Colombia–Miami
3 7 10 4 5 9 19
Port-au-Prince, Haiti–Miami
4 3 7 4 3 7 14
SOURCE: ShipGuide.com.
Note: Research by David Hummel, Princeton University, estimates the tariff equivalent of transport time in the apparel industry to be 0.8 percent per day.
Currently Egypt has a shipping time of approximately 25 days to the U.S. East Cost. Asian suppliers, such as China, are just 10 days from U.S. ports. Countries in the Caribbean enjoy
shipping times of as little as 5 days. If Egypt is to continue its long reach into the U.S.
market, transportation times will have to be reduced. Because it is difficult, if not impossible, to improve shipping times, the role of customs and domestic transportation
have to be scrutinized for every opportunity to reduce times in transit.
References Armington, Paul S. 1969. “A Theory of Demand for Products Distinguished by Place of
Production” IMF Staff Papers, v16, n1, pp. 159-176.
Brenton, Paul. 2003. Integrating the Least Developed Countries into the World Trading System: The Current Impact of EU Preferences Under Everything But Arms. The
World Bank.
Francois, Joseph, Hans Glissmen, and Dean Springer. 2000. The Cost of EU Protection in Textiles and Clothing. The Kiel Institute of World Economics.
Gibbon, Peter. 2003. The Africa Growth & Opportunity Act and the Global Commodity
Chain for Clothing. World Development Vol. 31. No. 11.
Hummels, David. 1999. Toward a Geography of Trade Costs. Mimeo. University of
Chicago.
McDanial, Christine and Edward J. Balisteri. 2002. A Review of Armington Substitution Elasticities. United States International Trade Commission: Washington, D.C.
McDougall, R.A., A. Elbehri, and T.P. Truong. 1998. Global Trade Assistance and Protection:
The GTAP 3 Data Base. Center for Global Trade Analysis, Purdue University.
Minor, Peter. 2002. Changes in Global Trade Rules for Textiles and Apparel: Implications
for Developing Countries. Nathan Associates, Arlington, VA. www.nathaninc.com.
Refatt, Amal. 2003. Trade-Induced Protectionism in Egypt’s Manufacturing Sector. The Egyptian Center for Economic Studies. Working Paper No. 85. Cairo Egypt.
49


Appendix A. Overview of Apparel Rules of Origin Apparel’s duty-free status depends not only on the type of final product (e.g., knit or woven) but also on the materials with which the product was made and the processes
used to make it. Rules of origin governing apparel’s duty status fall into three broad
categories that correspond to the segments in the apparel value chain:
• Single transformation. A garment must be cut and sewn by a party to the agreement
(cut, make, and trim).
• Double transformation. A garment must be cut and sewn of fabric formed (i.e., knit or woven) by a party to the agreement (fabric forward).
• Triple transformation. A garment must be formed by a party to the agreement from
yarn that was spun or extruded by a party to the agreement (yarn forward).
Within these categories many variations are possible. For example, NAFTA generally
provides for a triple-transformation (or yarn-forward) rule of origin. But the agreement
makes exceptions for fabrics in “short supply” and has provisions for some non-NAFTA yarns and fabrics.51 The number and types of variations will be limited only by the ability
of customs officials to enforce the rules.52
The CBTPA requires the use of U.S. yarns and fabrics in apparel claiming duty-free treatment to the U.S. market.53 The result of this rule is that beneficiaries of the CBTPA
exhibit considerable variation in the degree to which they benefit from the agreement.
Nicaragua can claim less than one-third of its apparel as duty free. The Dominican Republic claims nearly 90 percent of its apparel as duty free. A change in the rule of origin
could confer duty-free status on the remaining two-thirds of Nicaragua’s apparel exports
virtually overnight.
51 Forty-five percent of textiles and apparel from Canada enter under special tariff preference-level provisions that permit use of non-NAFTA materials, while only about 4 percent of U.S. imports of textiles and apparel from Mexico enter under such tariff preference-level programs because of additional restrictions on Mexico’s use of these provisions (OTEXA). 52 A premise of U.S. free trade agreements is that the rules of origin are enforceable and can limit illegal transshipments. 53 A notable exception is brassieres.
i

APPENDIX A A-2
Increasing the number of potential material suppliers can also improve the benefits of a
free trade area. At present, the United States does not support cumulating across free trade agreements. In contrast, the EU has promoted its Pan-Euro Rules of origin that
facilitate cumulation among free trade partners. Both the EU and the United States
support some forms of cumulation among preferential suppliers. These cumulation provisions vary significantly from arrangement to arrangement.

Appendix B. EU Textiles and Apparel Import Data
3


Egypt’s Exports of Textiles and Apparel to the E.U.
Egyptian Exports of Textiles and Apparel to the E.U. 2002
Unconstrained
100%High Risk
21%
Low Risk
19%
Egypt’s is not constrained by quotas
Asian countries generally are constrained by quotas
Source: Data from U.S. Department of Commerce. Low-risk exports are products in which Costa Rica and other countries are not constrained by quotas.
5
European Union Imports of Knit Shirts 2002
13.6
12.3
14.1
13.3
11.9
Average Price
5,381.3
424.8
448.9
4,419
88.2
Value (million Euro)
12.0396.1Total Imports
12.034.5Other Restrained
12.031.8China-Restrained
12.0332.5Other non-Restrained
12.07.4Egypt
2004MFN Tariff
Tons (1,000)
Country
Other Non-Restrained
82%
Egypt2%
China8%
Other -Restrained
8%
Combined Export Tax
Equivalent of Quotas = 23.2%Vietnam India
Pakistan China
Quota Restrained Countries

European Union Imports of Cotton Yarn 2002
3.1
3.2
6.1
2.8
4.6
Average Price
975.9
226.3
13.4
652.4
83.8
Value (million Euro)
4.0324.4Total Imports
4.170.1Other Restrained
4.02.3China
4.0234.0Other non-Restrained
4.118.1Egypt
2004MFN Tariff
Tons (1,000)
CountryEgypt
9%
Other -Restrained
24%
Other Non-Restrained
67%
Combined Export Tax
Equivalent of Quotas = 53.6%
Pakistan India
Quota Restrained Countries
European Union Imports of Men’s and Boy’s Briefs 2002
18.6
--
16.6
19.3
21.8
Average Price
1,699.9
--
485.7
1,161.7
52.5
Value (million Euro)
--91.5Total Imports
----Other Restrained
11.629.1China-Restrained
11.660.1Other non-Restrained
12.02.4Egypt
2004MFN Tariff
Tons (1,000)
Country
China29%
Egypt3%
Other Non-Restrained
68%
Export Tax Equivalent of
Chinese Quota = 8.9%
China
Quota Restrained Countries

European Union Imports of Terry Toweling and Similar Fabrics of Cotton 2002
6.2
--
6.5
6.7
4.8
Average Price
582.8
--
51.2
431.7
24.7
Value (million Euro)
12.094.2Total Imports
----Other Restrained
12.07.9China-Restrained
12.064.3Other non-Restrained
12.05.1Egypt
2004MFN Tariff
Tons (1,000)
Country
China10%
Egypt5%
Other Non-Restrained
85%
Combined Export Tax
Equivalent of Quota = 12.8%
PakistanChina
Quota Restrained Countries
European Union Imports of Trousers and Shorts 2002
16.1
12.9
8.65
17.8
11.8
Average Price
8,658.9
1,605.6
277.1
6,751.3
24.7
Value (million Euro)
12.1537.6Total Imports
12.1124.3Other Restrained
12.132.0China-Restrained
12.1379.2Other non-Restrained
12.12.1Egypt
2004MFN Tariff
Tons (1,000)
Country
Other -Restrained
18.5%
China3.2%
Egypt0.3%
Other Non-Restrained
78.0%
Combined Export Tax
Equivalent of Quota = 19.0%
VietnamThailand
TaiwanSouth Korea
MalaysiaMacao
PhilippinesPakistan
IndonesiaHong Kong
India China
Quota Restrained Countries

European Union Imports of Bed Linen not Knit 2002
6.6
5.8
12.8
6.7
5.6
Average Price
1,064.1
330.2
88.9
622.1
23.0
Value (million Euro)
12.0161.7Total Imports
12.056.7Pakistan -Restrained
12.06.9China-Restrained
12.093.9Other non-Restrained
12.04.1Egypt
2004MFN Tariff
Tons (1,000)
Country
Pakistan31.0%
China8.4%
Egypt2.2%
Other Non-Restrained
58.5%
Combined Export Tax
Equivalent of Quota = 11.8%
ChinaPakistan
Quota Restrained Countries
European Union Imports of Table Linen not Knit 2002
7.6
7.4
13.0
6.8
6.0
Average Price
407.2
81.1
79.5
223.8
22.7
Value (million Euro)
12.053.9Total Imports
12.011.0India -Restrained
12.06.1China-Restrained
12.032.9Other non-Restrained
12.03.8Egypt
2004MFN Tariff
Tons (1,000)
Country
Other - Restrained
19.9%
China19.5%
Egypt5.6%
Other Non-Restrained
55.0%
Combined Export Tax
Equivalent of Quota = 37.4%
IndiaChina
Quota Restrained Countries

Appendix C . EU Trade Agreement Partners and Beneficiaries This appendix lists the parties to regional trade or preferential trade agreements with the European Union, and beneficiaries of EU preferential arrangements, in force as of April
2002. The names of least-developed countries are in italics.54
Europe Agreements: Bulgaria, the Czech Republic, Estonia, Hungary, Latvia, Lithuania, Poland, Romania, Slovakia, Slovenia
Association Agreements: Cyprus, Malta, Turkey
Stabilization and Association Agreements: Former Yugoslav Republic of Macedonia (FYROM), Croatia
Euro-Mediterranean Association Agreements: Israel, Morocco, the Palestinian Authority,
Tunisia
Cooperation Agreements (Euro-Med Association Agreements concluded, but not in effect,
or under negotiation): Algeria, Egypt, Jordan, Lebanon, Syria
Other Free-Trade Agreements: Denmark (Faroe Islands), Iceland, Liechtenstein, Mexico, Norway, South Africa, Switzerland
Other Customs Unions: Andorra, San Marino
Association of Overseas Countries and Territories (OCT): Anguilla, Antarctica, Aruba, British Antarctic Territory, British Indian Ocean Territory, British Virgin Islands, Cayman
Islands, Falkland Islands, French Polynesia, French Southern and Antarctic Territories,
Greenland, Mayotte, Montserrat, Netherlands Antilles, New Caledonia, Pitcairn, Saint Helena, Ascension Island, Tristan da Cunha; South Georgia and the South Sandwich Islands,
St. Pierre and Miquelon, Turks and Caicos Islands, Wallis and Fortuna Islands.
9
54 WTO Secretariat, based on DG Trade (2001a).

APPENDIX C C-2
EU-African, Caribbean and Pacific (ACP) Partnership: Angola, Antigua and Barbuda,
Bahamas, Barbados, Belize, Benin, Botswana, Burkina Faso, Burundi, Cameroon, Cap Verde, Central African Republic, Chad, Comoros, Congo, Cook Islands, Dem. Rep. of Congo,
Cote d'Ivoire, Djibouti, Dominica, Dominican Republic, Equatorial Guinea, Eritrea, Ethiopia,
Federated States of Micronesia, Fiji, Gabon, Gambia, Ghana, Grenada, Guinea, Guinea-Bissau, Guyana, Haiti, Jamaica, Kenya, Kiribati, Lesotho, Liberia, Madagascar, Malawi, Mali, Marshall
Islands, Mauritania, Mauritius, Mozambique, Namibia, Nauru, Niger, Nigeria, Niue Islands,
Palau, Papua New Guinea, Rwanda, St. Christopher and Nevis, St. Lucia, St. Vincent and the Grenadines, Samoa, Sao Tome and Principe, Senegal, Seychelles,
Sierra Leone, Solomon Islands, Somalia, South Africa, Sudan, Suriname, Swaziland, Tanzania,
Togo, Tonga, Trinidad and Tobago, Tuvalu, Uganda, Vanuatu, Zambia, Zimbabwe
Autonomous Trade Measures for the Western Balkans: Albania, Bosnia-Herzegovina, the
Federal Republic of Yugoslavia, Kosovo
Generalized System of Preferences (GSP) only: Afghanistan, Argentina, Armenia, Azerbaijan, Bahrain, Bangladesh, Belarus, Bhutan, Bolivia, Brazil, Brunei Darussalam,
Cambodia, Chile, People’s Republic of China, Colombia, Costa Rica, Cuba, East Timor,
Ecuador, El Salvador, Georgia, Guatemala, Honduras, India, Indonesia, Iran, Iraq, Kazakhstan, Kyrgyzstan, Kuwait, Lao People’s Dem. Rep., Libyan Arab Jamahiriya, Malaysia,
Maldives, Moldova, Mongolia, Myanmar, Nepal, Nicaragua, Oman, Pakistan, Panama,
Paraguay, Peru, Philippines, Qatar, Russian Federation, Saudi Arabia, Sri Lanka, Tajikistan, Thailand, Turkmenistan, Ukraine, United Arab Emirates, Uruguay, Uzbekistan, Venezuela,
Viet Nam, Yemen; American Samoa, Bermuda, Bouvet Island, Cocos Islands, Cook Islands,
Gibraltar, Guam, Heard and McDonald Islands, Macao, Norfolk Island, Northern Mariana Islands, United States Minor Outlying Islands, Tokelau Islands, Virgin Islands (USA)

Appendix D. Sub-Saharan African Countries with AGOA Benefits
2001 2002Country Q1 Q2 Q3 Q4 Q1 Q2 Q3 Q4Kenya (January 18, 2001) XMauritius (January 19, 2001) XMadagascar (March 6, 2001) XSouth Africa (March 7, 2001) XLesotho (April 23, 2001) XSwaziland (July 26, 2001) XBotswana (August 27, 2001) X OEthiopia (August 2, 2001) XMalawi (August 15, 2001) XUganda (October 24, 2001) XNamibia (December 3, 2001) X OZambia (December 17, 2001) XTanzania (February 4, 2002) XMozambique (February 6, 2002) XCameroon (March 1, 2002) XGhana (March 20, 2002) XSenegal (April 23, 2002) XCôte d'Ivoire XX-Granted textile benefits.O-Granted LDC Status.
11


Appendix E. Data on U. S. Import Market Shares
13

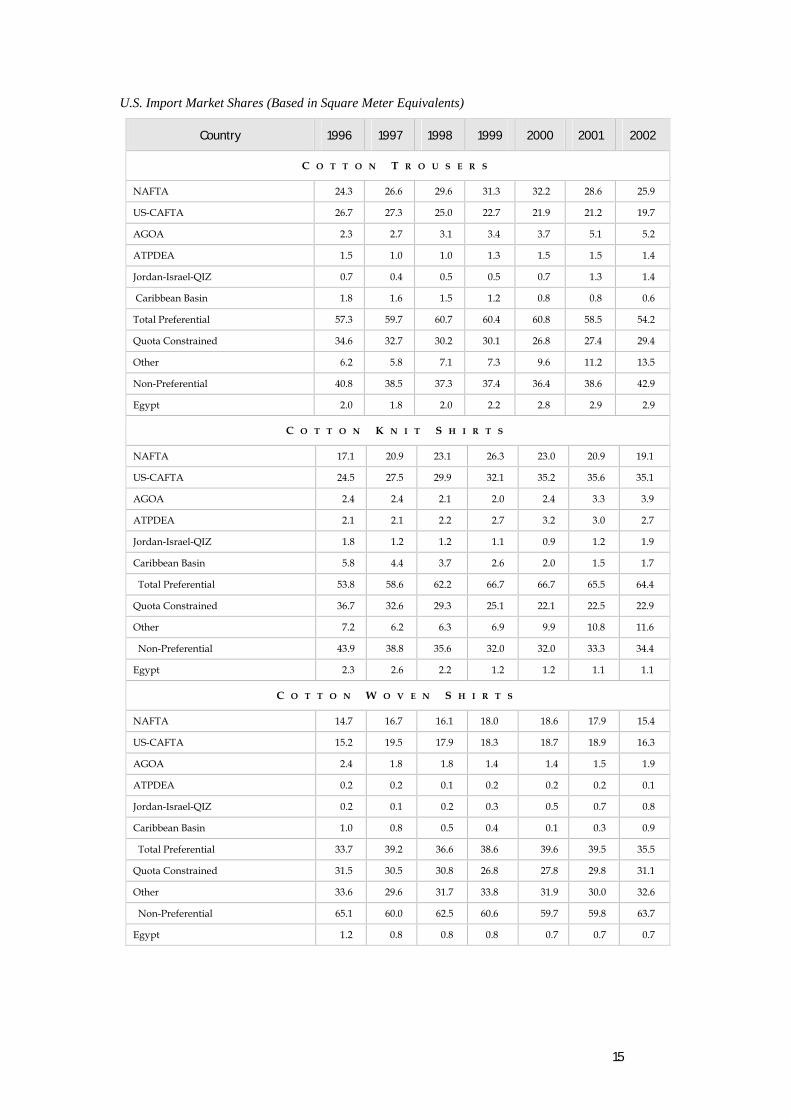
U.S. Import Market Shares (Based in Square Meter Equivalents)
Country 1996 1997 1998 1999 2000 2001 2002
C O T T O N T R O U S E R S
NAFTA 24.3 26.6 29.6 31.3 32.2 28.6 25.9
US-CAFTA 26.7 27.3 25.0 22.7 21.9 21.2 19.7
AGOA 2.3 2.7 3.1 3.4 3.7 5.1 5.2
ATPDEA 1.5 1.0 1.0 1.3 1.5 1.5 1.4
Jordan-Israel-QIZ 0.7 0.4 0.5 0.5 0.7 1.3 1.4
Caribbean Basin 1.8 1.6 1.5 1.2 0.8 0.8 0.6
Total Preferential 57.3 59.7 60.7 60.4 60.8 58.5 54.2
Quota Constrained 34.6 32.7 30.2 30.1 26.8 27.4 29.4
Other 6.2 5.8 7.1 7.3 9.6 11.2 13.5
Non-Preferential 40.8 38.5 37.3 37.4 36.4 38.6 42.9
Egypt 2.0 1.8 2.0 2.2 2.8 2.9 2.9
C O T T O N K N I T S H I R T S
NAFTA 17.1 20.9 23.1 26.3 23.0 20.9 19.1
US-CAFTA 24.5 27.5 29.9 32.1 35.2 35.6 35.1
AGOA 2.4 2.4 2.1 2.0 2.4 3.3 3.9
ATPDEA 2.1 2.1 2.2 2.7 3.2 3.0 2.7
Jordan-Israel-QIZ 1.8 1.2 1.2 1.1 0.9 1.2 1.9
Caribbean Basin 5.8 4.4 3.7 2.6 2.0 1.5 1.7
Total Preferential 53.8 58.6 62.2 66.7 66.7 65.5 64.4
Quota Constrained 36.7 32.6 29.3 25.1 22.1 22.5 22.9
Other 7.2 6.2 6.3 6.9 9.9 10.8 11.6
Non-Preferential 43.9 38.8 35.6 32.0 32.0 33.3 34.4
Egypt 2.3 2.6 2.2 1.2 1.2 1.1 1.1
C O T T O N W O V E N S H I R T S
NAFTA 14.7 16.7 16.1 18.0 18.6 17.9 15.4
US-CAFTA 15.2 19.5 17.9 18.3 18.7 18.9 16.3
AGOA 2.4 1.8 1.8 1.4 1.4 1.5 1.9
ATPDEA 0.2 0.2 0.1 0.2 0.2 0.2 0.1
Jordan-Israel-QIZ 0.2 0.1 0.2 0.3 0.5 0.7 0.8
Caribbean Basin 1.0 0.8 0.5 0.4 0.1 0.3 0.9
Total Preferential 33.7 39.2 36.6 38.6 39.6 39.5 35.5
Quota Constrained 31.5 30.5 30.8 26.8 27.8 29.8 31.1
Other 33.6 29.6 31.7 33.8 31.9 30.0 32.6
Non-Preferential 65.1 60.0 62.5 60.6 59.7 59.8 63.7
Egypt 1.2 0.8 0.8 0.8 0.7 0.7 0.7
15
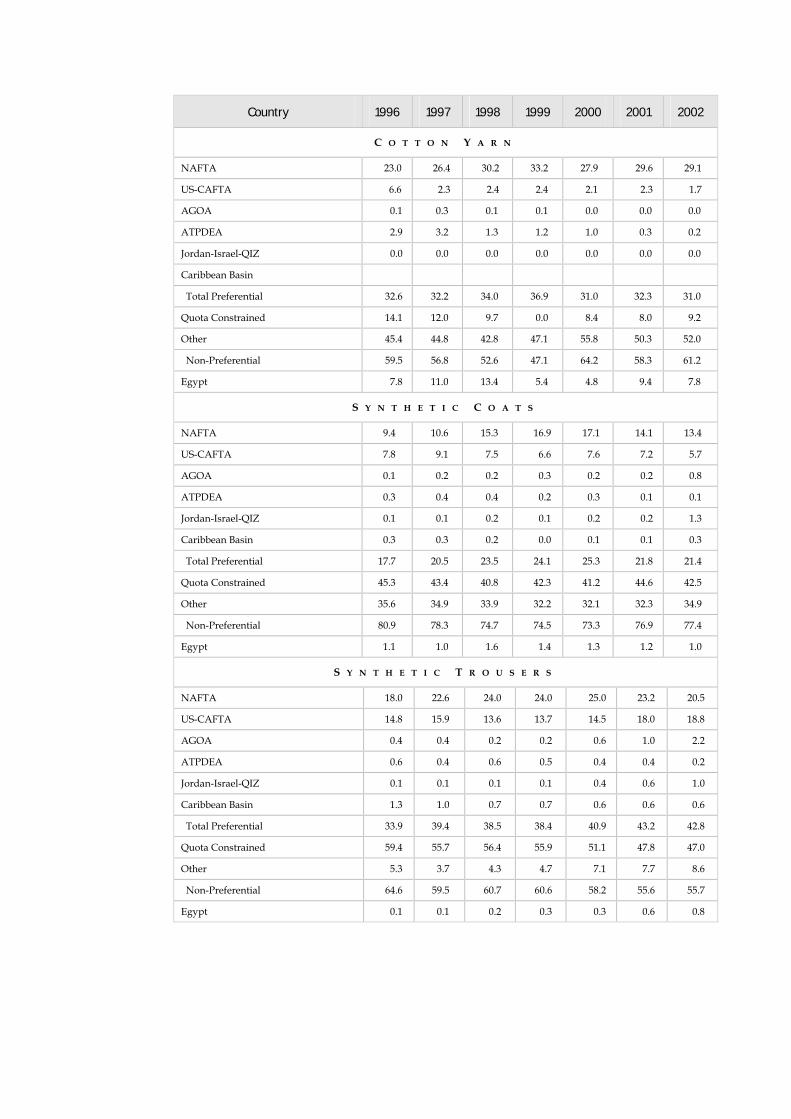
Country 1996 1997 1998 1999 2000 2001 2002
C O T T O N Y A R N
NAFTA 23.0 26.4 30.2 33.2 27.9 29.6 29.1
US-CAFTA 6.6 2.3 2.4 2.4 2.1 2.3 1.7
AGOA 0.1 0.3 0.1 0.1 0.0 0.0 0.0
ATPDEA 2.9 3.2 1.3 1.2 1.0 0.3 0.2
Jordan-Israel-QIZ 0.0 0.0 0.0 0.0 0.0 0.0 0.0
Caribbean Basin
Total Preferential 32.6 32.2 34.0 36.9 31.0 32.3 31.0
Quota Constrained 14.1 12.0 9.7 0.0 8.4 8.0 9.2
Other 45.4 44.8 42.8 47.1 55.8 50.3 52.0
Non-Preferential 59.5 56.8 52.6 47.1 64.2 58.3 61.2
Egypt 7.8 11.0 13.4 5.4 4.8 9.4 7.8
S Y N T H E T I C C O A T S
NAFTA 9.4 10.6 15.3 16.9 17.1 14.1 13.4
US-CAFTA 7.8 9.1 7.5 6.6 7.6 7.2 5.7
AGOA 0.1 0.2 0.2 0.3 0.2 0.2 0.8
ATPDEA 0.3 0.4 0.4 0.2 0.3 0.1 0.1
Jordan-Israel-QIZ 0.1 0.1 0.2 0.1 0.2 0.2 1.3
Caribbean Basin 0.3 0.3 0.2 0.0 0.1 0.1 0.3
Total Preferential 17.7 20.5 23.5 24.1 25.3 21.8 21.4
Quota Constrained 45.3 43.4 40.8 42.3 41.2 44.6 42.5
Other 35.6 34.9 33.9 32.2 32.1 32.3 34.9
Non-Preferential 80.9 78.3 74.7 74.5 73.3 76.9 77.4
Egypt 1.1 1.0 1.6 1.4 1.3 1.2 1.0
S Y N T H E T I C T R O U S E R S
NAFTA 18.0 22.6 24.0 24.0 25.0 23.2 20.5
US-CAFTA 14.8 15.9 13.6 13.7 14.5 18.0 18.8
AGOA 0.4 0.4 0.2 0.2 0.6 1.0 2.2
ATPDEA 0.6 0.4 0.6 0.5 0.4 0.4 0.2
Jordan-Israel-QIZ 0.1 0.1 0.1 0.1 0.4 0.6 1.0
Caribbean Basin 1.3 1.0 0.7 0.7 0.6 0.6 0.6
Total Preferential 33.9 39.4 38.5 38.4 40.9 43.2 42.8
Quota Constrained 59.4 55.7 56.4 55.9 51.1 47.8 47.0
Other 5.3 3.7 4.3 4.7 7.1 7.7 8.6
Non-Preferential 64.6 59.5 60.7 60.6 58.2 55.6 55.7
Egypt 0.1 0.1 0.2 0.3 0.3 0.6 0.8

Country 1996 1997 1998 1999 2000 2001 2002
C O T T O N J A C K E T S A N D C O A T S
NAFTA 4.8 5.7 7.3 6.5 7.8 7.4 7.2
US-CAFTA 3.1 3.7 4.2 3.2 3.8 2.8 5.7
AGOA 2.3 1.5 1.8 0.8 2.7 2.0 1.5
ATPDEA 0.7 1.5 0.9 1.1 0.7 0.6 0.5
Jordan-Israel-QIZ 0.2 0.2 0.2 0.2 0.5 0.2 0.8
Caribbean Basin 1.2 0.1 0.1 0.0 0.0 0.0 0.1
Total Preferential 11.0 12.5 14.4 11.8 15.6 13.1 15.7
Quota Constrained 45.9 50.3 45.0 47.7 43.2 49.1 47.1
Other 2.4 1.7 1.6 0.9 2.5 2.0 1.3
Non-Preferential 48.2 52.0 46.6 48.6 45.7 51.1 48.3
Egypt 39.5 35.3 38.9 39.6 38.7 35.7 35.9
SOURCE: U.S. Department of Commerce data. Author's calculations.


Appendix F. Data on Egyptian Textile and Apparel Import Duties
19
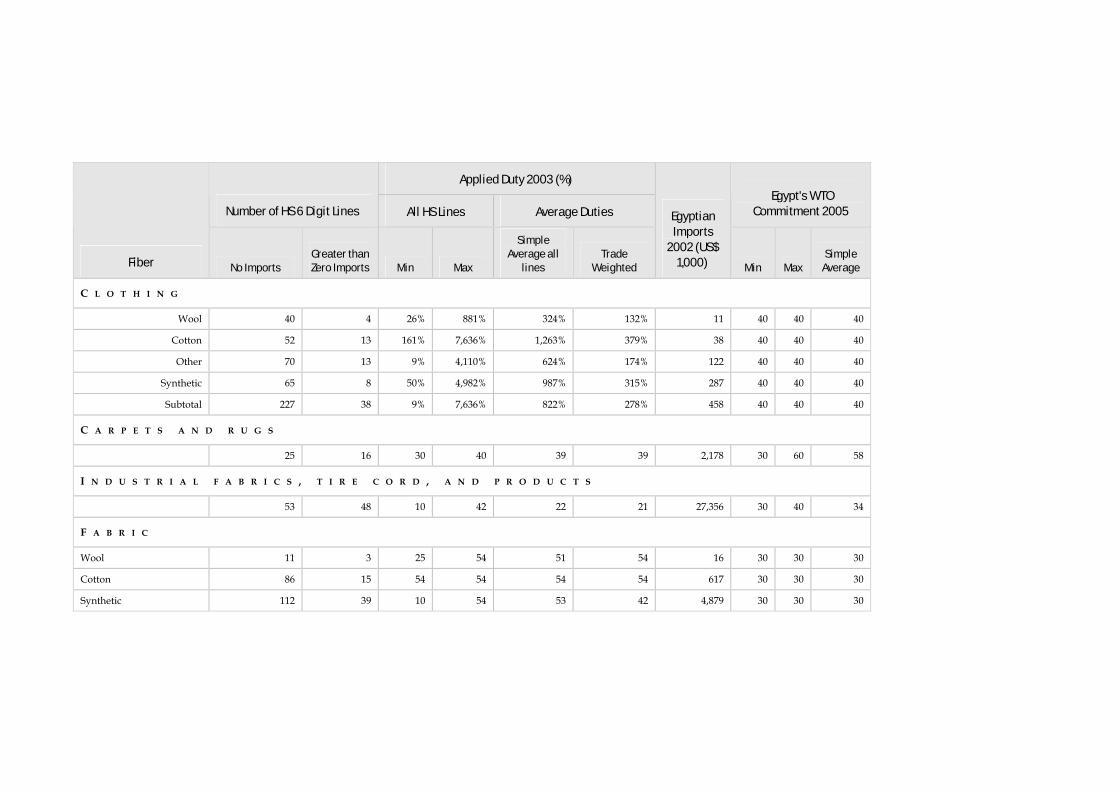
Applied Duty 2003 (%)
Number of HS 6 Digit Lines All HS Lines Average Duties Egypt's WTO
Commitment 2005
Fiber No Imports Greater than Zero Imports Min Max
Simple Average all
lines Trade
Weighted
Egyptian Imports
2002 (US$ 1,000) Min Max
Simple Average
C L O T H I N G
Wool 40 4 26% 881% 324% 132% 11 40 40 40
Cotton 52 13 161% 7,636% 1,263% 379% 38 40 40 40
Other 70 13 9% 4,110% 624% 174% 122 40 40 40
Synthetic 65 8 50% 4,982% 987% 315% 287 40 40 40
Subtotal 227 38 9% 7,636% 822% 278% 458 40 40 40
C A R P E T S A N D R U G S
25 16 30 40 39 39 2,178 30 60 58
I N D U S T R I A L F A B R I C S , T I R E C O R D , A N D P R O D U C T S
53 48 10 42 22 21 27,356 30 40 34
F A B R I C
Wool 11 3 25 54 51 54 16 30 3030
Cotton 86 15 54 54 54 54 617 30 3030
Synthetic 112 39 10 54 53 42 4,879 3030 30

APPENDIX G G-3
Applied Duty 2003 (%)
Number of HS 6 Digit Lines All HS Lines Average Duties Egypt's WTO
Commitment 2005
Fiber No Imports Greater than Zero Imports Min Max
Simple Average all
lines Trade
Weighted
Egyptian Imports
2002 (US$ 1,000) Min Max
Simple Average
Other 40 25 23 54 41 25 8,463 30 3030
Subtotal 249 82 10 54 51 33 13,976 30 30 30
H O M E F U R N I S H I N G S
29 25 0 54 31 33 3,315 15 30 27
Y A R N S A N D T H R E A D
Wool 9 5 30 30 30 30 488 15 1515
Cotton 49 19 30 30 30 30 3,890 15 1515
Other 12 8 15 30 22 22 6,491 15 1515
Synthetic 62 57 5 30 28 25 124,916 1515 15
Subtotal 132 89 5 30 28 25 135,785 15 15 15
TOTAL 715 298 -- -- 246 27 198,697 -- -- --
SOURCE: Author's compilation of Egyptian trade and tariff data. Specific duties have been converted to ad valorem equivalents using U.S. import data.


Appendix G. Description of the Model Estimation of the trade and employment impacts of quota removal in the U.S. and EU markets was carried out utilizing a comparative static partial equilibrium model of industry
trade. The specifications of the model are consistent with mainstream trade policy models
that define imports as imperfect substitutes (Armington 1969) and implemented in the United States International Trade Commission’s (USITC) Compas group of models
developed by Joseph Francois and Keith Hall (1993) and the Global Trade Analysis Project
(GTAP) administered by Perdue University. A key attribute of an Armington model is that both supply and demand components are balanced so that import and domestic markets
come into long-run equilibrium as a result of changes to tariffs or tariff equivalents of
quotas.
The aggregate demand function differentiating imports and domestic produced goods is
defined as:
(1) Q = ƒ (M, D)
where Q is aggregate commodity, M is imports and D is domestic product shipments net of
exports.
(2) eq = – (∂Q/∂P) . (P/Q)
where eq is the elasticity of demand for aggregate commodity, Q, with respect to a change
in its price, P.
(3) Pm = πm (1 + tm)
where Pm is the domestic price of imports, which equals world price, πm times one plus the
tariff rate, tm.
(4) Ed,m = (∂D/∂Pm ) . (Pm /D)
where Ed,m is the cross elasticity of demand for domestic production, D, with respect to a
change in the price of the imported good, Pm.
23

APPENDIX G G-2
(5) σ = (∂D/∂M). (M/D)
where σ is a constant elasticity of substitution (CES) between imported and domestically produced goods that holds at the base period.
(6) Sm = (Pm . M) /(P.Q)
where Sm is the share of imports in the value of total domestic demand.
Equation (4) depends on three variables: (i) the elasticity of substitution, σ; (ii) the elasticity
of demand for aggregate good, eq; and (iii) the share of imports in the value of total
domestic demand, Sm. After algebraic manipulations, equation (4) can be written as:
(7) Ed,m = (σ – eq) . Sm
Using a hat (^) to denote the rate of growth of a variable, substituting equation (7) into
equation (4), implies
(8) mmq PSeD ˆ)(ˆ ⋅−= σ
There are two special cases of equation (8). First, assume that the domestic and imported
goods have an elasticity of substitution of zero that is they are perfect complements. For instance, assume that left shoes are imported from Mexico and right shoes are produced in
the United States. In this case, σ = 0, and from equation (8), decreasing the price of the
imported good will actually raise the demand for the domestic good (assuming a non-zero elasticity of demand for pairs of shoes). The reason is that the decrease in the price of
imported left shoes lowers the cost, and the aggregate price P, of pairs of shoes. The result
is increased demand for pairs of shoes (depending on the elasticity of demand, eq), and hence also for domestically produced right shoes. In general, this effect will operate for any
sector in which the elasticity of substitution is lower than the price elasticity of demand for
the aggregate good (i.e., σ < eq).
Second, at the opposite extreme, if the domestic and imported goods are perfect
substitutes, equation (8) collapses: any change in import price will cause the domestic
industry to contract or expand dramatically, leading either to its complete elimination or to its complete dominance. Assuming in infinite elasticity of world supply, imports fully
displace domestic production. The assumption of perfect substitutability is not often
observed in markets for manufactured goods such as textiles and clothing. A time dimension does close the gap between the two opposite market structures, since it has been
observed that as the period over which changes are observed increases, substitution
between domestic and imported manufactured good increases.

APPENDIX G G-3
A review of equation 8 also illustrates that the impacts modeled in the Armington
framework depend on several important variables including:
• Market shares of constrained producers (quantity and value);
• Market shares of U.S. and EU producers;
• Market shares of non-constrained suppliers such as Egypt (quantity and value); • Estimates of the restrictiveness of quotas (tariff equivalents of quotas);
• Substitutability of imports for domestic production and between import sources; and
• The supply constraints (elasticities).
Data on market shares and estimates of tariff equivalents of quotas (presented in the body
and appendices of this report) were combined with estimates of product substitution and
supply elasticities. Elasticities were specified according to research conducted by Hummels (1999), McDaniel and Balistreri (2002) and Dimaranan, McDougall, and Hertel (1998).
Elasticity estimates provided were aggregates in relation to the product level presented in
this paper. According to research conducted by McDaniel and Balistreri (2002) it can be expected that elasticities for detailed products would be higher than empirical estimates,
however, no attempt was made to adjust elasticities from the levels indicted by empirical
research. Therefore, the estimates presented in this report are conservative in that the impact would be higher for product-specific analysis.
Employment impacts were modeled based on a fixed input-output multiplier based on the
average employment-to-output ratios derived from CAPMAS data for 1998. CAPMAS data did not provide sufficient details to derive separate multipliers each for textiles and
apparel, therefore, an average of the two was applied.