changing hillslope and fluvial holocene sediment dynamics ... et al 2011_jqs.pdf · are important...
TRANSCRIPT

Changing hillslope and fluvial Holocene sedimentdynamics in a Belgian loess catchment
BASTIAAN NOTEBAERT,1* GERT VERSTRAETEN,1 DIMITRI VANDENBERGHE,2 ELENA MARINOVA,1,3
JEAN POESEN1 and GERARD GOVERS11Department of Earth and Environmental Sciences, KU Leuven, Heverlee, Belgium2Vakgroep geologie en bodemkunde, Universiteit Gent, Gent, Belgium3Centre for Archaeological Sciences, KU Leuven, Heverlee, Belgium
Received 22 December 2009; Revised 12 May 2010; Accepted 2 June 2010
ABSTRACT: Floodplain deposition is an essential part of the Holocene sediment dynamics of many catchments and a thoroughdating control of these floodplain deposits is therefore essential to understand the driving forces of these sediment dynamics. In thispaper we date floodplain and colluvial deposition in the Belgian Dijle catchment using accelerator mass spectrometric radiocarbonand optical stimulated luminescence dating. Relativemass accumulation curves for theHolocenewere constructed for three colluvialsites and 12 alluvial sites. A database was constructed of all available radiocarbon ages of the catchment and this database wasanalysed using relative sediment mass accumulation rates and cumulative probability functions of ages and site-specific sedimen-tation curves. Cumulative probability functions of ages were split into different depositional environments representing stable phasesand phases of accelerated clastic deposition. The results indicate that there is an important variation between the different dated sites.After an initial stable early and middle Holocene phase with mainly peat growth in the floodplains, clastic sedimentation ratesincreased from 4000 BC on. This first phase was more pronounced and started somewhat earlier for colluvial deposits then for alluvialdeposits. The main part of the Holocene deposits, both in colluvial and alluvial valleys, was deposited during the last 1 ka. Thesedimentation pattern of the individual dated sites and the catchment-wide pattern indicate that land use changes are responsible forthe main variations in the Holocene sediment dynamics of this catchment, while the field data do not provide indications for aclimatological influence on the sediment dynamics. Copyright # 2011 John Wiley & Sons, Ltd.
KEYWORDS: dating; alluvium; colluvium; Holocene; land use change; climate change.
Introduction
Soil erosion, sediment transport, deposition and redistributionare important geomorphological processes during the Holo-cene in many temperate regions. A large number of studieshave indicated the strong link between anthropogenic land useand soil erosion and colluvial deposition, while also climaticevents may have a determining influence (e.g. review inDotterweich, 2008). These driving forces can also have animportant influence on sediment storage in floodplains (e.g.Trimble, 2009; Verstraeten et al., 2009a), while river systemsand floodplains may also buffer the influence of suchcatchment perturbations for the downstream parts of thecatchment (e.g. Knox, 2006; Walling et al., 2006). Over timespans of centuries to millennia, river systems are not onlytransporting sediment but also play an important role in thestorage of sediments: floodplain sedimentation often makes upan important fraction of the total eroded sediment, and thecombined amount of sediments stored as colluvium and infloodplains most often exceeds the amount of sedimentexported from catchments of at least some square kilometres(e.g. Hoffmann et al., 2007; Rommens et al., 2006). In theperspective of the transition from nature-dominated to human-dominated environmental changes during the Holocene (e.g.Messerli et al., 2000; Meybeck, 2003), the changing influenceof anthropogenic land use and climatic variations on thesediment dynamics is of particular interest. Holocene climaticand land cover variations have caused large variations insediment dynamics in many temperate regions, but theindividual contribution of both factors to the variations inthe sediment dynamics is often difficult to quantify.Establishing links between forcing factors and sediment
deposition relies on an accurate and detailed dating control of
floodplain deposition. Dating of floodplain deposits is,however, often problematic, e.g. due to the unavailability ofdatable material or methodological problems with the useddating techniques (Verstraeten et al., 2009b). Dating offloodplain sediments is often based on radiocarbon dating,although there are recent developments in the dating ofsediment chronologies using optical dating and the applicationof terrestrial nuclides (e.g. Lang, 2008). One of the majorproblems with radiocarbon dating is the unavailability ofdatable material in many floodplain deposits, leading to lowtemporal resolutions. Several approaches have been applied toenhance the use of radiocarbon dating: statistical analysis ofradiocarbon dates (e.g. Macklin and Lewin, 2003; Hoffmannet al., 2008) and derivative parameters (e.g. Hoffmann et al.,2009), and the use of replicate samples for accuracy testing andBayesian modelling of resulting probability distributions (e.g.Chiverell et al., 2009).
Verstraeten et al. (2009b) stress the importance of establish-ing precise chronologies and the construction of temporallydifferentiated sediment budgets in order to derive therelationships between environmental variability and sedimentdynamics. Such budgets are the accounting of sources, sinksand pathways of sediment (Reid and Dunne, 2003; Slaymaker,2003). According to Foulds and Macklin (2006), sedimentbudgeting is a necessary tool to understand the role of landuse change on catchment stability, as it identifies reach-scalezones of sediment transfer and storage. Several studieshave constructed catchment-wide sediment budgets for relativeshort periods ranging from days to a few decades (e.g. Beach,1994; Page et al., 1994; Fryirs and Brierley, 2001; Trimble,1983, 1999; Walling and Quine, 1993; Walling et al., 2002,2006), while other studies have concentrated on long-termsediment budgets (e.g. spanning the entire Holocene). Onlyfew studies have constructed a time-differentiated sedimentbudget for periods covering at least the period since theintroduction of agriculture (e.g. de Moor and Verstraeten,2008; Trimble, 2009; Verstraeten et al., 2009a). Such time-
JOURNAL OF QUATERNARY SCIENCE (2011) 26(1) 44–58 ISSN 0267-8179. DOI: 10.1002/jqs.1425
Copyright � 2011 John Wiley & Sons, Ltd.
*Correspondence: Bastiaan Notebaert, Division of Geography, Department ofEarth and Environmental Sciences, KU Leuven Celestijnenlaan 200E, 3001,Heverlee, Belgium.E-mail: [email protected]

differentiated sediment budgets provide insight into thetemporal and spatial variability in sediment fluxes, allowingmore robust relationships between driving forces and thesediment dynamics.The objective of this paper is to date sediment deposition in
alluvial and colluvial environments in the medium-scaled Dijlecatchment (758 km2), located in the central Belgian Loess Belt.Radiocarbon dating and optically stimulated luminescence(OSL) dating are used and evaluated. Based on the availabledates, a catchment-wide pattern of sedimentation is derivedand this is being qualitatively linked to environmental changesas driving forces. Finally, the available dates are combined withan existing Holocene sediment budget (Notebaert et al., 2009)in order to construct a time-differentiated sediment budget.This sediment budget can be used to establish quantitativerelationships between the environmental changes and vari-ations in sedimentation rates.
Study area
Within this study the Dijle catchment upstream of Leuven (758km2) is considered (Fig. 1). The catchment consists of a loess-covered undulating plateau ranging between 80 and 165mabove sea level (a.s.l.), in which river valleys have incised.There is a long history of land use, with first traces of agriculturefrom the Atlantic Period (ca. 5800–3000 BC), and intensiveanthropogenic land use during the Roman Period and fromthe Middle Ages on. A more detailed description of thecatchment can be found in Notebaert et al. (2009). The fluvialarchitecture of the Dijle catchment indicates that overbankdeposition in floodplains is the most important Holoceneprocess (Notebaert, 2009). Floodplain and backswamp sedi-ments are loamy and silty, while point bar and river bedsediments are sandy. The sandy sediment which is related to thelateral migration of the riverbed is limited to parts of thefloodplain, and the majority of the floodplain consists of acontinuous aggradation profile.
Methods
Corings were located along cross-sections through the flood-plain (Notebaert, 2009), and cross-sections and corings wereselected for dating using several criteria: representativeness
according to the local fluvial architecture, suitability to datefloodplain aggradation and availability of datable material.Accelerator mass spectrometry (AMS) radiocarbon dating andOSL dating were combined and typically one coring per crosssection was dated. Corings were selected based on theirsuitability to provide insight into net floodplain aggradation:they lack traces of erosional boundaries or river channel andpoint bar deposits, and thus represent continuous Holoceneaggradation profiles. Based on the available OSL and radio-carbon ages, sedimentation curves are constructed for theindividual dated sites. The available sedimentation rates weretransformed into mass accumulation rates, giving the massaccumulation per floodplain or colluvial valley area, byapplying a bulk density value and correcting for the presenceof organic material (see below). Next, these mass accumulationcurves where normalised by the total Holocene deposited massat the study site in order to allow direct comparison betweenthe different dated sites.
AMS radiocarbon dating
Samples for radiocarbon dating were taken using handaugering, percussion drilling and profile pits. In this study intotal 12 sites were dated using radiocarbon and OSL dating,ranging from small colluvial valleys to the main alluvial plain.Colluvial deposits at two sites were dated in detail by Rommenset al. (2007) and Rommens (2006), yielding 12 dates. In thisstudy detailed dating was performed at the Bilande site, with 18radiocarbon dates. Dating of floodplain deposits is availablefrom the Nethen catchment from Mullenders et al. (1966) andRommens et al. (2006), with three and 10 radiocarbon datesrespectively. De Smedt (1973) dated peat accumulation at onelocation in the main Dijle valley using five radiocarbon dates.Within this study, 44 samples were dated: one site (Korbeek-Dijle) was dated in detail, while for 10 other sites at least twosamples were dated. In total 29 radiocarbon dates fromcolluvial deposits and 62 from alluvial deposits are available(see Fig. 1 for sampling locations). Except for the bulk samples,each sample was sieved and datable material was handpickedfrom the fraction larger than 125mm. Terrestrial plant remainsandwoodwere selected for dating, in order to avoid hard-watereffects (e.g. Moor et al., 1998) and reservoir effects (e.g.Tornqvist et al., 1992). Resulting conventional radiocarbon
Figure 1. Location of the Dijle catchment within Belgium and sampling sites for radiocarbon and OSL dating in the Dijle catchment. B, Brussels;L, Leuven.
Copyright � 2011 John Wiley & Sons, Ltd. J. Quaternary Sci., Vol. 26(1) 44–58 (2011)
FLUVIAL HOLOCENE SEDIMENT DYNAMICS IN A BELGIAN LOESS CATCHMENT 45

ages (BP) were calibrated using Oxcal 4.1 (Bronk Ramsey,2001, 2009) and the Intcal 04 calibration curve (Reimer et al.,2004). Calibrated ages are here referred to as ‘cal a BP’(calibrated years before 1950) or as ‘cal a’ BC/AD or BC/AD,and uncalibrated ages as ‘14C a BP’.
OSL dating
OSL dating was used for the floodplain of the Dijle River nearKorbeek-Dijle. Sampling of OSL datable material was carriedout with percussion drilling equipment, using PVC tubes oflength 1m and an inner diameter of 5 cm. The PVC tubes wereopened in the laboratory under subdued orange light. Samplesfor luminescence analysis were taken about every 13 cm, witheach collected sample representing a vertical interval of �5–8 cm. In this manner, 32 samples were collected, of which 15were selected for dating in the frame of this work. The sampleswere relatively fine grained, with grains in the range of 63–90mm generally representing the coarsest fraction that was stillpracticable for luminescence analysis. Luminescence analysiswas performed at Ghent University. Quartz grains from thisfraction were extracted using conventional sample preparationtechniques (HCl, H2O2, sieving, heavy liquids, HF). A sufficientamount of quartz grains could be extracted from 11 of the 15samples. The purity of the quartz extracts was confirmed by theabsence of a significant infrared stimulated luminescence (IRSL)response at 608C to a large regenerative beta dose. Thesensitivity to infrared stimulation was defined as significant ifthe resulting signal amounted to more than 10% of thecorresponding blue light stimulated luminescence (BLSL) signal(Vandenberghe, 2004) or if the IR depletion ratio was not within10% of unity (Duller, 2003).For measurement, quartz grains were spread out on the inner
7mm of 9.7mm diameter stainless steel discs. The luminescencemeasurements were performed using an automated Risø-TL/OSL-Da-15 reader, equipped with blue (470� 30nm) LEDs and IR(875nm) diodes; all luminescence emissions were detectedthrough a 7.5mm thick Hoya U-340 UV filter. Details onthe measurement apparatus can be found in Bøtter-Jensen et al.(2003).The equivalent dose (De) was determined using the single-
aliquot regenerative-dose (SAR) protocol (Murray and Wintle,2000). Optical stimulation with the blue diodes was for 38 s at1258C; the initial 0.3 s of stimulation was used in thecalculations, minus a background evaluated from the following0.5 s of stimulation. A preheat of 10 s at 1808C and a test-dosecut heat to 1608C were adopted; the preheat at 1808C waschosen to minimise thermal transfer (i.e. transfer of charge byheating from light-insensitive but thermally stable traps, intolight-sensitive traps). After the measurement of each test dosesignal, a high-temperature bleach was performed by stimulat-ing with the blue diodes for 40 s at 2808C (Murray and Wintle,2003). Measured aliquots were accepted if the recuperationand IRSL/OSL ratio did not exceed a threshold set at 10%, and ifboth the recycling ratio and the IR depletion ratio were within10% of unity. The suitability of the experimental procedure wasconfirmed through a dose recovery test as outlined by Murrayand Wintle (2003; see also Table 1). The overall (n¼ 11)average recovered to given dose ratio (� 1 standard error, s) is1.00� 0.01, which gives confidence in the reliability of thelaboratory measurement procedure. For each sample, at least15 replicate measurements of De were made.The dosimetry (i.e. beta and gamma dose rates) is based on
low-level gamma ray spectrometric analysis of sedimentcollected above and below each OSL sample, and used doserate conversion factors derived from the nuclear energy releasestabulated by Adamiec and Aitken (1998). Water contents were T
able
1.
Summaryofrad
ionuclideac
tivity
concentrations,estimates
ofthetime-av
erag
ewater
content(w.c.),c
alcu
lateddose
rates,D
eva
lues,o
ptica
lage
san
ddose
reco
very
datafortheOSL
samplesoftheKorbee
k-Dijle
site
intheDijle
catchmen
t.Theunce
rtainties
men
tioned
withthedosimetry,D
ean
ddose
reco
very
dataarerandom;theunce
rtainties
ontheoptica
lag
esrepresentthetotalunce
rtainty,whichincludes
the
contributionfrom
system
atic
sources
oferror(Aitke
n,1985).Allunce
rtainties
are1s.Thedose
rate
includes
theco
ntributionfrom
cosm
icrays
andinternal
radioactivity.Thenumber
ofaliquotsusedin
luminescence
analyses
(Dedeterminationan
ddose
reco
very)isgivenin
paren
theses.Columnsheaded
’Allaliquots’referto
values
obtained
byav
eragingtheD
eove
rallaliquots;co
lumnshea
ded
’Aliquotsrejected
’referto
values
obtained
byca
lculatingD
efollowingtheproce
dure
based
onFu
chsan
dLa
ng(2001;seetext
fordetails).Thedose
reco
very
testco
nsisted
ofbleachingfreshaliquotsusingbluediodes
(2�250switha10ks
pau
sein
betwee
n),givingthem
adose
close
totheex
pec
tednaturaldose,an
dmea
suringthem
usingtheSA
Rprotoco
l.
GLL
code
Dep
th(cm)
238U
(Bqkg
�1)
226Ra
(Bqkg
�1)
210Pb
(Bqkg
�1)
232Th
(Bqkg
�1)
40K
(Bqkg
�1)
w.c.
(%)
Dose
rate
(Gyka
�1)
Allaliquots
De(G
y)Age
(ka)
’Aliquotsrejected
’
De(G
y)Age
(ka)
Dose
reco
very
081504
�30
36�2
39�2
32�1
36.6
�0.4
458�11
21�5
2.44�0.03
0.78�0.07(15)
0.32�0.05
0.55�0.03(7)
0.23�0.03
0.99�0.05(6)
081508
56
31�2
40�2
31�3
40�1
518�5
38�4
2.25�0.04
1.5�0.1
(17)
0.65�0.07
1.17�0.04(11)
0.52�0.04
0.95�0.04(6)
081512
80
31�2
42�2
35�2
41�1
534�25
38�4
2.32�0.06
4.0�0.5
(18)
1.7�0.2
1.9�0.2
(3)
0.8�0.1
0.97�0.02(5)
081517
109
32�2
38�3
34�1
36.9
�0.5
509�8
38�4
2.20�0.02
4.2�0.3
(17)
1.9�0.2
2.7�0.2
(4)
1.2�0.1
1.01�0.04(6)
081521
144
32�2
44�9
36�5
42�9
603�70
38�4
2.48�0.19
2.2�0.2
(16)
0.9�0.1
1.73�0.04(8)
0.70�0.08
1.04�0.02(6)
081525
159
33�4
34�2
34�2
36.8
�0.5
561�13
38�4
2.30�0.03
2.1�0.1
(17)
0.89�0.08
1.75�0.05(9)
0.76�0.06
1.04�0.04(4)
081532
220
38�2
37�2
34�2
36�1
493�5
38�4
2.15�0.03
1.67�0.07(16)
0.78�0.07
1.53�0.04(11)
0.71�0.06
0.97�0.03(5)
081536
245
31�3
39�6
37�8
40�9
565�75
38�4
2.36�0.21
2.6�0.2
(17)
1.1�0.2
1.88�0.06(6)
0.8�0.1
0.96�0.03(6)
081542
282
37�3
47�5
42�2
39�1
458�31
38�4
2.19�0.07
2.56�0.06(19)
1.2�0.1
2.12�0.08(3)
0.97�0.09
1.00�0.02(6)
081549
378
38�2
49�2
41�1
44�1
548�73
38�4
2.42�0.16
4.9�0.1
(18)
2.0�0.2
4.8�0.1
(16)
2.0�0.2
1.02�0.03(6)
081567
579
12�2
14�3
13�1
10.9
�0.4
181�4
24�3
0.90�0.02
24.7�0.7
(19)
27�2
23.7�0.5
(16)
26�2
1.00�0.03(6)
Copyright � 2011 John Wiley & Sons, Ltd. J. Quaternary Sci., Vol. 26(1) 44–58 (2011)
46 JOURNAL OF QUATERNARY SCIENCE
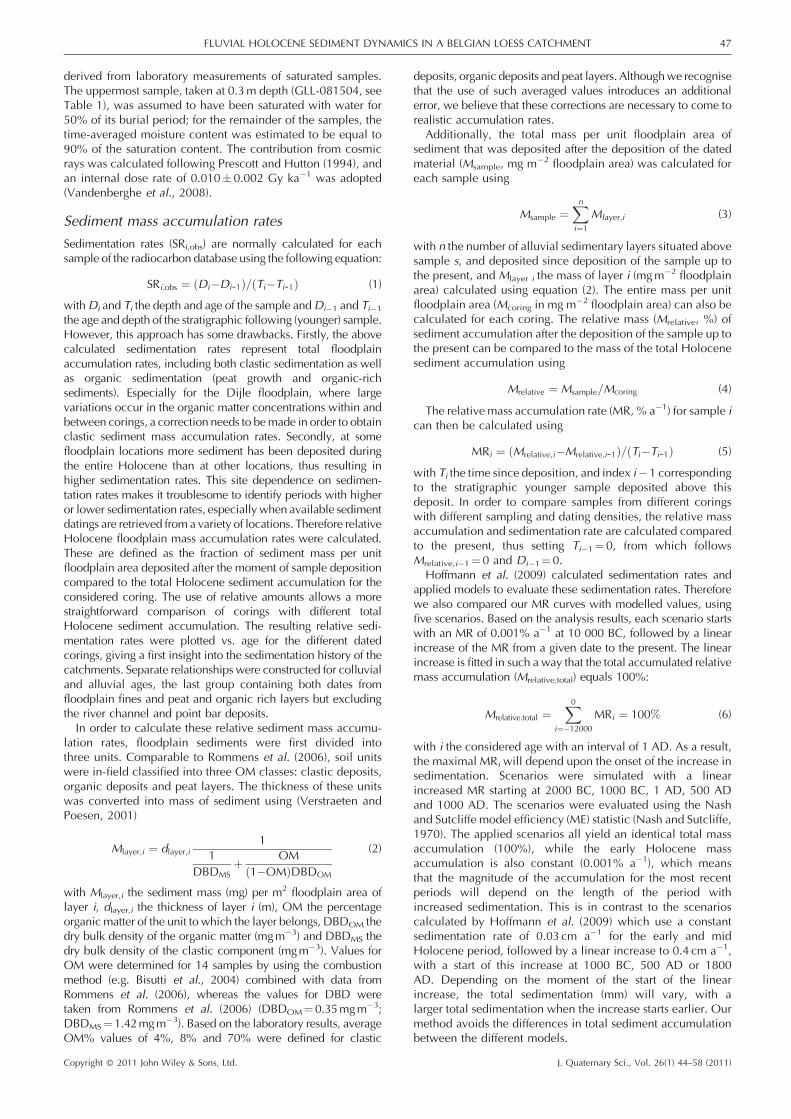
derived from laboratory measurements of saturated samples.The uppermost sample, taken at 0.3m depth (GLL-081504, seeTable 1), was assumed to have been saturated with water for50% of its burial period; for the remainder of the samples, thetime-averaged moisture content was estimated to be equal to90% of the saturation content. The contribution from cosmicrays was calculated following Prescott and Hutton (1994), andan internal dose rate of 0.010� 0.002 Gy ka�1 was adopted(Vandenberghe et al., 2008).
Sediment mass accumulation rates
Sedimentation rates (SRi,obs) are normally calculated for eachsample of the radiocarbon database using the following equation:
SRi;obs ¼ ðDi�Di-1Þ=ðTi�Ti-1Þ (1)
withDi and Ti the depth and age of the sample andDi�1 and Ti�1
the age and depth of the stratigraphic following (younger) sample.However, this approach has some drawbacks. Firstly, the abovecalculated sedimentation rates represent total floodplainaccumulation rates, including both clastic sedimentation as wellas organic sedimentation (peat growth and organic-richsediments). Especially for the Dijle floodplain, where largevariations occur in the organic matter concentrations within andbetween corings, a correction needs to bemade in order to obtainclastic sediment mass accumulation rates. Secondly, at somefloodplain locations more sediment has been deposited duringthe entire Holocene than at other locations, thus resulting inhigher sedimentation rates. This site dependence on sedimen-tation rates makes it troublesome to identify periods with higheror lower sedimentation rates, especially when available sedimentdatings are retrieved from a variety of locations. Therefore relativeHolocene floodplain mass accumulation rates were calculated.These are defined as the fraction of sediment mass per unitfloodplain area deposited after the moment of sample depositioncompared to the total Holocene sediment accumulation for theconsidered coring. The use of relative amounts allows a morestraightforward comparison of corings with different totalHolocene sediment accumulation. The resulting relative sedi-mentation rates were plotted vs. age for the different datedcorings, giving a first insight into the sedimentation history of thecatchments. Separate relationships were constructed for colluvialand alluvial ages, the last group containing both dates fromfloodplain fines and peat and organic rich layers but excludingthe river channel and point bar deposits.In order to calculate these relative sediment mass accumu-
lation rates, floodplain sediments were first divided intothree units. Comparable to Rommens et al. (2006), soil unitswere in-field classified into three OM classes: clastic deposits,organic deposits and peat layers. The thickness of these unitswas converted into mass of sediment using (Verstraeten andPoesen, 2001)
Mlayer;i ¼ dlayer;i1
1
DBDMSþ OM
ð1�OMÞDBDOM
(2)
with Mlayer,i the sediment mass (mg) per m2 floodplain area oflayer i, dlayer,i the thickness of layer i (m), OM the percentageorganic matter of the unit to which the layer belongs, DBDOM thedry bulk density of the organic matter (mgm�3) and DBDMS thedry bulk density of the clastic component (mgm�3). Values forOM were determined for 14 samples by using the combustionmethod (e.g. Bisutti et al., 2004) combined with data fromRommens et al. (2006), whereas the values for DBD weretaken from Rommens et al. (2006) (DBDOM¼ 0.35mgm�3;DBDMS¼ 1.42mgm�3). Based on the laboratory results, averageOM% values of 4%, 8% and 70% were defined for clastic
deposits, organic deposits and peat layers. Althoughwe recognisethat the use of such averaged values introduces an additionalerror, we believe that these corrections are necessary to come torealistic accumulation rates.Additionally, the total mass per unit floodplain area of
sediment that was deposited after the deposition of the datedmaterial (Msample, mg m�2 floodplain area) was calculated foreach sample using
Msample ¼Xn
i¼1
Mlayer;i (3)
with n the number of alluvial sedimentary layers situated abovesample s, and deposited since deposition of the sample up tothe present, and Mlayer i the mass of layer i (mgm�2 floodplainarea) calculated using equation (2). The entire mass per unitfloodplain area (Mcoring in mg m�2 floodplain area) can also becalculated for each coring. The relative mass (Mrelative, %) ofsediment accumulation after the deposition of the sample up tothe present can be compared to the mass of the total Holocenesediment accumulation using
Mrelative ¼ Msample=Mcoring (4)
The relative mass accumulation rate (MR, % a�1) for sample ican then be calculated using
MRi ¼ ðMrelative;i�Mrelative;i-1Þ=ðTi�Ti-1Þ (5)
with Ti the time since deposition, and index i� 1 correspondingto the stratigraphic younger sample deposited above thisdeposit. In order to compare samples from different coringswith different sampling and dating densities, the relative massaccumulation and sedimentation rate are calculated comparedto the present, thus setting Ti�1¼ 0, from which followsMrelative,i�1¼ 0 and Di�1¼ 0.Hoffmann et al. (2009) calculated sedimentation rates and
applied models to evaluate these sedimentation rates. Thereforewe also compared our MR curves with modelled values, usingfive scenarios. Based on the analysis results, each scenario startswith an MR of 0.001% a�1 at 10 000 BC, followed by a linearincrease of the MR from a given date to the present. The linearincrease is fitted in such a way that the total accumulated relativemass accumulation (Mrelative,total) equals 100%:
Mrelative;total ¼X0
i¼�12000
MRi ¼ 100% (6)
with i the considered age with an interval of 1 AD. As a result,the maximal MRi will depend upon the onset of the increase insedimentation. Scenarios were simulated with a linearincreased MR starting at 2000 BC, 1000 BC, 1 AD, 500 ADand 1000 AD. The scenarios were evaluated using the Nashand Sutcliffe model efficiency (ME) statistic (Nash and Sutcliffe,1970). The applied scenarios all yield an identical total massaccumulation (100%), while the early Holocene massaccumulation is also constant (0.001% a�1), which meansthat the magnitude of the accumulation for the most recentperiods will depend on the length of the period withincreased sedimentation. This is in contrast to the scenarioscalculated by Hoffmann et al. (2009) which use a constantsedimentation rate of 0.03 cm a�1 for the early and midHolocene period, followed by a linear increase to 0.4 cm a�1,with a start of this increase at 1000 BC, 500 AD or 1800AD. Depending on the moment of the start of the linearincrease, the total sedimentation (mm) will vary, with alarger total sedimentation when the increase starts earlier. Ourmethod avoids the differences in total sediment accumulationbetween the different models.
Copyright � 2011 John Wiley & Sons, Ltd. J. Quaternary Sci., Vol. 26(1) 44–58 (2011)
FLUVIAL HOLOCENE SEDIMENT DYNAMICS IN A BELGIAN LOESS CATCHMENT 47

Cumulative probability distributions
Recently, several studies use cumulative probability distributions(CPDs) of radiocarbon ages obtained from alluvial and/orcolluvial deposits for the analysis and comparison of Holocenefluvial dynamics within Europe. Techniques were compiled andapplied on data from Great Britain (e.g. Macklin and Lewin,2003; Lewin et al., 2005) and later applied in Poland (Starkelet al., 2006), Spain (Thorndycraft and Benito, 2006a,b), Germany(Hoffmann et al., 2008) and in the Rhine catchment (Hoffmannet al., 2009). A comparison is also made between datasetsobtained from Great Britain, Poland and Spain (Macklin et al.,2006). For the analysis of German datasets (Hoffmann et al.,2008) several methodological improvements were introduced.The radiocarbon ages used are grouped in a different way: whereLewin et al. (2005) focus mainly on changes in fluvial style orsedimentation rates, Hoffmann et al. (2008) calculate frequencydistributions of ages which are yielded from deposits correspond-ing to active sedimentation phases. Hoffmann et al. (2008) arguethat this results in a better proxy of the response to externalimpacts. The frequency distributions of German dates were alsonormalised, which limits the effects of the calibration curve,different preservation potentials and sampling bias. RecentlyMacklin et al. (2010) further improved the analysis of thefrequency distributions of radiocarbon ages from the UK.In this study a database of radiocarbon ages from the Dijle
catchment was compiled, holding all available radiocarbondates from colluvial and alluvial deposits, based on this studyand previous studies (Mullenders et al., 1966; De Smedt, 1973;Rommens, 2006; Rommens et al., 2006). Radiocarbon ageswhich are considered problematic in the original publicationare not included in the database. The ages of this database weregrouped and for the different groups cumulative probabilitydistributions (CPDs) were constructed by the addition of theprobability functions of the individual calibrated radiocarbonages. A distinction was made between different sedimentaryfacies (e.g. Hoffmann et al., 2008): colluvial deposits, flood-plain fines (overbank deposits), river channel and point bardeposits, and peat and organic-rich layers. Samples fromchannel and point bar deposits are not included in this analysisdue to the low number of dated samples (Table 2). These faciestypes were then again grouped in terms of their fluvial activity(Table 3; based on Hoffmann et al., 2008): the first two areconsidered to represent phases of active colluvial or alluvialsediment deposition; the last one is considered to representphases of relative stability in the clastic floodplain accumu-lation phases. Most sampling of peat and organic-rich layersoccurred at the bottom or the top of these layers, in order todate the transition between clastic and organic floodplainaccumulation, which can bias the distributions of peat ages.The shape of the calibration curve used also has an influence
on the resulting CPDs. This effect is illustrated by the CPD of100 equally spaced ages with an (uncalibrated) standard
deviation of 45 a. The used standard deviation of 45 a equalsthe average standard deviation of the radiocarbon ages in thedatabase. Each of the calculated CPDs can be divided by theCPD of equally spaced ages in order to correct for the effectsof calibration curve (Hoffmann et al., 2008). Alternatively, acorrection can be made by dividing a CPD by the CPD ofall available ages (Hoffmann et al., 2008). As preservationpotential does not present a problem for the samples of the Dijlecatchment due to the sampling techniques, where only sampleswere taken from corings with a continuous aggradation profileduring the Holocene, this method was not applied here. Onlyfor colluvial depots might the preservation potential play a role,as sedimentary evidence for intact aggradational colluvialarchives is not available. Apart from the problems with thecalibration curve and the preservation potential, otherlimitations may arise with the methodology used (Hoffmannet al., 2008), related to the variable precision of radiocarbonages and the possible time difference between the age ofdeposition and the age of the dated material.
Time-differentiated sediment budget
A Holocene sediment budget was previously constructed forthe Dijle catchment (Notebaert et al., 2009). A detaileddescription of the methodology can be found in Notebaert et al.(2009). The calculations were adapted in this study to the moreaccurate measurements of organic matter content of the peatlayers which are mentioned above. In order to get a deeperinsight into the sediment dynamics of a catchment, it isimportant to incorporate also the temporal dynamics of thesystem. Based on the available ages, and comparable withother studies (e.g. Trimble, 1999, 2009; de Moor andVerstraeten, 2008; Verstraeten et al., 2009a), the sedimentbudget was differentiated in three time periods: early Holoceneto 2000 BC, 2000 BC to 1000 AD and 1000 AD to present.These periods were selected based on the sedimentation historyof the catchment. A more detailed time differentiation of thesediment budget would require a more detailed dating of thealluvial and colluvial deposits.
The time differentiation of sediment deposition is based onthe relative mass accumulation rate (MR, equation (5)) for thedated sites. Based on the site-specific values, a weightedaverage mass accumulation for each period was calculated forthe trunk valley, tributary valleys and the colluvial valleys. Only(dated) sites were usedwhere a date was available within a timeframe of ca. 1000 a (for 2000 BC) or ca. 500 a (for 1000 AD)from the starting date of the considered time periods. Siteswhere no dates for these start points are available but where theuncertainty on the relative accumulated mass for these pointsis smaller than 10%, e.g. due to a small relative massaccumulation increase between two available dates, are alsoused. In this way the averaging effects between the dated pointsare minimised. Weighting was based on the floodplain widthand Holocene sediment thickness. The selecting of sites andweighting result in a difference in the catchment averagedsedimentation curve compared to a pure mathematical curve.
Table 2. Groups of sedimentary facies, available number of radio-carbon ages and number of radiocarbon ages used for the analysis ofradiocarbon ages in the Dijle catchment.
Sedimentary faciesNumber of14C ages
Number ofages used
Colluvial deposits 29 21Floodplain fines (overbank deposits) 10 10River channel and point bar deposits 1 1Peat and organic rich layers 51 49Top of peat layer 19 19Bottom of peat layer 13 12Total 91 81
Table 3. Different activity groups, available number of radiocarbonages and number of radiocarbon ages used for the analysis of radio-carbon ages in the Dijle catchment.
Activity groupNumber of14C ages
Number ofused ages
Aggradation 39 31Stability 51 49
Copyright � 2011 John Wiley & Sons, Ltd. J. Quaternary Sci., Vol. 26(1) 44–58 (2011)
48 JOURNAL OF QUATERNARY SCIENCE

Dating information is only available for deposition environ-ments, while temporal information on the sediment sources(erosion rates) and catchment export is absent. In order to cometo a catchment-wide budget incorporating these sources andsinks, some assumptions are required:
1. Verstraeten et al. (2009a) assume that catchment exportfollows the same trends as floodplain storage. They statethat sediment deposition is controlled by inundation fre-quency and sediment concentration – factors which alsocontrol sediment yield. As a result, periods with higherfloodplain storage will also be periods with higher exportfrom the catchment. For the Dijle catchment it is demon-strated that floodplain storage was very low during the earlyand mid Holocene, while during this same period a fixedriver channel is absent and water is transported in a diffuseway over a broad floodplain, without forming typical riverbed deposits (De Smedt, 1973). Such a diffuse water trans-port is most probably accompanied by very low sedimentexport rates.
2. For each period mass is preserved. As a result the sedimentproduction equals the sum of the export and the colluvialand alluvial storage.
3. As no dates are available for sediment deposition onthe hillslopes (excluding colluvial valley deposition), thetemporal framework for this sink should be based onsome assumptions. This hillslope sediment deposition canbe assumed to follow an equal trend as sediment depositionin the colluvial valleys. This is the first scenario (’scenario 1’)that is calculated. For the Nethen catchment, however,Verstraeten et al. (2009a) argue that this would result inan unrealistic sediment delivery ratio of nearly 100% for theperiod before colluvial deposition starts (early Holocene).Modelling results in the Geul catchment (de Moor andVerstraeten, 2008) show indeed a high sediment deliveryratio for the early and mid Holocene, but still much lowerthan 100%. Therefore, scenario 2 was developed by assum-ing that sediment deposition on the slopes is assumed tofollow the same trend as the combined storage in colluvialand alluvial deposits, an approach which yielded morerealistic values in the Nethen catchment according toVerstraeten et al. (2009a).
Results
Dating floodplain and colluvial accumulation
In this study the colluvial valley at Bilande (for location seeFig. 1) was dated in detail. In total 16 samples were dated usingradiocarbon dating and sample depth is plotted againstcalibrated age in Fig. 2. Radiocarbon dating performed oncharcoal samples or samples containing both charcoal andterrestrial plant remains or wood is problematic: six out of eightsamples show an age–depth inversion. Possibly the two lowercharcoal-based dates suffer also an age–depth inversion, butsampling and dating resolution is insufficient for conclusions.The overestimation of age for those charcoal dates can easily beexplained by the cascade model of colluvial formation (Langand Honscheidt, 1999). This implies that older colluvialdeposits have been eroded, and material from these oldercolluvial deposits is thus reworked and again deposited at theircurrent location.The dating from the Bilande site shows two important
sedimentation phases and one stability phase: a first sedimen-tation phase starts around 2000 cal a BC and is followed by theformation of an organic layer of which the top is dated around 1AD. Parts of this first depositional phase show layers, indicating
that it does not originate from a single event. After the formationof the organic layer again clastic sediment was deposited.Between 1 AD and about 1000 AD, sedimentation rate appearsto be low, although this can be caused by the limited datingresolution, which causes an averaging effect. A majorsedimentation phase occurred between 1230 AD and 1295cal a AD (1s calibrated interval, 1150–1450 cal a AD on a 2sinterval), with the deposition of at least 1.87m sediment. Someparts of these deposits show layering, including small (1–3mm)layers containing plant remains and traces of in situ growingplants, indicating that this depositional phase is not caused by asingle event. Due to the absence of dates in the upper part of thecoring, the extent of this major deposition phase and thesubsequent deposition rates cannot be derived. Drainage tubesfrom ca. 1846 AD are located at a depth of 0.4–0.6m,indicating that deposition in the last 150 a was less than 0.2m.Dating results of the floodplain of the Dijle near Korbeek-
Dijle (for location see Fig. 1) are represented in Fig. 3. Table 1summarises the results from De and dose rate determination ofthe OSL dating, and shows the calculated optical ages (see alsoFig. 4, squares). It can be seen that not all age results areconsistent with the stratigraphic position of the samples.We interpret this inconsistency as indicative for incompleteresetting of the OSL clock in the quartz grains. A large spread inDe values was observed for the majority of the samples, withrelative standard deviations ranging from �20% (sample GLL-081532) to 50% (sample GLL-081512). This also indicates thatthe aliquots consist of a mixture of grains which have beenreset to various degrees. Interestingly, the variability is already
Figure 2. Overview of the coring data at Bilande (Dijle catchment)with radiocarbon dates. Sampling depths and calibrated radiocarbonages are plotted on the right. Boxes indicate the calibrated radiocarbonages with a 2s error: black boxes are ages based on charcoals; greyboxes are ages based on terrestrial plant remains and wood. The dashedline indicates the suggested sedimentation history. The width of theboxes in the left column varies with the texture. The presence of twoboxes indicates an alternation of fine layers with different texture.Layering is indicated by a light-grey filling; organic deposits areindicated by dark-grey filling.
Copyright � 2011 John Wiley & Sons, Ltd. J. Quaternary Sci., Vol. 26(1) 44–58 (2011)
FLUVIAL HOLOCENE SEDIMENT DYNAMICS IN A BELGIAN LOESS CATCHMENT 49

observed for large (i.e. 7mm diameter) aliquots, which mayimply that only a small fraction of the grains contributes to themeasured luminescence. TheDe values for the three lowermostsamples (samples GLL-081542, -49 and -67) have a higheraccuracy, with values of the relative standard deviation in therange of 9–13%. For sample GLL-081532, the relative standarddeviation of theDe data is 16%. As all samples exhibit a similaroverall luminescence sensitivity, this variability in precisionindicates that resetting in the lowermost samples was morehomogeneous (and possible more complete), and/or that theycontainmore grains that contribute to themeasured signal, witheach grain emitting less intense luminescence (so that grain-to-grain variations are averaged out to a greater extent). As theuppermost 4–5m of sediment is probably derived from thesame source, samples GLL-081504 to -49 are expected toexhibit the same material characteristics. Therefore, the valueof the relative standard deviation is taken as a measure for thedegree of resetting.Fuchs and Lang (2001) suggested a procedure to improve De
determination in incompletely reset samples using a limitedamount of replicate measurements. This procedure consists ofarranging the De values in ascending order, and calculating arunning mean (starting with the two lowermost De values) until
the relative standard deviation exceeds the value of what isdefined as the precision of the method. We applied thisprocedure to our dataset, with the precision of the measure-ment method being defined as that observed in the doserecovery tests. The resulting ages are shown in Fig. 4 (circles;see Table 1 for the analytical data). It can be seen that the OSLages are now stratigraphically more consistent, with the datasetcontaining only one clear outlier (sample GLL-081517).
Concerning the De selection procedure outlined above, itshould be pointed out that (i) it may yield ages that stilloverestimate the true burial age (as they are derived from OSLsignals originating with more than one grain), (ii) it assumes thatthe precision obtained in measurements of artificially bleachedand irradiated aliquots accurately represents the precisionthat would be observed for well-bleached natural samples, and(iii) it assumes that also a very limited number of replicatemeasurements yields a reliable estimate for the burial dose.These considerations should be taken into account wheninterpreting the age results and limit the conclusions that canbe drawn.
The ages obtained for the three lowermost samples (GLL-081542 and -49 situated in overbank or backswamp silts andGLL-081567 situated in the braided river sandy deposits) arebased on the most reproducible measurements of the De.The date of 23.7� 0.5 ka for sample GLL-081567 confirms thepresumed Late Pleistocene age of the sandy braided riverdeposits below the peat layer. The set of OSL ages for theoverlying unit suggests that it was deposited in at least twodistinct phases. A first phase comprises the sediments at a depthof �4m to �3m, which were deposited between 2.0� 0.2 ka(sample GLL-081549) and before �1 ka ago (sample GLL-081542). A second phase is characterised by a significantlyhigher sedimentation rate, as the uppermost 3m of sedimentmust have been deposited in less than 1 ka.
We hypothesise that more heterogeneous resetting of theluminescence signal in the uppermost samples gives anindication for a high sedimentation speed. A high sedimen-tation speed lowers the probability for all grains to have theirluminescence signal reset at the moment of deposition.
The depositional and sedimentary history of the Korbeek-Dijle site shows formation of a basal peat layer between�8000BC and�500 BC. It is unclear whether a second date of the topof the peat layer giving �5000 BC is correct, as this date isobtained from a bulk sample and reworking of peat cannot be
Figure 4. Plot of age vs. depth for the OSL ages at Korbeek-Dijle (seealso Fig. 3). The error bars represent the overall random uncertainty (1s)only. As such, the figure allows evaluation of the internal consistency ofthe optical ages. The squares refer to ages based on themeanDe over allmeasured aliquots; the circles refer to the ages obtained after rejectingDe values following a procedure similar to the one proposed by Fuchsand Lang (2001; see text for details). This figure is available in colouronline at wileyonlinelibrary.com.
Figure 3. Overview of the coringdata at Korbeek-Dijle (Dijle catch-ment) with radiocarbon and OSLdates. Peat layers are indicated bygrey shading. Boxes indicate ageswith a 2s error: black boxes indicateradiocarbon ages; light-grey boxesindicate corrected OSL ages. A radio-carbon date obtained from charcoal isindicated by ‘1’. The dashed linerepresents the proposed sedimen-tation history.
Copyright � 2011 John Wiley & Sons, Ltd. J. Quaternary Sci., Vol. 26(1) 44–58 (2011)
50 JOURNAL OF QUATERNARY SCIENCE

excluded. A subsequent sedimentation phase ends around1100 AD, with a major sedimentation period around 500 AD.Of the three samples yielding ages of�500 AD, the deepest oneis yielding the oldest uncalibrated age, but they are overlappingon a 2s calibrated interval. The top of a second peat layer isdated by radiocarbon dating around 900 AD and byOSL datingaround 1200 AD. The OSL age is considered to be moreaccurate: the radiocarbon date is obtained from a bulk sample,with possibly age overestimation due to reservoir effects andradiocarbon dates not obtained from bulk samples ofcomparable peat layers at other locations yield ages between1000 and 1400 AD. The main sedimentation phase at Korbeek-Dijle is situated after the formation of this peat layer. This phasesuffers from a low dating resolution. However, we discussedthat the heterogeneity of the luminescence signal resetting givesan indication for high sedimentation rates. Additionally, whenassuming that the error on the luminescence ages with rejectedaliquots gives a good indication of the real age, it can be arguedthat sedimentation is concentrated around 0.6–0.8 ka ago, withthe deposition of 1.6–1.8m sediments. This implies that duringthe last 500 a only about 0.6m of sediment is deposited.
Catchment-wide pattern of floodplain andcolluvial deposition
Figure 5 plots the age and relative accumulated mass per unitdepositional area for the colluvial sites, whereas Fig. 6 providesthis information for alluvial sites. Based on Fig. 6 the averageaccumulated sediment mass for the tributaries and main trunkfloodplain was calculated (Fig. 7). The calculated rates are notcorrected for the dating resolution of the different sites and aretherefore influenced by averaging effects.Data for the colluvial sites show the start of deposition
between �4160 BC and �600 BC, while the main accumu-lation of sediment mass occurred for all sites in the last 3 ka(Fig. 5). During the last ca. 1 ka between 60% and 30% of thesediment mass accumulation took place. As for most alluvialsites only two or three dates are available, these curves sufferlargely from an averaging effect and interpretation shouldconsider this averaging. Within the alluvial graphs (Fig. 6) onemajor outlier is apparent: at the site Bonlez U almost allsedimentation took place before ca. 1400 BC. After the earlyand mid Holocene aggradation phase the river incised thefloodplain to a depth of �6m (Notebaert, 2009). The onlydating control on this incision phase is the age of the top of thefloodplain (ca. 1400 BC). This site has an important influence
on the average values calculated for the tributary floodplains(Fig. 7). For sites where the first Holocene floodplainaccumulation is dated, this phase is situated between 10 000and 8000 BC. Mass accumulation before 500 BC is ratherlimited for most sites, although there is a wide scatter. Most sitesshow a first increase in sediment accumulation between4000 BC and 500 BC, with again a high scatter. A secondincrease in sediment accumulation is observed for most sitesaround 1000 AD.Due to the averaging effect and the rather low resolution of
the dates, it is not possible to identify short-term variations insediment accumulation, and thus it is not clear how long thesedimentation phases lasted, or what the intensity of thephases was. The possibility of intermediate periods with lessaccumulation cannot be excluded. The presence in most cross-sections of a peat layer within the upper clastic layer (e.g.Korbeek-Dijle site, see above) suggests a stable phase. Ages forthis peat layer range between 700 and 1400 AD.The average relative sediment mass accumulation (Fig. 7)
provides an overview of the catchment-wide sedimentationpatterns. These averages are, however, still largely influencedby single dated cross-sections, as indicated by the influence ofthe Bonlez U cross-section. These averaged values indicate that
Figure 5. Age and relative accumulated sediment mass for the differ-ent dated corings in colluvial deposits in the Dijle catchment. Data forthe Nodebais are reported by Rommens et al. (2006) and data for theBeauvechain site by Rommens (2006).
Figure 6. Age and relative accumulated sediment mass for the differ-ent dated corings in alluvial deposits in the Dijle catchment. Data forRotspoel are obtained fromDe Smedt (1973). A value of 70% is used forthe percentage of organic matter in the peat layers.
Figure 7. Age and average relative accumulated sediment mass forthe different dated corings in alluvial deposits in the Dijle catchment.Average values are calculated for the main trunk valley, tributaries,tributaries excluding the dates from the Bonlez U cross-section and forall cross-sections. A value of 70% is used for the percentage of organicmatter in the peat layers.
Copyright � 2011 John Wiley & Sons, Ltd. J. Quaternary Sci., Vol. 26(1) 44–58 (2011)
FLUVIAL HOLOCENE SEDIMENT DYNAMICS IN A BELGIAN LOESS CATCHMENT 51

deposition in the trunk valley floodplain is mainly concentratedin the last 1–2 ka. Deposition in the tributary floodplainsincreased earlier than in the trunk valley floodplain, with animportant increase starting around 2000 BC. This pattern is,however, influenced by averaging effects caused by the datingresolution. To make a correct interpretation of the sedimen-tation history for the trunk valley floodplains, for each timeframe only sites should be included with a sufficient temporaldating resolution for the considered period.
Analysis of sedimentation rates
The plots of sedimentation rates (SR) and the relative massaccumulation rates (MR) (Fig. 8) show rather constant SR andMR values before 4000 BC, slightly increasing values between4000 BC and 1000 BC, and then more increasing values after1000 BC, while also the scatter increases. Model efficiencyvalues for several sedimentation rate scenarios were comparedwith these plots (Table 4). For the fluvial ages ME was alsocalculated excluding the dates of Bonlez U (Table 4; seeabove). ME is highest for the model with increased colluvialsedimentation starting at 1000 BC and alluvial sedimentation at1 AD. However, from the pattern of floodplain and colluvialdeposition it is clear that such scenarios are an oversimplifica-tion of the real sedimentation history as these do notincorporate several phases of increased or decreased sedi-mentation. Nevertheless, the models give an indication of atime lag between the start of increased sedimentation incolluvial and alluvial deposits.An increase in sedimentation rate with a decreasing
measuring period is reported for many sedimentary deposits,and this phenomenon has been linked to a time dependency insediment accumulation rates (e.g. Sadler, 1981; Schumer andJerolmack, 2009). This is being linked to unsteady discontinu-
ous sedimentation. As such, the observed increase in sedimentdeposition cannot only be explained by a true increase due tovariations in driving forces, but also by an apparent increasecaused by such scaling effects. As there is no systematicsampling for shallower or deeper Holocene deposits, samplingdensity (in depth) can be more or less equal for the entireHolocene sequence. As such, higher sedimentation rates forshorter time spans are a logical consequence. Lowersedimentation rates, and thus more or longer periods withlittle or no sedimentation, are also an essential part thesediment dynamics. In order to correct for a possible measuringperiod dependence in sedimentation rates, dating should beperformed homogeneously in time over the Holocene period,which implies for most dated places in the Dijle catchmentthat the sampling density in depth should largely vary. Acoupling between the calculated sedimentation rates or(relative) mass accumulation rates and the fluvial architectureand site-specific sedimentation histories also indicates thattime dependency is not the only explaining factor for highrecent rates.
Cumulative probability functions of radiocarbonages
The CPD of floodplain fines ages (Fig. 9A) shows peaks around1500–1300 BC, 250–750 AD and 1250–1650 AD. The CPD ofcolluvial ages (Fig. 9B) shows peaks around 4300–4000 BC,2250–1900 BC, 900 BC–500 AD, 900 AD–1400 AD and 1450AD to present. The charcoal ages from Bilande are consideredto be reworked and redeposited, and therefore they were notincluded in the original analysis. However, they also indicatephases of past colluviation more upstream, which wassubsequently eroded (Lang and Honscheidt, 1999), andtherefore they can also be introduced into the CPD (Fig. 9C).The resulting CPD differs slightly: there are additional peaksbetween 2000 and 1000 BC. All these CPDs rely on a lownumber of ages which cause a high sensibility to individualsamples. The combined CPD for aggradation ages (Fig. 10, B andC) shows comparable peaks, with aggradation ages concentratedafter 2000 BC with lower probabilities at ca. 1900 BC, ca. 1650BC, 1100–900 BC, ca. 800 BC, ca. 400 BC and 1400–1450 AD.
The CPD off all peat ages (Fig. 10A) shows peaks at 9650–9300 BC, 9150–8650 BC, 8250 BC, 7750–7600 BC, 6350–5750 BC, 5600–5000 BC, 4700–4550 BC, 4450–3800 BC,2850–2550 BC, 2150–1450 BC, 750–50 BC, 220–400 AD,650–800 AD and 1000–1500 AD. Compared with theaggradation ages, the stability ages show a larger scatter.
Although the CPDs in this study are based on low numbers ofdata, which biases their interpretation, we consider that theystill provide a framework for an objective analysis of theavailable radiocarbon ages. From the CPDs it is clear thataggradation, both colluvial and alluvial, occurred mainlyduring the end of the Holocene, after 2000 BC. The given data
Figure 8. Sedimentation rates (SR) and relative mass accumulationrates (MR) plotted vs. depth for the available radiocarbon dates in theDijle catchment. (A) Sedimentation rates; (B) relative mass accumu-lation rates; (C) relative mass accumulation rates including the differentmodelled scenarios.
Table 4. Model efficiencies (ME) for the different scenarios for relativemass accumulation rates compared to calculated relative massaccumulation rates based on radiocarbon ages of the Dijle catchment.
Scenario:increase from
ME colluvialdates
ME alluvialdates
ME alluvial datesexcluding Bonlez U
2000 BC 0.46 �0.48 �0.361000 BC 0.73 �0.23 �0.091 AD 0.72 �0.04 0.09500 AD 0.56 �0.05 0.051000 AD 0.03 �0.19 �0.13
Copyright � 2011 John Wiley & Sons, Ltd. J. Quaternary Sci., Vol. 26(1) 44–58 (2011)
52 JOURNAL OF QUATERNARY SCIENCE

suggest that between 2000 BC and 1 AD colluvial aggradationwas more important than alluvial aggradation. Peat ages,indicating stable phases, are rather well spread over theHolocene. The simultaneous occurrence of stability andaggradation peaks during the last 4 ka suggests a spatialheterogeneity within the catchment: while some parts areprone to aggradation, floodplains in other parts are stable. Sucha spatial heterogeneity can point to different responses offloodplains to the same external forcings, or to heterogeneity inthese external forcings.
Time-differentiated sediment budget
Table 5 and Fig. 11 show the results of the temporaldifferentiated sediment budget for the two scenarios describedabove. These results are based on the dating results and thusshow comparable patterns of varying sedimentation rates. Ascolluvial valley deposition is very low for the first period (early
Holocene to 2000 BC), scenario 1 yields a hillslope sedimentdelivery ratio (HSDR) for this first period of 96%, which isvery high. These HSDR rates are considered unrealistically highby Verstraeten et al. (2009a). Using scenario 2, HSDR drops to83%, which is at first sight a more realistic value. On the otherhand, hillslope colluvial deposition is often reported to beassociated with agricultural practices and the creation oflynchets (e.g. Houben, 2006, 2008). Colluvial deposition isalso very rare or absent in the historical forests of the catchment,for which we can assume that these experienced only a minimalanthropogenic impact (e.g. Langohr and Sanders, 1985). Indeed,before 4000 BC no traces of colluvial deposition could be foundso far in the Dijle catchment (see CPD analysis), which wouldmean that the HSDR is indeed near 100%.Off course, the spatialrepresentativeness of our dataset is limited and it cannottherefore be excluded that some slopes do have limited colluvialdeposits. Based on all these observations both scenario 1 and 2can be valid (Fig. 12).
Figure 9. Cumulative probability functions (CPDs) for radiocarbonages in the Dijle catchment. Probabilities are divided by the probabilityof equally spaced ages. The grey shaded area indicates where therelative probability is larger than average. (A) Floodplain fines (n¼ 10);(B) colluvial deposits (n¼21); (C) colluvial deposits including rejectedcharcoal ages from Bilande (n¼29).
Figure 10. Cumulative probability functions (CPDs) for radiocarbonages in the Dijle catchment. Probabilities are divided by the probabilityof equally spaced ages. The grey shaded area indicates where therelative probability is larger than average. (A) All peat ages (n¼49); (B)all aggradation ages (n¼31); (C) all aggradation ages including rejectedcharcoal ages from Bilande (n¼39).
Table 5. Temporal differentiated sediment budget for the Dijle catchment, using two different scenarios (see text).
Hillslopeerosion (Tg)
Hillslopedeposition (Tg)
Colluvial valleydeposition (Tg)
Hillslopeexport (Tg)
HSDR(%)
Tributaryfloodplaindeposition (Tg)
Trunk valleyfloodplaindeposition (Tg)
Export(Tg)
SDR(%)
Scenario 1Period 1: 9000 BC–2000 BC 69.2 1.0 1.8 66.4 95.9 32.0 13.8 20.5 29.7Period 2: 2000 BC–1000 AD 209.3 42.6 73.8 93.0 44.4 26.8 26.6 39.5 18.9Period 3: 1000 AD–present 535.4 75.9 131.5 328.1 61.3 132.6 78.6 116.8 21.8
Scenario 2Period 1: 9000 BC–2000 BC 79.9 11.7 1.8 66.4 83.1 32.0 13.8 20.5 25.7Period 2: 2000 BC–1000 AD 195.4 28.7 73.8 93.0 47.6 26.8 26.6 39.5 20.2Period 3: 1000 AD–present 538.6 79.1 131.5 328.1 60.9 132.6 78.6 116.8 21.7
Total Holocene 814.0 119.5 207.1 487.4 59.9 191.5 119.1 176.9 21.7
Copyright � 2011 John Wiley & Sons, Ltd. J. Quaternary Sci., Vol. 26(1) 44–58 (2011)
FLUVIAL HOLOCENE SEDIMENT DYNAMICS IN A BELGIAN LOESS CATCHMENT 53

The results (Fig. 12) show that during the second period(2000 BC–1000 AD) colluvial deposition is more importantthan alluvial deposition. The relative importance of floodplaindeposition increases again during the last period (1000 AD–present). This demonstrates a lag time between colluvialstorage and floodplain storage, as was demonstrated before.
Discussion
Several methods were used to analyse the available radio-carbon dates (Table 6). Relative sedimentation and massaccumulation rates were constructed for each individual coringsite and a general pattern was extracted (Fig. 8). Construction ofthese diagrams, especially the mass accumulation, requires theavailability of a detailed coring description (e.g. layer thickness,texture, OM and DBD). Owing to the low number of dates percoring site the interpretation suffers from a large averagingeffect and a low spatial resolution. The older the sample, thelarger this averaging effect will be, causing a lower temporalresolution and a decreased sensitivity (Hoffmann et al., 2009).Therefore only long-term changes in sedimentation rates canbe identified. On the other hand, this method allows thereconstruction of site-specific sedimentation histories. Localdeviations from the general pattern can give more insight intothe spatial variability of the catchment sediment dynamics.Scenarios of deposition rates can be developed and comparedwith the distribution of the ages to come to general conclusionsabout sedimentation history.
Compared to the sedimentation rate analysis of the Rhinecatchment (Hoffmann et al., 2009), the methodology was
Figure 11. Time-differentiated sediment budget for the Dijle catchment, using scenario 1 for the time differentiation of the soil erosion masses.
Figure 12. Evolution of SDR and HSDR in the Dijle catchment, usingthe two scenarios to construct the time-differentiated sediment budget.
Copyright � 2011 John Wiley & Sons, Ltd. J. Quaternary Sci., Vol. 26(1) 44–58 (2011)
54 JOURNAL OF QUATERNARY SCIENCE

improved in three ways. This improved analysis was facilitatedby the availability of a detailed coring description which wasmissing in the synthetic analysis of Hoffmann et al. (2009). Byusing relative mass accumulation rates instead of volumetricsedimentation rates, the calculated values take into account thelarge variations in organic material of floodplain sediments.Peat layers can be responsible for an important verticalaggradation of the floodplain, especially during the earlyHolocene, which does not correspond to important sedimentaccumulation due to the low mineral content of these layers.Additionally, the use of relative rates excludes the effect of localdifferences in total Holocene accumulation. Finally, the use ofrelative rates and the methodology used for the models resultsin equal total Holocene sediment accumulation amounts for allmodels (100%), whereas Hoffmann et al. (2009) use modelswhich yield different total Holocene accumulation amounts (intotal thickness of the Holocene deposit). As a result, our modelsallow a more straightforward comparison with the calculatedrates.The construction of CPDs based on radiocarbon ages
provides a detailed image of phases during which the differentprocesses were active. CPDs were constructed for severalgroups of radiocarbon data, representing stability or aggrada-tion of the floodplain (see also Hoffmann et al., 2009; Macklinet al., 2010). Interpretation of these CPDs suffers largely fromthe limited amount of available radiocarbon dates: peaks canbe caused by a single radiocarbon date, which makes thismethod extremely sensitive for outliers. Spatial heterogeneity ofprocesses can also play a role: while stability dominates in onepart of the catchment, aggradation can dominate elsewhere.The CPD method can provide insight into short time variations(Hoffmann et al., 2009) and is thus more suited to studying theeffects of short time variations of the driving forces. Additionallythere are two major methodological drawbacks (Hoffmannet al., 2009). First, the probability frequencies cannot betransferred into volumes or fluxes. Where the CPD ofaggradation ages shows comparable or even more dominantpeaks for the period around 1000 BC compared to those for theperiod after 1000 AD, the other applied methods suggest thatthe fluxes for the last period are more important. Second, lowprobabilities do not necessarily suggest low activities but rathera lack of dating evidence, which can be caused by a lowpreservation potential or by the sampling method. Indeed, theCPD of the peat ages shows no peaks between 8000 and 6000BC, which is caused by the sampling strategy: often only the topand the base of the basal peat layer are sampled and nothing inbetween, and as a result few dates are available for the middleof the period with peat formation. An increased number ofavailable ages would improve the application of this method inthe Dijle catchment. It remains unclear, however, how manydates are needed to construct CPDs (Hoffmann et al., 2008).
Comparison of CPDs of the Dijle catchment with those fromother European catchments is biased by the differences inmethodology used, the related different objectives and thelimited number of ages available in this study. For Poland thedatabase was divided into different groups, excluding a grouprepresenting the overbank deposition (Starkel et al., 2006).Conclusions are mainly based on ages of channel facies andabundance of palaeochannels. Dates coinciding with overbankaggradation above peat layers peak mainly in the expansionperiod of agriculture during the late Roman period and the 11–15th centuries AD (Starkel et al., 2006). For Great Britain,phases of major flooding are identified based on a database ofradiocarbon ages (Macklin and Lewin, 2003). Lewin et al.(2005) classify the dates into groups, including a grouprepresenting dated floodplain surfaces (overbank) ages. Theresults show that floodplain sedimentation peaks mainly duringthe later Holocene and alluviation rates were not started butenhanced by anthropogenic effects. The greater availability offine-grained material by weathering, with the progressingHolocene, can also play a role. Further, also the importance ofpreservation potential is stressed. For Great Britain, Macklin etal. (2010) have recently reviewed the CPDs for differentdepositional environments. Comparable to the results of thisstudy, an acceleration in overbank floodplain sedimentation isreported after 1 cal ka BP, for the first time recognising anunequivocal anthropogenic signal affecting the British rivers. Inthis study we used an approach comparable with the approachused in Germany (Hoffmann et al., 2008) and for the Rhinecatchment (Hoffmann et al., 2009). Due to the size of thedatabase we used in our study, fewer groups could bedifferentiated. For the Rhine catchment (Hoffmann et al.,2009), stable floodplain environments occurred during theearly and Middle Holocene (9000–5000 BC), followed byincreased floodplain deposition in the Late Holocene (since1500 BC). Within the last period, peaks of higher probabilitiesfor floodplain deposition are reported at 1000 BC, 300 BC and1100 AD, while lower probabilities occur at 700 BC, 200 ADand 1400 AD. Colluvial ages do not show a general trend in thiscatchment, but most important peaks of increased probabilitiesare observed around 7000 BC, 5500 BC, 2500 BC and since1200 AD. The database for the whole of Germany (Hoffmann etal., 2008) overlaps largely with the database from the Rhinecatchment (Hoffmann et al., 2009), resulting in the samepatterns.In this study a large number of dated cross-sections and dates
were used to provide a catchment-wide overview of thesedimentation history. By using a large number of cross-sections and corings, the influence of local variations isminimised. When considering site-specific sedimentation rates(Fig. 6) the variation is relatively high. Comparison of therelative accumulatedmass of the Bonlez U and Bonlez D cross-
Table 6. Overview of the different methods used for the analysis of radiocarbon ages and the derived sedimentation history of the Dijle catchment:output parameter, temporal resolution, derived start of the increase in colluvial sedimentation and derived start of the increase in alluvialsedimentation. Temporal resolutions are partially based on Hoffmann et al. (2009).
Sedimentation history per site Mass accumulation rate Frequency distribution
Output parameter (Relative) sedimentation rate (Relative) sedimentation rates Probability densities ofradiocarbon ages
Temporal resolution Variable, 100–5000 a Variable, decreasing with age 50–200 a
Start of increasing colluvial sedimentation First increase 4160–600 BC 1000 BC 4300 BCMain deposition last 1000 a
Start of increasing alluvial sedimentation First increase 4000–500 BC 1 AD 1500 BCSecond increase �1000 AD
Copyright � 2011 John Wiley & Sons, Ltd. J. Quaternary Sci., Vol. 26(1) 44–58 (2011)
FLUVIAL HOLOCENE SEDIMENT DYNAMICS IN A BELGIAN LOESS CATCHMENT 55

sections indicates that there are important differences betweenboth cross-sections, although cross-section Bonlez U is locatedonly 2.0 km upstream of Bonlez D. As no major tributariesjoin the Train valley between the study sites, the upstreamcatchment of both sites is only slightly different. Theseobservations stress the importance of using dating results fromdifferent sites to obtain insight into the catchment sedimentdynamics. Local sedimentation histories will be influenced byenvironmental variations in the upstream catchment of thestudied site, and even with an almost identical upstreamcatchment individual coring sites can show a different sedi-mentation history. As a result, simple extrapolation of localsedimentation histories to a larger catchment is not justified.The different methods used to evaluate the radiocarbon dates
of the Dijle catchment yield comparable sedimentationhistories. Evidence for early Holocene colluvial deposition islacking and first colluvial deposition is reported from ca.4000 BC on, coinciding with the Neolithic Period. Colluviationappears to become more important between 2000 BC and500 BC, and a second increase occurs between 0 AD and1300 AD. The age/depth and frequency distribution analysis ofradiocarbon dates suggest that the increase in alluvialdeposition occurs later than the increase in colluvialdeposition. For most sites the increase in floodplain depositionstarts somewhere between 4000 and 500 BC, while the majorpart of floodplain sedimentation occurred since ca. 1000 AD.This general pattern of colluvial and alluvial depositioncoincides with the general pattern of an increasing intensityin agricultural activities from the Neolithic Period on. Littleevidence exists for the influence of climatic variations. Whenstudying the sedimentation rates at the Bilande site in detail, themain sedimentation phase occurred somewhere between 1150and 1450 AD. In other catchments sedimentation phases duringthe high Middle Ages are linked to a wetter climate during the14th century and especially due to major rainfall events in1342 AD (e.g. Bork et al., 1998), while the same periodcoincides with a peak in agricultural activities (e.g. Bork et al.,1998). It is unclear from the available data whether the peak insediment deposition is caused by increased agriculturalpressure, a wetter climatic phase or a combination of both.An apparent lag time is reported between the increase in
colluvial and alluvial deposition, which can be created by a lagtime between catchment disturbance and its influence onthe floodplain deposition, or by a threshold which has to bemet before a disturbance influences floodplain deposition.Given observations in other catchments (e.g. sedimentcascade model; Lang and Honscheidt, 1999) and the earlierincrease in colluvial deposition compared to alluvial depo-sition, we hypothesise that it is rather a threshold that has to bemet than a lag time between erosion and sedimentation.An apparent lag time or threshold between changes in
catchment environment and changes in deposition rates isevident for other catchments (e.g. Kalicki et al., 2008; Lespezet al., 2008; Trimble, 2009). Comparable to the Dijle catchment,the sediment budget of Coon Creek, Wisconsin, also showsa downstream shift of the sediment dynamics followingcatchment disturbances (Trimble, 1983, 1999, 2009). Increaseof sediment erosion caused a downstream shifting wave ofsediment deposition, while decrease of sediment erosion causeda downstream shifting evolution of cessation of floodplainaccumulation or even floodplain erosion.An important limitation on the temporal differentiated sediment
budget is, however, that it does not take into account the repeatedreworking and redeposition of sediments. Several periods ofdeposition and erosion of colluvial deposits have possiblyoccurred, as demonstrated, for example, by Lang and Honscheidt(1999) and supported by the presence of reworked charcoals in
the colluvial deposits at Bilande. There is no field evidence toquantify the importance of the reworking of sediments. Reworkingcan have an important influence on the sediment budget: due to alower preservation potential (e.g. Lewin and Macklin, 2003) theolder colluvial deposits are possibly underestimated compared tomore recent deposits. Therefore the total erosion and depositionamounts will be underestimated, also resulting in errors in thesediment delivery ratio (SDR) and HSDR. The absence of largeamounts of colluvial material in the historical forests of thecatchment (see above) suggests, however, that reworking ofcolluvial deposits since the early Middle Ages of older materialwill be limited. Additional budgeting of old colluvial deposits inthese historical forest could supply more information on theimportance of reworking in sediment budgeting. A mainadvantage of the time-differentiated sediment budget is that itprovides an integrated sediment dynamics history of thecatchment. The site-specific sedimentation histories demonstratethat there is a large variation in sedimentation history betweensites. Therefore a lumped approach is preferable, integrating thesedimentation history over space and time. The resulting averagedtrend can be displayed with a larger confidence. A mainadvantage of using a time-differentiated sediment budget oversite-specific sedimentation curves (Figs. 5–7) or analysis of theradiocarbon dates database (Figs. 8–10) is that it allows thequantification of the changing importance of different sinks andlinks in the sediment budget. Although MR calculations and site-specific sedimentation histories allow a quantification ofprocesses, the analysis remains qualitative and a quantificationof fluxes is not possible. By using a spatial and temporal integratedapproach, the results are filtered for variability in the differentprocesses, providing a catchment-wide pattern and enabling amore robust correlation with the environmental changes, forwhich information is often also available on a catchment scale. Byquantifying the different processes and links, variations inconnectivity between the different components of the sedimentdynamics can be quantified.
The different methodologies applied in this work indicate animportant influence of anthropogenic land use changes onfloodplain sedimentation in the Dijle catchment. However, thedating resolution does not allow identifying the influence ofshort-term climatic variations, lasting some decades or even afew centuries, on the catchment processes. A more detailedtemporal framework is needed to identify such phases. Anextension of the radiocarbon database could possibly addressthis problem, as the identification of shorter phases becomesmore reliable, depending on fewer data points (e.g. Macklinet al., 2010). Different studies have indicated the importance ofclimatic events on catchment and fluvial processes (e.g.Macklin and Lewin, 2003; Starkel et al., 2006). Land usechanges may have made the landscape more sensitive toclimatic events (see, for example, Knox, 2001), and wehypothesise that probably the interplay between landuse changes and climatic events has determined the Holocenesediment dynamics of the Dijle catchment.
Conclusions
In this study, AMS radiocarbon and OSL dating were appliedto the dating of alluvial and colluvial sediments in the medium-sized Dijle catchment. A database of 81 radiocarbon datavalues was developed and from this sedimentation rates andcumulative frequency distributions were analysed.
The results for the Dijle catchment show that there is a largevariation in sedimentation history between the different studysites and that data from a single coring cannot simply beextrapolated to an entire catchment. Dating different sites withinthe same catchment can provide deeper insight into catchment-
Copyright � 2011 John Wiley & Sons, Ltd. J. Quaternary Sci., Vol. 26(1) 44–58 (2011)
56 JOURNAL OF QUATERNARY SCIENCE

wide processes. In addition, the construction of sedimentationrates and relative mass accumulation rates allows a catchment-wide insight into the sedimentation history. Comparably, the useof cumulative probability functions of radiocarbon ages providesan important methodological tool for the analysis of catchment-wide floodplain or colluvial aggradation and stability phases.Results show that net floodplain aggradation in the studied
catchment is much higher in recent periods then before. Thedetailed sedimentation history shows the influence of anthro-pogenic land use on both colluvial and alluvial aggradation sinceNeolithic times. Changes in sediment dynamics for Neolithictimes and possibly also for subsequent periods was limited, andmore important changes occurred only later, with the mostimportant sedimentation phase during the last 1 ka. An influenceof climatic variation on the studied sedimentary archives couldnot be identified, which can be attributed to the absence of suchan influence or to the dating resolution, which does not allow thedetection of short duration variations. Possibly land use changeshave made the catchment more sensitive to climatic events (e.g.Knox, 2001), and the interplay between both land use changesand climatic events may have determined the catchmentsediment dynamics during the Holocene. A further refinementof the dating resolution or a modelling study is necessary tovalidate this hypothesis. The results also indicate the largevariability between the different studied cores, even when theyare located in the same fluvial system at a short distance. Thisstresses the importance of studying several profiles in order toincorporate local variations and in order to develop a catchment-wide sedimentation pattern.The time-differentiated sediment budget of theDijle catchment
indicates that there are important variations in the relativeimportance of colluvial and alluvial deposition as sediment sinks.We hypothesised that the resulting lag time between colluvialand alluvial sedimentation can be attributed to a threshold thathas to be met in soil erosion and/or sediment transport in order toresult in certain amounts of floodplain deposition. This time lagindicates the importance of internal system dynamics. Studiesconcerning entire catchment and sediment pathways, likesediment budget studies, can help in understanding the temporaland spatial dynamics of the sediments within those catchments(e.g. Verstraeten et al., 2009a). Modelling studies can alsoprovide an important contribution to the understanding of pastsediment dynamics, as such models would allow control of thevariations of each driving force (e.g. Ward et al., 2009).
Acknowledgements. This research is part of a project funded by theResearch Foundation Flanders (FWO, research project G.0583.06), andby the Interuniversity Attraction Poles Programme—Belgian State–Belgian Science Policy, project P6/22. Their support is gratefullyacknowledged. The authors would also like to thank Bjorn Dieu, JeroenMonsieur, and the several MSc and PhD students in physical geographyfor their assistance during fieldwork. We would also like to thank M.Macklin and T. Hoffmann for reviewing this paper and providing usefulcomments.
Abbreviations. AMS, accelarator mass spectrometry; a.s.l., above sealevel; BLSL, blue light stimulated luminescence; CPD, cumulativeprobability distribution; HSDR, hillslope sediment delivery ratio; IRSL,infrared stimulated luminescence; ME, model efficiency; MR, relativemass accumulation rate; OSL, optically stimulated luminescence; SDR,sediment delivery ratio; SR, sedimentation rate.
ReferencesAdamiec G, Aitken MJ. 1998. Dose-rate conversion factors: update.
Ancient TL 16: 37–50.Aitkin MJ. 1985. Thermoluminescence Dating. Academic Press, London.
Beach T. 1994. The fate of eroded soil: sediment sinks and sedimentbudgets of agrarian landscapes in southern Minnesota, 1851- 1988.Annals of the Association of American Geographers 84: 5–28.
Bisutti I, Hilke I, Raessler M. 2004. Determination of total organiccarbon: an overview of current methods. Trends in Analytical Chem-istry 23: 716–726.
Bork H-R, Bork H, Dalchow C, et al. 1998. Landschaftsentwicklung inMitteleuropa: Wirkungen des Menschen auf Landschaften. Klett-Perthes: Gotha, Germany.
Bøtter-Jensen L, Andersen CE, Duller GAT, Murray AS. 2003. Devel-opments in radiation, stimulation and observation facilities in lumi-nescence measurements. Radiation Measurements 37: 535–541.
Bronk Ramsey C. 2001. Development of the radiocarbon calibrationprogram OxCal. Radiocarbon 43: 355–363.
Bronk Ramsey C. 2009. Bayesian analysis of radiocarbon dates. Radio-carbon 51: 337–360.
Chiverrell RC, Foster GC, Thomas GSP, et al. 2009. Robust chronol-ogies for landform development. Earth Surface Processes and Land-forms 34: 319–328.
de Moor J, Verstraeten G. 2008. Alluvial and colluvial sediment storagein the Geul River catchment (The Netherlands): combining field andmodelling data to construct a Late Holocene sediment budget.Geomorphology 95: 487–503.
De Smedt P. 1973. Paleogeografie en kwartair-geologie van het con-fluentiegebied Dijle-Demer. Acta Geographica Lovaniensia 11: 141pp.
Dotterweich M. 2008. The history of soil erosion and fluvial deposits insmall catchments of central Europe: deciphering the long-term inter-action between humans and the environment – a review. Geomor-phology 101: 192–208.
Duller GAT. 2003. Distinguishing quartz and feldspar in single grainluminescence measurements. Radiation Measurements 37: 161–165.
Foulds S, Macklin M. 2006. Holocene land-use change and its impacton river basin dynamics in Great Britain and Ireland. Progress inPhysical Geography 30: 589–604.
Fryirs K, Brierley GJ. 2001. Variability in sediment delivery and storagealong river courses in Bega catchment, NSW, Australia: implicationsfor geomorphic river recovery. Geomorphology 38: 237–265.
Fuchs M, Lang A. 2001. OSL dating of coarse-grain fluvial quartz usingsingle-aliquot protocols on sediments fromNE Peloponnese, Greece.Quaternary Science Reviews 20: 783–787.
Hoffmann T, Erkens G, Cohen KM, et al. 2007. Holocene floodplainsediment storage and hillslope erosion within the Rhine catchment.Holocene 17: 105–118.
Hoffmann T, Lang A, Dikau R. 2008. Holocene river activity: analysing14C-dated fluvial and colluvial sediments fromGermany.QuaternaryScience Reviews 27: 2031–2040.
Hoffmann T, Erkens G, Gerlach R, et al. 2009. Trends and controls ofHolocene floodplain sedimentation in the Rhine catchment. Catena77: 96–106.
Houben P. 2006. A Holocene sediment budget for the Rockenbergcatchment. Pre-workshop field guide. In Open Lucifs Workshop,2006.
Houben P. 2008. Scale linkage and contingency effects of field-scaleand hillslope-scale controls of long-term soil erosion: anthropogeo-morphic sediment flux in agricultural loess watersheds of SouthernGermany. Geomorphology 101: 172–191.
Kalicki T, Sauchyk S, Calderoni G, et al. 2008. Climatic versus humanimpact on the Holocene sedimentation in river valleys of differentorder: examples from the upper Dnieper basin, Belarus. QuaternaryInternational 189: 91–105.
Knox JC. 2001. Agricultural influence on landscape sensitivity in theUpper Mississippi River Valley. Catena 42: 193–224.
Knox JC. 2006. Floodplain sedimentation in the Upper MississippiValley: natural versus human accelerated. Geomorphology 79:286–310.
Lang A. 2008. Recent advances in dating and source tracing of fluvialdeposits. In Sediment Dynamics in Changing Environments, SchmidtJ, Cochrane T, Phillips C, et al. Publication 325. IAHS: Wallingford,Oxon, UK; 3–12.
Lang A, Honscheidt S. 1999. Age and source of colluvial sediments atVaihingen-Enz, Germany. Catena 38: 89–107.
Copyright � 2011 John Wiley & Sons, Ltd. J. Quaternary Sci., Vol. 26(1) 44–58 (2011)
FLUVIAL HOLOCENE SEDIMENT DYNAMICS IN A BELGIAN LOESS CATCHMENT 57

Langohr R, Sanders J. 1985. The Belgian Loess Belt in the last 20 000years: evolution of soils and relief in the Zonien Forest. In Soils andQuaternary Landscape Evolution, Boardman J editor. Wiley: Chi-chester; 359–371.
Lespez L, Clet-Pellerin M, Limondin-Lozouet N, et al. 2008. Fluvialsystem evolution and environmental changes during the Holocene inthe Mue valley (Western France). Geomorphology 98: 55–70.
Lewin J, Macklin M. 2003. Preservation potential for Late Quaternaryriver alluvium. Journal of Quaternary Science 18: 107–120.
Lewin J, Macklin M, Johnstone E. 2005. Interpreting alluvial archives:sedimentological factors in the British Holocene fluvial record.Quaternary Science Reviews 24: 1873–1889.
Macklin MG, Lewin J. 2003. River sediments, great floods and cen-tennial-scale Holocene climate change. Journal of QuaternaryScience 18: 101–105.
Macklin M, Benito G, Gregory K, et al. 2006. Past hydrological eventsreflected in the Holocene fluvial record of Europe. Catena 66: 145–154.
Macklin M, Jones A, Lewin J. 2010. River response to rapid Holoceneenvironmental change: evidence and explanation in British catch-ments. Quaternary Science Reviews 29: 1555–1576.
Messerli B, GrosjeanM, Hofer T, et al. 2000. From nature-dominated tohuman-dominated environmental changes. Quaternary ScienceReviews 19: 459–479.
Meybeck M. 2003. Global analysis of river systems: from Earth systemcontrols to Anthropogene syndromes. Philosophical Transactions ofthe Royal Society of London, Series V 358: 1935–1955.
MullendersW, Gullentops F, Lorent J, et al. 1966. Le Remblement de lavallee de la Nethen. Acta Geographica Lovaniensia 4: 169–181.
Murray AS, Wintle AG. 2000. Luminescence dating of quartz using animproved single-aliquot regenerative-dose protocol. RadiationMeasurements 32: 57–73.
Murray AS, Wintle AG. 2003. The single aliquot regenerative doseprotocol: potential for improvements in reliability. RadiationMeasurements 37: 377–381.
Nash JE, Sutcliffe JV. 1970. River flow forecasting through conceptualmodels, a discussion of principles. Journal of Hydrology 10: 282–290.
Notebaert B. 2009. Sensitivity of river systems to human actions andclimatic events across different environments: a Holocene perspect-ive. PhD thesis. Department Earth and Environmental Sciences, KULeuven, Belgium.
Notebaert B, Verstraeten G, Rommens T, et al. 2009. Establishing aHolocene sediment budget for the river Dijle. Catena 77: 150–163.
Page MJ, Trustrum NA, Dymond JR. 1994. Sediment budget to assessthe geomorphic effect of a cyclonic storm, New Zealand. Geomor-phology 9: 169–188.
Prescott JR, Hutton JT., 1994. Cosmic ray contributions to dose rates forluminescence and ESR dating: large depths and long-term timevariations. Radiation Measurements 23: 497–500.
Reid L, Dunne T. 2003. Sediment budgets as an organizing frameworkin fluvial geomorphology. In Tools in Fluvial Geomorphology,Kondolf M, Piegay H editors. Wiley: New York; 463–500.
Reimer PJ, Baillie MGL, Bard E, et al. 2004. IntCal04 Terrestrial radio-carbon age calibration,0-26 ka BP. Radiocarbon 46: 1029–1058.
Rommens T. 2006. Holocene sediment dynamics in a small rivercatchment in central Belgium. PhD thesis. Department Geogra-phy–Geology, KU Leuven, Belgium.
Rommens T, Verstraeten G, Bogman P, et al. 2006. Holocene alluvialsediment storage in a small river catchment in the loess area ofcentral Belgium. Geomorphology 77: 187–201.
Rommens T, Verstraeten G, Peeters I, et al. 2007. Reconstruction oflate-Holocene slope and dry valley sediment dynamics in a Belgianloess environment. Holocene 17: 777–788.
Sadler PM. 1981. Sediment accumulation rates and the completeness ofstratigraphic sections. Journal of Geology 89: 569–584.
Schumer R, Jerolmack DJ. 2009. Real and apparent changes in sedi-ment deposition rates through time. Journal of Geophysical research– Earth Surface 114: 12 pp. [F00A06].
SlaymakerO. 2003. The sediment budget as conceptual framework andmanagement tool. Hydrobiologia 494: 71–82.
Starkel L, Soja R, Michczynska DJ. 2006. Past hydrological eventsreflected in the Holocene history of Polish rivers. Catena 66: 24–33.
Thorndycraft V, Benito G. 2006a. Late Holocene fluvial chronology ofSpain: the role of climatic variability and human impact. Catena 66:34–41.
Thorndycraft V, Benito G. 2006b. The Holocene fluvial chronology ofSpain: evidence from a newly compiled radiocarbon database.Quaternary Science Reviews 25: 223–234.
Tornqvist T, Dejong A, Oosterbaan W, et al. 1992. Accurate dating oforganic deposits by AMS 14C measurement of macrofossils. Radio-carbon 34: 566–577.
Trimble SW. 1983. A sediment budget for Coon Creek basin in theDriftless Area, Wisconsin, 1853- 1977. American Journal of Science283: 454–474.
Trimble SW. 1999. Decreased rates of alluvial sediment storage in theCoon Creek Basin, Wisconsin, 1975-93. Science 285: 1244–1246.
Trimble SW. 2009. Fluvial processes, morphology and sediment bud-gets in the Coon Creek Basin,WI, USA, 1975- 1993.Geomorphology108: 8–23.
Vandenberghe D. 2004. Investigation of the optically stimulated lumi-nescence dating method for application to young geological sedi-ments. PhD thesis, Universiteit Gent, Belgium.
Vandenberghe D, De Corte F, Buylaert J-P, et al. 2008. On the internalradioactivity in quartz. Radiation Measurements 42: 771–775.
Verstraeten G, Poesen J. 2001. Factors controlling sediment yield fromsmall intensively cultivated catchments in a temperate humid cli-mate. Geomorphology 40: 123–144.
Verstraeten G, Rommens T, Peeters I, et al. 2009a. A temporarilychanging Holocene sediment budget for a loess-covered catchment(central Belgium). Geomorphology 108: 24–34.
Verstraeten G, Lang A, Houben P. 2009b. Human impact on sedimentdynamics: quantification and timing. Catena 77: 77–80.
Walling D, Quine T. 1993. Using Chernobyl-derived fallout radio-nuclides to investigate the role of downstream conveyance losses inthe suspended sediment budget of the river Severn, United Kingdom.Physical Geography 14: 239–253.
WallingDE, RusselM, HodgkinsonR, et al. 2002. Establishing sedimentbudgets for two small lowland agricultural catchments in the UK.Catena 47: 323–353.
Walling DE, Collins A, Jones P, et al. 2006. Establishing fine-grainedsediment budgets for the Pang and Lambourn LOCAR catchments,UK. Journal of Hydrology 33: 126–141.
Ward P, van Balen R, Verstraeten G, et al. 2009. The impact of land useand climate change on late Holocene and future suspended sedimentyield of the Meuse catchment. Geomorphology 103: 389–400.
Copyright � 2011 John Wiley & Sons, Ltd. J. Quaternary Sci., Vol. 26(1) 44–58 (2011)
58 JOURNAL OF QUATERNARY SCIENCE