changes in women's employment during the war states department of labor frances perkins,...
TRANSCRIPT

UNITED STATES DEPARTMENT OF LABORFRANCES PERKINS, Secretary
WOMEN'S BUREAUMARY ANDERSON, Director
Changes in Women's Employment
During the War
By
MARY ELIZABETH PIDGEON
SPECIAL BULLETIN NO. 20 OF THE WOMEN'S BUKEAU
JUNE 1944
UNITED STATES
GOVERNMENT PRINTING OFFICE
WASHINGTON : 1944
For tale by the Superintendent of Documents, V- $- Government Printing Office, Washington 25, D. CPrice 10 cent*
Digitized for FRASER http://fraser.stlouisfed.org/ Federal Reserve Bank of St. Louis

Digitized for FRASER http://fraser.stlouisfed.org/ Federal Reserve Bank of St. Louis

Letter of Transmittal
UNITED STATES DEPARTMENT OP LABOR,WOMEN'S BUREAU,
Washington, June 14, 1944.MADAM: I have the honor to present a report the findings of which
will be of importance in the development of sound postwar employ-ment policies. Its analysis answers a variety of insistent questions asto the war movements in women's entrance to and exit from the laborforce, according to their age and marital status and the changes intheir occupational groupings in this period.
Basic data for this report were specially collected by the Bureau ofthe Census, at the request of the Women's Bureau, in the course of theregular monthly labor-force census. They were tabulated by thatoffice under the direction of Dr. A. Ross Eckler, chief of the SpecialSurveys Division, assisted by Miss Gertrude Bancroft. Questions tobe asked and specifications as to these tables were prepared by JanetM. Hooks Bassie of the Women's Bureau Research Division, andanalysis of the findings was made by Marv Elizabeth Pidgeon, chiefof the Research Division, assisted by Elisabeth D. Benham.
Respectfully submitted.MARY ANDERSON, Director.
Hon. FRANCES PERKINS,Secretary of Labor.
n i
Digitized for FRASER http://fraser.stlouisfed.org/ Federal Reserve Bank of St. Louis

Digitized for FRASER http://fraser.stlouisfed.org/ Federal Reserve Bank of St. Louis
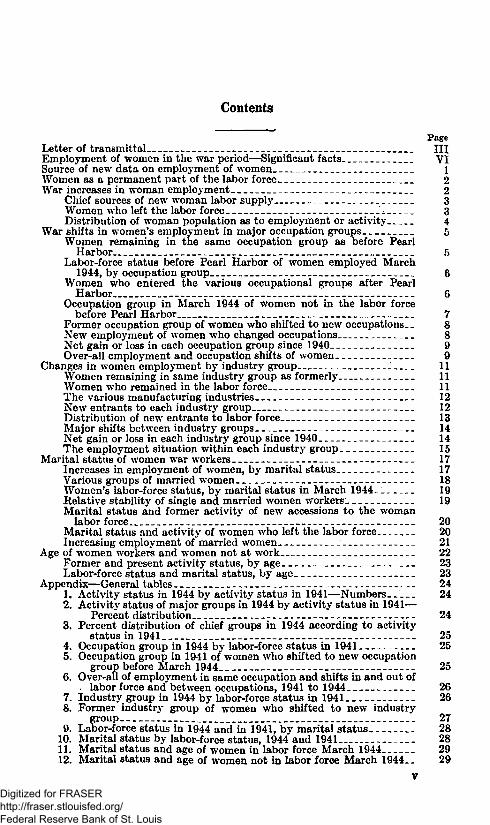
Contents
PageLetter of transmittal IIIEmployment of women in the war period—Significant facts VISource of new data on employment of women 1Women as a permanent part of the labor force 2War increases in woman employment 2
Chief sources of new woman labor supply 3Women who left the labor force '_ 3Distribution of woman population as to employment or activity 4
War shifts in women's employment in major occupation groups 5Women remaining in the same occupation group as before Pearl
Harbor 5Labor-force status before Pearl Harbor of women employed March
1944, by occupation group 6Women who entered the various occupational groups after Pearl
Harbor 6Occupation group in March 1944 of women not in the labor force
before Pearl Harbor 7Former occupation group of women who shifted to new occupations. _ 8New employment of women who changed occupations 8Net gain or loss in each occupation group since 1940 9Over-all employment and occupation shifts of women _ 9
Changes in women employment by industry group 11Women remaining in same industry group as formerly 11Women who remained in the labor force 11The various manufacturing industries 12New entrants to each industry group 12Distribution of new entrants to labor force 13Major shifts between industry groups 14Net gain or loss in each industry group since 1940 14The employment situation within each industry group 15
Marital status of women war workers 17Increases in employment of women, by marital status 17Various groups of married women 18Women's labor-force status, by marital status in March 1944~ 19Relative stability of single and married women workers 19Marital status and former activity of new accessions to the woman
labor force 1 20Marital status and activity of women who left the labor force 20Increasing employment of married women - 21
Age of women workers and women not at work 22Former and present activity status, by age. 23Labor-force status and marital status, by age 23
Appendix—General tables 241. Activity status in 1944 by activity status in 1941—Numbers.- 242. Activity status of major groups in 1944 by activity status in 1941—
Percent distribution 243. Percent distribution of chief groups in 1944 according to activity
status in 1941 254. Occupation group in 1944 by labor-force status in 1941 255. Occupation group in 1941 of women who shifted to new occupation
group before March 1944 256. Over-all of employment in same occupation and shifts in and out of
. labor force and between occupations, 1941 to 1944 __ 267. Industry group in 1944 by labor-force status in 1941 268. Former industry group of women who shifted to new industry
group 279. Labor-force status in 1944 and in 1941, by marital status 28
10. Marital status by labor-force status, 1944 and 1941 2811. Marital status and age of women in labor force March 1944 2912. Marital status and age of women not in labor force March 1944.- 29
vDigitized for FRASER http://fraser.stlouisfed.org/ Federal Reserve Bank of St. Louis

EMPLOYMENT OF WOMEN IN THE WAR PERIOD
SIGNIFICANT FACTS
Employed in December 1941, as reported March 1944—12,090,000.Employed March 1944—16,480,000. (Increase, 36 percent.)
61 percent were in labor force before Pearl Harbor.50 percent in same occupation group as formerly.
In labor force in both periods—10,230,000.69 percent were 20-44 years old.42 percent single; 30 percent married, husband present.
Women who left labor force—2,180,000.21 percent were 45 years old or more.62 percent were married, husband present.93 percent went to home housework.
New entrants to labor force—6,650,000.55 percent were 20-^4 years old.44 percent single; 36 percent married, husband present.56 percent were home houseworkers; 34 percent in school.
Women not entering labor force—33,260,000.43 percent were 45 or over, 14 percent under 20.65 percent were married, husband present.
Percent change194Q-U
Woman population, 14 and over -|-4Single women — 6Married women 4-8
Great employment shifts occurred between occupations.Manufacturing and clerical occupations gained most.
The manufacturing industries differed greatly.In war industries, 49 percent came from outside the labor force, 26percent from other industries. In essential supply industries only37 percent came from outside the labor force, 54 percent were in sameindustry as before the war.
Proportion employed
mo22.03a 313.9
19U31.553.622.5
NOTE.—As reported for December 1941 and March 1944 by women inter-viewed in March 1944. Does not take account of all changes occurring betweenthe two dates.
VI
Digitized for FRASER http://fraser.stlouisfed.org/ Federal Reserve Bank of St. Louis

Changes in Women's Employment Duringthe War
One of the most spectacular of the changes that have characterizedthe period since the Pearl Harbor attack is the tremendous shift in thework of women to meet this country's needs for industrial products.This has occurred in many cases through women's own volition, but inlarge measure it has been in response to urgent calls for their services.
After two years of great and rapid transition in women's employ-ment and occupations, the need has been felt increasingly for furtherdata on the over-all extent and character of the movement. Asidefrom their widespread interest, such data are of the utmost importancein shaping both immediate and future administrative policies.
In the first place, tho effectiveness of continuing plans to carryforward this country's program for production and services depends toa considerable extent on the response women are making to the greatefforts to call them to work outside their homes. Further, wise provi-sion for the necessary adjustments after the war requires a backgroundunderstanding of employment needs and possibilities, on which muchlight can be thrown by a fuller knowledge of the experiences duringthe war.
SOURCE OF NEW DATA ON EMPLOYMENT OF WOMEN
The Bureau of the Census publishes monthly estimates, for men andwomen separately, of total civilian emplo}rment. These are based oninterviews with households in* a national sample which has been inoperation since the spring of 1940. The present sample includes some30,000 households located in 123 counties selected in such a, manneras to provide national estimates of the major labor-force characteris-tics of the population.1
In connection with this reporting, special additional questions some-times are asked for a particular month. In the spring of 1944, theBureau of the Census responded to a request by the Women's Bureauof the U. S. Department of Labor for the inclusion of questions to afforddata on the shifts in the employment and occupations of womenbetween tho week immediately preceding the Pearl Harbor attack anda week in early March 1944. Throughout this discussion, comparisonsof earlier and later data refer to the week of December 1-6, 1941, andthe week of March 5-11, 1944, the interim thus being about 2# years.2
for December 1&41 are not available for certain particular comparisons. This will be explained where dis-cussed. (See footnote II, p. 9.) The use of 1940 for the present questions, instead of December 1941, wasconsidered, but it was felt that the later date would afford more accurate replies, since persons interviewedcan remember more vividly the Pearl Harbor date and the time just preceding than a time approximately4 years before the date of interview*
Digitized for FRASER http://fraser.stlouisfed.org/ Federal Reserve Bank of St. Louis

2 CHANGES IN WOMEN'S EMPLOYMENT DURING WAR
The questions added to the usual monthly schedules were as follows:(1) For all persons 14 years and over, enter activity
during week before Pearl Harbor, December 1-6,1941.
(2) If at* work or had a job during the week before PearlHarbor, enter occupation and industry of that job.
The data resulting from these questions are of even greater valuebecause correlations with age and marital status could be made inaddition to those on employment and occupation. Marital statuscould be included because a special question on that subject had beenasked in the preceding month. Age was obtainable because sucha question is a part of the regular schedule, this information being ofvital importance, for example, to the draft boards. Caution is neces-sary in regard to the use of material developed from a sample of thistype, especially since in. this case its content is of such wide nationalinterest. The data give a revealing picture of various relationships—for example, as to the types of shifts occurring in and out of the laborforce or between various industries or occupations, or as to the ageor marital status of women in and not in the labor force. However,since they are estimates from a sample they do not completely measurethe exact sizes of particular groups, especially of the smaller groups.3
WOMEN AS A PERMANENT PART OF THE LABOR FORCE
Many people have not realized the very large extent to whichwomen are a permanent part of the labor force. The dominance of thewar situation, with its urgent call to women to take employment andits large increases in the numbers of them who have gone to work, hastended to obscure the fact that women long have been a very substan-tial and increasing part of the country's labor force. In the 50 yearsprior to 1940, the proportion of workers who were women increasedfrom 17 percent in 1890 to 24 percent in 1940, as the following shows.
Percent women wereof all worker*
1890 . 17 21900 II.""!"" " "" 1&31910^. " _ 21.21920 I::::::;::::::::::::;; 20.51930 22.01940 " "" """24.31944 (March) I--"III""Ii;_\\\\\\\\\\\\";; 32. 9
WAR INCREASES IN WOMAN EMPLOYMENTIn spite of the fact that in 1940 women already constituted over
24 percent of the labor force, the number of women who have soughtto meet the new war needs is almost breath-taking in its magnitude,ine number of employed women reported increased by 36.4 percent ina period of a little more than 2 years-from the week preceding therearl Harbor attack to the week of March 5 to 11, 1944, when the newfigures were taken. These data are as follows:
Number of women- ^ employed
IJecember 1-6, 1941, * 12,090,000March 5-11. 1944 " 1 6 480,000
* See note 1 on p. 1.* These are women who in March 1944 said they also were employed in December 1941.
Digitized for FRASER http://fraser.stlouisfed.org/ Federal Reserve Bank of St. Louis

WAR INCREASES IN WOMAN EMPLOYMENT 3
Actually, the number of women going to work within this period hasbeen far greater than these over-all figures would indicate, for of thoseat work before Pearl Harbor many had left employment by March1944 and been replaced by new workers. For this reason, the entirenumber of new women entrants, not employed in early December 1941totaled 6,650,000.5
Chief Sources of New Woman Labor Supply.Where did this startling number of additional women workers come
from? More than half of the new entrants had come to work fromtheir homes, and about a third of them had been in school. Thefollowing summary indicates these and the minor sources of the newwomen workers:
NumberSource of new women trorkcrs ' (in thousands) Percent
Total 6,650 100.0
Home housework _ 3,710 55.8School 2,280 34,3Under 14.__ 240 3.5Other 80 1,2Labor-force status not ascertainable 340 5. 1
The response these new women workers have made to the needs of theircountry, their communities, and in many cases their own familiesindicates that when vital need arises women are available to meet it.When women are as ready as this, under voluntary systems, to taketheir part, compulsory methods appear entirely unnecessary, unlessthis country as a whole should face far more extreme situations thanseem likely to arise. Furthermore, the willingness of a great body ofwomen to come forward when the situation demands it places a cor-responding responsibility squarely on the shoulders of industry andpublic authorities to include in their planning full consideration of theextent to which women are a large and normally increasing part of thelabor force.
Women Who Left the Labor Force.Though more than 80 percent of the women who reported that they
had been employed before Pearl Harbor were still working in March1944, over 2 million women—18.6 percent of those who were at workin December of 1941—left the labor force between the two dates undercomparison. A consideration of where these women went may be ofconstructive interest to those who are planning for adjustments ofworkers after the war.
Of the women who left, more than 90 percent went to home house-work, some were unable to work, and a very much smaller numberwent to school. Their numbers and distribution were as follows:
Women who left labor forceMarch 19U stotm of women uhoUft labor force j/KSto) Percent
T o t a l 2,180 100.0
In home housework.. _ 2» ??2 9£ IOther - - 160< 7* 3
* This takes no awount of the multitude of shifts between occupations nor of-otherchanges in the Interimperiod. For discussion of the former, see section on War Shifts In W omen s Occupations, p. 10.
5045S00—14 2
Digitized for FRASER http://fraser.stlouisfed.org/ Federal Reserve Bank of St. Louis

4 CHANGES IN WOMEN'S EMPLOYMENT DURING WAR
Distribution of Woman Population as to Employment or Activity.Of the entire female population of 14 years and over in March 1944,
practically 20 percent were in the labor force both before Pearl Har-bor and in March 1944, and in addition about 13 percent enteredin the period between these two dates. A small proportion werewomen formerly in the labor force who had left it by March 1944.More than 60 percent of the women in the United States were not inthe labor force either before Pearl Harbor or in March 1944. Overthree-fourths of these—more than 25% million women—were homehouseworkers in both periods, small proportions were in school orunable to work at both times, and nearly 2}{ million were under 14before Pearl Harbor. This leaves almost 2 million women, besides aproportion of the home houseworkers, who still might be available iffurther additions to the country's labor forces are needed.
The women who have not gone to work undoubtedly are thosewhose economic situation neither requires nor tempts them to do so.There also are a number of localities where war industries have notdeveloped, and women who for family reasons are unable to migratehave no increased opportunity for employment. Since Governmentcontracts are now being curtailed, and in various parts of the countrywomen who do need their earnings are being laid off, there appears tobe little evidence that employment needs cannot be solved by a properuse of the existing labor force without calling on this reserve group ofwomen.
The basic figures for the foregoing discussion 6 of the present situa-tion are as follows:
Distribution of women populationActivity status Numbtr (in thousands) Percent
Woman population 14 and over, March 1944 52, 320 100. 0In labor force March 1944 16, 880
In labor force both before Pearl Harbor and in March1944 10,230 19.6
Entered labor force between December 1941 and March1944 _. 6,650 12.7
Not in labor force March 1944 ___ 35,440Not in labor force at either date l 33,260 63. 6
Both dates:Home housework 25, 550In school 1, 580Unable to work 1, 790
Under 14 before Pearl Harbor.. __ 2, 440Other1 1, 900
Left labor force between December 1941 and March 1944 2, 180 4. 2i Includes 570,000 with status not reported for December 1941.
• See footnote on p . 3.
Digitized for FRASER http://fraser.stlouisfed.org/ Federal Reserve Bank of St. Louis

WAR SHIFTS IN MAJOR OCCUPATION GROUPS 5
WAR SHIFTS IN WOMEN'S EMPLOYMENT IN MAJOROCCUPATION GROUPS
The great net increases in woman employment do not show the shiftsin and out of the labor force, nor the very considerable shifts betweenmajor groups of occupations. The March 1944 woman labor force ismade up as follows:
[In thousands]Women employed March 1944 16,480
In same occupation as formerly s] 370Not in same occupation as formerly " 8, 110
Changed occupation I , " . "_ tt 460Were unemployed formerly J 230Entered labor force 6, 420
* Includes those on emergency work.
Women Remaining in the Same Occupation Group as Before PearlHarbor.
Of 9,830,000 women who were employed both before Pearl Harborand in March 1944, 85 percent (8,370,000 women)7 had remained inthe same occupation groups in which they formerly worked. In everyoccupation group, more than three-fourths of the March 1944 womenemployees who were in the labor force before Pearl Harbor had re-mained in the same group as before. The summary next presentedshows how the occupation groups differed in extent of retaining theirwomen workers.
Perhaps it is of even greater significance that half of the total numberof the women in the entire March 1944 woman labor force were in thesame occupation group as before Pearl Harbor. This was true of morethan 70 percent of the professional and semiprofessional and proprie-tary workers, more than GO percent of those in domestic service andfarm occupations. However, only a little over 40 percent of the sales,manufacturing,8 and service workers other than domestic were in thesame occupation as formerly, as were only about 50 percent of theclerical employees.
Occupation proup
AH occupations ^ -
Professional and semiprofrssional —I roprictors, managers, and officialsClerical and kindred .. .-SalesCraftsmen, foremen, operatives, and laborers except
farm... . _ „ .Domestic service ".-Other servicesFarmworkers^ot classifisihln_ ' Less than 1.000.
All vromenemployed
March1944 (in
thousands)
16,480
M90650
4,3S01,240
4,9201,5701,650
66020
Women who In March 1944 said theywere in same occupation group asbefore Pearl Harbor
Number (inthousands)
8,370
1,080460
2,210510
2,0601,000
700340
0)
Percent of—
All women em-ployed beforePearl Harborand in this
occupation inMarch 1944
85.2
96.086.686.5m.578.290.976.493.8
Allwomenin the
group inMarch
1944
50.8
72.871.150.54L2
41.963.942.560.8
j ™ J W W 5 5 K « D . '<>« «P«tl«. and laborers e«ep«farm. »£**«$$£discussion as *'manufacturing," though a small proportion of these workers are in other t>pes oi industry.
Digitized for FRASER http://fraser.stlouisfed.org/ Federal Reserve Bank of St. Louis

6 CHANGES IN WOMEN'S EMPLOYMENT DURING WAR
Labor-Force Status Before Pearl Harbor of Women EmployedMarch 1944, by Occupation Group.
The occupations of women in March 1944 differed considerably inthe proportion of their women workers who had been in the labor force(though not necessarily in the same occupation group) in the weekbefore Pearl Harbor. For example, as the following summary shows,more than 70 percent of the women who in March 1944 were in theproprietary, professional, and domestic-service groups were in thelabor force before Pearl Harbor. On the other hand, more than 50percent of the women who were in sales, as well as more than 40 percentof those in the groups that had increased most largely, manufacturingand clerical work, were not in the labor force in December 1941, butentered employment directly from activities outside the labor forcethat engaged them before Pearl Harbor.
Percent' of women employedin March 19U trho before Pearl
Harbor were—In lafjor Not in labor
Occupation group force force
All occupations 61.0 39.0
Proprietors, managers, and officials _ 82. 4 17. 6Professional and semiprofessional 76. 3 23. 7Domestic service .__ _._ 71. 0 29. 0Farmworkers 65.0 35.0Clerical and kindred 59. 5 40. 5Services other than domestic 57. 5 42. 5Craftsmen, foremen, operatives, and laborers except farm__ 55. 9 44. 1Sales 48.0 52.0
i For numbers, see table 4 in the appendix.
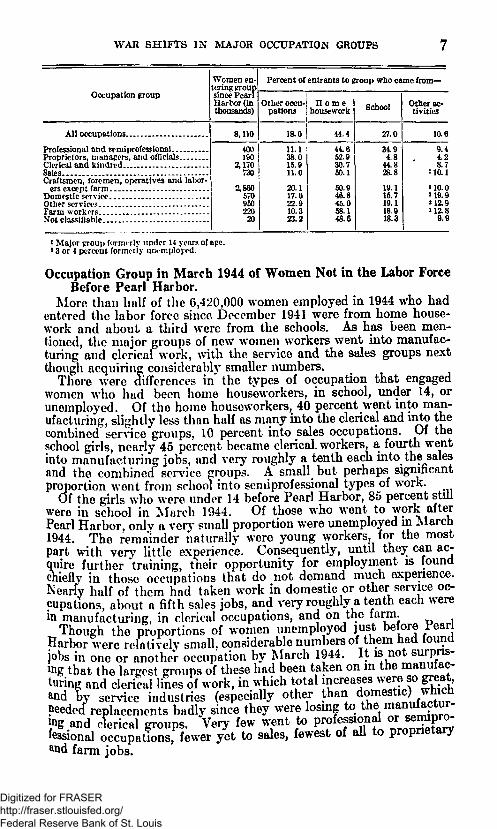
Women Who Entered the Various Occupational Groups After PearlHarbor.
Though one occupation group had sustained a net loss,9 in March1944 every group had some women who were not so employed inDecember 1941. Of the total 8,110,000 women who came either fromother occupations or from entirely outside the labor force, the largestproportion came from home housework, with the exception of clericalworkers, to whom the schools furnished the largest group. Thegroups second in size that entered semiprofessional, sales, and farmoccupations were from the schools, and to proprietary or managerialwork more women transferred from other occupations than enteredfrom any source except home housework. Manufacturing and serv-ice industries each acquired similar proportions of women workersfrom schools and from other occupations in the labor force. The fol-lowing summary shows these data:
• 1944 compared to 1940. See p. 9, summary and footnote 11.
Digitized for FRASER http://fraser.stlouisfed.org/ Federal Reserve Bank of St. Louis
WAR SHIFTS IN MAJOR OCCUPATION GROUPS
Occupation group
All occupations
Professional and foniiprofessionalProprietors, managers, and officialsClerical and kindredSales . *..Craftsmen, foremen, operatives and labor-
ers except ffirmDomestic service . . . » - ._Other scrvict"> *«. -- --Farm workers *-. » .-Not classifiable
Women en-tering proupsince PearlHarbor (inthousands)
8,110
4001&0
2,170730
2,SG0570950220
20
Percent of entrants to group who came from—
Other occu-pations
18.0
11.138.015.911.0
20.117.622.910.323.2
Homehousework
44.4
44-652.930.750.1
50.946.845.058.148.6
School
27.0
3194.8
44.828.8
19.115.719.118.918.3
Other ac-tivities
10.6
9.44.28.7
U0.1
* 10.0U9.9U2.9U2.8
9.9
i Major group formerly under 14 years of ape.1 3 or 4 percent formerly unemployed.
Occupation Group in March 1944 of Women Not in the Labor ForceBefore Pearl Harbor.
More than half of the 6,420,000 women employed in 1944 who hadentered the labor force since December 1941 were from home house-work and about a third were from the schools. As has been men-tioned, the major groups of new women workers went into manufac-turing and clerical work, with the service and the sales groups nextthough acquiring considerably smaller numbers.
There were differences in the types of occupation that engagedwomen who had been home houseworkers, in school, under 14, orunemployed. Of the homo houseworkers, 40 percent went into man-ufacturing, slightly less than half as many into the clerical and into thecombined service groups, 10 percent into sales occupations. Of theschool girls, nearly 45 percent became clerical, workers, a fourth wentinto manufacturing jobs, and very roughly a tenth each into the salesand the combined^ service groups. A small but perhaps significantproportion wont from school into semiprofessional types of work.
Of the girls who were under 14 before Pearl Harbor, 85 percent stillwere in school in March 1944. Of those who went to work afterPearl Harbor, only a very small proportion were unemployed in March1944. The remainder naturally were young workers, for the mostpart with very little experience. Consequently, until they can ac-quire further "training, their opportunity for employment is foundchiefly in those occupations that do not demand much experience.Nearly half of them had taken work in domestic or other service oc-cupations, about a fifth sales jobs, and very roughly a tenth each werein manufacturing, in clerical occupations, and on the farm.
Though the proportions of women unemployed just before PearlHarbor were relatively small, considerable numbers of them had foundjobs in one or another occupation by March 1944. It is not surpris-ing that the largest groups of these had been taken on m the manufac-turing and clerical lines of work, in which total increases were «> great,and by service industries (especially other than domestic) winchneeded replacements badly since they were losing to t h e
tm a n ^ f ^
*B and clerical groups. Very few went to P™*™** °* 3 ™ "fessional occupations, fewer yet to sales, fewest of all to proprietaryand farm jobs.
Digitized for FRASER http://fraser.stlouisfed.org/ Federal Reserve Bank of St. Louis
8 CHANGES IN WOMEN'S EMPLOYMENT DURING WAR
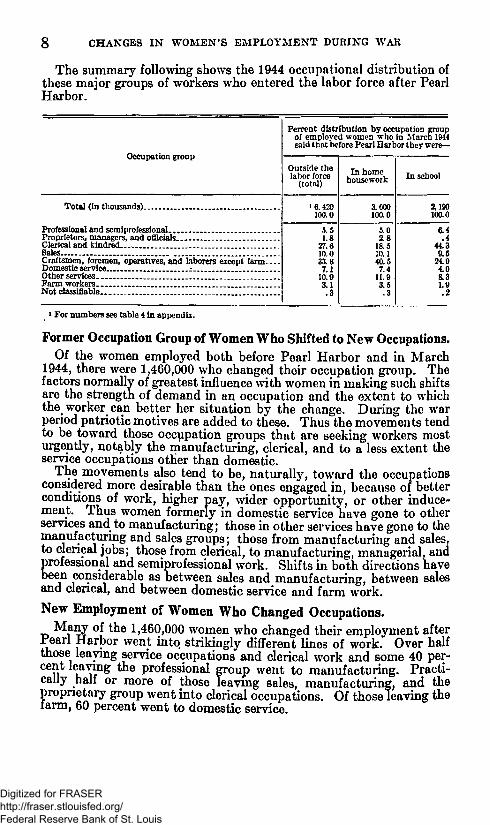
The summary following shows the 1944 occupational distribution ofthese major groups of workers who entered the labor force after PearlHarbor.
Occupation group
Total (in thousands)
Professional and semiprofessionalProprietors, managers, and officials -Clerical and kindred...^SalesCraftsmen, foremen, operatives, and laborers except farmDomestic serviceOther services __FarmworkersNot classifiable _
Percent distribution by occupation groupof employed women who in March 1944said that before Pearl Harbor they were—
Outside thelabor force
(total)
'6,420100.0
5.51.8
27.610 033.37 1
10.93,1. 3
In homehousework
3,600100.0
5.02 8
18 510 140.57 4
11.93.5. 3
In school
2,190100.0
6.4.4
44.39.5
2494 08.31.9.2
i For numbers see table 4 in appendix.
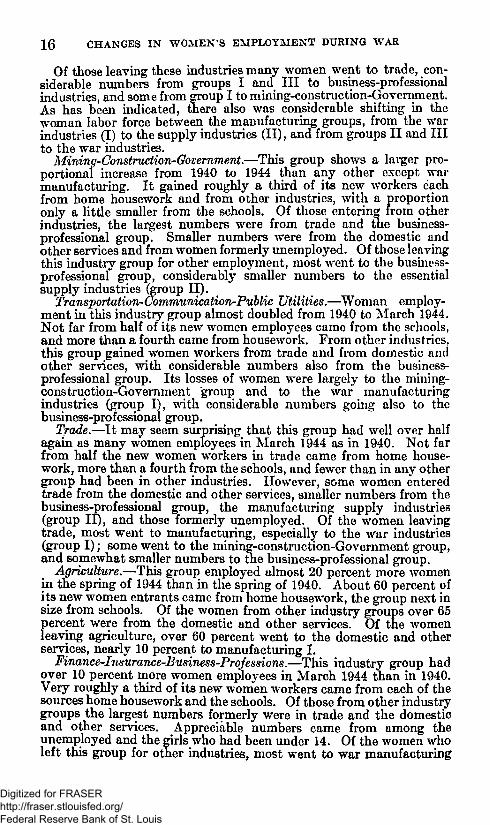
Former Occupation Group of Women Who Shifted to New Occupations.Of the women employed both before Pearl Harbor and in March
1944, there were 1,460,000 yho changed their occupation group. Thefactors normally of greatest influence with women in making such shiftsare the strength of demand in an occupation and the extent to whichthe worker can better her situation by the change. During the warperiod patriotic motives are added to these. Thus the movements tendto be toward those occupation groups that are seeking workers mosturgently, notably the manufacturing, clerical, and to a less extent theservice occupations other than domestic.
The movements also tend to be, naturally, toward the occupationsconsidered more desirable than the ones engaged in, because of betterconditions of work, higher pay, wider opportunity, or other induce-ment. Thus women formerly in domestic service have gone to otherservices and to manufacturing; those in other services have gone to themanufacturing and sales groups; those from manufacturing and sales,to clerical jobs; those from clerical, to manufacturing, managerial, andprofessional and semiprofessional work. Shifts in both directions havebeen considerable as between sales and manufacturing, between salesand clerical, and between domestic service and farm work.
New Employment of Women Who Changed Occupations.Many of the 1,460,000 women who changed their employment after
Fearl Harbor went into strikingly different lines of work. Over halfthose leaving service occupations and clerical work and some 40 per-cent leaving the professional group went to manufacturing. Practi-cally half or more of those leaving sales, manufacturing, and theproprietary group went into clerical occupations. Of those leaving thefarm, 60 percent went to domestic service.
Digitized for FRASER http://fraser.stlouisfed.org/ Federal Reserve Bank of St. Louis
WAR SHIFTS IN MAJOR OCCUPATION GROUPS 9
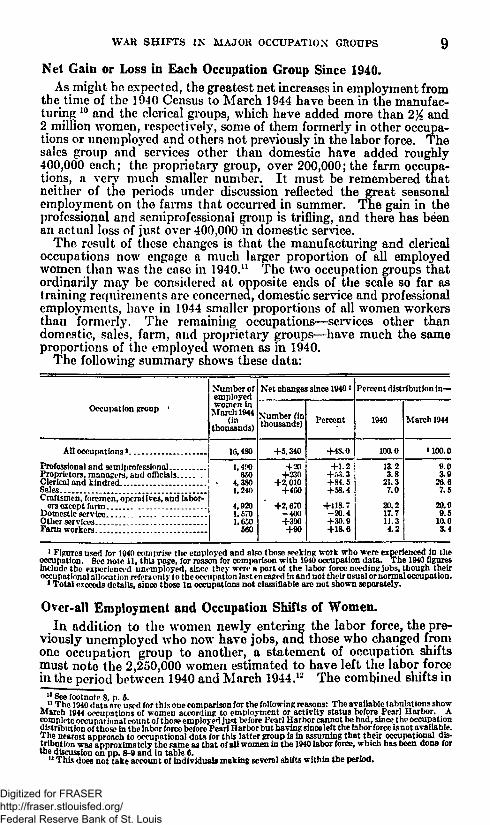
Net Gain or Loss in Each Occupation Group Since 1940.As might be expected, the greatest net increases in employment from
the time of the 1940 Census to March 1944 have been in the manufac-turing 10 and the clerical groups, which have added more than 2% and2 million women, respectively, some of them formerly in other occupa-tions or unemplo3red and others not previously in the labor force. Thesales group and services other than domestic have added roughly400,000 each; the proprietary group, over 200,000; the farm occupa-tions, a very much smaller number. It must be remembered thatneither of the periods under discussion reflected the great seasonalemployment on the farms that occurred in summer. The gain in theprofessional and semiprofessional group is trifling, and there has beenan actual loss of just over 400,000 in domestic service.
The result of these changes is that the manufacturing and clericaloccupations now engage a much larger proportion of all employedwomen than was the case in 1940.11 The two occupation groups thatordinarily may be considered at opposite ends of the scale so far astraining requirements are concerned, domestic service and professionalemployments, have in 1944 smaller proportions of all women workersthan formerly. The remaining occupations—services other thandomestic, sales, farm, and proprietary groups—have much the sameproportions of the employed women as in 1940.
The following summary shows these data:
Occupation group '
All occupations *
Professional and scmiprofessinnalProprietors, managers, and officialsClerical and kindredSales... .Craftsmen, foremen, operatives, and labor-
ers except farm.. »Domestic serviceOther servicesFarmworkers
Xumber ofemployedwomen in
March 1944(in
thousands)
16,480
1,400650
4,3S01,240
4,9201.5701,650
660
Net changes since 1940 l
Xumber (inthousands)
+5,340
+20+230
+2,010+460
+2,670- 4 0 0+390+90
Percent
+48.0
+1.2+.'J3.3+84.5+58.4
+118.7-20.4+30.9+18.6
Percent distribution in—
1940
100.0
13.23.8
21.37.0
20.217.711.34.2
March 1944
•100.0
9.03.9
26.67.5
29.99.5
10.03.4
1 Fijrurcs used for 1940 comprise the employed and also those seeking work who were experienced in theoccupation. Sec note 11, this page, for reason for comparison with 1940 occupation data. The 1940 figuresinclude the experienced unemployed, sksco they wen* a part of the labor force needing jobs, though theiroccupational allocation refers only to theoccupation last enpaged in and not their usual ornonnal occupation.
I Total exceeds details, since those la occupations not classifiable arc not shown separately.
Over-all Employment and Occupation Shifts of Women.In addition to the women newly entering the labor force, the pre-
viously unemployed who now have jobs, and those who changed fromone occupation group to another, a statement of occupation shiftsmust note the 2,250,000 women estimated to have left the labor forcein the period between 1940 and March 1944.12 The combined shifts in
, " The UMOdata'are used for this one comparison for the following reasons: The available tabulations showMarch 1944 oecuirations of women according to employment or activity status before Pearl Harbor. Acomplete occupational count of those em ployed just before Pearl Harbor cannot be had, since the occupationdistribution of those in the labor force before Pearl Harbor but having since left the labor force is not available.The nearest approach to occupational data for this l3tter group is in assuming that their occupational dis-tribution was approximately the same as that of all women in the 1940 labor force, which has been done forthe discussion on pp. 8-9 and In table 6.
II This does not take account of individuals making several shifts within the period.
Digitized for FRASER http://fraser.stlouisfed.org/ Federal Reserve Bank of St. Louis
1 0 CHANGES IN WOMEN'S EMPLOYMENT DURING WAR
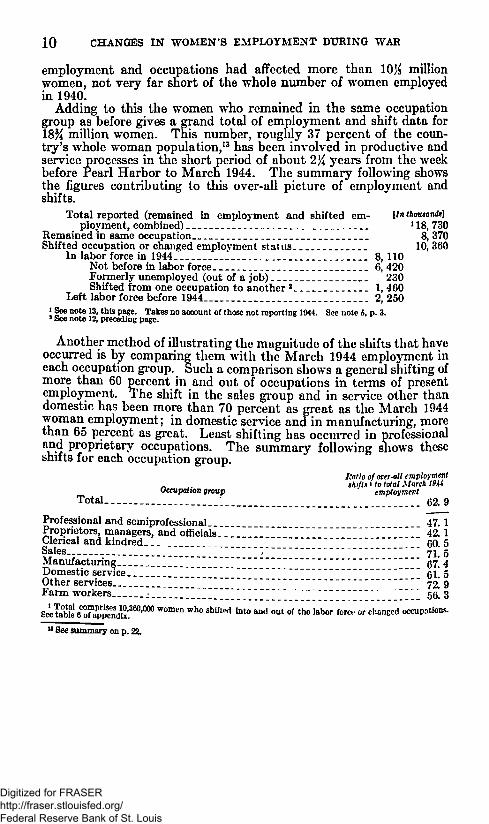
employment and occupations had affected more than 10% millionwomen, not very far short of the whole number of women employedin 1940.
Adding to this the women who remained in the same occupationgroup as before gives a grand total of employment and shift data for18% million women. This number, roughly 37 percent of the coun-try's whole woman population,13 has been involved in productive andservice processes in the short period of about 2% years from the weekbefore rearl Harbor to March 1944. The summary following showsthe figures contributing to this over-all picture of employment andshifts.
Total reported (remained in employment and shifted em- [In thousand*]ployment, combined) US, 730
Remained in same occupation 8, 370Shifted occupation or changed employment status 10, 360
In labor force in 1944 1 8, 110Not before in labor force._ __. 6, 420Formerly unemployed (out of a job) 230Shifted from one occupation to another 2 1, 460
Left labor force before 1944__. 2, 250i See note 13, this page. Takes no account of those not reporting 1944. See note 5, p. 3.3 See note 12, preceding page.
Another method of illustrating the magnitude of the shifts that haveoccurred is by comparing them with the March 1944 employment ineach occupation group. Such a comparison shows a general shifting ofmore than 60 percent in and out of occupations in terms of presentemployment. The shift in the sales group and in service other thandomestic has been more than 70 percent as great as the March 1944woman employment; in domestic service and in manufacturing, morethan 65 percent as great. Least shifting has occurred in professionaland proprietary occupations. The summary following shows theseshifts for each occupation group.
Ratio of over-all employment. . Bhifis t to total March 19UOccupation group employment
Total . . I 6 ^ 9
Professional and semiprofessional 47. 1Proprietors, managers, and officials " 42. 1Clerical and kindred " 60.5Sales " " """ 7x. 5Manufacturing I I I I I I I I " 67! 4Domestic service I " I I "~"I 6ll 5Other services 72 9Farm workers _: 11 III II I 56! 3
o u t o f t h e l a b o r f o r < v o r c h a
" See summary on p . 22.
Digitized for FRASER http://fraser.stlouisfed.org/ Federal Reserve Bank of St. Louis

CHANGES IN EMPLOYMENT BY INDUSTRY GROUP 11
CHANGES IN WOMAN EMPLOYMENT BY INDUSTRYGROUP
Practically half the women employed in March 1944 were in thesame broad industry group as formerly, as the following summaryshows:
[In thousands]Women employed March 1944 16,480
In same industry group as formerly 8, 220Not in same industry group as formerly 8, 270
From other industry groups 1, 620Formerly unemployed 230From outside the labor force. 6,420
Women Remaining in Same Industry Group as Formerly*Tabulation by industries from this material necessitates combina-
tions into very broad groups. Though the particular occupationgreatly influences shifts between industries, data from the sampledo not permit correlation of occupation and industry. The summariesfollowing indicate the combinations made along broftd industrial lines.
It is not surprising that manufacturing had the smallest proportionof employees who were in the same industry class as formerly (exceptfor the mining-construction-Government group, containing only arelatively small number of women; it is merely a residual group).
The largest proportions of the March 1944 women workers in thesame industry group both before Pearl Harbor and in March 1944were those in the domestic, personal, and recreation services; in thefinance, business, and repair, and professional services; and inagriculture.
Industry group
Women Inthe indus-try groupin March
1944 (inthousands)
Women In the same in-dustry group Decem-ber 1941 and March1944
Number (inthousands)
Percent ofall in theindustrygroup in
March 1044
All Industries.. IG.450 8,220 49.9
AgricultureManufacturing*Transportation, communication, public utilitiesTrade, wholesale and retailFinance, business, repair, professionalDomestic, personal, recreation services _Other (mining, construction, Government, forestry, fishing)'-Not ascertainable
5805,590680
3,1902,6802,6601,080
20
3502,380330
1,5301,6301,660
330()
60.542.648.047.861.062,530.7
1 See p412 for industries Included in each manufacturing group.1 These were combined, since this is an "other" industry group.1 Less than 5,000.
Women Who Remained in the Labor Force-Of the women employed in March 1944 in the business-professional
group and in domestic and other services, about 70 percent were inthe labor force before Pearl Harbor- On the other hand, only 55 to
594580*
Digitized for FRASER http://fraser.stlouisfed.org/ Federal Reserve Bank of St. Louis

1 2 CHANGES IN WOMEN'S EMPLOYMENT DURING WAR
57 percent of those in trade, in manufacturing, and in the mining-construction-Government group formerly w£re in the labor force, asappears in the following:
* r ° Percent who before PeartHarbor were—
Not inindustry group In labor force labor force
All industries 61.0 39.0Agriculture 64. 8 35. 2Manufacturing l 56. 8 43. 2Transportation, communication, public utilities 60. 9 39. 1Trade, wholesale and retail _ - 56. 2 43. 8Finance, business, repair, professional 69. 6 30. 4Domestic, personal, recreation services 69.1 30. 9Other (mining, construction, Government, forestry, fishing) 54. 6 45. 4
i See text following for industries included in each manufacturing group.
The Various Manufacturing Industries.Manufacturing industries have been tabulated in separate divisions
in order to show the shifts in woman employment between the varioustypes of manufacturing industries, shifts which are of particular im-portance in wartime. Group I contains the workers in major warmanufacturing—in the metal, chemical, and rubber industries.Group II is composed of workers in the consumer industries that sup-ply both the civilian population and the armed forces with essentials—food, clothing, textiles, and leathers. The remaining manufacturingemployees are placed in group III. As the following summary shows,group I, the essential war industries that have expanded so rapidly,differed from the two other manufacturing groups in two respects:Its labor force included much smaller proportions of its own formeremployees, and its recruitment of new personnel was very much greaterfrom within the labor force as well as from outside sources.
Manufacturing group
Women inthe indus-try prounin March1044 » (in
thousands)
Percent who formerly were—
In samemanufac-
turinggroup
In anothermanufac-
turinggroup
In industrygroups otherthan manu-
facturing
Outsidethe
laborforce
All manufacturing
Group IGroup nGroup III
5,540 38.0 4.6 12.0 43.2
2,690 '2,160 •
730 |
23.653.843.8
7.71.04.3
17.75.89.8
49.136.940.3
* Totals exceed cross details; in all manufacturing, about 2 percent were unemployed; in group 1,2 percent;in group II, 2.5 percent; in group 111,1.8 percent.
New Entrants to Each Industry Group.With one exception, the largest numbers of new entrants to every
industry group came from home housework, and in almost all groupsthe second largest number came from the schools; however, 20 percentof the total shifted from other industry groups. Home houseworkersmade up nearly 60 percent of the newcomers to agriculture and halfthose to the domestic-and-personal-service group; and in each of these,schoolgirls were 18 percent of the new workers. On the other hand, thesituation was reversed for the transportation-communication group,home houseworkers constituting only 26 percent of the new employeesand girls out of school 46 percent. Workers from these two sources
Digitized for FRASER http://fraser.stlouisfed.org/ Federal Reserve Bank of St. Louis

CHANGES IN EMPLOYMENT BY INDUSTRY GROUP 13
were more nearly equal in number in the business-professional group.The residual mining-construction-Government group differed fromthe others in that almost as many women newly employed came fromother industry groups as from home housework, in each case nearlya third. This and manufacturing group I drew from other industrieslarger proportions than any other group, and agriculture, trade,manufacturing II, and the services group drew least from otherindustries.
Regarding those from other sources, the major groups in agricultureand the domestic and personal services were under 14 years of agebefore Pearl Harbor. Considerable numbers of women formerlyunemployed were taken on in each manufacturing group, in trade, andin the miscellaneous mining-construction-Government group. Manu-facturing II and the business-professional group took considerable,numbers of girls formerly under 14, but larger numbers of thoseformerly unemployed.
Industry group
Total...
Agriculture - . - -Manufacturing
Group IGroup 11 . .Group III
Transportation, communication, publicutilities
Trade, wholesale* and retailFinance, business, repair, professionalDomestic, personal, recreation services . .Other (mining, construction, Government,
forestry, fishing) „
New en-trants to
the indus-try since
Pe&rl Har-bor (in
thousands)
18,270
230*3,210
2,0601,000
410
3601,6701,0101,000
750
Other in-dustries
19.6
10.521.033.214.725.2
24.114.319.015.0
31.3
Percent who came from—
Homehousework
•43.5
68.545.639.94S.338.4
26.445.439.649.7
31.5
School
2*). 5
18.124.820.525.828.3
45.628.432.418-0
26.6
Other ac-tivities
10.4
2 12.98.6
<6.4M1.2*8.1
4.0U1.9*8.1
U7.2
*10.6
1 Total exceeds details, as industry for 10 000 new entrants not ascertamable.* Major group under 14 before Pearl Harbor. - ,* Details here exceed total entrants to all manufacturing industries, as 260,000 women shifted from group
to proup within manufacturing.* Major group formerly unemployed.' Includes considerable, numbers of those formerly under 14, but larger numbers of unemployed-
Distribution of New Entrants to Labor Force.Of the women who entered employment from home housework, 40
percent went to manufacturing, chiefly to groups I and II, about halfas many to trade, 14 percent to the domestic and personal services, anda somewhat similar proportion, .12 percent, to the business andprofessional group.
Of the newly employed schoolgirls, proportions similar to those ofhome houseworkers entered the total manufacturing and trade groups,but a very much smaller proportion went into the domestic andpersonal services.
Of the girls under 14 entering the labor force, 40 percent went intotrade, 35 percent to the domestic and personal services, nearly 10percent to agriculture. Relatively few entered manufacturingindustries, none the third group. .
More than half of the unemployed went to manufacturing, chiefly togroups I and II, but very roughly a tenth of them went to each of the
Digitized for FRASER http://fraser.stlouisfed.org/ Federal Reserve Bank of St. Louis

14 CHANGES IN WOMEN'S EMPLOYMENT DURING WAR
groups of trade, domestic and personal services, mining-construction-Government, and business-professional.
Industry group
Pcrcents entering the indus-try groups specified whobefore Pearl Harbor were-
In homehousework
13.600100.0
3.740. G22,813.44.42.6
21.011.513.8C.C
In school
12,190100.0
1.936.319.211.75.37.4
21.615.48.29.1
Number of women (in thousands).Percent
Agriculture _ _Manufacturing _ _
Group IGroup I I . _.Group III
Transportation, communication, public utilitiesTrade, wholesale and retail..Finance, business, repair, professional _ . . „ .Domestic, personal, recreation servicesOther (mining, construction, Government, forestry, fishing).
* Total exceeds details, as Industry group not ascertainable for very small proportions.
Major Shifts Between Industry Groups.The over-all of shifts between industry groups made in the war
period by women who were employed both before Pearl Harbor andin March 1944 involved nearly 2 million women. The largest propor-tions who entered the various manufacturing groups, the transporta-tion-communication, and the mining-construction-Government groupswere from trade. Women entering agriculture, trade, and business-professional went in greatest numbers from the domestic and personalservices. Manufacturing group I gained from group II, and each ofthe manufacturing groups gained from the domestic and personalservices. It must be borne in mind that these figures are estimatesbased on a small sample.
More than 60 percent of the women who left agriculture went to thedomestic and personal services. The major war manufacturing in-dustries (group I) attracted more than 50 percent of those leavingmanufacturing (groups II and III) and 30 to 40 percent of those leav-ing the trade, business-professional, and domestic-and-personal-serv-lce groups. However, some women went from manufacturing I tothe mmmg-construction-Government group, as did the largest num-ber of those leaving transportation-communication. These may havebeen largely clerical workers. Of those leaving mining, construction,and so forth, the largest proportion went to business-professional.
Net Gain or Loss in Each Industry Group Since 1940.14
Woman employment increased by nearly 50 percent from 1940 toMarch 1944. However, this does not take account of the 1,710,000women who were on emergency work or unemployed in 1940, who inreality were a part of the labor force at that time. Addition of theseto the 1940 labor force reduces the increase in woman employmentby 1944 to about 36 percent.
As would be expected, the greatest increase was in the war industries
Digitized for FRASER http://fraser.stlouisfed.org/ Federal Reserve Bank of St. Louis
CHANGES IN EMPLOYMENT BY INDUSTRY GROUP 15
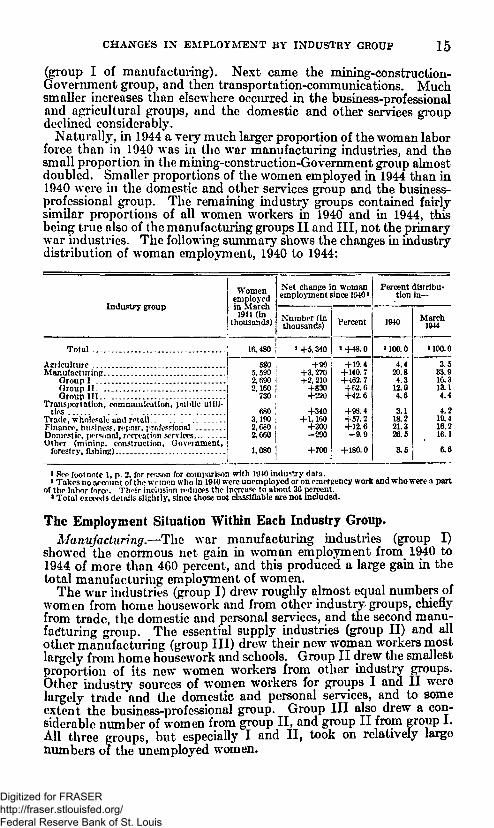
(group I of manufacturing). Next came the mining-construction-Governmcnt group, and then transportation-communications. Muchsmaller increases than elsewhere occurred in the business-professionaland agricultural groups, and the domestic and other services groupdeclined considerably.
Naturally, in 1944 a very much larger proportion of the woman laborforce than in 1940 was in the war manufacturing industries, and thesmall proportion in the mining-construetion-Government group almostdoubled. Smaller proportions of the women employed in 1944 than in1940 were in the domestic and other services group and the business-professional group. The remaining industry groups contained fairlysimilar proportions of all women wwkers in 1940 and in 1944, thisbeing true also of the manufacturing groups II and III, not the primarywar industries. The following summary shows the changes in industrydistribution of woman employment, 1940 to 1944:
Industry group
Womenemployedin March1941 (in
thousands)
Net change in womanemployment since 1940l
Number (inthousands) Percent
Percent distribu-tion in—
March
Total .
Apiiculture . . . .Manufacturing
Oroup I _Group IIGroup III .
Transportation, communication, public utili-ties
Trade, wholesale and retailFinance, business repair, professionalDomestic, |H»r^»nal, recreation services ,Other (mininp, construction, Government,
forestry, fish ing)
lfi.480 *+5,340 s+48.0 »100.0 U00.0
5S0 | +905,590 ! +3.2702,090 I +2,2102,160 j +830
730 i +220
+340+1,160
+300-290
3,190 ;2,6S0 i2,660 j
1,080 I +700
+ 19.4+ 140.7+462.7+62.6+42.6
+98.4+57.2+12.6
+180.0
4.420.84.3
12.04.6
3.118.221.326.5
3.5
3.533.916.313.14.4
4.219.416.216.1
6.6
1 See footnote 1, p. 2, for reason for comparison with 1910 industry data.* Takes no arcnunt of the women who in 1940 were unemployed or on emergency work and who were a part
of the labor force. TlK'ir inclusion reduces the increase to about 36 percent.* Total exceeds details slightly, since those not classifiable are not included.
The Employment Situation Within Each Industry Group.Manufacturing.—The war manufacturing industries (group I)
showed the enormous net gain in woman employment from 1940 to1944 of more than 460 percent, and this produced a large gain in thetotal manufacturing employment of women.
The war industries (group I) drew roughly almost equal numbers ofwomen from home housework and from other industry groups, chieflyfrom trade, the domestic and personal services, and the second manu-facturing group. The essential supply industries (group II) and allother manufacturing (group III) drew their new woman workers mostlargely from home housework and schools. Group II drew the smallestproportion of its new women workers from other industry groups.Other industry sources of women workers for groups I and II werelargely trade and the domestic and personal services, and to someextent the business-professional group. Group III also drew a con-siderable number of women from group II, and group II from group I.All three groups, but especially I and II, took on relatively largenumbers of the unemployed women.
Digitized for FRASER http://fraser.stlouisfed.org/ Federal Reserve Bank of St. Louis
16 CHANGES IN WOMEN'S EMPLOYMENT DURING WAR
Of those leaving these industries many women went to trade, con-siderable numbers from groups I and III to business-professionalindustries, and some from group I to mining-construction-Government.As has been indicated, there also was considerable shifting in thewoman labor force between the manufacturing groups, from the warindustries (I) to the supply industries (II), and from groups II and IIIto the war industries.
Mining-ComtructioTt-Government.—This group shows a larger pro-portional increase from 1940 to 1944 than any other except warmanufacturing. It gained roughly a third of its new workers eachfrom home housework and from other industries, with a proportiononly a little smaller from the schools. Of those entering from otherindustries, the largest numbers were from trade and the business-professional group. Smaller numbers were from the domestic andother services and from women formerly unemployed. Of those leavingthis industry group for other employment, most went to the business-professional group, considerably smaller numbers to the essentialsupply industries (group II).
Transportation-CornmunicatioT^Public Utilities.—Woman employ-ment in this industry group almost doubled from 1940 to March 1944.Not far from half of its new women employees came from the schools,and more than a fourth came from housework. From other industries,this group gained women workers from trade and from domestic andother services, with considerable numbers also from the business-professional group. Its losses of women were largely to the mining-construction-Government group and to the war manufacturingindustries (group I), with considerable numbers going also to thebusiness-professional group.
Trade.—It may seem surprising that this group had well over halfagain as many women employees in March 1944 as in 1940. Not farfrom half the new women workers in trade came from home house-work, more than a fourth from the schools, and fewer than in any othergroup had been in other industries. However, some women enteredtrade from the domestic and other services, smaller numbers from thebusiness-professional group, the manufacturing supply industries(group II), and those formerly unemployed. Of the women leavingtrade, most went to manufacturing, especially to the war industries(group I); some went to the mining-cons true tion-Government group,and somewhat smaller numbers to the business-professional group.
Agriculture.—This group employed almost 20 percent more womenin the spring of 1944 than in the spring of 1940. About 60 percent ofits new women entrants came from home housework, the group next insize from schools. Of the women from other industry groups over 65percent were from the domestic and other services. Of the womenleaving agriculture, over 60 percent went to the domestic and otherservices, nearly 10 percent to manufacturing I.
Finance-Insurance-Business-Professions.—This industry group hadover 10 percent more women employees in March 1944 than in 1940.Very roughly a third of its new women workers came from each of thesources home housework and the schools. Of those from other industrygroups the largest numbers formerly were in trade and the domesticand other services. Appreciable numbers came from among theunemployed and the girls who had been under 14. Of the women wholeft this group for other industries, most went to war manufacturing
Digitized for FRASER http://fraser.stlouisfed.org/ Federal Reserve Bank of St. Louis

MARITAL STATUS OF WOMEN WAR WORKERS 1 7
(group I), much smaller numbers to mining-construction-Governmentand to trade.
Dornestic-Personal-Recreation Services.—This was the only groupthat sustained a net loss in number of women workers between 1940and March 1944. Though it had this net loss, some women had comenewly into such employment. Half these came from home housework,and groups of similar size were from schools and from other industries,chiefly from agriculture, with smaller numbers from trade. Consider-able numbers of women workers under 14 years of age entered thisgroup. Of the women leaving these sendees, most went to manufactur-ing, especially to the war industries (group I), and appreciable numberswent to trade and to the business-professional group.
MARITAL STATUS OF WOMEN WAR WORKERS
To the worker, the items of greatest importance about her job arethe character of the work, the conditions under which it is done, andthe amount it pays. Whether she be married or single has in itself nobearing on her job. Whatever their marital status, most workingwomen must support themselves, and in many cases others as well.Among single as well as married women a large proportion are home-keepers and many also care for children. Whether she be single ormarried, the household responsibilities of the woman worker inaddition to heroutside job may affectseriouslyherhealthand efficiency.
To the employer, the important attribute of his workers is theirefficiency on the job, and their marital status is of no concern to himunless it should affect the efficiency or regular attendance of hislabor force.
Though marital status is of far less significance in the job than otherfactors, it is a matter of continuous interest. This may be 'partlybecause the more significant factors are so much more difficult todetermine than the relatively simple data as to marital status. It alsois in part a relic of the early idea that society has the right to regulatethe lives of women in more personal matters than it does the livesof men.
In 1940, as at all previous census dates, many more single thanmarried women were working, though married women far exceededsingle women in the population. A number of things contributed tothis. Aside from the matter of tradition, it has become customary forthe young woman to develop expertness in some occupation, to betaught that it is incumbent on her to work as a matter of course, to beat least self-supporting, and often to contribute to the family fundsmore than the amount of her own upkeep.Increases in Employment of Women, by Marital Status*
Employment increases in the war period were very much greateramong married than single women, both in numbers and in proportions'of their marital group that entered the labor force, as the followingshows:
Employment increasesfrom WO to March 19U
Number (inthousands) Percent
Single w o m e n . . . . -- J.JOO 32Married women - 3' 13° iS>
Digitized for FRASER http://fraser.stlouisfed.org/ Federal Reserve Bank of St. Louis

18 CHANGES IN WOMEN'S EMPLOYMENT DURING WAR
The large increase among single women is not surprising, since if notalready employed they are likely to be more free than married womento go to work. As noted on page 2, marital status was not obtainedin March but was transcribed from the February schedule for thesame family. In cases where marital status was not available fromthe February schedule, a woman was listed as single unless therewas a man of similar age in the family and no other woman possiblyhis wife. This explains the difference between the marital-statusfigures shown here and the February figures reported by the Census.In this time of pressure for added labor supply, the married womenfor the first time in this country's history exceeded single women inthe employed group, and that by nearly 2 points (1.7) in March 1944.Since this was a period of accelerated marriage, the proportion of themarried women in the population also had increased, as will be dis-cussed later (p. 21). Numbers then employed were as follows:
Women employed March 19UNumber (inthousands) Percent
Total 16,480 100.0
Single 7,030 42.7Married 7,310 44.4Widowed or divorced 2,140 13. 0
Various Groups of Married Women.To discuss married women as a complete group loses sight of signifi-
cant differences in labor-force status between those whose husbands arepresent in the home and those whose husbands are absent for onereason or another. Women with husbands absent constitute 12 per-cent of all married women, but they are 26 percent of the marriedwomen employed. The data now made available separate informationas to married women with husbands present and those with husbandsabsent, and for the first time those whose husbands are in the armedforces also are singled out. The latter group has become importantduring this war period in the increase in employment, as the followingshows, though a considerable proportion of the service men's wives hadleft the labor force before March 1944. (See p. 19.)
This section of the report includes some discussion of these variousgroups of married women, but again attention must be called to thefact that, as explained on page 2, the figures are estimates from asample. Therefore, while they give a good general indication as tothe relationships of the various groups, including the relative placeof some that are quite small in comparison with others, they cannotbe interpreted as measuring the size of these groups with exactitude.
Women employed inMarch 19U
Number (in Percent inthousands) Percent 1940
Allwomen 1 16, 480 100.0 100.0Single 7 030 42.7 47.9Married 7 300 _
Husband present 5, 370 32. 6 31. 9Husband absent—
In armed forces 1,280 7.7 5.6Not in armed forces 650 4.0
Widowed or divorced 2, 140 13. 0 14. 61 Total exceeds details, as there were 10,000 women for whom husbands' status was not ascrrtainable.
Digitized for FRASER http://fraser.stlouisfed.org/ Federal Reserve Bank of St. Louis

MARITAL STATUS OF WOMEN WAR WORKERS 19
Women's Labor-Force Status, by Marital Status in March 1944.Of the women who were in the labor force both before Pearl Harbor
and in March 1944, 42 percent were single, 30 percent married withhusband present, 16 percent widowed or divorced. Of the new entrantsafter Pearl Harbor, nearly 44 percent were single, about 36 percentmarried with husband present, nearly 10 percent were women withhusbands in the armed forces, and a somewhat smaller proportionwere widowed or divorced.
Of the women not in the labor force in either period, the March 1944status was that 65 percent were married with husband present, 17 per-cent single, 13 percent widowed or divorced. Eighty percent of thetotal were in home housework, some were in school, a few had beenunder 14 before Pearl Harbor.
Of those who had left the labor force between the Pearl Harbordate and March 1944, 62 percent were married with husband present,about 12 percent each were single or were service wives, nearly 10 per-cent widowed or divorced. Of the total of this group nearly 93 percenthad gone into home housework.
Marital status
All groups (In thousands)
SingleMarried:
Husband presentHusband absent—
In armed forcesOther
Widowed or divorced
Percent in each marital status of those who—
Were in laborforce at both
dates
10,230
42
30
75
16
Entered laborforce between
dates
6,650
44
36
938
Were not inlabor force ateither date
33,260
17
65
32
13
Left laborforce since
Pearl Harbor
2,180
12
62
133
10
Relative Stability of Single and Married Women Workers.A consideration of the women at work in March 1944 who were em-
ployed before Pearl Harbor shows as very nearly equal the stability ofsingle and married women. In each group between 56 and 59 per-cent had been employed before Pearl Harbor, and the numbers of thesingle and the married women who were at work in both periods areremarkably similar. Of those employed before Pearl Harbor whohad continued to work, the smallest proportion was among the'womenwith husbands in the armed forces. Even of these, more than halfwere employed at both times, but their not remaining employed maybe explained by the availability of financial allotments for their liveli-hood and by their assumption of new responsibilities of home andchildren, which would fill their time. Increased mobility duringwartime might add to or detract from numbers of employed married
Digitized for FRASER http://fraser.stlouisfed.org/ Federal Reserve Bank of St. Louis

20 CHANGES IN WOMEN'S EMPLOYMENT DURING WAR
women in various areas, depending on a variety of factors. Thefollowing summary shows the figures just discussed, with others:
Employed before Pearl Harbor andin March 19U
Percent ofall March
Number employed 19Uat both dates employed
Marital status (in thousands) womenAll women 9,830 59.7
Single 4,140 58.9Married !4, 130 56.4
Husband present 3,010 56.1Husband absent—
In armed forces 660 51.5Not in armed forces 450 68.5
Widowed or divorced -- 1,560 73.1* Total exceeds details, as status of some husbands not ascertainable.
Marital Status and Former Activity of New Accessions to the WomanLabor Force.
Of the 6,650,000 women in the labor force in 1944 who were notemployed before Pearl Harbor, over 40 percent were single and anumber not very far short of this were married, with husbandspresent.
Among the single women, 68 percent formerly were in school.Among the 2 million young women who had been in school, about 90percent were single women (1,970,000 of them). However, there werea considerable number of young wives with husbands now in the armedforces who were former schoolgirls.
Of the 3% million women workers who formerly were home house-workers, more than 2 million were married with husbands present inthe home.
The summary following shows the previous activities of the majorproportions of the new women workers in the various marital groups:
Marital status
Total.
Single _ „Married
Husband present ~ ^Husband absent-
In armed forcesNot inarmed forces
Status of husband not ascertainable'.Widowed or divorced
New wom-en workersin 1944 (inthousands)
6,650
2,8903,1902,300
620210
V)570
Percent who before Pearl Harbor were—
Unem-ployed
3.4
4.41.71.1
2.45.8
7.7
In homehousework
M.I
13.586.091.3
67.780.1
1C0.081.4
In school
33.0
68.07.03.5
20.46.2
.8
Other
9.5
14.05.44.1
9.57.9
10.1
1 Less than 5,000.
Marital Status and Activity of Women Who Left the Labor Force.Among the women who were employed just before Pearl Harbor,
2,250,000 left employment prior to March 1944. Over 60 percent ofthese are married women with husbands present. More than a tenthare those with husbands in the armed services, a smaller proportionare single women, and still fewer are widowed or divorced. In eachgroup the great majority of those who left employment returned to
Digitized for FRASER http://fraser.stlouisfed.org/ Federal Reserve Bank of St. Louis

MARITAL STATUS OF WOMEN WAR WORKERS 21
home housework; in the case of married women with husbands pres-ent, this group comprises over 96 percent of all those leaving. Veryroughly a tenth of the widowed or divorced women and of those withhusbands in the armed forces are still in the labor force but unem-ployed in March 1944, and this is true of a somewhat larger proportionof the single women. Small numbers have returned to school, nearlyall of these being simrle girls.
The summary following shows the activities of the women in eachmarital group who left employment between Pearl Harbor and March1944.
Marital status
All women *
SingleMarried:
Husband prc^ntHusband absent—
In armed forces ~*Not in armed forces . . .
Status of husband not ascertalnable. - -Widowed or divorced
Women wholeft employ-ment since
Pearl Harbor(in thousands)
2,250
280
1,370
300SO
m210
Percent who in March 1944 were—
Unem-ployed
6.0
13.0
3.0
10.18.6
9.1
In homehousework
87.8
62.5
96.3
86.283.0
1C0.070.6
In school
0.5
2.7
.5
.7
.7
Other *
5.7
21.8
.7
3.37.8
19.6
i Includes thoco unablo to work.J Less than 0.05 percent.< Less than 5,(X)0.
Increasing Employment of Married Women.Though single women formerly have made up the greater part of
this country's woman labor force, it has become necessary for an in-creasing number of married women to work, a factor in Americaneconomy that cannot be ignored. To begin with, there now are inthe population about 2% million more married women and somemillions fewer single women than in 1940 to help carry on the country'sproduction and services. The proportion of married women in theentire woman population increased by 8 or 9 percent, 1940 to 1944,while the number of single women declined by from 6 to 9 percent.
The time has passed when a woman automatically can leave thelabor market merely because of her marriage. Efforts to push herout for that inconsequential reason may result in unwarranted familyhardship. In an increasing number of instances her earnings arenecessary to support the new home. In many cases she could notmarry unless her earnings helped to establish the home. In perhapsmore cases she could not marry unless she continued to shoulder herpremarital financial responsibilities in her parents' home. An impor-tant population trend that contributes considerably to this situation isthe increase in the proportion of older persons. Young persons oftenmust continue after marriage to carry part of the support of familymembers who are passing beyond working age or are so young asstill to be in school. The responsibility of the individual family for itsolder members is likely to be unchanged for a number of years tocome, since the proportion of these older persons in the populationis increasing and their needs are not yet adequately provided for
Digitized for FRASER http://fraser.stlouisfed.org/ Federal Reserve Bank of St. Louis

22 CHANGES IN WOMEN'S EMPLOYMENT DURING WAR
through the developing assurance systems. In many families some
Eart of this load is being assumed, and must continue to be assumed,y the working wife and the married daughter.During the war period more than a million married women with
husbands present have left employment—1,370,000—most of them toenter home housework. This indicates that those who are able to doso in general are likely to return to their homes. Those who remain intheir occupations find it necessary to continue work for some reason,and in the postwar period they should not be discriminated against inemployment for arbitrary reasons, such as marital status, that haveno connection with their working ability.
The proportional increase in married women, combined with othereconomic and population factors such as have been discussed, makes itprobable that after the war there will be more married women in thelabor force than before the war, though the number is likely to besmaller than at the war peak.
The proportions among the women of each marital group who wereemployed in 1940 and in March 1944 are as follows:
Marital status
Total
Single*Married.Widowed or divorced
Woman populationin 1940 i
Number(in thou-sands)
50,550
13,94030,0906,520
Percentemployedin 1940 a
22.0
33.313.925.0
Woman population in March 1944
Number 3(in thou-sands)
52,320
13,11032,4906,720
Percentchangefrom1910
+3.5
-6 .0+8.0+3.0
Percentemployedin March
1944
31.5
53.622.531.8
i U. S. Census of 1940. Population, Vol. IV, table IX, p. 5, and table 2, p. 9.*Ibid., Vol. I l l , table 68, p. 111.3 Marital status figures shown here were transcribed from February schedules. See text on p. 18 for
explanation.* Marital status of population shown only for persons 15 and over. Age group 14 assumed to be single.
AGE OF WOMEN WORKERS AND WOMEN NOT AT WORK
Of the women in the labor force in March 1944, 55 percent wereunder 35 years of age, but of those not in the labor force nearly 60 per-cent were 35 years of age or older, more than 40 percent being atleast 45.
Of women in the labor force before Pearl Harbor as well as inMarch 1944, over half were 35 years of age or older. The largest groupwere 45 years old or more, with almost as many 25 to 34. The oppo-site situation existed among those that newly entered the labor forceduring the war period, nearly half being under 25 years of age and thelargest group under 20.
Of workers who were not in the labor force at either date, 60 percentwere 35 years old or more, the largest group being 45 or over. However,of former workers who had left the labor force during the war, 60percent were under 35, the largest group being 25 to 34.
Digitized for FRASER http://fraser.stlouisfed.org/ Federal Reserve Bank of St. Louis

AGE OF WORKERS AXD THOSE NOT AT WORK 23
Labor-force status
Total in labor force in March 1944
In labor force before Pearl Ilarbor and also in March
Entered labor force since Pearl Harbor.
Total not In labor force in March 1944
Not in labor force at either dateLeft labor force since Pearl Harbor
Number
(in thou-sands)
16,880
10,2306,650
35,440
33,2C02,180
Percent whose age in March 1944 was—
Under20
13.1
2.928.6
13.4
14.04.0
20-24
IS. 8
18.918.77.9
6.823.9
25-34
23.0
26.317.9
19.8
18.933.6
35-44
21.5
23.917.9
17.6
17.617.2
45 orover
23.5
27.916.8
41 3
42 621.1
Former and Present Activity Status, by Age.Among the home houseworkcrs, nearly half of those who did not
enter the labor force were 45 years of age or more, but of those whowent to work after Pearl Harfior over 70 percent were under 45.
Almost a third of the schoolgirls entering the labor force after PearlHarbor were at least 20 years of age, but of those who did not takejobs only 15 percent were as old as 20.
Few of the women formerly unable to work took jobs after PearlHarbor; of those who did not take jobs over 90 percent were 45 ormore.
Labor-force status in 1941 and subsequent status
In home housework in 1911:Entered labor force.Did not enter. . . .
In school in 1941:Entered labor force ..Did not enter -.-
Unable to work in 1W1:Did not enter -
Number ofwomen (inthousands)
3,71026,070
2,280£2001,820
Percent who were—
Under 20
1.71.0
6S.685.3
1.4
20-44
70.152.2
31.314.7
7.7
45 or over
28.246.8
. 1
91.0
Labor-Force Status and Marital Status, by Age.Of the single women in the labor force in March 1944, 90 percent
were under 45 years of age; of those who were widowed or divorced,more than 60 percent were 45 or over. Among the women in the laborforce, practically a third of those who were married with husbandspresent and of those with husbands absent but not in the armed forceswere 45 years of age or older. Those with husbands in the armed ser-vices were younger women. This distribution of the women of eachmarital status was similar for the groups that entered the labor forceafter Pearl Harbor and those who already were in the labor force, ex-cept that the women newly entering from the group with husbandsabsent but not in the armed services tended to be younger than thoseof the same marital group but already in the labor force.
Among those who were not in the labor force, over 70 percent of thesingle women and more than a tenth of the women with husbands inthe armed services were under 20 years of age. In every other groupthose not in the labor force tended to be older; more than 90 percent ofthe widqwed and divorced and more than 40 percent of those married
Digitized for FRASER http://fraser.stlouisfed.org/ Federal Reserve Bank of St. Louis

24 CHANGES IN WOMEN'S EMPLOYMENT DURING WAR
but with husbands present, or husbands absent but not in the armedforces, were at least 45. The proportions who were 45 years of ageor older were larger among those who formerly were not at work thanamong thoss who had left the labor force, except for single women,among whom more than a tenth of those who left the labor force wereunder 20 years of age and hence may be expected to have resumedtheir schooling.
APPENDIX—GENERAL TABLES[Note.—Because of rounding of numbers, details and totals do not agreo In all cases.]
TABLE 1.—Actitnty status in March 1944 of women 14 yean old or more at that timet
by their activity status in week preceding Pearl Harbor[In thousands]
Activity status in weekbefore Pearl Harbor
Total
In labor force
Employed _.Unemployed
Seeking workNot seekingEmergency work_
Not in labor force
In home housework...In schoolUnable to workUnder 14Other
Labor-force status not as-certainable.
Womenin statusspecifiedin weekbeforePearl
Harbor
i 52,320
12,410
12,09032010080
140
39,000
29,7804,4801,8302,670
230
910
Activity status In March 1944
Women in labor force
Total
16,880
10,230
9,9702609060
110
6,310
3,7102.280
1024070
340
Em-ployed
16,480
10,060
9,8302307050
110
6,100
3,6002,190
1023070
330
Unem-ployed
400
170
130402010
210
11090
10
10
Women not in labor force
Total
35,440
2,180
2.12060102040
32,690
26,0702,2001,8202,440
160
570
Inhomehouse-work
23,750
2,020
1,98040101030
26,240
25,65052030
12030
490
Inschool
3,940
20
10
3,890
201,580
2,290
30
Unable'to
work
2,310
70
70
m
h2,210
39010
1,7901010
30
Other
430
70
6010
350
11090
20120
10
i Woman population 14 years old or more in March 1944.* Less than 5,000.
TABLE 2.—Activity status of major groups of women in March 1944, by status inweek preceding Pearl Harbor
Activity status
In labor force:Employed. . . .Unemployed
Not in labor force:In home housework..In schoolUnder 14
Women instatus speci-fied in weekbefore PearlHarbor (inthousands)
12,090320
29,7804,4802,670
Percent of group specified whose status in March 1944 was—
Employed
SI. 469.3
12.148.98.5
Unem-ployed
1.112.0
.41.9.3
In homehousework
16.413.2
85.8• 11.7
4.3
In school
0.11.2
.135.285.7
Other
LI4.3
1.72.31.2
Digitized for FRASER http://fraser.stlouisfed.org/ Federal Reserve Bank of St. Louis
APPENDIX—GENERAL TABLES 25TABLE 3.—Percent distribution of chief groups of women in March 1944 according
to activity status in week preceding Pearl Harbor
Activity status
Total (in thousands)
In labor force:Employed.Unemployed
Not in labor force:In home housework .InschoolUnable to workUnder 14Other and not asoertainable
Percent distribution before Pearl Harbor of women who inMarch 1911 were—
In all typesof activity
*52.320100.0
23.1.6
56.98.63.55.12.2
Employed
16,480100.0
59.71.4
21. S13.3
.11.42.4
Unem-ployed
400100.0
33.59.7
23.321.6
2.14.7
In homehousework
28,750 '100.0
6.9
88.91.8A
L8
In school
3.940100.0
0.3.1.4
40.1.1
58.2.8
1 Women 14 years old or more in March 1944.
TABLE -Occupation group of women employed in March 1944$ by labor-force statusin week preceding Pearl Harbor
fin thousands]
Occupation group
Total . „ . _
Professional and semiprofessionalProprietors, managers, and oflicials... . . . .Clerical and kindredSalesCraftsmen, foremen, operatives, and
laborers except farm . . .Domestic serviceOther services..* . . . . . . . . . . .Farm workers .Not classifiable
iNumber ofwomen inthe group
March 1944
16,480
1,490650
4.3S01,240
4,9201,5701,650
56020
In labor force both be-fore Pearl Harbor and
In March 1944
Number
10,060
1,140540
2,610590
2,7501,110
950360
10
Percent ofall in occu-
pationgroup
March 1944
61.0
76.382.-J59,543.0
55.971.057,565.025.1
Not in labor force be-fore Pearl Harbor
Number
6,420
350110
1,770640
2,17045070020020
Percent ofall in occu-
pationgroup
March 1944
39.0
23.717.640.552.0
44.129.042.535.074.9
TABLE 5.—Occupation group in December 1941 of women who shifted to newoccupation group before March 1944
Occupation groupin March 1944
All occupations (1,460,000 women)..
Proprietors, managers, and officials-..Clerical and kindredBalesCraftsmen, foremen, operatives, and
Domestic service - -.- . . .-*.*.Other servicesFarm workers ---
Percent distribution of women according to occupation groupIn which employed before Pearl Harbor
Profes-sionaland
semi-profes-sional
5.3
1.08.5
10,2
5.62.9.7
6.8
Pro-prietors,man*agers,and
officials
2.2
3.4
""IT
1.7.4
1.17.0
\Clerical
andkindred
7.032.422.1
19.8
9.3
1.4
Sales
17.120.633.633.7
14.01.68.8
Crafts-men,fore-men,opera-tives,and
laborersexceptfarm
13.412.415.732.326.7
4.717.021.4
Domes-tic
service
27.48.84.75.79.7
34.7
6S.7. 64.8
Otherserv-ices
19.011220.612.129.7
29.323.3
Farmwork-
ers
7.58.12.41.91.1
4.565.6
1.7
Digitized for FRASER http://fraser.stlouisfed.org/ Federal Reserve Bank of St. Louis

26 CHANGES IN WOMEN'S EMPLOYMENT DURING WAR
TABLE 6.—Over-all of women's employment in same occupation and their shiftsin and out of labor force and between occupations, December 1941 to March 1944
[In thousands]
Occupation group
All occupations
Professional and semiprofes-sional
Proprietors, managers, andofficials
Clerical and kindredSalesCraftsmen, foremen, opera-
tives, and laborers exceptfarm
Domestic service ._Other servicesFarm workersNot classifiable
Women whoremained insame occu-pation andwomen who
changedactivity oroccupation,December
m i toMarch 1944combined»
»18,730
1,780
7404,8601,400
5,3801,9701,910
66050
Womenin same
occupationin March
1944 asbeforePearl
Harbor
8,370
1,080
4602,210
510
2,0601,000
700340
(3)
Women who shifted their occupation or employ-ment status
Grandtotal,
all shifts
10,300
700
2702,650
890
3,320960
1,20032050
Entered labor force orchanged occupation sincePearl llarbor
Total
8,110
400
1902,170
730
2,86057095022020
Enteredemploy-
ment
6,650
360
1201,830
650
2,29047073020020
Changedoccupation
1,460
40
7034080
5701002202010
Left thelabor force
beforeMarch1944*
(estimate)
2,250
300
90480160
46040026010030
i Does not take account of individuals making several shifts within the period.3 Distributed according to 1940 Census of Occupations of employed women*»Less than 1,000.
TABLE 7.—Industry group of women employed in March 1944 by labor-force statusin week preceding Pearl Harbor
|[In thousands]
Industry groupWomen inindustrygroup in
March 1944
In labor force beforePearl Harbor
Number ofwomen
Percent ofall in theindustrygroup in
March 1944
Not In labor force beforePearl Harbor
Number ofwomen
Percent ofall in theindustrygroup In
March 1944
Total
AgricultureManufacturing
Group I _ „_.Group IIGroup III
Transportation, communication, publicutilities
Trade, wholesale and retail _ .Finance, business, repair, professionalDomestic, personal, recreation servicesOther (mining, construction, Government,
forestry, fishing)Not ascertainable
16,480 10,0C0 61.0 6,420 39.0
580* 5,590
2,6902,160
730
3.1902,6802,660
20
3S03,1701,3701,370440
4201,7901,8601,840
59010
64.856.850.963.159.7
60.950.269.669.1
54.640.0
2002,4201,320800290
2701,400810820
49010
35.243.249.136.940.3
39.143.830.430.9
45.460.0
« See p. 12 for industries included in each group.
Digitized for FRASER http://fraser.stlouisfed.org/ Federal Reserve Bank of St. Louis

TABLE 8.—Fortner industry group of women who shifted to new industry group
Industry group to which women shifted since Poarl Harbor
Percent distribution or women according to Industry group in which employedbefore Pearl Harbor
Agricul-ture
Manufacturing
Total Group Group OroupIII
Transpor-tation,
commun-ication
TradeBusiness,
profes-sional
Domesticand other
servicesMining,
ota
All Industrie (1,880,000) 6.0 8.8 3.7 12.5 6.4 2.9 26.4 13.7 24.6 2.4
AgricultureManufacturing.
Group IGroup I I . . .Group III
Transportation, communication, public utilities..Trado, wholesale and retailFinance, business, repair, professionalDomestic, personal, recreation services ---Other (mining, construction, Government, forestry, fishing)..
3.21.65.43.12.0l.S3.2
47.62.4
13.3 4.0 0.4
30.314.730.412.323.719. G8.7
17.3
8.30.24.24.85.83.06.2
20.9
21.28.1
14.23.33.67.4
9.36.4
2.21.33.11.5
4.710.52.03.7
2.43.14.08.7
0.542.529.735.929.434.6
31.026.430.9
6.318.314.89.18.7
14.220.6
11.123.2
67.430.820.927.423.327.748.332.7
12.0
0.42.0.8
4.12.04.41.69.61.2
to
Digitized for FRASER http://fraser.stlouisfed.org/ Federal Reserve Bank of St. Louis
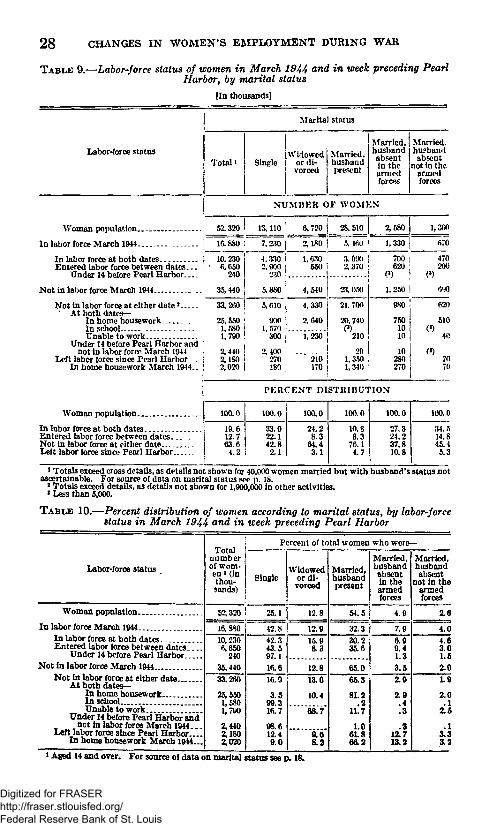
28 CHANGES IN WOMEN'S EMPLOYMENT DURING WAR
TABLE 9.—Labor-force status of women in March 1944 ond in week preceding PearlHarbor, by marital status
fin thousands]
Labor-force status
Marital status
Total i SingleWidowed
or di-vorced
Married,hushandpresent
Married,husbandabsentin thearmedforces
Married,husbandabsent
not in thearmedforces
NUMBER OF WOMEN
Woman population.
In labor force March 1944-
52,320 !
16. sso";
13,110
7t 230 i
6,720 | 28.510- ..
5, 160
2,580
7~330~|
1,360
In labor force at both datesEntered labor force between dates,.
Under 14 before Pearl Harbor..
Not in labor force March 1944..
10.2306f650
240
35,440
Not in labor force at either date *1 At both dates—In home houseworkIn schoolUnable to work
Under 14 before Pearl Harbor andnot in labor force March 1044 .
Left labor force since Pearl Harbor . jIn home housework March 1944.. \
4.3302.900
230
5.880
1,630 3.01H) |550 i 2,370 ;
4,540
33,260
25,550 '1,5801,790 !
2,440 I2.IS02,020 I
5,610 4.330
23, 050
900 J 2, 640 j1, 570 .
300 j
2,400 ,270
1,230
210170
21.700
20.740
210
201,3501,340 :
700 |620 '
(») i1,250 !
470200
mo750
1010
102S0270
(*)
620
510
7070
Woman population
In labor force at both dates. - . .Entered labor force between dates. _. .Not in labor force at either dateLeft labor force since Pearl Harbor
PERCENT DISTRIBUTION
100.0
19.612.763.64.2
100.0
33.022.142.82.1
100.0
24.28.3
64.43.1
100.0
10.88.3
76.14.7
100.0
27.324.237,810.8
100.0
34.514.845.45.3
» Totals exceed cross details, as details not shown for 40,000 women married but with husband's status notascertainable. For source of data on marital status see p. IS.3 Totals exceed details, as details not shown for 1,900,000 in other activities.3 Less than 5,000.
TABLE 10.—Percent distribution of women according to marital status, by labor-forcestatus in March 1944 and in week preceding Pearl Harbor
Labor-force status
Totalnumberof wom-en i (inthou-sands)
Percent of total women who were—
SingleWidowed
or di-vorced
Married,husbandpresent
Married,husbandabsentin thearmedforces
Married,husbandabsent
not in thearmedforces
Woman population. 52,320 i 25.1 12.8 54.5 4.9
In labor force March 1944In labor force at both dates. . .Entered labor force between dates
Under 14 before Pearl HarborNot in labor force March 1944
Not in labor force at either dateAt both dates—
In home houseworkIn schoolUnable to work . .
Under 14 before Pearl Harbor andnot in labor force March 1944..,
Left labor force since Pearl Harbor -.In home housework March 1944...
16, SSO
10, 2306,650
240
35,44033,260
25,6501,5801,790
2,4402,1802,020
42.8 12.9 32.3 7.9
42.343.597.116.6
15.98.3
30.235.6
12.8 65.0
6.09.41.33.5
16.9
3.599.316.7
98.612.49.0
13.0
10.4
"68.Y
9.68.2
65.5
81.2. 2
11.7
1.061.866.2
2.9
2.9.4. 3
12." 713.2
2.6: . . . ' : - • • -
4.04.63.01.52.01.0
2.0.1
Z&
.13.33.2
* Aged 14 and over. For source of data on marital status see p. 18.
Digitized for FRASER http://fraser.stlouisfed.org/ Federal Reserve Bank of St. Louis

APPENDIX—GENERAL TABLES 2 9
TABLE 11.—Marital status and age of women in labor force March 1944
Marital status of women in labor forceNumber of
women(in thou-sands)
Percent whose age inMarch 1944 was—
Under 20 { 20-44 45 or over
Total In labor force in March 1944.. "16,880 13.1 63.4 23.5SingleWidowed or divorced - . - . . .Married, husband presentMarried, husband absent, in armed forcesMarried, husband absent, not in armed forces
In labor force both March 1944 and before Pearl Harbor,
fifnplc.Widowed or divorccdMarried, husband presentMarried, husband absent, in armed forcesMarried, husband absent, not in armed forces..
7.2302, ISO5,4601,330670
•10,230
27.8.1
1.28.61.4
2.9
62.438.767.889.7
69.2
9.861.231.01.6
31.8
27.9
4,3301,6303,090
700470
6.1.1.4
2.8.5
Came Into lAbor force since Pearl Harbor... ! '6,650 28.6
79.338.465.895.564.5
54.6
14.661.533.71.7
35.0
16.8
SInpleWidowed or di vorccdMarried, husband presentMarried, husband absent, in armed forces..-.-.Married, husband absent; not in armed forces..
2,900550
2,370620200
60.3.22.315.33.6
37.139.770.383.272.1
2.660.127.41.5
24.2
1 Total exceeds details, as details not shown for women with husbands* status not ascertainable. Ininterpreting, note statement as to sample on p. 2, and p. 18.
TABLE 12.—Marital status and age of
Marital status of women not in labor force
Total not in labor force in March 19*4
SingleWidowed or divorcedMarried, husband present „ ,Married, husband abfent, in armed forces «..- *-Married, husband absent, not in armed forces
Not in labor force at either date
SingleWidowed or divorced *Married, husband presentMarried, husband absent in armed forces * *. *---Married, husband absent, not in armed forces.,
Left labor force since Pearl Harbor
SinjtleWidowed or divorced . . . . . . .Married, husband presentMarried, husband absent in armed forcesMarried, husband absent not in armed forces
women not in labor force
Number ofwomen(in thou-sands)
1 35,440
5,8804 540
23,050. 1.250
690
133,260
. . . . I 5.6104,330
21.700! 9S0i 620
»2,1SO
j 270| 210
1,350; 280
<70
March 1944
Percent whose age inMarch 1944 was—
Under 20
13.4
71.9.1
1.413.54.1
14.0
74.8
1.315.73.7
4.0
11.11.02.65.58.0
20-44
45.3
15.96.6
58.184.349.3
43.4
13.25.9
56.881.647.9
74.8
72,121.680.393.962.0
45 or over
41.3
12.293.240.5
2.34A5
42.6
12.094.042.02.7
48.5
21.1
16.877.417.1
.630.1
* T o t a l exceeds details, as details not shown for women with husbands' status not ascertainable. See
Digitized for FRASER http://fraser.stlouisfed.org/ Federal Reserve Bank of St. Louis