changes in the returns to education evidence from three
TRANSCRIPT

Changes in the Returns to Education
Evidence from Three Cohorts of the NLSY
Shrathinth Venkatesh
University of Wisconsin-Milwaukee
Abstract
I study the changes in the returns to education for men over time using three cohorts of
the NLS. I find an increase in the college wage premium conditional on cognitive ability and
occupation, from 35% for those born between 1941 and 1952 to 56% for those born between 1957
and 1964 followed by a fall to 41% for those born between 1980 and 1984. I also find a similar
pattern for high school graduates and those with some college. I decompose the returns to
education into those parts that are related to cognitive ability, occupation and neither cognitive
ability or occupation, and find that the portion associated with neither is the largest of the
three. However cognitive ability is responsible for a larger portion than occupational sorting. I
also decompose the changes in the returns to education between cohorts, I find that cognitive
ability and occupation play a larger part in the change in returns to education between cohorts
than the portion associated with neither. Cognitive ability is responsible for a larger part of
these changes between cohorts than occupation. I add non-cognitive abilities and decompose
the changes and find that they are not as important as cognitive abilities but are on par with
occupation at lower education levels.
1 Introduction
With the rising costs of college education in the US, the returns to that education have been
under particular scrutiny. The importance of major, college quality and the channels through which
graduation actually improves income are still not completely understood and so predictions of how
it evolves over time may not be accurate. Whether education is a signal of a persons ability or it is
a reflection of the skills and knowledge gained in the process of education or a means of developing
peer networks or a combination of the all of those is something that is not yet conclusively known,
and the importance of each of those factors might also change over time. Acemoglu (2002), for
example suggests that skill biased technical change has affected the returns to education for most
of the twentieth century but technical change was skill replacing in the nineteenth century. A
simple look at the returns to education and abilities might be warranted for the more recent past,
particularly with the recent changes in the effect of skill biased technical change that Beaudry et al.
(2016) show after 2000.
Autor et al. (2008), Goldin and Katz (2009) and Castex and Dechter (2014) among many others
have studied the returns to education in more recent decades. The central finding of this research
is an increase in the returns to education over time particularly for those at higher education levels.
Goldin and Katz (2009) shows evidence that between 1950 and 2005 the returns to college relative
to a high school graduate increased from 36.7% to 86.6%. More recently Castex and Dechter (2014)
for example find that the returns to a bachelors degree increases 14% between the 1980s and 2000s,
this increase becomes 43% when controlling for cognitive ability.
Using data from three cohorts of the National longitudinal survey, the Original Cohort(born
1941-52), the NLSY79(born 1957-64) and the NLSY97(born 1980-84), I study the returns to edu-
cation, cognitive ability and occupation for men and their changes over time. As you might expect
from the earlier previous research, I find an increase in the returns to education between the Original
Cohort(41% for college graduates) and the NLSY79(105% for college graduates). However, unlike
the literature I find that there is a fall in the returns to education for those in the NLSY97(70% for
college graduates). When controlling for cognitive ability and occupations these changes are lower
in magnitude but follow a similar pattern, an increase between the Original Cohort(35% for college
graduates) and the NLSY79(56% for college graduates) followed by a reduction for those in the
NLSY97(41% for college graduates). The returns to cognitive ability, follows a similar pattern, a
large increase between the Original Cohort(4%) and NLSY79(18%) followed by a reduction in the
NLSY97(10%).
The differences between the unconditional returns to education and the returns conditional on
cognitive ability are not insignificant, particularly for the NLSY79(47% decline for college grad-
uates) and NLSY97(42% decline for college graduates). I decompose these differences into the
portions due to cognitive ability and occupation and find that a larger portion of the difference
between the returns to education is due to cognitive ability, particularly for the returns to lower
education levels. The role of occupation increases with each education level.
1

I also look at the differences in the conditional and unconditional returns to education between
each cohort pair(The Original Cohort-NLSY79 and NLSY79-NLSY97). I decompose these changes
into the portions associated with cognitive ability and occupation and find that similar to the gen-
eral decomposition cognitive ability is responsible for a larger portion of the unconditional returns
to education(27% to 38%), though once again occupation seems to become more important as the
education level increases(11% to 29%).
Though most of the research on labour market outcomes has focused on cognitive ability and
education in the past, the importance of non-cognitive abilities in the labour market have become
increasingly studied. This interest in non-cognitive ability has been spurred by the reducing im-
portance of cognitive ability in wage determination as computers are better able to perform tasks
that used to require cognitive skill. However, there might there might be non-cognitive skills that
technology has not been able to substitute effectively yet. Deming (2017) for instance shows the
growing importance of social skills in the labour market and shows growth in jobs that require both
social skills and cognitive ability while there is a drop in the jobs requiring just cognitive skills.
The NLSY79 and NLSY97 have non-cognitive skill measures in the form of measures for the
Big-5 personality traits. I conduct the same analysis as above with controls for non-cognitive skills
for these two cohorts and find that there is an increase in the effect of non-cognitive ability on
wages between the NLSY79 and NLSY97 which is consistent with earlier research(Heckman et al.
(2006) and Deming (2017)). I find that non-cognitive ability does not have a large effect on the
returns to cognitive ability. Non-cognitive skills seem to affect the returns to high school and some
college to a similar extant as occupation(between 4% and 11% of the unconditional returns to edu-
cation), though occupation plays a bigger role for those with a college degree(occupation accounts
for roughly 17% of the unconditional returns to a college degree compared to 7% for non-cognitive
ability). When doing this for the change in the returns to education across cohorts, non-cognitive
ability seems to be more important than occupation but less important than cognitive ability for the
change in returns to some college unlike for high school graduates and college graduates. Roughly
7% of the unconditional changes in the returns to a college degree can be attributed to non-cognitive
ability, compared to 19% for occupation and 28% for cognitive ability.
2 Data and Empirical Approach
I use three cohorts of the National Longitudinal Survey (NLS) to compile data on income, ed-
ucation, cognitive ability and demographic characteristics. These three cohorts include the Young
Men’s sample of the Original Cohort of the NLS, the NLSY79 cohort and the NLSY97 cohort.
The NLS Original Cohort data includes 4 sets of surveys for cohorts born between 1941 and
1952, I use only data from the survey of the Young men that I will refer to simply as the Original
Cohort of the NLS. Respondents were between the ages of 14 and 24 at the time of the initial
survey. The 5,225 young men were surveyed beginning in 1966, and were then followed until 1981
when they were between the ages of 29 and 39.
2
The NLSY79 follows 12,686 individuals born between 1957 and 1964 and are between the ages
of 14 and 22 at the time of their first interview in 1979. The most recent wave was in 2014 when
the respondents were between the ages of 49 and 57.
The NLSY97 surveys 8,984 individuals born between 1980 and 1984 who were between 12 and
18 during their first interview in 1997. The survey is still ongoing, the latest available data is for
2015 at which point the subjects were between the ages of 30 and 36.
I only run the analyses on men in the three surveys, this roughly halves the number of individ-
uals from the NLSY79 and NLSY97. I do this as the analysis involves looking at income between
1967 and 2015, this was a period of change for the labour force participation of women, their wages
and education. These other trends that might also affect their wages in ways that might complicate
the analysis.
Respondents of all the cohorts are asked about their annual income, and I convert annual in-
comes to income at a particular age. Age specific income measures are then converted to 2012
dollars, and mean annual income1 earned between the ages of 25 and 35 is calculated and used
as the primary dependent variable. Observations where an individual was enrolled in school are
excluded from the mean income calculation, but years in which they reported zero income while
not enrolled in school are included.
The 25-35 age range was chosen to maximize the number of observations, while still observ-
ing respondents from the three data sets at the same ages, thus allowing for direct comparability
across cohorts. None of the results presented below are sensitive to reasonable alternative age
ranges. Given the cohorts of respondents from each survey and the use of the 25-35 age range,
wages for individuals from the Original Cohort are observed between 1967 and 1981, individuals
from the NLSY79 are observed between 1982 and 1998, individuals from the NLSY97 are observed
between 2005 and 2015.
Educational attainment for each individual is based on reported highest education level between
the ages of 18 and 25. For individuals with no reported degree, highest grade completed was used
to fill in the gaps. Education dummies are created for those with no high school diploma, those
with only a high school diploma, those with some college or an associates degree and those who are
college graduates.
Cognitive skill measures are also available in all three data sets, but the exact measures vary
by sample. Specifically, the Original Cohorts contain a variety of standardized tests, which are
referred to as “IQ test scores” in NLS documentation, while the NLSY79 and the NLSY97 have
AFQT scores. The standardized test scores used to measure “IQ” for the Original Cohorts were
collected by surveying the high schools of the respondents, and each high school administered dif-
ferent standardized tests2 and reported the scores in different ways. Kohen (1973) describes how
1This includes income from wages, income from farms, income from businesses and income from other sources,most of these are available for every year used in the data, some additional sources of income such as from rent, stockand interest are included for the 97 as they are included in the other sources of income for the earlier cohorts. Somerespondents only report income in a range, in which case the mean of the two extreme vales for each category is used.
2The “IQ” tests included Otis/Beta/Gamma and California Test of Maturity which make up over half of thetests observed in our sample. Henmon-Nelson Test, Preliminary & Scholastic Aptitude Tests, Lorge-Thorndike
3
the NLS administrators rescale the various scores so that they can be pooled and are comparable
across tests. I utilize all available IQ scores, except for those imputed from GPA. The AFQT scores
in the NLSY79 and NLSY97 have been adjusted to account for type of test and age at testing using
the procedures suggested by Altonji et al. (2012) as used in Castex and Dechter (2014), and all test
scores are scaled to have a mean of zero and a standard deviation of one.
I also utilize data on occupations in the three samples. Specifically, I use seven broad occupa-
tional classifications from Census occupation codes that are comparable across the utilized cohorts
and result in minimal observation loss. The utilized occupation categories are: 1) Professional,
technical and kindred workers, 2) Managers, officials and proprietors, 3) Clerical and kindred, 4)
Sales workers, 5) Service workers, 6) Farm workers, and 7) Labourers, Craftsmen, operatives and
kindred workers.
Finally, I construct variables measuring demographic characteristics for use as controls. These
include birth cohort, race (White, African American or Other), the fraction of observations occur-
ring between ages 25 and 35 when the individual resided in the South3 and in an MSA, the ages
at which income was observed, and the total number of annual observations used to construct the
income measure. All of the estimates reported below apply sampling weights4, although I demon-
strate below that none of the findings are substantively changed if sampling weights are omitted. 5
The final sample looks at 2,517 men from the NLS Original Cohort, 4,638 men from the NLSY79
and 2,517 men from the NLSY97. Table 1 reports means of the variables used in the analysis. There
is a reduction in average income over this period between each cohort. The reduction in average
years of education followed by an increase is also reflected in the dummies for educational attain-
ment6. The means for the geographical control variables are for living in the south and residence
in an MSA, they are based on the proportion for each individual between the ages of 25 and 35,
both see an increase over time. The occupation measures created for each individual occupation
category are the proportion of observations between 25 and 35 the individual was employed in that
particular occupation category.
I estimate variants of the following earnings equation in each of the three samples described
above:
ln(income) = β0 + β1EDUi + β2Cog.Ab.i + β3joccji + βkXi + εi (1)
Intelligence Test, School and College Ability Test, Iowa Test of Educational Development, Differential Aptitude Test,Test of Educational Ability, Primary Mental Ability Test, American College Testing Program and National MeritScholarship Qualifying Test make up the rest of the observed tests with the last 5 mentioned making up less thanten percent in the sample.
3Only a distinction between the Southern and non-Southern states are available when describing the region ofresidence for those in the Original Cohort of the NLSY.
4I use https://www.nlsinfo.org/weights for custom weights covering all survey years for the NLSY79 and NLSY97,for the Original Cohort custom weights are unavailable so I use weights from the first year of the survey.
5Appendix Table A2-A46The differences in the education proportions across the three cohorts are due to the importance of number of
years of education completed in determining highest level of education in comparison with the other two cohorts,using number of years of education across all three cohorts results in the education levels being more similar. Thelevels in all three years are similar to levels in the same cohorts of the ACS/Census Data.
4
where income is the average annual income of the years the individual was not enrolled in school
between the ages of 25 and 35, EDU is a vector of dummy variables for each level of education
(high school, some college, college and beyond), Cog.Ab. is the cognitive ability measure, and X is
a vector of other controls including birth cohort, race, Southern residence, residence in an MSA,
the ages at which income was observed, and the total number of income observations.
I first report the results of estimating this specification in each of the three samples, both with
and without the covariates measuring cognitive ability and occupation. To better understand the
nature of changes in the wage structure over time, I also estimate versions of the above equation
that include interactions between the independent variables of interest and cohort indicators, again
with and without the cognitive ability and occupation controls, and use the method suggested by
Gelbach (2016) to decompose the part played by cognitive ability and occupation in determining
the returns to education and the changes in returns to education.
3 Results
3.1 The change in the returns to education
In Table 2 I report the results of estimating variations of equation 1 for all three cohorts sep-
arately The first three columns present models that do not include cognitive skills or occupation
controls, while cognitive skills and occupation controls are included in the last three.
Table 2 shows an increase in the returns to education between the Original Cohorts and the
NLSY79, and then a fall between the NLSY79 and the NLSY97. For instance, in the Original
Cohort, college graduates earned 41% more than individuals who had not completed high school.
This college earnings premium increased to 105% in the NLSY79, before declining to 70% in the
NLSY97. Individuals with only some college in the Original Cohort receive wages that are 28%
higher than those who have not graduated high school, this rises 86% for those in the NLSY79
and drops down to 49% for those in the NLSY97. Similarly men in the Original Cohort who have
graduated high school earn 12% more than those without a high school diploma, this premium
jumps to 61% for those in the NLSY79 and drops to 31% for those in the NLSY97.
Columns 4-6 of Table 2 report results when controls for cognitive ability and occupation are
added to the specification 7. The returns to education conditional on cognitive ability and oc-
cupation are generally lower than the unconditional returns, but follow the same pattern as the
unconditional returns, i.e. an increase between the Original Cohort and the NLSY79 followed by a
fall between the NLSY79 and the NLSY97. The returns to college graduation for example is 35%
in the Original Cohort which increases to 56% for those in the NLSY79 followed by a reduction
to 41% for those in the NLSY97. The returns to some college are slightly lower at 25% for the
Original Cohort, 50% for the NLSY79 and 32% for the NLSY97. The returns to a high school
diploma is much lower in the Original Cohorts at 12% which sees a large jump to 39% for those in
the NLSY79 and a reduction to 20% for those in the NLSY97.
7The omitted occupation category is Labourers, Craftsmen, Operatives and Kindred Workers
5

The returns to cognitive ability follow a similar pattern across cohorts: There is a return of
4% for each standard deviation increase in cognitive ability for those in the Original Cohort which
rises to 18% for those in the NLSY79, followed by a reduction between the NLSY79 and NLSY97
from 18% to 10% for each standard deviation increase in cognitive ability.
Occupational sorting, like education and cognitive ability, has particularly large effects on in-
come for those in the NLSY79, with smaller effects for those in the Original Cohort and the NLSY97
for most occupation categories. Most notable are large spikes between the Original Cohorts and
the NLSY79 in the wage premium associated with being in professional or managerial occupations,
which then fall again in the NLSY97, while the opposite pattern is observed for workers in farm
and service occupations. Clerical workers see a slight decline in wages and then plateau.
The observed increases in the returns to education (both unconditional and conditional) for
cohorts born in the 1940s versus those in the late 1950s and early 1960s is consistent with large
bodies of existing research (e.g. Katz and Murphy (1992), Acemoglu (2002), Beaudry and Green
(2005), Autor et al. (2003), Autor et al. (2006)), the observed declines in the returns to education
in more recent cohorts may seem surprising. For example, contrary to Table 2, Castex and Dechter
(2014) find significant increases in returns to education education between the cohorts particularly
when controlling for cognitive ability. The most important difference is the additional years of data
available and the change in the age range under study from 18-28 to 25-35. There are also some
differences in the measures used in this paper compared to Castex and Dechter (2014), they use
individual year observations of hourly pay in their analysis as opposed to the the average annual
income of each individual8. They also limit their analysis to only a portion of the sample with an
hourly pay between $3 and $100, who work more than 20 hours a week and have more than 5 years
of education which this paper does not do.
Since a large part of the literature shows increases in the returns to education inconsistent
with my findings particularly the unconditional returns, I also try to run similar regressions using
ACS/Census data9. This should show me if this pattern is specific to my sample of the NLS data.
The ACS/Census data is also slightly inconsistent with earlier research. Table 3 shows there is
a rise in the returns to education between the cohorts included in the Original Cohort(78% for
college graduates) and the NLSY79(123% for college graduates) groups. This data also shows a
slight reduction in returns to both high school and some college between the cohorts included in
the NLSY79(63% for high school graduates) and NLSY97(42% for high school graduates) groups.
The returns to college do not change much in this period(123% for college graduates in the NLSY79
to 125% for college graduates in the NLSY97). These results could point toward there not being
a simple increase in returns to education across the board between cohorts of the NLSY79 and
NLSY97 as shown by earlier research.
8Running the regressions with average hourly pay between the ages of 25 and 35 instead does result in a similarreduction in returns to education between the NLSY79 and NLSY97
9The differentiation by cohort is done by sorting individuals using the birth years that correspond to the threeNLSY cohorts. Individuals are only included if they were between the ages of 25 and 35 when observed. All othercovariates have been matched to their NLSY counterparts as closely as possible.
6

These declines might however be consistent with the arguments in Beaudry et al. (2016) who
show a decline in the demand for cognitive tasks after 2000 resulting in a different market for those
after. They suggest a college degree might be a way to open doors to higher paying jobs but also a
way to set yourself above less educated workers for jobs that they might otherwise be qualified to
perform. Ashworth et al. (2017) find a reduction in returns to a college degree between the NLSY79
and NLSY97 as well, though they split the NLSY79 cohort to two groups to show a similar hump
shape in the returns to college over time. Valletta (2017) use CPS data to show a decline in the
wage premium for college graduates after 2000 before a flattening out to 2000 levels between 2010
and 2015.
Overall, the results in Table 2 indicate that the wage structure shifted significantly across the
three sets of studied cohorts. In addition to dramatic changes in the returns to education, there
were large, simultaneous shifts in the returns to cognitive ability and the wage effects of occupa-
tional sorting. Also while not directly addressed by the regressions from Table 2, there are changes
over time in the association of education with cognitive ability and occupation(Appendix Table
A1). All of these factors could contribute to the observed changes in the returns to education, and
the next section systematically investigates the nature of these changes in the wage structure.
3.2 Decomposing the Returns to Education
To better understand changes in the returns to education over time I decompose the differ-
ences between the coefficients for equation 1 with and without cognitive ability and occupation
controls. To accurately decompose the change from the addition of two different sets of variables
simultaneously I use the method suggested by Gelbach (2016). This technique uses the omitted
variable bias formula to allow addition of variables in any order. In this case it involves running
the regression with and without cognitive ability and occupation. The difference in the returns to
education between the two specifications can then be split apart into the portion that was due to
occupation and the portion due to cognitive ability. Using the basic properties of the regression
and the correlation between the covariates and the coefficient of interest, this method suggests a
way to assign the correct proportion of the change to the variable responsible for it.
In the case of college education and cognitive ability for example, the reduction in the returns to
college education from including cognitive ability in the regression is the product of the coefficient
on the college education dummy from a regression on cognitive ability and the coefficient on the
college education dummy from the full regression with cognitive ability and occupation included. 10
3.2.1 Within Cohort Decompositions
I decompose the returns to education within each of the studied cohorts, and the results are
shown in Table 4. The first row of each section of Table 4 simply reports the change in the returns
10Gelbach (2016) considers a regression Y = β0+β1X+β2Z+ε where the regression initially omits Z, the omittedvariable bias for β1 is δ = (X ′X)X ′Zβ̂2
7

to each level of educational attainment that occurred due to conditioning on cognitive ability and
occupation from Table 2. For example, within the NLSY79 the coefficient on the college graduate
indicator fell from 1.054 when only baseline controls were included, to .558 after conditioning on
cognitive ability and occupation, a reduction of .496, and this difference is reported in Row 1 of
section c in Table 4. The second and third rows of each section then use the Gelbach technique
described above to decompose these reductions into portions attributable to cognitive ability(0.299
for college graduates in the NLSY79) and occupational sorting (0.197 for college graduates in the
NLSY79).
An interesting pattern that emerges in Table 4 is that as the education level increases, occupa-
tional sorting seems to play a larger part for those in the NLSY79 and NLSY97 with the opposite
being true for the Original Cohort. Cognitive ability, being responsible for more than half of the
change in returns, seems to be the more important of the the two factors in all three cohorts at
every education level.
For instance, focusing on the returns to being a college graduate, in the Original Cohort most of
the difference between the conditional and unconditional change in returns(0.0537) is attributable to
cognitive ability(0.0516), occupational sorting seems to explain a relatively small portion(0.00213).
This changes significantly for college graduates in the NLSY79 and NLSY97, roughly sixty percent
of the change in returns can be explained by cognitive ability and the rest by occupation. This
similarity between the NLSY79 and NLSY97 seem to only be true in proportion of the change
explained, the magnitudes of these changes are higher for the NLSY79. For the Original Cohort
between 13% and 15% of the unconditional returns to education are associated with cognitive abil-
ity as opposed to between 1% and 10% is associated with occupation. Between 21% and 28% of
the unconditional returns to education in the NLSY79 and NLSY97 are associated with cognitive
ability and between 6% and 19% with occupation.
3.2.2 Decomposing Changes in the Returns to Education across Cohorts
Distinct from the question of what factors influence the returns to education within the studied
cohorts is the question of what explains the changes in educational premiums between the studied
cohorts. Tables 5 and 6 present results that help to better understand the determinants of the
changing returns to education across the three sets of cohorts.
Table 5 begins by estimating models that pool two of the cohorts together (first the Original
Cohort and the NLSY79, and then the NLSY79 and the NLSY97), and include interactions between
the education variables and cohort indicators. The results are reported in Columns 1 and 4 of Table
5, and the coefficients on the interactions are conceptually and numerically similar to comparing
the returns to education across cohorts, as in Table 2.
Columns 2 and 5 of Table 5 then add the covariates measuring cognitive ability and occupation
as well their interaction with the cohort indicator, and Columns 3 and 6 report the resultant
reduction in the coefficients on the education-cohort interactions. These reductions represent the
portion of the change in the returns to education attributable to the additional covariates. Finally,
8

Table 6 decomposes the portion of the returns to education that are attributable to cognitive ability
and occupational sorting, respectively. For example if we consider the difference in the returns to
college between the NLSY79 and NLSY97, the unconditional change in returns from column 4 of
Table 5 is -0.350, when cognitive ability and occupation are included the change in returns drops
to -0.150 in column 5. The difference between the conditional and unconditional returns, -0.200 is
presented in column 6. This difference is decomposed in Table 6, in this case column 6, the -0.200
is decomposed into the -0.130 associated with cognitive ability in the second row and the -0.0705
associated with occupation in row 3.
The results in Table 6 reveal that the underlying causes of patterns in the returns to schooling
don’t differ much by the level of educational attainment. Specifically, of the .210 log point change in
the returns to high school completion that occurred between the Original Cohorts and the NLSY79,
.0.148 log points can be attributed to cognitive ability. Similarly, of the .110 log point decline in
the returns to high school graduation that occurred between the NLSY79 and the NLSY97, .0782
log points can be attributed to cognitive ability. Both the .436 log point increase in the returns
to college graduation between the Original Cohorts and the NLSY79 and the subsequent .200 log
point decline between the NLSY79 and the NLSY97 are due mostly to cognitive ability as well,
though occupation plays a relatively larger part compared to its role in the changes in returns to
a high school diploma.
The portion of the change in the unconditional returns to education associated with cognitive
ability and occupation is larger than the portion associated with neither for those with a college
degree and those with some college. As mentioned earlier cognitive ability is responsible for a large
portion of the change for both cohorts. This might be due to the special circumstances for those in
the NLSY79, high returns to cognitive ability, and the strong association between cognitive ability
and education in this period.
3.3 Non-cognitive abilities
Non-cognitive skills have been put forward as a possible explanation for the returns to college
for several reasons. For instance it has been suggested that the relative cost of attending and com-
pleting college for those with high non-cognitive ability is lower, therefore they select themselves
into higher education levels and the returns to education might be a reflection of the returns to
these non-cognitive skills. There has been some recent research on the returns to non-cognitive
skills in the labour market, pointing out that even among cognitive task intensive occupations,
those that have higher needs for non-cognitive skills have been growing faster. Considering its
possible importance I look at change in returns to Non-cognitive abilities over time and how they
effect the returns to education.
The NLSY79 and NLSY97 also have some non-cognitive skill measures that they record during
the surveys11. I use measures of the Big 5 personality traits, extraversion, agreeableness, conscien-
11The personality traits are measured at different point of time in the two surveys, however meta- analysis ofpersonality traits such as Roberts et al. (2006) seem to suggest stability in personality traits for the most part at
9

tiousness, neuroticism and openness. The individuals are asked two questions for each of the five
measures, the standardised mean of their responses on a 1-8 scale is used in the analysis.
The first two columns of Table 7 shows the returns to education, without occupation and
cognitive ability controls, the third and fourth columns include controls for cognitive ability and
occupation and the last two columns add non-cognitive ability controls along with those for cog-
nitive ability and occupation. The difference in the returns to education between the specification
in the first two columns and the other columns is stark as noticed in Table 2 as well. However the
addition of cognitive ability does not seem to significantly change the returns to education. For
example the returns to college in the NLSY79 drop from 55% to 52% when non-cognitive ability
is added, as opposed to the 100% returns suggested by the partial specification. Similarly in the
NLSY97 the addition of non-cognitive ability reduces the returns to a college degree from 44%
to 38%, a larger drop than in the NLSY79 but still much smaller than the drop from 70% that
results from the addition of cognitive ability and occupation. The returns to cognitive skills in both
cohorts is also very similar after controlling for non-cognitive skills, the returns in the NLSY79 sees
a slight reduction from 16% to 15% while in the NLSY97 there is a slight increase from 9% to 10%.
The last two columns of Table 7 also show the returns to the Big 5 personality traits. There
is an increase in the returns a standard deviation increase in extraversion from 6% to 9% between
the NLSY79 and the NLSY97, considering this is a common proxy for social skill this increase
seems likely given previous literature on the increase in returns to social skill over time(Deming,
2017). Agreeableness and openness seem to be detrimental to earnings in the NLSY97 unlike in
the NLSY79. There is also a fall in the returns to conscientiousness, while neuroticism or mental
stability seems to have small but stable effect on wages.
Table 8 decomposes the within cohort changes in education into the portions explained by cog-
nitive ability, occupation and non-cognitive ability. The first three columns however give results
of the decomposition for just cognitive ability and occupation for the sub-sample that has non-
cognitive data for comparison. For those with a high school diploma or some college non-cognitive
ability seems to be as important as occupation in explaining the returns to education, cognitive
ability still seems to be the most important factor. However for those with a college degree both
cognitive ability and occupation seem to be more important than non-cognitive ability for those
in both cohorts. This is mostly due to the increased importance of occupation for those with a
college degree as noted in Table 4. For those in the NLSY97 for instance of the 0.320 log point
change, 0.161 log points is due to cognitive ability, 0.114 due to occupation and only 0.045 due to
non-cognitive ability as opposed to when non-cognitive skills are not included and the 0.265 log
point change in total returns is decomposed into 0.144 associated with cognitive ability and 0.121
associated with occupation.
Similar to Table 6, Table 9 decomposes the differences in the changes in returns to education
between the NLSY79 and NLSY97 when controlling for cognitive ability, occupation and Non-
cognitive ability. The portion of the difference explained by occupation remains fairly similar when
these age ranges.
10

non-cognitive ability is included compared to when it is not. However the portion that is explained
by cognitive ability does see a small drop as the differences in changes in returns themselves do
not see a large change. The importance of non-cognitive ability in explaining these changes over
time seem seems greatest in the case of those with more education than a high school diploma
who do not have atleast a bachelors degree, where of the 0.184 log point change 0.095 is due to
cognitive ability, 0.053 due to non-cognitive ability and 0.036 due to occupation as opposed to when
cognitive ability is not included and of the 0.169 log point change 0.122 is associated with cognitive
ability and 0.0362 with cognitive ability. The inclusion of non-cognitive ability seems to reduce the
importance of cognitive ability in the change in the returns to education between the cohorts.
4 Alternative specifications
I also run the analyses using other specifications to test if the results are unique to my sample
and variable choice.
I use hourly pay measures as used in Castex and Dechter (2014) though without limiting sample
by number of hours worked, for the same age range as earlier as the main analysis. As seen in
Table 10, the patterns seen earlier between the NLSY79 and NLSY97 in Table 2 are also found in
these results, a reduction in the returns over that time period. However the results for the Orig-
inal Cohort are different, this might be because of the quality of the hourly pay data which had
to be converted from monthly, weekly, daily and annual pay when hourly pay was not reported.
Table 11 shows the decomposition of the returns to education, they are also slightly different in the
case of hourly pay, the importance of occupation in explaining these changes in returns is much
greater than that of cognitive ability unlike in the case of annual pay for all education levels. I
also report the decomposition of the differences in changes to the returns to education between
cohorts in Table 12. The results in this table are different from the main results in several ways, for
example the magnitude of the difference in the change in returns to education is the same for both
college graduates and those with some college, and nearly all of the difference can be attributed to
cognitive ability in both cases.
I also run the analyses for mean income calculated over a wider age range, between 21 and
35 and an age range 25 to 30 so that everyone in the NLSY97 is recorded at the oldest possibly
available age. For the sample considering everyone from 21 to 35(Table 13), though the magnitudes
of the returns are lower the larger patterns in the changes in the returns to education and cognitive
ability observed in the main analysis hold for this sample too. The lower magnitudes of the returns
to education might be expected as incomes are measured at earlier ages than previously and edu-
cation is still based on education at age 25. The results of decomposing the returns are once again
very similar to the larger sample(Table 14). The importance of occupation however seems to have
diminished slightly when looking at the decomposition of the changes between cohorts(Table 15).
For the analysis run for those between 25 and 30 however all the results are much more similar to
those in the main analysis, which may not be surprising since we are considering a sub-sample of
11

those observations(Table 16-18).
Tables 19 to 22 report the results of the main regression without any controls to test if the
results are because of my particular set of controls and I find similar results to those previously
described. There is an increase in the returns to education followed by a fall, however when control-
ling for cognitive ability and occupation the fall between the NLSY79 and NLSY97 is considerably
smaller. The decompositions are similar to the previous results, though the relative importance of
cognitive ability in all the decompositions is higher.
The measure of cognitive ability in the Original Cohort is different to the other two cohorts.
Though there is significant correlation between the two measures, they do work on different scales
and there have been suggestions that the AFQT measures some skills that most IQ tests do
not(Borghans et al., 2016). I therefore create indicators for the quartile groups of each cogni-
tive skill by cohort. I replace the standard normal cognitive skill measure with indicators for each
of the cohorts. The conditional returns to education don’t seem to be very different from those
obtained by using a standardised cognitive ability measure. The returns to being in each quartile
increases with quartile as might be expected and there is an increase in returns between the Origi-
nal Cohort and NLSY79 followed by a fall in the NLSY97 as reported in Table 22. There are some
differences when the returns to education for each cohort are decomposed in Table 23, cognitive
ability seems to play a relatively smaller role here. However when returning to the decomposition
of the changes between cohorts in Table 24 the results look similar to Table 5.
5 Conclusion
While some studies have found steady increases in the returns to education in the past half
century, I show that while there might have been growth in the returns to education for those
born between 1957 and 1964 relative to those born between 1941 and 1952, they do not seem to
continue to rise for those bor between 1980 and 1984. This fall in the returns after the NLSY79
seems to hold true for cognitive ability as well after it saw a large rise in returns compared to the
seventies. This fall in the returns to education might be due to increased supply of skilled labour,
though Goldin and Katz (2009) seem to suggest relatively small changes in the skilled labour sup-
ply. Another possible explanation an be found Beaudry et al. (2016), they suggest skill biased
technical change might have an initial phase where the market would require cognitive ability in
a large scale, but as new technology is developed the need for this cognitive ability becomes less
strong as it is replaced by technology, this period would therefore be followed by lower demand and
returns for skills that can be replaced. They also suggest the due to a reduction in demand, you
could expect“de-skilling” where you have “high-skilled workers pushing low-skilled workers even
further down the occupational ladder”. The demand for cognitive skills in the nineties, followed
by a reduction in demand for cognitive tasks(Beaudry et al., 2016) which is also reflected in the
returns as shown above might be indicative of this being true. That the returns to education follow
the same pattern, even when controlling for cognitive ability might reflect the fact that the skills
12

acquired or indicated by education might not be in as much demand. Though some literature
suggests that portions of the returns to education might be attributable to non-cognitive ability,
I find they are not related to the measures available in the data I use. However unlike cognitive
ability and education, the influence of non-cognitive ability seems to have increased for those born
between 1980 and 1984.
I decompose the returns to education into the portions attributable to cognitive ability, occu-
pation and neither. I find that a significant portion of the returns are due to cognitive ability and
occupation, though occupation has less of an impact than cognitive ability it becomes important
at higher education levels. In most cases the portion attributable to neither cognitive ability and
occupation is the largest of the three suggesting that others factors besides cognitive ability and
occupation play a large part in the returns to education. Besides the returns to education in each
cohort I try to find the change in the returns between each of the cohorts and decompose those
into the portions attributable to cognitive ability and occupation as well. Once again the largest
portion of the change in returns between cohorts cannot be attributed to either cognitive ability or
occupation. But for the portions than can, cognitive ability still seems to have played the largest
part. This might suggest that that the decline in the returns to education might not have been
entirely responsible for the drop in the unconditional returns to education. There seem to be other
factors associated with education whose relative value in the labour market might be declining as
well.
The NLSY79 and NLSY97 having some measures of non-cognitive skills allows me to find their
returns and their changes over times. I find an increase in its importance in determining wages in
general, particularly Extraversion, often used as a proxy for social skills, though there is a reduction
in the effect of Conscientiousness. They seem to not play a large role in determining the returns to
education, particularly as education level increases. Interestingly this holds when looking at how
they effect the changes in returns to education across cohorts as well. Cognitive ability still plays
a much bigger part.
These results are robust for multiple other specifications including different age ranges, different
income measures, different weighting, etc. However when split into samples based on race the fall
in the returns to college between the NLSY79 and NLSY97 seems to be flat for the sample of only
white individuals when controlling for cognitive ability, whereas there is a large drop for non-white
individuals. This race based difference might be related to differing returns to cognitive ability
by race across cohorts. Further study into the exact nature of these differences and whether they
represent a widening or a narrowing of differences in returns by race. Study into the effect of these
changes on the wages of women might be of interest as well, these differences in the returns to
education might also have implications for the gender wage gap.
13

References
Acemoglu, D. (2002). Technical change, inequality, and the labor market. Journal of economic
literature 40 (1), 7–72.
Acemoglu, D. and D. Autor (2011). Skills, tasks and technologies: Implications for employment
and earnings. In Handbook of labor economics, Volume 4, pp. 1043–1171. Elsevier.
Almlund, M., A. L. Duckworth, J. Heckman, and T. Kautz (2011). Personality psychology and
economics. In Handbook of the Economics of Education, Volume 4, pp. 1–181. Elsevier.
Altonji, J. G., P. Bharadwaj, and F. Lange (2009). Constructing afqt scores that are comparable
across the nlsy79 and the nlsy97.
Altonji, J. G., P. Bharadwaj, and F. Lange (2012). Changes in the characteristics of american
youth: Implications for adult outcomes. Journal of Labor Economics 30 (4), 783–828.
Altonji, J. G., L. B. Kahn, and J. D. Speer (2016). Cashier or consultant? entry labor market
conditions, field of study, and career success. Journal of Labor Economics 34 (S1), S361–S401.
Ashworth, J., V. J. Hotz, A. Maurel, and T. Ransom (2017). Changes across cohorts in wage
returns to schooling and early work experiences. Technical report, National Bureau of Economic
Research.
Autor, D. H. and D. Dorn (2013). The growth of low-skill service jobs and the polarization of the
us labor market. American Economic Review 103 (5), 1553–97.
Autor, D. H. and M. J. Handel (2013). Putting tasks to the test: Human capital, job tasks, and
wages. Journal of Labor Economics 31 (S1), S59–S96.
Autor, D. H., L. F. Katz, and M. S. Kearney (2006). The polarization of the us labor market.
American economic review 96 (2), 189–194.
Autor, D. H., L. F. Katz, and M. S. Kearney (2008). Trends in us wage inequality: Revising the
revisionists. The Review of economics and statistics 90 (2), 300–323.
Autor, D. H., F. Levy, and R. J. Murnane (2003). The skill content of recent technological change:
An empirical exploration. The Quarterly journal of economics 118 (4), 1279–1333.
Beaudry, P. and D. A. Green (2005). Changes in us wages, 1976–2000: ongoing skill bias or major
technological change? Journal of Labor Economics 23 (3), 609–648.
Beaudry, P., D. A. Green, and B. M. Sand (2014). The declining fortunes of the young since 2000.
American Economic Review 104 (5), 381–86.
Beaudry, P., D. A. Green, and B. M. Sand (2016). The great reversal in the demand for skill and
cognitive tasks. Journal of Labor Economics 34 (S1), S199–S247.
14

Borghans, L., B. H. Golsteyn, J. J. Heckman, and J. E. Humphries (2016). What grades and
achievement tests measure. Proceedings of the National Academy of Sciences 113 (47), 13354–
13359.
Castex, G. and E. K. Dechter (2014). The changing roles of education and ability in wage deter-
mination. Journal of Labor Economics 32 (4), 685–710.
Chaparro, J. (2016). Occupational Choice and Returns to Skills: evidence from the NLSY79 and
O* Net. Ph. D. thesis, PhD Dissertation, Department of Applied Economics. University of
Minnesota.
Chevalier, A., C. Harmon, I. Walker, and Y. Zhu (2004). Does education raise productivity, or just
reflect it? The Economic Journal 114 (499).
Deming, D. J. (2017). The growing importance of social skills in the labor market. The Quarterly
Journal of Economics 132 (4), 1593–1640.
Gelbach, J. B. (2016). When do covariates matter? and which ones, and how much? Journal of
Labor Economics 34 (2), 509–543.
Goldin, C. and L. F. Katz (2007). The race between education and technology: The evolution of
us educational wage differentials, 1890 to 2005. Technical report, National Bureau of Economic
Research.
Goldin, C. D. and L. F. Katz (2009). The race between education and technology. Harvard University
Press.
Heckman, J. and E. Vytlacil (2001). Identifying the role of cognitive ability in explaining the level
of and change in the return to schooling. Review of Economics and Statistics 83 (1), 1–12.
Heckman, J. J., J. Stixrud, and S. Urzua (2006). The effects of cognitive and noncognitive abilities
on labor market outcomes and social behavior. Journal of Labor economics 24 (3), 411–482.
John, O. P. and S. Srivastava (1999). The big five trait taxonomy: History, measurement, and
theoretical perspectives. Handbook of personality: Theory and research 2 (1999), 102–138.
Katz, L. F. and K. M. Murphy (1992). Changes in relative wages, 1963–1987: supply and demand
factors. The quarterly journal of economics 107 (1), 35–78.
Kohen, A. I. (1973). Determinants of early labor market success among young men: race, ability,
quantity and quality of schooling. Ph. D. thesis, The Ohio State University.
Lang, K. and M. Manove (2011). Education and labor market discrimination. American Economic
Review 101 (4), 1467–96.
Lindbeck, A. and D. J. Snower (2000). Multitask learning and the reorganization of work: From
tayloristic to holistic organization. Journal of labor economics 18 (3), 353–376.
15

Murnane, R. J., J. B. Willett, and F. Levy (1995). The growing importance of cognitive skills in
wage determination. Technical report, National Bureau of Economic Research.
Roberts, B. W., K. E. Walton, and W. Viechtbauer (2006). Patterns of mean-level change in
personality traits across the life course: a meta-analysis of longitudinal studies. Psychological
bulletin 132 (1), 1.
Valletta, R. G. (2017). Recent flattening in the higher education wage premium: Polarization, skill
downgrading, or both? In Education, skills, and technical change: Implications for future US
GDP growth. University of Chicago Press.
16

Tables1
Table 1: Descriptive Statistics
(1) (2) (3)Original NLSY79 NLSY97Cohort
Income $53946 $46818 $43899
Years of Education 13.68 12.99 13.61
High School 0.35 0.56 0.59
Some College 0.22 0.08 0.06
College Degree 0.34 0.21 0.26
Cognitive ability 0.28 0.00 0.08
Race:Black 0.06 0.14 0.14
Race:Other 0.01 0.02 0.11
South 0.28 0.33 0.36
MSA 0.75 0.81 0.95
OccupationProfessional, Technical 0.24 0.16 0.18& Kindred
Managers, Officials 0.16 0.14 0.13& Proprietors
Clerical & kindred 0.07 0.07 0.09
Sales Workers 0.07 0.05 0.1
Service Workers 0.05 0.1 0.15
Farm Workers 0.03 0.02 0.01
Labourers, Craftsmen 0.39 0.46 0.34& Operatives
N 2517 4638 2517
1Standard errors in parentheses
* p < 0.05, ** p < 0.01, *** p < 0.001
17

Table 2: Returns to education and cognitive ability across cohorts for men.
Partial specification Full SpecificationOriginal NLSY79 NLSY97 Original NLSY79 NLSY97Cohort Cohort
High School 0.127 0.612*** 0.357*** 0.114 0.368*** 0.217***(0.0837) (0.0702) (0.0585) (0.0813) (0.0726) (0.0572)
Some College 0.321*** 0.892*** 0.571*** 0.284** 0.488*** 0.346***(0.0847) (0.0861) (0.0760) (0.105) (0.0912) (0.0771)
College Graduate 0.455*** 1.085*** 0.791*** 0.376** 0.510*** 0.389***(0.0837) (0.0736) (0.0611) (0.115) (0.0859) (0.0681)
Cognitive ability 0.0360 0.197*** 0.128***(0.0239) (0.0310) (0.0183)
Professional, Technical 0.0502 0.313*** 0.128*& Kindred (0.0866) (0.0594) (0.0545)
Managers, Officials 0.0880 0.697*** 0.409***& Proprietors (0.140) (0.0698) (0.0563)
Clerical & Kindred -0.304 -0.269* -0.323***(0.161) (0.126) (0.0612)
Sales Workers -0.0818 0.119 0.00559(0.207) (0.203) (0.0626)
Service Workers -0.0900 -0.577*** -0.342***(0.0904) (0.130) (0.0544)
Farm Workers -0.347*** -0.387* 0.106(0.0927) (0.165) (0.167)
N 2318 4578 2296 2318 4578 2296
Table 3: Returns to education across cohorts for men in the ACS and Census.
Original NLSY79 NLSY97Cohort
High School 0.464*** 0.626*** 0.422***(0.007) (0.010) (0.012)
Some College 0.570*** 0.891*** 0.814***(0.008) (0.010) (0.012)
College Graduate 0.786*** 1.226*** 1.254***(0.007) (0.010) (0.011)
N 536,996 689,246 548,869
18

Table 4: Decomposing the returns to education due to cognitive ability and occupation.
(1) (2) (3)Original NLSY79 NLSY97Cohort
a) High SchoolTotal Change in returns 0.0133 0.244*** 0.140***
(0.0184) (0.0235) (0.0209)
Change due to cognitive ability 0.0188 0.181*** 0.106***(0.0137) (0.0212) (0.0157)
Change due to occupation -0.00548 0.0622*** 0.0334*(0.0138) (0.0138) (0.0143)
b) Some CollegeTotal Change in returns 0.0370 0.404*** 0.226***
(0.0377) (0.0369) (0.0304)
Change due to cognitive ability 0.0370 0.266*** 0.130***(0.0268) (0.0313) (0.0202)
Change due to occupation -0.0000825 0.139*** 0.0959***(0.0302) (0.0264) (0.0245)
c) College degreeTotal Change in returns 0.0799 0.576*** 0.402***
(0.0565) (0.0438) (0.0379)
Change due to cognitive ability 0.0504 0.327*** 0.215***(0.0365) (0.0372) (0.0288)
Change due to occupation 0.0294 0.249*** 0.187***(0.0497) (0.0360) (0.0305)
N 2318 4578 2296
19

Table 5: The change in returns to education and cognitive ability across cohorts.
Original cohort - NLSY79 NLSY97 - NLSY79Partial Full Difference Partial Full Difference
Specification Specification Specification Specification
High School 0.120 0.107 0.611*** 0.368***(0.0846) (0.0821) (0.0701) (0.0726)
High School*Icohort 0.492*** 0.262* 0.299*** -0.256** -0.155 -0.102**(0.110) (0.110) (0.0333) (0.0915) (0.0927) (0.0391)
Some College 0.313*** 0.277** 0.890*** 0.487***(0.0848) (0.105) (0.0858) (0.0911)
Some College*Icohort 0.581*** 0.214 0.367*** -0.327** -0.152 -0.176**(0.121) (0.139) (0.0546) (0.115) (0.120) (0.0582)
College Graduate 0.449*** 0.373** 1.085*** 0.511***(0.0835) (0.115) (0.0737) (0.0860)
College Graduate*Icohort 0.636*** 0.139 0.497*** -0.295** -0.124 -0.171*(0.111) (0.143) (0.0729) (0.0958) (0.110) (0.0740)
Cognitive Ability 0.0363 0.196***(0.0240) (0.0310)
Cognitive Ability*Icohort 0.159*** -0.0679(0.0393) (0.0360)
Professional, Technical 0.0448 0.314***& kindred (0.0871) (0.0597)
Professional, Technical 0.270* -0.186*& kindred*Icohort (0.106) (0.0811)
Managers, Officials 0.0826 0.698***& Proprietors (0.139) (0.0699)
Managers, Officials 0.616*** -0.285**& Proprietors*Icohort (0.156) (0.0894)
Clerical & Kindred -0.307 -0.272*(0.161) (0.126)
Clerical & Kindred*Icohort 0.0333 -0.0481(0.204) (0.141)
Sales Workers -0.0785 0.122(0.208) (0.203)
Sales Workers*Icohort 0.197 -0.117(0.291) (0.212)
Service Workers -0.0796 -0.578***(0.0903) (0.130)
20

Original cohort - NLSY79 NLSY97 - NLSY79Partial Full Difference Partial Full Difference
Specification Specification Specification Specification
Service Workers*Icohort -0.502** 0.239(0.158) (0.141)
Farm Workers -0.348*** -0.390*(0.0931) (0.166)
Farm Workers *Icohort -0.0409 0.480*(0.189) (0.236)
N 6896 6896 6896 6874 6874 6874
Icohort is an indicator for the 79 cohort when running the Original cohort-79 regression and an indicator for 97 in the 79-97 regression.
The second variables are therefore the change between the cohorts.
Table 6: Decomposing the change in returns to education.
NLSYOC-NLSY79 NLSY79-NLSY97High Some College High Some CollegeSchool College Graduate School College Graduate
Total Change 0.229*** 0.367*** 0.497*** -0.102** -0.176** -0.171*in returns (0.0333) (0.0546) (0.0729) (0.0391) (0.0582) (0.0740)
Change due to 0.161*** 0.226*** 0.273*** -0.0732* -0.133** -0.109Cognitive Ability (0.0264) (0.0418) (0.0526) (0.0320) (0.0430) (0.0586)
Change due to 0.0684** 0.140*** 0.224*** -0.0286 -0.0429 -0.0617Occupation (0.0225) (0.0416) (0.0624) (0.0243) (0.0445) (0.0596)
N 6896 6896 6896 6874 6874 6874
21
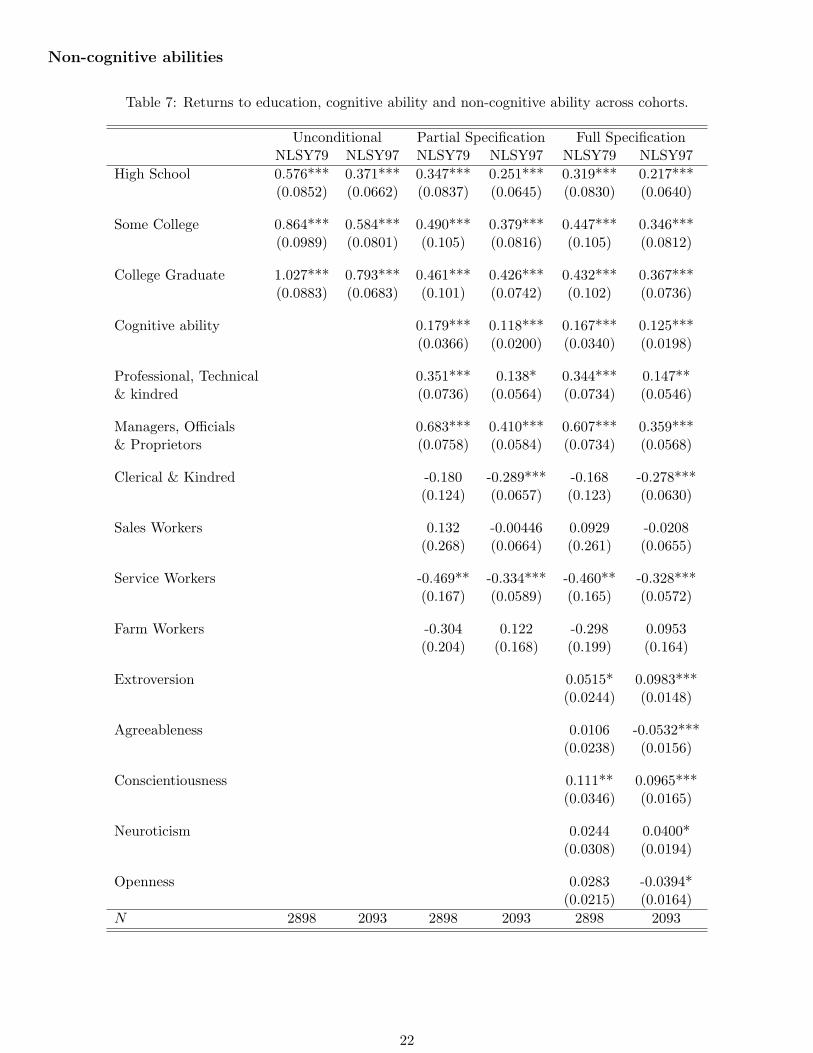
Non-cognitive abilities
Table 7: Returns to education, cognitive ability and non-cognitive ability across cohorts.
Unconditional Partial Specification Full SpecificationNLSY79 NLSY97 NLSY79 NLSY97 NLSY79 NLSY97
High School 0.576*** 0.371*** 0.347*** 0.251*** 0.319*** 0.217***(0.0852) (0.0662) (0.0837) (0.0645) (0.0830) (0.0640)
Some College 0.864*** 0.584*** 0.490*** 0.379*** 0.447*** 0.346***(0.0989) (0.0801) (0.105) (0.0816) (0.105) (0.0812)
College Graduate 1.027*** 0.793*** 0.461*** 0.426*** 0.432*** 0.367***(0.0883) (0.0683) (0.101) (0.0742) (0.102) (0.0736)
Cognitive ability 0.179*** 0.118*** 0.167*** 0.125***(0.0366) (0.0200) (0.0340) (0.0198)
Professional, Technical 0.351*** 0.138* 0.344*** 0.147**& kindred (0.0736) (0.0564) (0.0734) (0.0546)
Managers, Officials 0.683*** 0.410*** 0.607*** 0.359***& Proprietors (0.0758) (0.0584) (0.0734) (0.0568)
Clerical & Kindred -0.180 -0.289*** -0.168 -0.278***(0.124) (0.0657) (0.123) (0.0630)
Sales Workers 0.132 -0.00446 0.0929 -0.0208(0.268) (0.0664) (0.261) (0.0655)
Service Workers -0.469** -0.334*** -0.460** -0.328***(0.167) (0.0589) (0.165) (0.0572)
Farm Workers -0.304 0.122 -0.298 0.0953(0.204) (0.168) (0.199) (0.164)
Extroversion 0.0515* 0.0983***(0.0244) (0.0148)
Agreeableness 0.0106 -0.0532***(0.0238) (0.0156)
Conscientiousness 0.111** 0.0965***(0.0346) (0.0165)
Neuroticism 0.0244 0.0400*(0.0308) (0.0194)
Openness 0.0283 -0.0394*(0.0215) (0.0164)
N 2898 2093 2898 2093 2898 2093
22

Table 8: Decomposing the returns to education due to cognitive ability ,occupation and non-cognitive ability.
(1) (2) (3) (4)NLSY79 NLSY97 NLSY79 NLSY97
a) High SchoolTotal Change in returns 0.229*** 0.120*** 0.257*** 0.154***
(0.0284) (0.0215) (0.0297) (0.0252)
Change due to cognitive ability 0.166*** 0.0896*** 0.154*** 0.0950***(0.0257) (0.0155) (0.0256) (0.0156)
Change due to occupation 0.0638*** 0.0301* 0.0582*** 0.0290*(0.0167) (0.0153) (0.0161) (0.0145)
Change due to non-cognitive ability 0.0448*** 0.0300*(0.0102) (0.0138)
b) Some CollegeTotal Change in returns 0.374*** 0.204*** 0.417*** 0.237***
(0.0433) (0.0308) (0.0452) (0.0355)
[1em] Change due to cognitive ability 0.229*** 0.111*** 0.213*** 0.118***(0.0358) (0.0199) (0.0356) (0.0200)
Change due to occupation 0.145*** 0.0929*** 0.129*** 0.0899***(0.0323) (0.0252) (0.0316) (0.0240)
Change due to non-cognitive ability 0.0742*** 0.0293(0.0167) (0.0191)
c) College degreeTotal Change in returns 0.566*** 0.366*** 0.595*** 0.425***
(0.0534) (0.0387) (0.0540) (0.0407)
Change due to cognitive ability 0.300*** 0.187*** 0.280*** 0.198***(0.0454) (0.0289) (0.0453) (0.0287)
Change due to occupation 0.266*** 0.179*** 0.249*** 0.171***(0.0443) (0.0314) (0.0437) (0.0304)
Change due to non-cognitive ability 0.0657*** 0.0561***(0.0135) (0.0163)
N 2898 2093 2898 2093
23

Table 9: Decomposing the change in returns to education.
Partial Specification Full SpecificationHigh Some College High Some CollegeSchool College Graduate School College Graduate
Total Change -0.108** -0.168** -0.197** -0.101* -0.177** -0.166*in returns (0.0399) (0.0586) (0.0749) (0.0435) (0.0631) (0.0769)
Change due to -0.0741* -0.115** -0.109 -0.0579 -0.0931* -0.0789Cognitive Ability (0.0322) (0.0429) (0.0593) (0.0320) (0.0426) (0.0592)
Change due to -0.0338 -0.0531 -0.0871 -0.0292 -0.0404 -0.0779Occupation (0.0255) (0.0455) (0.0609) (0.0243) (0.0439) (0.0598)
Change due to -0.0137 -0.0436 -0.00882Non-Cognitive Ability (0.0189) (0.0271) (0.0239)
N 4991 4991 4991 4991 4991 4991
24

Alternative Specifications
Hourly Pay
Table 10: Returns to education and cognitive ability across cohorts.
Partial specification Full SpecificationOriginal NLSY79 NLSY97 Original NLSY79 NLSY97Cohort Cohort
High School 0.284∗∗ 0.225∗∗∗ 0.120∗∗ 0.178 0.0943∗∗∗ 0.0455(0.0941) (0.0197) (0.0391) (0.0950) (0.0204) (0.0388)
Some College 0.457∗∗∗ 0.413∗∗∗ 0.272∗∗∗ 0.230 0.192∗∗∗ 0.119∗
(0.114) (0.0355) (0.0586) (0.120) (0.0379) (0.0582)
College Graduate 0.773∗∗∗ 0.508∗∗∗ 0.431∗∗∗ 0.398∗∗ 0.167∗∗∗ 0.162∗∗
(0.125) (0.0249) (0.0428) (0.142) (0.0313) (0.0504)
Cognitive ability 0.0369 0.0986∗∗∗ 0.0525∗∗∗
(0.0413) (0.0108) (0.0128)
Professional, Technical 0.614∗∗∗ 0.302∗∗∗ 0.234∗∗∗
& Kindred (0.145) (0.0367) (0.0443)
Managers, Officials 0.697∗∗∗ 0.268∗∗∗ 0.300∗∗∗
& Proprietors (0.173) (0.0376) (0.0473)
Clerical & Kindred 0.435∗ -0.179∗∗∗ -0.246∗∗∗
(0.185) (0.0486) (0.0438)
Sales Workers 0.584∗∗ 0.248∗∗∗ -0.0450(0.205) (0.0628) (0.0490)
Service Workers -0.102 -0.258∗∗∗ -0.204∗∗∗
(0.196) (0.0356) (0.0430)
Farm Workers 0.702∗ -0.389∗∗∗ -0.148(0.311) (0.0808) (0.150)
N 1242 4403 2555 1242 4398 2554
25
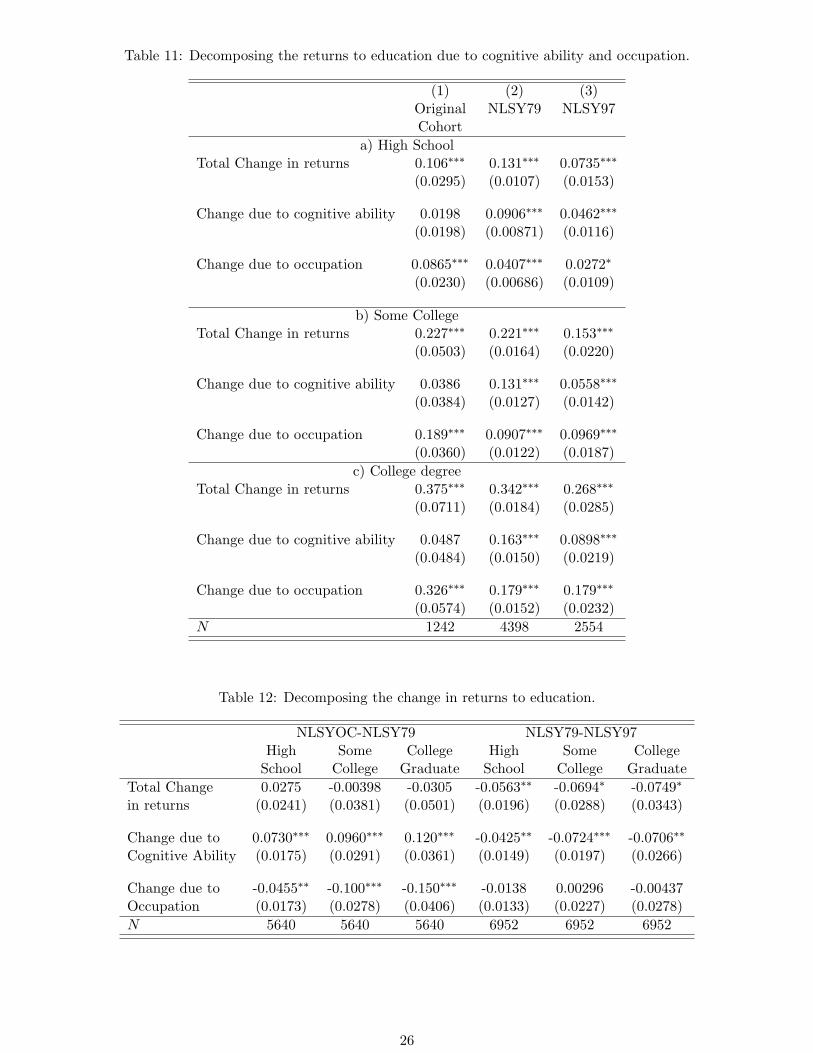
Table 11: Decomposing the returns to education due to cognitive ability and occupation.
(1) (2) (3)Original NLSY79 NLSY97Cohort
a) High SchoolTotal Change in returns 0.106∗∗∗ 0.131∗∗∗ 0.0735∗∗∗
(0.0295) (0.0107) (0.0153)
Change due to cognitive ability 0.0198 0.0906∗∗∗ 0.0462∗∗∗
(0.0198) (0.00871) (0.0116)
Change due to occupation 0.0865∗∗∗ 0.0407∗∗∗ 0.0272∗
(0.0230) (0.00686) (0.0109)
b) Some CollegeTotal Change in returns 0.227∗∗∗ 0.221∗∗∗ 0.153∗∗∗
(0.0503) (0.0164) (0.0220)
Change due to cognitive ability 0.0386 0.131∗∗∗ 0.0558∗∗∗
(0.0384) (0.0127) (0.0142)
Change due to occupation 0.189∗∗∗ 0.0907∗∗∗ 0.0969∗∗∗
(0.0360) (0.0122) (0.0187)
c) College degreeTotal Change in returns 0.375∗∗∗ 0.342∗∗∗ 0.268∗∗∗
(0.0711) (0.0184) (0.0285)
Change due to cognitive ability 0.0487 0.163∗∗∗ 0.0898∗∗∗
(0.0484) (0.0150) (0.0219)
Change due to occupation 0.326∗∗∗ 0.179∗∗∗ 0.179∗∗∗
(0.0574) (0.0152) (0.0232)
N 1242 4398 2554
Table 12: Decomposing the change in returns to education.
NLSYOC-NLSY79 NLSY79-NLSY97High Some College High Some CollegeSchool College Graduate School College Graduate
Total Change 0.0275 -0.00398 -0.0305 -0.0563∗∗ -0.0694∗ -0.0749∗
in returns (0.0241) (0.0381) (0.0501) (0.0196) (0.0288) (0.0343)
Change due to 0.0730∗∗∗ 0.0960∗∗∗ 0.120∗∗∗ -0.0425∗∗ -0.0724∗∗∗ -0.0706∗∗
Cognitive Ability (0.0175) (0.0291) (0.0361) (0.0149) (0.0197) (0.0266)
Change due to -0.0455∗∗ -0.100∗∗∗ -0.150∗∗∗ -0.0138 0.00296 -0.00437Occupation (0.0173) (0.0278) (0.0406) (0.0133) (0.0227) (0.0278)
N 5640 5640 5640 6952 6952 6952
26

Alternate age range of 21-35
Table 13: Returns to education and cognitive ability across cohorts.
Partial specification Full SpecificationOriginal NLSY79 NLSY97 Original NLSY79 NLSY97Cohort Cohort
High School 0.192∗∗ 0.483∗∗∗ 0.370∗∗∗ 0.162∗ 0.265∗∗∗ 0.255∗∗∗
(0.0618) (0.0575) (0.0461) (0.0631) (0.0587) (0.0460)
Some College 0.306∗∗∗ 0.722∗∗∗ 0.562∗∗∗ 0.233∗∗ 0.380∗∗∗ 0.383∗∗∗
(0.0690) (0.0773) (0.0626) (0.0785) (0.0798) (0.0636)
College Graduate 0.420∗∗∗ 0.842∗∗∗ 0.718∗∗∗ 0.270∗∗ 0.373∗∗∗ 0.388∗∗∗
(0.0686) (0.0792) (0.0504) (0.0840) (0.0813) (0.0576)
Cognitive ability 0.0330∗ 0.185∗∗∗ 0.102∗∗∗
(0.0151) (0.0249) (0.0149)
Professional, Technical 0.167∗∗ 0.319∗∗∗ 0.103& Kindred (0.0567) (0.0673) (0.0532)
Managers, Officials 0.239∗∗ 0.729∗∗∗ 0.472∗∗∗
& Proprietors (0.0773) (0.0819) (0.0592)
Clerical & Kindred -0.295∗ -0.201∗ -0.342∗∗∗
(0.139) (0.102) (0.0601)
Sales Workers 0.0905 -0.00754 -0.0472(0.0757) (0.161) (0.0571)
Service Workers -0.268∗∗ -0.610∗∗∗ -0.380∗∗∗
(0.0880) (0.119) (0.0467)
Farm Workers -0.173∗ -0.205 -0.143(0.0800) (0.154) (0.177)
N 2692 5387 2883 2692 5387 2883
27

Table 14: Decomposing the returns to education due to cognitive ability and occupation.
(1) (2) (3)Original NLSY79 NLSY97Cohort
a) High SchoolTotal Change in returns 0.0302∗ 0.218∗∗∗ 0.114∗∗∗
(0.0124) (0.0196) (0.0168)
Change due to cognitive ability 0.0175∗ 0.167∗∗∗ 0.0864∗∗∗
(0.00822) (0.0177) (0.0128)
Change due to occupation 0.0127 0.0508∗∗∗ 0.0280∗
(0.00981) (0.0115) (0.0118)
b) Some CollegeTotal Change in returns 0.0729∗∗∗ 0.342∗∗∗ 0.179∗∗∗
(0.0219) (0.0302) (0.0251)
Change due to cognitive ability 0.0319∗ 0.237∗∗∗ 0.109∗∗∗
(0.0147) (0.0253) (0.0168)
Change due to occupation 0.0411∗ 0.106∗∗∗ 0.0698∗∗∗
(0.0178) (0.0216) (0.0206)
c) College degreeTotal Change in returns 0.149∗∗∗ 0.469∗∗∗ 0.330∗∗∗
(0.0328) (0.0340) (0.0318)
Change due to cognitive ability 0.0447∗ 0.275∗∗∗ 0.174∗∗∗
(0.0206) (0.0285) (0.0239)
Change due to occupation 0.104∗∗∗ 0.194∗∗∗ 0.156∗∗∗
(0.0289) (0.0279) (0.0266)
N 2692 5387 2883
Table 15: Decomposing the change in returns to education.
NLSYOC-NLSY79 NLSY79-NLSY97High Some College High Some CollegeSchool College Graduate School College Graduate
Total Change 0.189∗∗∗ 0.271∗∗∗ 0.323∗∗∗ -0.104∗∗∗ -0.166∗∗∗ -0.141∗
in returns (0.0260) (0.0407) (0.0532) (0.0309) (0.0467) (0.0586)
Change due to 0.150∗∗∗ 0.206∗∗∗ 0.232∗∗∗ -0.0815∗∗ -0.129∗∗∗ -0.103∗
Cognitive Ability (0.0203) (0.0305) (0.0375) (0.0257) (0.0347) (0.0458)
Change due to 0.0389∗ 0.0649∗ 0.0917∗ -0.0227 -0.0378 -0.0380Occupation (0.0175) (0.0307) (0.0453) (0.0193) (0.0355) (0.0481)
N 8079 8079 8079 8270 8270 8270
28

Alternate age range of 25-30
Table 16: Returns to education and cognitive ability across cohorts.
Partial specification Full SpecificationOriginal NLSY79 NLSY97 Original NLSY79 NLSY97Cohort Cohort
High School 0.136 0.622∗∗∗ 0.333∗∗∗ 0.124 0.413∗∗∗ 0.219∗∗∗
(0.0832) (0.0708) (0.0577) (0.0805) (0.0717) (0.0577)
Some College 0.327∗∗∗ 0.918∗∗∗ 0.511∗∗∗ 0.289∗ 0.581∗∗∗ 0.333∗∗∗
(0.0894) (0.0860) (0.0780) (0.113) (0.0900) (0.0795)
College Graduate 0.456∗∗∗ 1.051∗∗∗ 0.733∗∗∗ 0.364∗∗ 0.556∗∗∗ 0.397∗∗∗
(0.0827) (0.0761) (0.0616) (0.121) (0.0861) (0.0690)
Cognitive ability 0.0267 0.183∗∗∗ 0.112∗∗∗
(0.0229) (0.0270) (0.0194)
Professional, Technical 0.104 0.271∗∗∗ 0.0811& Kindred (0.0860) (0.0632) (0.0562)
Managers, Officials 0.0523 0.517∗∗∗ 0.367∗∗∗
& Proprietors (0.141) (0.0715) (0.0574)
Clerical & Kindred -0.298 -0.157 -0.236∗∗∗
(0.161) (0.106) (0.0598)
Sales Workers -0.0514 0.0926 -0.0221(0.231) (0.173) (0.0608)
Service Workers -0.125 -0.498∗∗∗ -0.293∗∗∗
(0.0900) (0.112) (0.0523)
Farm Workers -0.299∗∗ -0.644∗ 0.0758(0.109) (0.315) (0.152)
N 2088 4339 2118 2088 4339 2118
29

Table 17: Decomposing the returns to education due to cognitive ability and occupation.
(1) (2) (3)Original NLSY79 NLSY97Cohort
a) High SchoolTotal Change in returns 0.0121 0.209∗∗∗ 0.114∗∗∗
(0.0184) (0.0226) (0.0198)
Change due to cognitive ability 0.0142 0.165∗∗∗ 0.0868∗∗∗
(0.0147) (0.0205) (0.0151)
Change due to occupation -0.00211 0.0435∗∗∗ 0.0274∗
(0.0126) (0.0122) (0.0135)
b) Some CollegeTotal Change in returns 0.0374 0.336∗∗∗ 0.178∗∗∗
(0.0386) (0.0357) (0.0286)
Change due to cognitive ability 0.0279 0.243∗∗∗ 0.107∗∗∗
(0.0287) (0.0303) (0.0194)
Change due to occupation 0.00946 0.0932∗∗∗ 0.0705∗∗
(0.0292) (0.0243) (0.0229)
c) College degreeTotal Change in returns 0.0918 0.495∗∗∗ 0.337∗∗∗
(0.0585) (0.0434) (0.0375)
Change due to cognitive ability 0.0375 0.302∗∗∗ 0.184∗∗∗
(0.0386) (0.0365) (0.0291)
Change due to occupation 0.0542 0.193∗∗∗ 0.153∗∗∗
(0.0504) (0.0341) (0.0299)
N 2088 4339 2118
Table 18: Decomposing the change in returns to education.
NLSYOC-NLSY79 NLSY79-NLSY97High Some College High Some CollegeSchool College Graduate School College Graduate
Total Change 0.197∗∗∗ 0.299∗∗∗ 0.403∗∗∗ -0.0928∗ -0.156∗∗ -0.155∗
in returns (0.0319) (0.0539) (0.0734) (0.0371) (0.0551) (0.0725)
Change due to 0.151∗∗∗ 0.215∗∗∗ 0.264∗∗∗ -0.0766∗ -0.133∗∗ -0.115∗
Cognitive Ability (0.0262) (0.0422) (0.0534) (0.0307) (0.0414) (0.0581)
Change due to 0.0462∗ 0.0841∗ 0.139∗ -0.0162 -0.0229 -0.0401Occupation (0.0199) (0.0389) (0.0611) (0.0224) (0.0410) (0.0570)
N 6427 6427 6427 6457 6457 6457
30

No Controls
Table 19: Returns to education and cognitive ability across cohorts.
Partial specification Full SpecificationOriginal NLSY79 NLSY97 Original NLSY79 NLSY97Cohort Cohort
High School 0.114 0.706∗∗∗ 0.382∗∗∗ 0.0798 0.358∗∗∗ 0.208∗∗∗
(0.0836) (0.0709) (0.0622) (0.0803) (0.0723) (0.0585)
Some College 0.288∗∗∗ 0.944∗∗∗ 0.648∗∗∗ 0.196∗ 0.421∗∗∗ 0.376∗∗∗
(0.0740) (0.0855) (0.0805) (0.0981) (0.0902) (0.0794)
College Graduate 0.447∗∗∗ 1.220∗∗∗ 0.866∗∗∗ 0.285∗ 0.474∗∗∗ 0.396∗∗∗
(0.0758) (0.0747) (0.0648) (0.111) (0.0852) (0.0686)
Cognitive ability 0.0507 0.268∗∗∗ 0.157∗∗∗
(0.0272) (0.0268) (0.0177)
Professional, Technical 0.114 0.248∗∗∗ 0.0753& Kindred (0.0987) (0.0558) (0.0526)
Managers, Officials 0.194 0.706∗∗∗ 0.408∗∗∗
& Proprietors (0.137) (0.0705) (0.0571)
Clerical & Kindred -0.287 -0.367∗∗ -0.351∗∗∗
(0.166) (0.129) (0.0619)
Sales Workers -0.00133 0.134 0.0289(0.229) (0.198) (0.0621)
Service Workers -0.131 -0.665∗∗∗ -0.411∗∗∗
(0.0798) (0.128) (0.0563)
Farm Workers -0.294∗∗ -0.351∗ 0.0889(0.0913) (0.173) (0.169)
N 2318 4578 2296 2318 4578 2296
31

Table 20: Decomposing the returns to education due to cognitive ability and occupation.
(1) (2) (3)Original NLSY79 NLSY97Cohort
a) High SchoolTotal Change in returns 0.0341 0.347∗∗∗ 0.175∗∗∗
(0.0192) (0.0258) (0.0229)
Change due to cognitive ability 0.0290 0.277∗∗∗ 0.138∗∗∗
(0.0148) (0.0231) (0.0173)
Change due to occupation 0.00517 0.0701∗∗∗ 0.0368∗
(0.0136) (0.0148) (0.0154)
b) Some CollegeTotal Change in returns 0.0922∗ 0.523∗∗∗ 0.272∗∗∗
(0.0392) (0.0392) (0.0335)
Change due to cognitive ability 0.0580∗ 0.387∗∗∗ 0.176∗∗∗
(0.0292) (0.0328) (0.0231)
Change due to occupation 0.0342 0.136∗∗∗ 0.0951∗∗∗
(0.0302) (0.0273) (0.0258)
c) College degreeTotal Change in returns 0.162∗∗ 0.746∗∗∗ 0.469∗∗∗
(0.0583) (0.0454) (0.0399)
Change due to cognitive ability 0.0774∗ 0.492∗∗∗ 0.284∗∗∗
(0.0388) (0.0390) (0.0307)
Change due to occupation 0.0849 0.253∗∗∗ 0.186∗∗∗
(0.0506) (0.0376) (0.0315)
N 2318 4578 2296
Table 21: Decomposing the change in returns to education.
NLSYOC-NLSY79 NLSY79-NLSY97High Some College High Some CollegeSchool College Graduate School College Graduate
Total Change 0.313∗∗∗ 0.431∗∗∗ 0.583∗∗∗ -0.173∗∗∗ -0.252∗∗∗ -0.276∗∗∗
in returns (0.0370) (0.0578) (0.0756) (0.0439) (0.0649) (0.0780)
Change due to 0.248∗∗∗ 0.329∗∗∗ 0.415∗∗∗ -0.139∗∗∗ -0.210∗∗∗ -0.208∗∗∗
Cognitive Ability (0.0297) (0.0451) (0.0559) (0.0356) (0.0486) (0.0625)
Change due to 0.0649∗∗ 0.102∗ 0.169∗∗ -0.0333 -0.0412 -0.0678Occupation (0.0232) (0.0421) (0.0637) (0.0260) (0.0463) (0.0614)
N 6896 6896 6896 6874 6874 6874
32

Cognitive ability quantiles
Table 22: Returns to education and cognitive ability across cohorts.
Partial specification Full SpecificationOriginal NLSY79 NLSY97 Original NLSY79 NLSY97Cohort Cohort
High School 0.127 0.612∗∗∗ 0.357∗∗∗ 0.119 0.383∗∗∗ 0.240∗∗∗
(0.0837) (0.0702) (0.0585) (0.0841) (0.0699) (0.0579)
Some College 0.321∗∗∗ 0.892∗∗∗ 0.571∗∗∗ 0.313∗∗ 0.514∗∗∗ 0.366∗∗∗
(0.0847) (0.0861) (0.0760) (0.0983) (0.0883) (0.0779)
College Graduate 0.455∗∗∗ 1.085∗∗∗ 0.791∗∗∗ 0.418∗∗∗ 0.558∗∗∗ 0.448∗∗∗
(0.0837) (0.0736) (0.0611) (0.106) (0.0834) (0.0681)
Cognitive ability 0.0893 0.296∗∗∗ 0.232∗∗∗
2nd quartile (0.0554) (0.0637) (0.0408)
Cognitive ability -0.0145 0.350∗∗∗ 0.177∗∗∗
3rd quartile (0.0643) (0.0736) (0.0422)
Cognitive ability -0.165 0.408∗∗∗ 0.237∗∗∗
4th quartile (0.141) (0.0792) (0.0471)
Professional, Technical 0.0780 0.383∗∗∗ 0.163∗∗
& Kindred (0.0797) (0.0593) (0.0547)
Managers, Officials 0.0996 0.733∗∗∗ 0.436∗∗∗
& Proprietors (0.141) (0.0706) (0.0564)
Clerical & Kindred -0.287 -0.254∗ -0.308∗∗∗
(0.158) (0.127) (0.0618)
Sales Workers -0.0868 0.160 -0.000488(0.207) (0.203) (0.0640)
Service Workers -0.0979 -0.569∗∗∗ -0.336∗∗∗
(0.0902) (0.131) (0.0542)
Farm Workers -0.344∗∗∗ -0.369∗ 0.0898(0.0924) (0.165) (0.173)
N 2318 4578 2296 2318 4578 2296
33
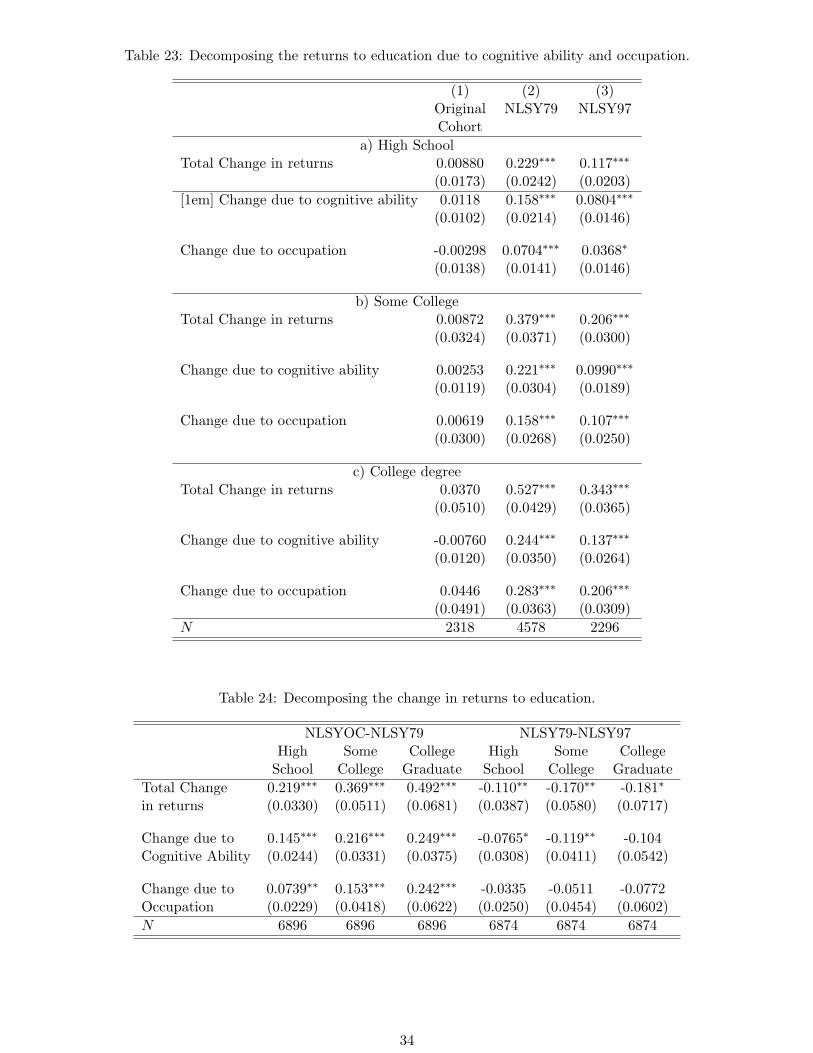
Table 23: Decomposing the returns to education due to cognitive ability and occupation.
(1) (2) (3)Original NLSY79 NLSY97Cohort
a) High SchoolTotal Change in returns 0.00880 0.229∗∗∗ 0.117∗∗∗
(0.0173) (0.0242) (0.0203)
[1em] Change due to cognitive ability 0.0118 0.158∗∗∗ 0.0804∗∗∗
(0.0102) (0.0214) (0.0146)
Change due to occupation -0.00298 0.0704∗∗∗ 0.0368∗
(0.0138) (0.0141) (0.0146)
b) Some CollegeTotal Change in returns 0.00872 0.379∗∗∗ 0.206∗∗∗
(0.0324) (0.0371) (0.0300)
Change due to cognitive ability 0.00253 0.221∗∗∗ 0.0990∗∗∗
(0.0119) (0.0304) (0.0189)
Change due to occupation 0.00619 0.158∗∗∗ 0.107∗∗∗
(0.0300) (0.0268) (0.0250)
c) College degreeTotal Change in returns 0.0370 0.527∗∗∗ 0.343∗∗∗
(0.0510) (0.0429) (0.0365)
Change due to cognitive ability -0.00760 0.244∗∗∗ 0.137∗∗∗
(0.0120) (0.0350) (0.0264)
Change due to occupation 0.0446 0.283∗∗∗ 0.206∗∗∗
(0.0491) (0.0363) (0.0309)
N 2318 4578 2296
Table 24: Decomposing the change in returns to education.
NLSYOC-NLSY79 NLSY79-NLSY97High Some College High Some CollegeSchool College Graduate School College Graduate
Total Change 0.219∗∗∗ 0.369∗∗∗ 0.492∗∗∗ -0.110∗∗ -0.170∗∗ -0.181∗
in returns (0.0330) (0.0511) (0.0681) (0.0387) (0.0580) (0.0717)
Change due to 0.145∗∗∗ 0.216∗∗∗ 0.249∗∗∗ -0.0765∗ -0.119∗∗ -0.104Cognitive Ability (0.0244) (0.0331) (0.0375) (0.0308) (0.0411) (0.0542)
Change due to 0.0739∗∗ 0.153∗∗∗ 0.242∗∗∗ -0.0335 -0.0511 -0.0772Occupation (0.0229) (0.0418) (0.0622) (0.0250) (0.0454) (0.0602)
N 6896 6896 6896 6874 6874 6874
34

A Appendix
A.1 Correlation with education
Table A1: Correlation between Education level and other covariates.
Cognitive Skills Professional & Kindred Managers & proprietorsOriginal NLSY79 NLSY97 Original NLSY79 NLSY97 Original NLSY79 NLSY97Cohort Cohort Cohort
High School 0.47*** 0.78*** 0.77*** 0.03** -0.01 0.06*** 0.03** 0.01 0.01(0.07) (0.04) (0.07) (0.01) (0.01) (0.02) (0.01) (0.01) (0.02)
Some College 0.88*** 1.04*** 0.8*** 0.13*** 0.04* 0.14*** 0.11*** 0.08** 0.16***(0.08) (0.06) (0.1) (0.02) (0.02) (0.02) (0.02) (0.03) (0.03)
College Grad 1.09*** 1.13*** 1.26*** 0.44*** 0.22*** 0.11*** 0.1*** 0.16*** 0.29***(0.09) (0.05) (0.08) (0.02) (0.02) (0.02) (0.02) (0.02) (0.03)
Cognitive Ab. 0.06*** 0.09*** 0.01 0.03*** 0.03*** 0.06***(0.01) (0.01) (0.01) (0.01) (0.01) (0.01)
Clerical & Kindred Sales workers Service workersOriginal NLSY79 NLSY97 Original NLSY79 NLSY97 Original NLSY79 NLSY97Cohort Cohort Cohort
High School 0.02 0.02** 0.01 0.03** 0.02*** 0.02 0.02 0.02 -0.03(0.01) (0.01) (0.02) (0.01) (0.01) (0.02) (0.01) (0.01) (0.03)
Some College 0.04* 0.02 0.00 0.08*** 0.05** 0.01 0.03 0.06** -0.05(0.02) (0.01) (0.02) (0.02) (0.02) (0.03) (0.02) (0.02) (0.04)
College Grad 0.01 0.02 -0.01 0.08*** 0.06*** 0.03 -0.011 -0.01 -0.13***(0.02) (0.01) (0.02) (0.02) (0.01) (0.02) (0.02) (0.02) (0.03)
Cognitive Ab. 0.01 0.01* 0.01* -0.02** 0.01** 0.00 -0.01 -0.03*** -0.01(0.01) (0.00) (0.01) (0.01) (0.00) (0.01) (0.01) (0.01) (0.01)
Farm Workers Labourers & OperativesOriginal NLSY79 NLSY97 Original NLSY79 NLSY97Cohort Cohort
High School 0.02 -0.01 -0.01 -0.18*** -0.07*** -0.03(0.01) (0.01) (0.01) (0.03) (0.02) (0.03)
Some College 0.01 -0.01 -0.01 -0.44*** -0.27*** -0.2***(0.01) (0.01) (0.01) (0.03) (0.03) (0.05)
College Grad 0.01 -0.00 -0.01 -0.63*** -0.4*** -0.33***(0.01) (0.01) (0.01) (0.03) (0.02) (0.04)
Cognitive Ab. -0.01 -0.00 -0.01 -0.05*** -0.11*** -0.08***(0.00) (0.00) (0.00) (0.01) (0.01) (0.01)
N 2517 4638 2517 2517 4638 2517 2517 4638 2517
35

A.2 Additional Robustness Checks
I run some additional robustness checks besides those from section 4. Running the regression without any weightsonly results in changes in the magnitude of the results, the patterns observed in the main results hold for each ofthese analyses as well. The results are presented in tables A2, A3 and A4.
I also run the analysis from the main regression broken down by race, the results for white(Tables A5-A7) andnon-white populations(Tables A8-A10) are different. The change in returns to education, across all education levelswhen not controlling for cognitive ability and occupation follow the same pattern as the larger sample. There is anincrease in returns to education between the original cohort and the NLSY79 and a reduction between the NLSY79and NLSY97. When controlling for cognitive ability and occupation however the pattern diverges, for the sampleof white individuals(Table A5) there is an increase between the Original cohort(0.335) and the NLSY79(0.457),but unlike the larger sample and the non-white population for the white sub-sample the reduction in the returnsto a college degree is small for the NLSY97(0.444). The returns to cognitive ability also follows the same patternas the original results, an increase for the NLSY79 followed by a reduction for both race sub samples. Thedecomposition of the returns to education for the white sub-sample(Table A6) yields similar results to the resultsfor the larger sample for the most part. For those in the Original cohort and NLSY79, cognitive ability is the mostimportant factor that seems to determine the returns to education and the importance of occupation increaseswith the education level. For the NLSY97 however occupation seems to play a much larger part than for the largersample, particularly for those with some college and those with a college degree. The pattern for the non-whitesub-sample(Table A9) is similar to that in the whole sample, with cognitive ability playing the most important partacross education levels and samples, the one exception being the decomposition of the returns to college for thosein the NLSY79, where occupation seems to play a particularly large part. I also decompose the changes in returnsto education between cohorts(Table A7 and A10), for the original cohort and NLSY79 cohort pair the results areconsistent for the main sample and the two race sub samples. However for the NLSY79 NLSY97 cohort pair, thedifference in reduction in returns is mostly explained by cognitive ability for the white sub-sample whereas for thenon-white sub-sample occupation seems to be the more important factor.
36

A.2.1 Unweighted
Table A2: Returns to education and cognitive ability across cohorts.
Partial specification Full SpecificationOriginal NLSY79 NLSY97 Original NLSY79 NLSY97Cohort Cohort
High School 0.167∗ 0.656∗∗∗ 0.361∗∗∗ 0.143∗ 0.382∗∗∗ 0.216∗∗∗
(0.0683) (0.0612) (0.0555) (0.0704) (0.0647) (0.0538)
Some College 0.333∗∗∗ 0.998∗∗∗ 0.590∗∗∗ 0.267∗∗ 0.516∗∗∗ 0.363∗∗∗
(0.0784) (0.0793) (0.0713) (0.0870) (0.0840) (0.0715)
College Graduate 0.482∗∗∗ 1.189∗∗∗ 0.804∗∗∗ 0.361∗∗∗ 0.528∗∗∗ 0.393∗∗∗
(0.0749) (0.0633) (0.0576) (0.0926) (0.0748) (0.0639)
Cognitive ability 0.0471∗ 0.232∗∗∗ 0.134∗∗∗
(0.0199) (0.0273) (0.0166)
Professional, Technical 0.0758 0.383∗∗∗ 0.110∗
& Kindred (0.0725) (0.0623) (0.0524)
Managers, Officials 0.137 0.719∗∗∗ 0.403∗∗∗
& Proprietors (0.101) (0.0671) (0.0546)
Clerical & Kindred -0.297∗ -0.315∗ -0.272∗∗∗
(0.149) (0.141) (0.0568)
Sales Workers 0.0170 0.0915 -0.0129(0.119) (0.149) (0.0579)
Service Workers -0.131 -0.637∗∗∗ -0.366∗∗∗
(0.0810) (0.129) (0.0520)
Farm Workers -0.341∗∗∗ -0.586∗∗ 0.0916(0.0877) (0.192) (0.173)
N 2318 4578 2296 2318 4578 2296
37

Table A3: Decomposing the returns to education due to cognitive ability and occupation.
(1) (2) (3)Original NLSY79 NLSY97Cohort
a) High SchoolTotal Change in returns 0.0242 0.275∗∗∗ 0.145∗∗∗
(0.0167) (0.0251) (0.0204)
Change due to cognitive ability 0.0249 0.209∗∗∗ 0.115∗∗∗
(0.0128) (0.0232) (0.0160)
Change due to occupation -0.000717 0.0658∗∗∗ 0.0301∗
(0.0122) (0.0139) (0.0136)
b) Some CollegeTotal Change in returns 0.0658 0.482∗∗∗ 0.227∗∗∗
(0.0336) (0.0414) (0.0309)
Change due to cognitive ability 0.0489∗ 0.321∗∗∗ 0.146∗∗∗
(0.0247) (0.0359) (0.0214)
Change due to occupation 0.0169 0.161∗∗∗ 0.0813∗∗∗
(0.0261) (0.0294) (0.0241)
c) College degreeTotal Change in returns 0.121∗ 0.661∗∗∗ 0.411∗∗∗
(0.0518) (0.0486) (0.0388)
Change due to cognitive ability 0.0666∗ 0.382∗∗∗ 0.232∗∗∗
(0.0334) (0.0415) (0.0294)
Change due to occupation 0.0544 0.279∗∗∗ 0.180∗∗∗
(0.0453) (0.0401) (0.0313)
N 2318 4578 2296
Table A4: Decomposing the change in returns to education.
NLSYOC-NLSY79 NLSY79-NLSY97High Some College High Some CollegeSchool College Graduate School College Graduate
Total Change 0.250∗∗∗ 0.414∗∗∗ 0.539∗∗∗ -0.128∗∗ -0.252∗∗∗ -0.246∗∗
in returns (0.0360) (0.0596) (0.0806) (0.0390) (0.0606) (0.0770)
Change due to 0.184∗∗∗ 0.271∗∗∗ 0.315∗∗∗ -0.0924∗∗ -0.172∗∗∗ -0.148∗
Cognitive Ability (0.0285) (0.0462) (0.0574) (0.0331) (0.0468) (0.0612)
Change due to 0.0666∗∗ 0.144∗∗ 0.224∗∗ -0.0355 -0.0797 -0.0980Occupation (0.0237) (0.0443) (0.0687) (0.0232) (0.0447) (0.0621)
N 6896 6896 6896 6874 6874 6874
38
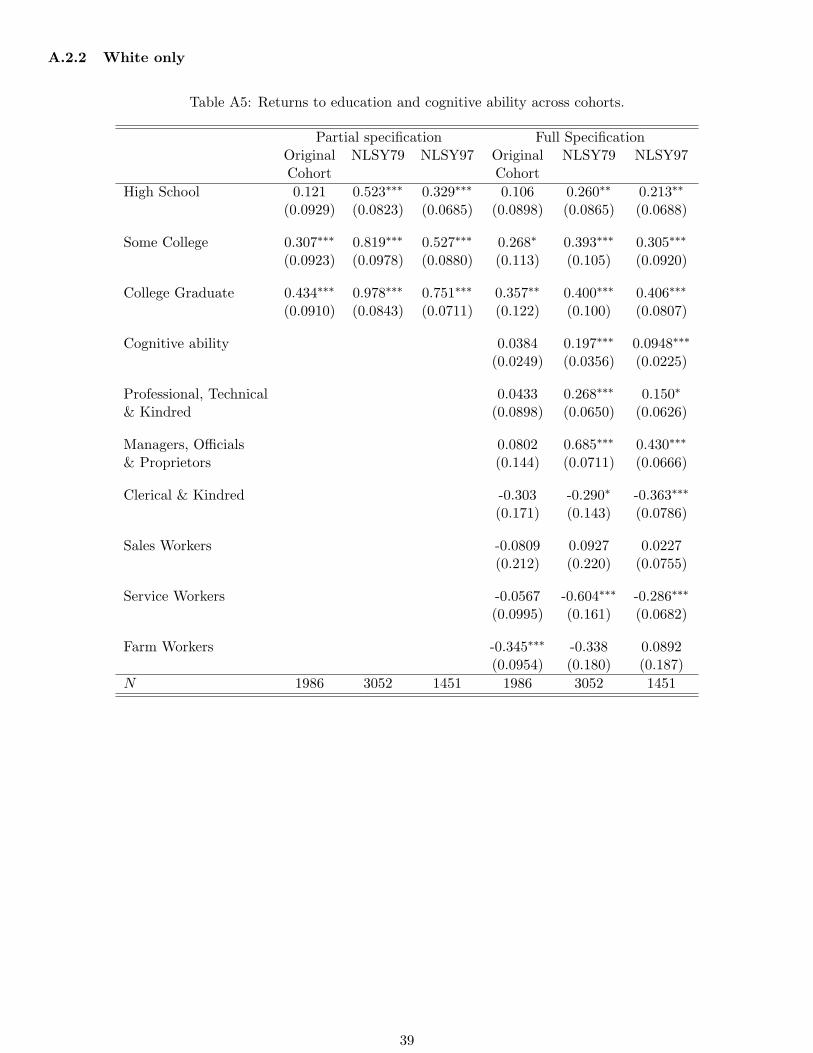
A.2.2 White only
Table A5: Returns to education and cognitive ability across cohorts.
Partial specification Full SpecificationOriginal NLSY79 NLSY97 Original NLSY79 NLSY97Cohort Cohort
High School 0.121 0.523∗∗∗ 0.329∗∗∗ 0.106 0.260∗∗ 0.213∗∗
(0.0929) (0.0823) (0.0685) (0.0898) (0.0865) (0.0688)
Some College 0.307∗∗∗ 0.819∗∗∗ 0.527∗∗∗ 0.268∗ 0.393∗∗∗ 0.305∗∗∗
(0.0923) (0.0978) (0.0880) (0.113) (0.105) (0.0920)
College Graduate 0.434∗∗∗ 0.978∗∗∗ 0.751∗∗∗ 0.357∗∗ 0.400∗∗∗ 0.406∗∗∗
(0.0910) (0.0843) (0.0711) (0.122) (0.100) (0.0807)
Cognitive ability 0.0384 0.197∗∗∗ 0.0948∗∗∗
(0.0249) (0.0356) (0.0225)
Professional, Technical 0.0433 0.268∗∗∗ 0.150∗
& Kindred (0.0898) (0.0650) (0.0626)
Managers, Officials 0.0802 0.685∗∗∗ 0.430∗∗∗
& Proprietors (0.144) (0.0711) (0.0666)
Clerical & Kindred -0.303 -0.290∗ -0.363∗∗∗
(0.171) (0.143) (0.0786)
Sales Workers -0.0809 0.0927 0.0227(0.212) (0.220) (0.0755)
Service Workers -0.0567 -0.604∗∗∗ -0.286∗∗∗
(0.0995) (0.161) (0.0682)
Farm Workers -0.345∗∗∗ -0.338 0.0892(0.0954) (0.180) (0.187)
N 1986 3052 1451 1986 3052 1451
39

Table A6: Decomposing the returns to education due to cognitive ability and occupation.
(1) (2) (3)Original NLSY79 NLSY97Cohort
a) High SchoolTotal Change in returns 0.0149 0.263∗∗∗ 0.116∗∗∗
(0.0210) (0.0286) (0.0257)
Change due to cognitive ability 0.0206 0.200∗∗∗ 0.0772∗∗∗
(0.0157) (0.0254) (0.0184)
Change due to occupation -0.00574 0.0634∗∗∗ 0.0387∗
(0.0158) (0.0174) (0.0187)
b) Some CollegeTotal Change in returns 0.0383 0.426∗∗∗ 0.222∗∗∗
(0.0420) (0.0435) (0.0378)
Change due to cognitive ability 0.0394 0.284∗∗∗ 0.0922∗∗∗
(0.0297) (0.0363) (0.0227)
Change due to occupation -0.00110 0.142∗∗∗ 0.130∗∗∗
(0.0337) (0.0315) (0.0328)
c) College degreeTotal Change in returns 0.0774 0.578∗∗∗ 0.345∗∗∗
(0.0620) (0.0498) (0.0460)
Change due to cognitive ability 0.0539 0.344∗∗∗ 0.156∗∗∗
(0.0405) (0.0424) (0.0349)
Change due to occupation 0.0236 0.234∗∗∗ 0.188∗∗∗
(0.0544) (0.0402) (0.0374)
N 1986 3052 1451
Table A7: Decomposing the change in returns to education.
NLSYOC-NLSY79 NLSY79-NLSY97High Some College High Some CollegeSchool College Graduate School College Graduate
Total Change 0.246∗∗∗ 0.385∗∗∗ 0.499∗∗∗ -0.145∗∗ -0.202∗∗ -0.230∗∗
in returns (0.0388) (0.0615) (0.0797) (0.0483) (0.0716) (0.0855)
Change due to 0.176∗∗∗ 0.241∗∗∗ 0.286∗∗∗ -0.120∗∗ -0.189∗∗∗ -0.184∗∗
Cognitive Ability (0.0311) (0.0474) (0.0589) (0.0379) (0.0499) (0.0677)
Change due to 0.0695∗∗ 0.144∗∗ 0.214∗∗ -0.0248 -0.0132 -0.0459Occupation (0.0262) (0.0468) (0.0675) (0.0315) (0.0570) (0.0682)
N 5038 5038 5038 4503 4503 4503
40

A.2.3 Non-White only
Table A8: Returns to education and cognitive ability across cohorts.
Partial specification Full SpecificationOriginal NLSY79 NLSY97 Original NLSY79 NLSY97Cohort Cohort
High School 0.107 0.853∗∗∗ 0.436∗∗∗ 0.0918 0.633∗∗∗ 0.239∗
(0.126) (0.134) (0.109) (0.127) (0.134) (0.102)
Some College 0.309∗ 1.117∗∗∗ 0.688∗∗∗ 0.316 0.660∗∗ 0.454∗∗∗
(0.156) (0.210) (0.149) (0.165) (0.214) (0.135)
College Graduate 0.734∗∗∗ 1.564∗∗∗ 0.926∗∗∗ 0.630∗∗∗ 0.789∗∗∗ 0.363∗∗
(0.139) (0.147) (0.114) (0.181) (0.167) (0.124)
Cognitive ability -0.0216 0.245∗∗∗ 0.205∗∗∗
(0.0760) (0.0547) (0.0293)
Professional, Technical 0.0311 0.753∗∗∗ 0.105& Kindred (0.217) (0.172) (0.112)
Managers, Officials 0.381 0.947∗∗ 0.310∗∗
& Proprietors (0.247) (0.314) (0.102)
Clerical & Kindred -0.220 -0.114 -0.226∗
(0.289) (0.269) (0.0941)
Sales Workers 0.396 0.642∗ 0.0185(0.436) (0.324) (0.105)
Service Workers -0.338∗ -0.383 -0.442∗∗∗
(0.172) (0.220) (0.0849)
Farm Workers -0.927 -0.742 0.342(0.482) (0.397) (0.243)
N 332 1526 845 332 1526 845
41

Table A9: Decomposing the returns to education due to cognitive ability and occupation.
(1) (2) (3)Original NLSY79 NLSY97Cohort
a) High SchoolTotal Change in returns 0.0150 0.220∗∗∗ 0.197∗∗∗
(0.0347) (0.0411) (0.0381)
Change due to cognitive ability -0.00622 0.151∗∗∗ 0.177∗∗∗
(0.0143) (0.0368) (0.0309)
Change due to occupation 0.0212 0.0685∗∗ 0.0207(0.0335) (0.0222) (0.0224)
b) Some CollegeTotal Change in returns -0.00693 0.457∗∗∗ 0.235∗∗∗
(0.0720) (0.0761) (0.0567)
Change due to cognitive ability -0.0219 0.264∗∗∗ 0.234∗∗∗
(0.0492) (0.0643) (0.0439)
Change due to occupation 0.0149 0.193∗∗∗ 0.00125(0.0601) (0.0531) (0.0357)
c) College degreeTotal Change in returns 0.104 0.775∗∗∗ 0.563∗∗∗
(0.139) (0.106) (0.0733)
Change due to cognitive ability -0.0275 0.336∗∗∗ 0.363∗∗∗
(0.0617) (0.0795) (0.0532)
Change due to occupation 0.132 0.439∗∗∗ 0.201∗∗∗
(0.133) (0.0944) (0.0598)
N 332 1526 845
Table A10: Decomposing the change in returns to education.
NLSYOC-NLSY79 NLSY79-NLSY97High Some College High Some CollegeSchool College Graduate School College Graduate
Total Change 0.205∗ 0.454∗∗ 0.641∗ -0.0150 -0.210 -0.202in returns (0.0858) (0.163) (0.292) (0.0704) (0.110) (0.165)
Change due to 0.157∗∗ 0.280∗ 0.353∗ 0.0298 -0.0237 0.0318Cognitive Ability (0.0525) (0.119) (0.145) (0.0610) (0.0899) (0.121)
Change due to 0.0478 0.173 0.288 -0.0449 -0.186∗∗ -0.234Occupation (0.0673) (0.126) (0.276) (0.0384) (0.0707) (0.141)
N 1858 1858 1858 2371 2371 2371
42