changes in the number and volume of fibrillar centres with...
TRANSCRIPT
Changes in the number and volume of fibrillar centres with the inactivation
of nucleoli at erythropoiesis
OLGA V. ZATSEPINA1*, PAVEL V. CHELIDZE2 and YURI S. CHENTSOV1
'/\. N. Belozersky Laboratory of Molecular Biology and Bioorgamc Chemistry, Moscoiv State University, Moscow 199899, USSR2Development Biology laboratory, Tbilisi State University, Tbilisi, USSR
* Author for correspondence
Summary
The number and volume of fibrillar centres, thestructural components of interphase cell nucleoli onthe surface of which rRNA is synthesized, havebeen studied in differentiating erythroblasts ofmouse embryo liver. Complete series of ultrathinsections of erythroblast nuclei have been used at themain stages of differentiation: proerythroblast,basophilic erythroblast, polychromatophilic eryth-roblast and normoblast. It has been shown that inthe active nucleoli of proerythroblasts the numberof fibrillar centres is correlated with cell ploidy andexceeds by several-fold the number of nucleolus-organizing regions of chromosomes. The total vol-umes of fibrillar centres in 1C (0-369 fun3) and 4C(0*749 jwm3) proerythroblasts are proportional tonumber of nucleolus-organizing regions. With thematuration of erythroblasts the total number of
fibrillar centres declines and in normoblasts it is 3-to 10-fold less than that of the nucleolus-organizingregions. The total volume of fibrillar centres innormoblasts (0-102//m3) is threefold smaller thanthat in proerythroblasts (0-369 ̂ im3), even thoughthe mean volumes of individual fibrillar centres aresignificantly higher (0-0042 jum3 in proerythroblastsand 0-039 in normoblasts). The optical density offibrillar centres in normoblasts can be higher com-pared with that of proerythroblasts. It has beensuggested that the inactivation of nucleoli at eryth-ropoiesis is accompanied by the fusion of indi-vidual fibrillar centres and, possibly, by the com-paction of their material.
Key words: erythropoiesis, fibrillar centres, nucleolus-organizing regions, morphometric analysis.
Introduction
It is known that clusters of ribosomal genes (r-genes) arelocated in definite regions of chromosomes, the so-called'nucleolus-organizing regions' (NORs) (Busch & Sme-tana, 1970; Smetana & Busch, 1974; Goessens, 1984;Hadjiolov, 1985). A caryologic analysis of metaphasechromosomes shows a strictly definite and stable numberof NORs, specific for each species (Long & Dawid,1980), although the number of active NORs determinedby silver-staining may show considerable variation evenamong cells of the same organism (Goessens, 1984). Ininterphase nucleoli the r-genes are concentrated in fibril-lar centres (FCs) and in the dense fibrillar component,which may correspond to the regions of newly syn-thesized rRNA (Goessens, 1984; Hadjiolov, 1985). Acomparison of the ultrastructure of FCs in many cellsindicates their significant morphological similarity. Butfar less constant are the quantitative characteristics ofFCs, i.e. the number and the volume. The causes of suchvariety are still obscure. According to some authors, thenumber of FCs indicates, first and foremost, the nu-
Journal of Cell Science 91, 439-448 (1988)Printed in Great Britain © The Company of Biologists Limited 1988
cleolar functional activity level (Jordan & McGovern,1981; Mirre & Kniebiehler, 1982, 1984; Kniebiehler etal. 1983; Vagner-Capodano et al. 1984; Hozak et al.1986). This supposition is based on investigations of cells(e.g. mouse oocytes, human fibroblasts, lymphocytes ofperipheral human blood, pig kidney cells, neurones of ratspinal ganglia) in which the number of FCs increaseswith the activation of r-genes and decreases with theirinactivation (Jordan & McGovern, 1981; Chelidze, 1982;Raska et al. 1983; Mirre & Kniebiehler, 1984; Vagner-Capodano et al. 1984; Pebusque et al. 1985; Hozdk et al.1986). Much less is known about the dependence of thenumber of FCs on the amount of r-gene copies. It is onlyin the work of Mirre & Kniebiehler (1984) that data havebeen cited showing that the maximal number of FCs maybe correlated with the number of ribosomal cistrons; inmouse Sertoli diploid cells as many as 50 FCs, and intetraploid oocytes about 100 FCs, were detected. Thedependence of changes in FC volume with the degree ofnucleolar functional activity has not been explored either.According to preliminary data, the linear dimensions ofindividual FCs decrease with the growth and activation of
439
nucleoli, whereas the total volume of FCs is progressivelyon the increase (Mirre & Kniebiehler, 1984; Hozak et al.1986). There is to date contradictory evidence on thecorrelation between the number of FCs and that ofNORs. There are cells in which the number of FCssignificantly exceeds that of NORs (Mirre & Kniebiehler,1982, 1984; Seite & Pebusque, 1985; Pebusque et al.1985; Hozak et al. 1986), but there are also others inwhich the reverse has been observed (Raska et al. 1983;Devictor et al. 1984).
The present work deals with the structural and quanti-tative parameters of FCs in the process of naturalinactivation of nucleoli. As test models we used differen-tiating mouse erythroblasts: proerythroblasts (PEB),basophilic erythroblasts (BEB), polychromatophilicerythroblasts (PCB) and normoblasts (NB) in whichrRNA synthesis is arrested by the maturation process(Busch & Smetana, 1970; Smetana & Busch, 1974). Wealso attempted to determine the dependence of changes inthe number and volume of FCs on the number of NORsin the cell, by analysing active nucleoli in 2C and 4CPEBs. Cell ploidy was determined according to the dataon the number and structure of centrioles in mouse cells(Onishchenko, 1978; Vorobjev & Chentsov, 1987).
Materials and methods
The liver of 12- to 14-day mouse embryos is a convenient organin which to observe maturing erythroid cells (Rhodin, 1974).Liver pieces from a 12-day embryo were fixed with 2 5 %glutaraldehyde in 0-1 M-phosphate buffer (pH 7-2-7-4) for 2hat 4°C, washed with the same buffer and postfixed with abuffered 1 % solution of OsC>4 for 2h at 4°C. Then the pieceswere dehydrated in a series of ethanol at increasing concen-trations (70° ethanol contained 2% uranyl acetate), washed inabsolute acetone and embedded in Epon. Ultrathin serialsections (0-1 ̂ m) were prepared on a LKB-II1 ultramicrotome.After the ultrathin sections had been contrasted with lead citrateaccording to the Reynolds procedure, they were examinedunder HU-11B and HU-12 electron microscopes. The nucleoliwere photographed at a magnification of X10 000. Then under aphotographic enlarger (final magnification was X 50 000), thecontours of the nucleoli and FCs were drawn and, with aHewlett-Packard computer, their surface areas were deter-mined. The volumes of the nucleoli and FCs were calculatedaccording to the formula:
V=t.S-D,where S is the cross-section area, D is the thickness of thesection, equal to 0-1 [lm, and n is the number of sections. Toobtain planar images of the nucleoli and FCs, the contours ofthe structures were drawn on transparent films, which thenwere collated and photographed. The compaction of the densefibrillar material within FCs was determined with an MF-4densitometer. Optical density measurements were performedon the negative cell images, photographed on the same sectionand developed under identical conditions. In all these tech-niques we also took proper account of background opticaldensities (i.e. in intercellular spaces devoid of any structures).We made 20-30 measurements of the optical density of eachFC. The statistical processing of the results was performedaccording to Student's criterion.
We know that proerythroblasts and basophilic erythroblastsare proliferation-capable cells (Rhodin, 1974; Smetana &
Busch, 1974). For this reason they may be at any stage of thecell cycle: G), S or G2 period, and thus have different ploidy.In order to determine cell ploidy on ultrathin sections, we usedthe structural data of the centnolar apparatus in interphasemouse cells (Onishchenko, 1978; Vorobjev & Chentsov, 1987).It was shown that mouse cells containing two adjacent centriolesare in the Gi period, while the two pairs of centrioles are at theend of the S and in the G2 period. It may be inferred on thebasis of these data that of the five PEBs studied by us, threepersisted in the Gi (or early S) period, i.e. were 2C, and theother two were in the late S and in the G2 period, i.e. were 4C.All the basophilic erythroblasts were 2C.
Overall, we studied five PEBs, five BEBs, three PCBs and sixNBs.
Results
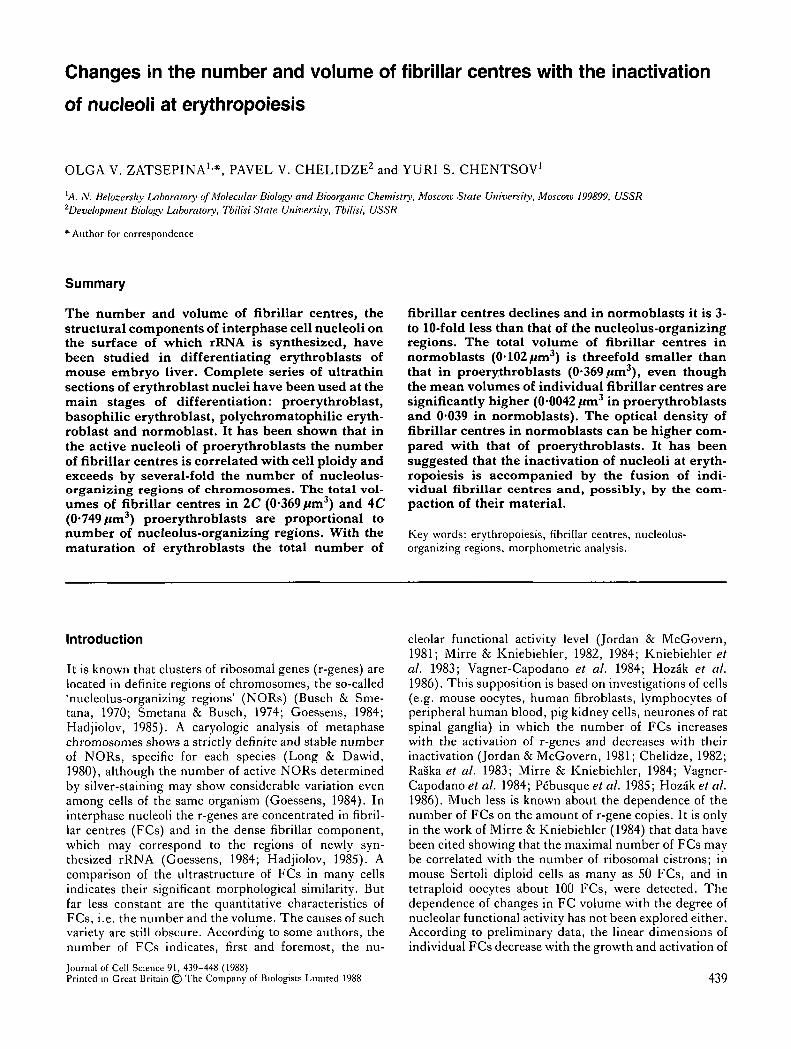
Fig. 1A represents a region of mouse embryo liver sectionphotographed at low magnification. It shows distinctlydividing and non-dividing erythroid cells at differentmaturation stages. Proerythroblasts, basophilic erythro-blasts, polychromatophilic erythroblasts and normoblastsare easily identifiable by size, the structure of the nucleusand the presence of haemoglobin in the cytoplasm.
Proeiythroblasts (Figs 1, 2A,B)These are large cells, measuring 10-12 fim in diameter,containing round or ovoid nuclei with a small amount ofcompact chromatin. Usually a single large nucleolus ofthe nucleolonemal type is detectable in the nuclei(Fig. 1A,B). Distinctly visible in the nucleoli are RNPgranules, FCs surrounded by a layer of the RNP fibrillarcomponent and numerous small vacuoles (interstices)(Figs ID, 2A). The peri- and intranucleolar chromatinsare not significantly present.
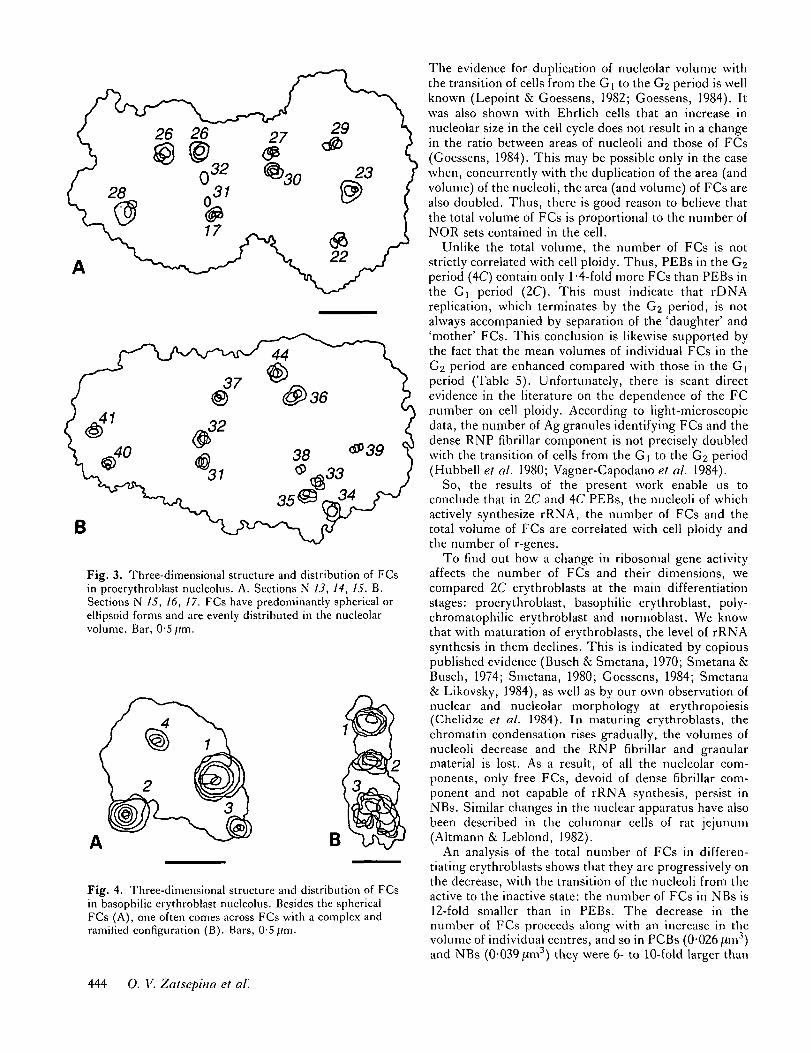
An analysis of ultrathin sections shows that in PEBsFCs have predominantly spherical or ellipsoid forms andare evenly distributed in the nucleolar volume (Fig. 3).
The results of the morphometric analysis of FCs in 2Cand AC PEBs are shown in Table 1.
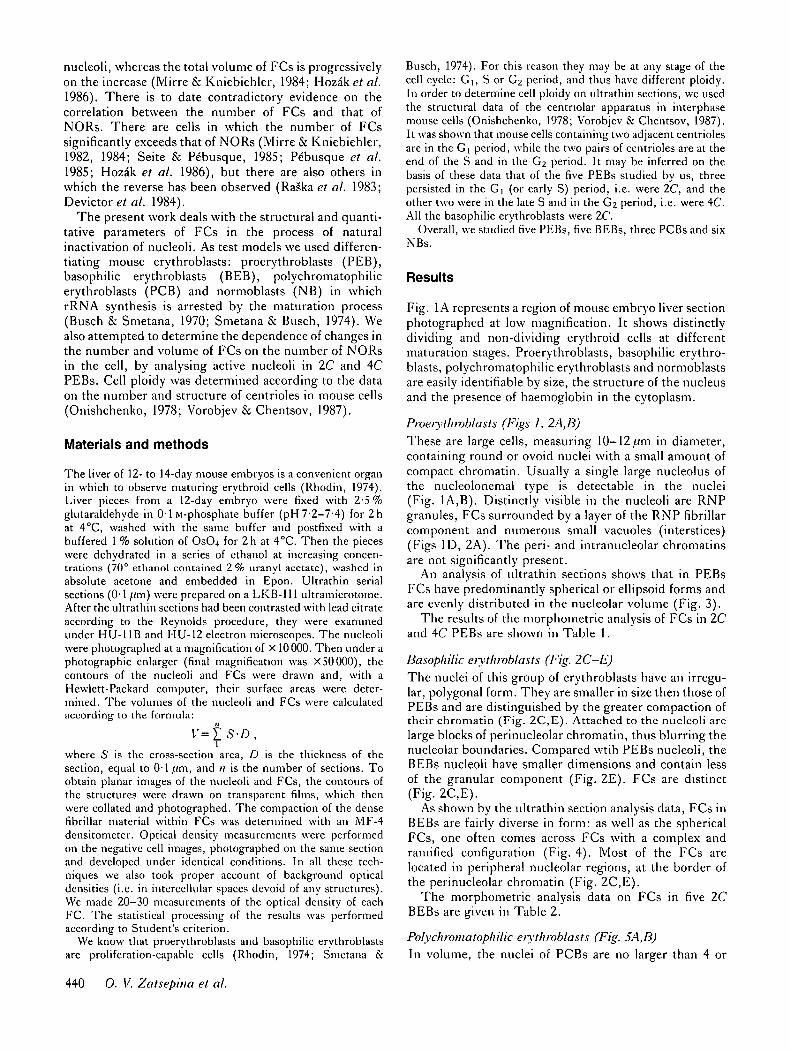
Basophilic erythroblasts (Fig. 2C-E)The nuclei of this group of erythroblasts have an irregu-lar, polygonal form. They are smaller in size then those ofPEBs and are distinguished by the greater compaction oftheir chromatin (Fig. 2C,E). Attached to the nucleoli arelarge blocks of perinucleolar chromatin, thus blurring thenucleolar boundaries. Compared wtih PEBs nucleoli, theBEBs nucleoli have smaller dimensions and contain lessof the granular component (Fig. 2E). FCs are distinct(Fig. 2C,E).
As shown by the ultrathin section analysis data, FCs inBEBs are fairly diverse in form: as well as the sphericalFCs, one often comes across FCs with a complex andramified configuration (Fig. 4). Most of the FCs arelocated in peripheral nucleolar regions, at the border ofthe perinucleolar chromatin (Fig. 2C,E).
The morphometric analysis data on FCs in five 2CBEBs are given in Table 2.
Polychromatophilic eiythroblasts (Fig. 5A,B)In volume, the nuclei of PCBs are no larger than 4 or
440 O. V. Zatsepina et al.
Fig. 1. Ultrathin section of 12-day-old mouse embryo (A), general view of 2C proerythroblast (B), its centriolar apparatus (C)and fragment of the nueleolus in proerythroblast (D). D. Arrows indicate FCs. PEB, proerythroblast; BEB, basophilicerythroblast; PCB, polychromatophilic erythroblast; NB, normoblast. dc. Dividing cell; ;;, nucleus; /;//, nueleolus; c,cytoplasm;/, fibrillar component; g, granular component. Bars: A, 3 ftm; B,C, 1 ^m; D, 0-5 j.lm.
Fibiillar centre changes at erythmpoiesis 441
Fig. 2. Fragment of proerythroblast nucleolus (A) containing four centrioles (B), general view of the basophilic erythroblastnucleus (C), containing two centrioles (D) and a region of its nucleolus (E). A,E. Arrows indicate FCs. n, nucleus;mi, nucleolus; c, cytoplasm; cell, condensed chromatin; g, granular component;/, fibrillar component. Bars: E, 0-5jum;A-D,F,G, lftm.
442 0. V. Zatsepina et al.
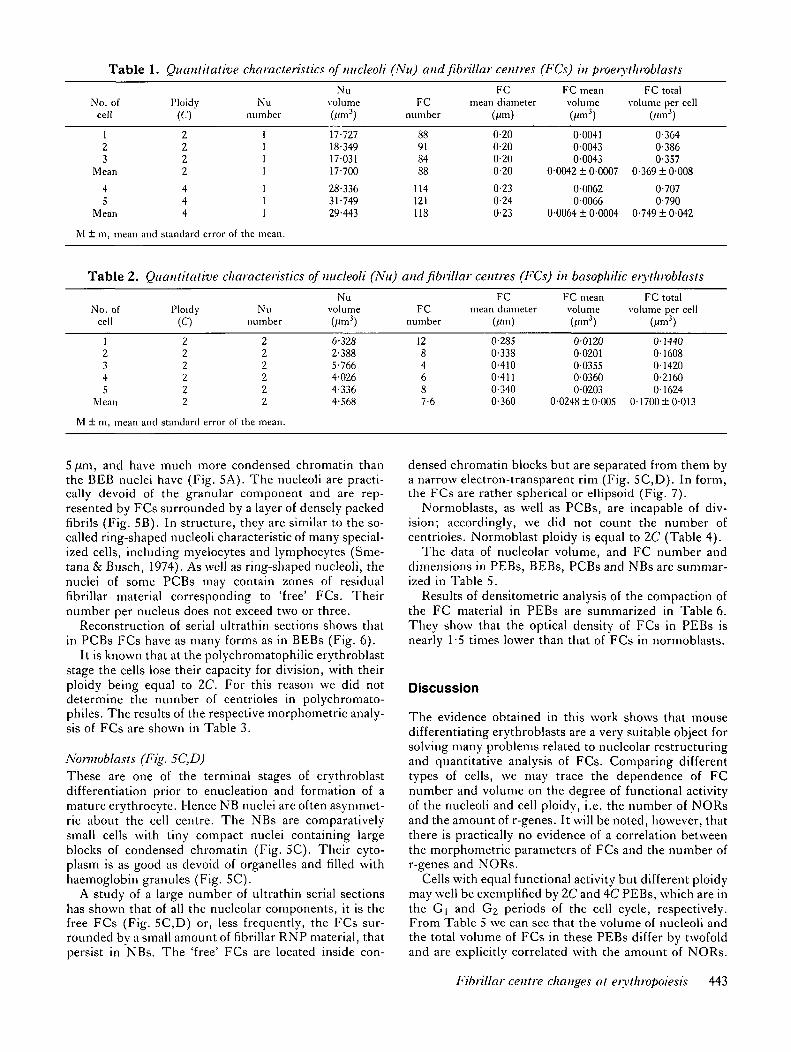
Table 1. Quantitative characteristics of micleoli (Nu) and fibnllar centres (FCs) in piveiythroblasts
No. ofcell
Ploidy(C)
Nunumber
Nuvolume FC
number
FCmean diameter
FC meanvolume
FC totalvolume per cell
dm3)
123
Mean
45
Mean
2222
444
17-72718-34917-03117-700
28-33631-74929-443
88918488
114121118
0-200-200-200-20
0-230-240-23
0-00410-00430-0043
0-0042 ± 0-0007
0-00620-0066
0-0064 ± 0-0004
0-3640-3860-357
0-369 ±0-008
0-7070-790
0-749 ± 0-042
M ± m, mean
Table 2.
No. ofcell
and standard error of the mean.
Quantitative
Ploidy(C)
characteristics
Nunumber
of micleoli
Nuvolume(A<m3)
(Nu) and fibrillai
FCnumber
• centres (FCs)
FCmean diameter
(fim)
in basophilic
FC meanvolume(,<m3)
erythroblasts
FC totalvolume per cell
(/<m3)
12345
Mean
M ± m, mean
222222
and standard
222222
error of the mean.
6-3282-3885-7664-0264-3364-568
1284687-6
0-2850-3380-4100-4110-3400-360
001200-02010-03550 036000203
0-0248 ± 0-005
0-14400-16080-14200-216001624
0-1700 ±0-013
5 jUm, and have much more condensed chromatin thanthe BEB nuclei have (Fig. 5A). The nucleoli are practi-cally devoid of the granular component and are rep-resented by FCs surrounded by a layer of densely packedfibrils (Fig. 5B). In structure, they are similar to the so-called ring-shaped nucleoli characteristic of many special-ized cells, including myelocytes and lymphocytes (Sme-tana & Busch, 1974). As well as ring-shaped nucleoli, thenuclei of some PCBs may contain zones of residualfibrillar material corresponding to 'free' FCs. Theirnumber per nucleus does not exceed two or three.
Reconstruction of serial ultrathin sections shows thatin PCBs FCs have as many forms as in BEBs (Fig. 6).
It is known that at the polychromatophilic erythroblaststage the cells lose their capacity for division, with theirploidy being equal to 2C. For this reason we did notdetermine the number of centrioles in polychromato-philes. The results of the respective morphometric analy-sis of FCs are shown in Table 3.
Nonnoblasts (Fig. 5C,D)These are one of the terminal stages of erythroblastdifferentiation prior to enucleation and formation of amature erythrocyte. Hence NB nuclei are often asymmet-ric about the cell centre. The NBs are comparativelysmall cells with tiny compact nuclei containing largeblocks of condensed chromatin (Fig. SC). Their cyto-plasm is as good as devoid of organelles and filled withhaemoglobin granules (Fig. 5C).
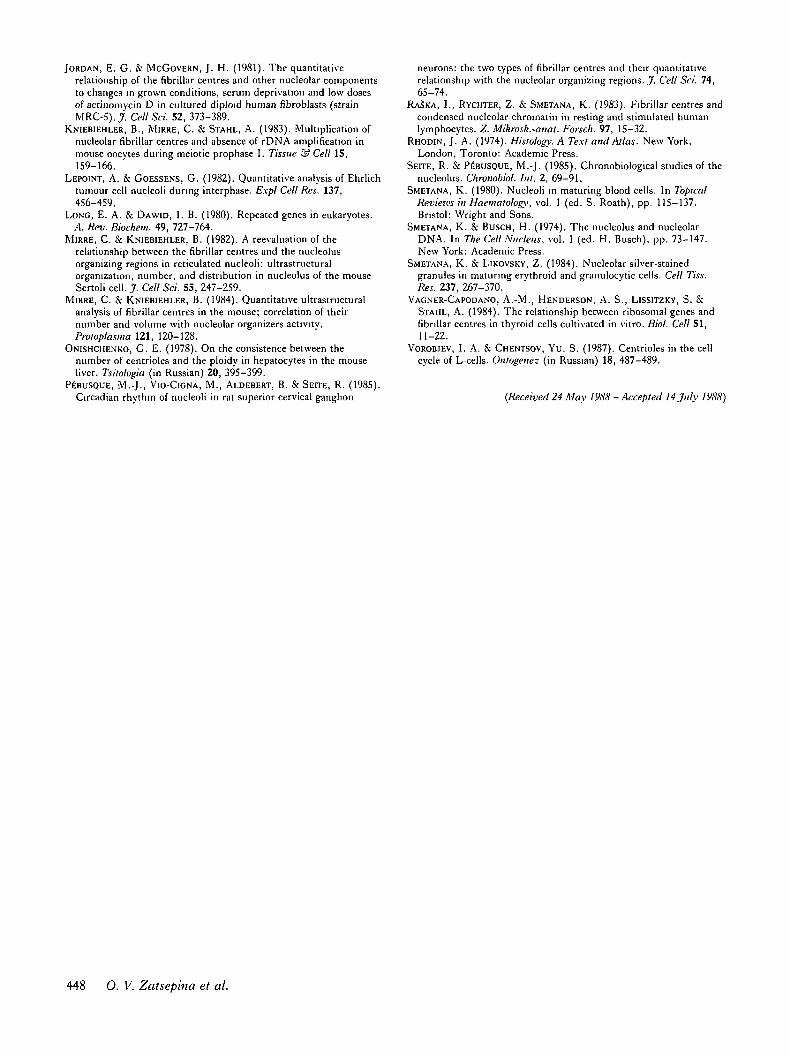
A study of a large number of ultrathin serial sectionshas shown that of all the nucleolar components, it is thefree FCs (Fig. 5C,D) or, less frequently, the FCs sur-rounded by a small amount of fibrillar RNP material, thatpersist in NBs. The 'free' FCs are located inside con-
densed chromatin blocks but are separated from them bya narrow electron-transparent rim (Fig. 5C,D). In form,the FCs are rather spherical or ellipsoid (Fig. 7).
Normoblasts, as well as PCBs, are incapable of div-ision; accordingly, we did not count the number ofcentrioles. Normoblast ploidy is equal to 2C (Table 4).
The data of nucleolar volume, and FC number anddimensions in PEBs, BEBs, PCBs and NBs are summar-ized in Table 5.
Results of densitometric analysis of the compaction ofthe FC material in PEBs are summarized in Table 6.They show that the optical density of FCs in PEBs isnearly 1-5 times lower than that of FCs in normoblasts.
Discussion
The evidence obtained in this work shows that mousedifferentiating erythroblasts are a very suitable object forsolving many problems related to nucleolar restructuringand quantitative analysis of FCs. Comparing differenttypes of cells, we may trace the dependence of FCnumber and volume on the degree of functional activityof the nucleoli and cell ploidy, i.e. the number of NORsand the amount of r-genes. It will be noted, however, thatthere is practically no evidence of a correlation betweenthe morphometric parameters of FCs and the number ofr-genes and NORs.
Cells with equal functional activity but different ploidymay well be exemplified by 2C and 4C PEBs, which are inthe Gi and G2 periods of the cell cycle, respectively.From Table 5 we can see that the volume of nucleoli andthe total volume of FCs in these PEBs differ by twofoldand are explicitly correlated with the amount of NORs.
Fibrillar centre changes at eiythropoiesis 443
B
Fig. 3. Three-dimensional structure and distribution of FCsin proerythroblast nucleolus. A. Sections N 13, 14, 15. B.Sections N 15, 16, 17. FCs have predominantly spherical orellipsoid forms and are evenly distributed in the nucleolarvolume. Bar, 0-5 fim.
Fig. 4. Three-dimensional structure and distribution of FCsin basophilic erythroblast nucleolus. Besides the sphericalFCs (A), one often comes across FCs with a complex andramified configuration (B). Bars, 0-5//m.
The evidence for duplication of nucleolar volume withthe transition of cells from the Gj to the G2 period is wellknown (Lepoint & Goessens, 1982; Goessens, 1984). Itwas also shown with Ehrlich cells that an increase innucleolar size in the cell cycle does not result in a changein the ratio between areas of nucleoli and those of FCs(Goessens, 1984). This may be possible only in the casewhen, concurrently with the duplication of the area (andvolume) of the nucleoli, the area (and volume) of FCs arealso doubled. Thus, there is good reason to believe thatthe total volume of FCs is proportional to the number ofNOR sets contained in the cell.
Unlike the total volume, the number of FCs is notstrictly correlated with cell ploidy. Thus, PEBs in the G2period (4C) contain only 1-4-fold more FCs than PEBs inthe Gi period (2C). This must indicate that rDNAreplication, which terminates by the G2 period, is notalways accompanied by separation of the 'daughter' and'mother' FCs. This conclusion is likewise supported bythe fact that the mean volumes of individual FCs in theG2 period are enhanced compared with those in the Gjperiod (Table 5). Unfortunately, there is scant directevidence in the literature on the dependence of the FCnumber on cell ploidy. According to light-microscopicdata, the number of Ag granules identifying FCs and thedense RNP fibrillar component is not precisely doubledwith the transition of cells from the G| to the G2 period(Hubbell et al. 1980; Vagner-Capodano et al. 1984).
So, the results of the present work enable us toconclude that in 2C and 4C PEBs, the nucleoli of whichactively synthesize rRNA, the number of FCs and thetotal volume of FCs are correlated with cell ploidy andthe number of r-genes.
To find out how a change in ribosomal gene activityaffects the number of FCs and their dimensions, wecompared 2C erythroblasts at the main differentiationstages: proerythroblast, basophilic erythroblast, poly-chromatophilic erythroblast and normoblast. We knowthat with maturation of erythroblasts, the level of rRNAsynthesis in them declines. This is indicated by copiouspublished evidence (Busch & Smetana, 1970; Smetana &Busch, 1974; Smetana, 1980; Goessens, 1984; Smetana& Likovsky, 1984), as well as by our own observation ofnuclear and nucleolar morphology at erythropoiesis(Chelidze et al. 1984). In maturing erythroblasts, thechromatin condensation rises gradually, the volumes ofnucleoli decrease and the RNP fibrillar and granularmaterial is lost. As a result, of all the nucleolar com-ponents, only free FCs, devoid of dense fibrillar com-ponent and not capable of rRNA synthesis, persist inNBs. Similar changes in the nuclear apparatus have alsobeen described in the columnar cells of rat jejunum(Altmann & Leblond, 1982).
An analysis of the total number of FCs in differen-tiating erythroblasts shows that they are progressively onthe decrease, with the transition of the nucleoli from theactive to the inactive state: the number of FCs in NBs is12-fold smaller than in PEBs. The decrease in thenumber of FCs proceeds along with an increase in thevolume of individual centres, and so in PCBs (0-026/im3)and NBs (0-039 ;Um3) they were 6- to 10-fold larger than
444 O. V. Zatsepina et al.
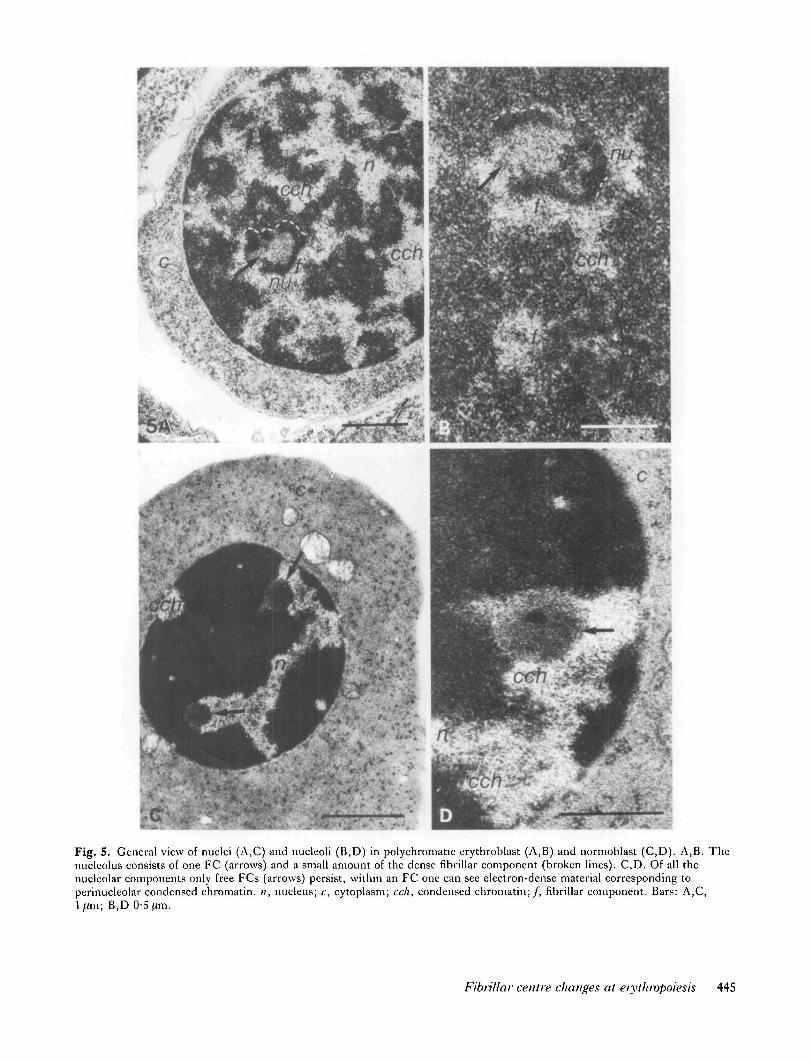
cFig. 5. General view of nuclei (A,C) and nucleoli (B,D) in polychromatic erythroblast (A,B) and normoblast (C,D). A,B. Thenuclcolus consists of one FC (arrows) and a small amount of the dense fibrillar component (broken lines). C,D. Of all thenucleolar components only free FCs (arrows) persist, within an FC one can see electron-dense material corresponding toperinucleolar condensed chromatin. n, nucleus; c, cytoplasm; cell, condensed chromatin;/, fibrillar component. Bars: A,C,ljum; B,D 0-5 fim.
Fibrillar centre changes at eiythropoiesis 445
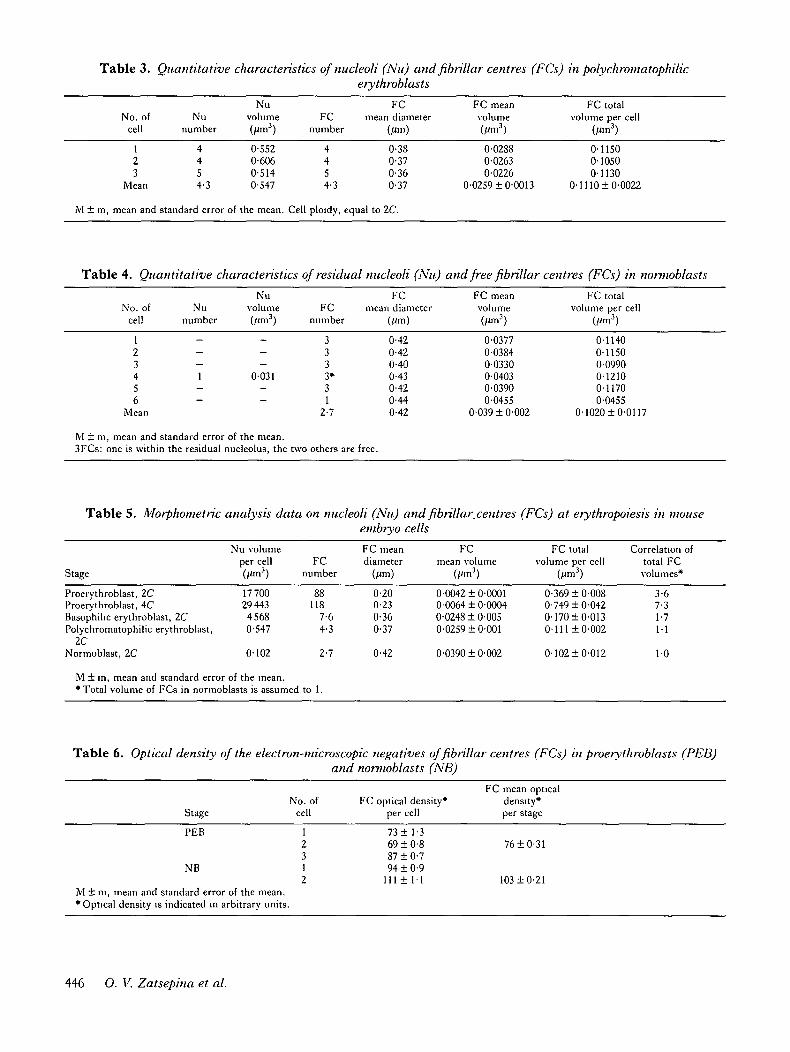
Table 3. Quantitative characteristics of nucleoli (Nu) and fibrillar centres (FCs) in polychromatophilicerythroblasts
No. ofcell
Nunumber
Nuvolume FC
number
FCmean diameter
(/an)
FC meanvolume(Mm3)
FC totalvolume per cell
(Urn3)
123
Mean
4454-3
0-5520-6060-5140-547
4454-3
0-380-370-360-37
0-02880-02630-0226
0-0259 ±0-0013
0-11500-10500-1130
0-1110 ±0-0022
M + m, mean and standard error of the mean. Cell ploidy, equal to 2C.
Table 4. Quantitative characteristics of residual nucleoli (Nu) and free fibrillar centres (FCs) in nonnoblasts
No. ofcell
Nunumber
Nuvolume(Mm3)
FCnumber
FCmean diameter
(Urn)
FC meanvolume
FC totalvolume per cell
(//m3)
12 - -3 - -4 1 00315 - -6 - -
Mean
M + m, mean and standard error of the mean.3FCs: one is within the residual nucleolus, the two others are free.
3333*31
2-7
0-420-420-400-430-420-440-42
0-03770-03840-03300-04030-03900-0455
0-039 ± 0-002
0-11400-11500-09900-12100-11700-0455
0-1020 ±0-0117
Table 5. Morphometric analysis data on nucleoli (Nu) and fibrillar.centres (FCs) at erythropoiesis in mouseembryo cells
Stage
Nu volumeper cell
3FC
number
FC meandiameter
FCmean volume
FC totalvolume per cell
3
Correlation oftotal FCvolumes*
Proerythroblast, 2CProerythroblast, ACBasophihc erythroblast, 2CPolychromatophilic erythroblast,
1CNormoblast, 2C
M ± m, mean and standard error of the mean.•Total volume of FCs in normoblasts is assumed to 1.
17 70029 44345680-547
0-102
88118
7-64-3
2-7
0-200-230-360-37
0-42
0-0042 ± 0-00010-0064 ± 0-00040-0248 ± 0-0050-0259 ±0-001
0-0390 ± 0-002
0-369 ±0-0080-749 ±0-0420-170 ±0-0130-111 ±0-002
0-102 ±0-012
3-67-31-71-1
10
Table 6. Optical density of the electron-microscopic negatives of fibrillar centres (FCs) in proerythroblasts (PEB)and nonnoblasts (NB)
StageNo. of
cellFC optical density*
per cell
FC mean opticaldensity*per stage
PEB
NB
M ± m, mean and standard error of the mean.•Optical density is indicated in arbitrary units.
12312
73 ± 1-369 ± 0-887 ±0-794 ±0-9
111± 11
76 ±0-31
103 ±0-21
446 0. V. Zatsepina et al.
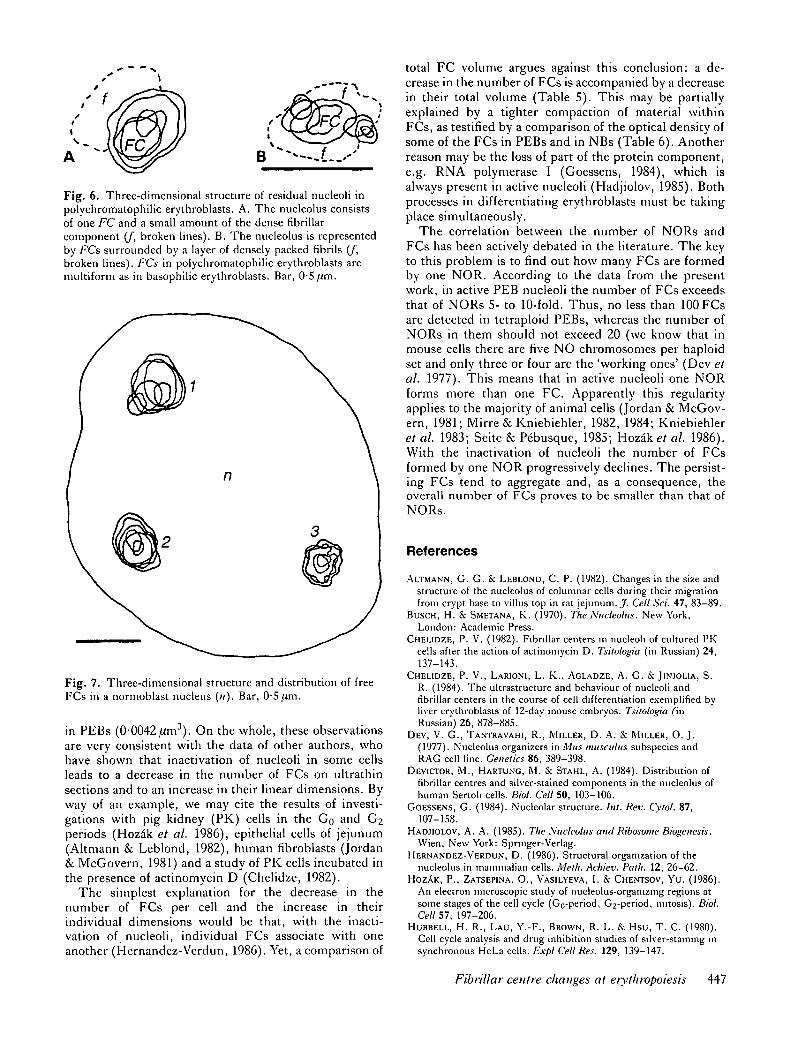
Fig. 6. Three-dimensional structure of residual nucleoli inpolychromatophilic erythroblasts. A. The nucleolus consistsof one FC and a small amount of the dense fibrillarcomponent (/, broken lines). B. The nucleolus is representedby FCs surrounded by a layer of densely packed fibrils (/,broken lines). FCs in polychromatophilic erythroblasts aremultiform as in basophilic erythroblasts. Bar, 0-5 fim.
Fig. 7. Three-dimensional structure and distribution of freeFCs in a normoblast nucleus (w). Bar, 0-5 fim.
in PEBs (0-0042 ^im3). On the whole, these observationsare very consistent with the data of other authors, whohave shown that inactivation of nucleoli in some cellsleads to a decrease in the number of FCs on ultrathinsections and to an increase in their linear dimensions. Byway of an example, we may cite the results of investi-gations with pig kidney (PK) cells in the Go and G2periods (Hoz&k et al. 1986), epithelial cells of jejunum(Altmann & Leblond, 1982), human fibroblasts (Jordan& McGovern, 1981) and a study of PK cells incubated inthe presence of actinomycin D (Chelidze, 1982).
The simplest explanation for the decrease in thenumber of FCs per cell and the increase in theirindividual dimensions would be that, with the inacti-vation of nucleoli, individual FCs associate with oneanother (Hernandez-Verdun, 1986). Yet, a comparison of
total FC volume argues against this conclusion: a de-crease in the number of FCs is accompanied by a decreasein their total volume (Table 5). This may be partiallyexplained by a tighter compaction of material withinFCs, as testified by a comparison of the optical density ofsome of the FCs in PEBs and in NBs (Table 6). Anotherreason may be the loss of part of the protein component,e.g. RNA polymerase I (Goessens, 1984), which isalways present in active nucleoli (Hadjiolov, 1985). Bothprocesses in differentiating erythroblasts must be takingplace simultaneously.
The correlation between the number of NORs andFCs has been actively debated in the literature. The keyto this problem is to find out how many FCs are formedby one NOR. According to the data from the presentwork, in active PEB nucleoli the number of FCs exceedsthat of NORs 5- to 10-fold. Thus, no less than 100 FCsare detected in tetraploid PEBs, whereas the number ofNORs in them should not exceed 20 (we know that inmouse cells there are five NO chromosomes per haploidset and only three or four are the 'working ones' (Dev etal. 1977). This means that in active nucleoli one NORforms more than one FC. Apparently this regularityapplies to the majority of animal cells (Jordan & McGov-ern, 1981; Mirre & Kniebiehler, 1982, 1984; Kniebiehleret al. 1983; Seite & Pe"busque, 1985; Hozak et al. 1986).With the inactivation of nucleoli the number of FCsformed by one NOR progressively declines. The persist-ing FCs tend to aggregate and, as a consequence, theoverall number of FCs proves to be smaller than that ofNORs.
References
ALTMANN, G. G. & LEBLOND, C. P. (1982). Changes in the size andstructure of the nucleolus of columnar cells during their migrationfrom crypt base to villus top in rat jejunum. J. Cell Sci. 47, 83-89.
BUSCH, H. & SMETANA, K. (1970). The Nucleolus. New York,London: Academic Press.
CHELIDZE, P. V. (1982). Fibrillar centers in nucleoli of cultured PKcells after the action of actinomycin D. Tsitologia (in Russian) 24,137-143.
CHELIDZE, P. V., LARIONI, L. K., AGLADZE, A. G. & JINJOLIA, S.
R. (1984). The infrastructure and behaviour of nucleoli andfibrillar centers in the course of cell differentiation exemplified byliver erythroblasts of 12-day mouse embryos. Tsitologia finRussian) 26, 878-885.
DEV, V. G., TANTRAVAHI, R., MILLER, D. A. & MILLER, O. J.
(1977). Nucleolus organizers in Mus musculiis subspecies andRAG cell line. Genetics 86, 389-398.
DEVICTOR, M., HARTUNG, M. & STAHL, A. (1984). Distribution of
fibrillar centres and silver-stained components in the nucleolus ofhuman Sertoli cells. Biol. Cell 50, 103-106.
GOESSENS, G. (1984). Nucleolar structure. /;//. Rev. Cvtol. 87,107-158.
HADJIOLOV, A. A. (1985). The Nucleolus and Ribosome Biogenesis.Wien, New York: Springer-Verlag.
HERNANDEZ-VERDUN, D. (1986). Structural organization of thenucleolus in mammalian cells. Meth. Achiev. Path. 12, 26-62.
HOZAK, P., ZATSEPINA, O., VASILYEVA, I. & CHENTSOV, YU. (1986).
An electron microscopic study of nucleolus-organizing regions atsome stages of the cell cycle (Go-period, G2-period, mitosis). Biol.Cell 57, 197-206.
HUBBELL, H. R., LAU, Y.-F., BROWN, R. L. & Hsu, T. C. (1980).Cell cycle analysis and drug inhibition studies of silver-staining insynchronous HeLa cells. Expl Cell Res. 129, 139-147.
Fibrillar centre changes at erythropoiesis 447
JORDAN, E. G. & MCGOVERN, J. H. (1981). The quantitativerelationship of the fibrillar centres and other nucleolar componentsto changes in grown conditions, serum deprivation and low dosesof actinomycin D in cultured diploid human fibroblasts (strainMRC-5).J. CellSci. 52, 373-389.
KNIEBIEHLER, B., MIRRE, C. & STAHL, A. (1983). Multiplication of
nucleolar fibrillar centres and absence of rDNA amplification inmouse oocytes during meiotic prophase I. Tissue & Cell 15,159-166.
LEPOINT, A. & GOESSENS, G. (1982). Quantitative analysis of Ehrlichtumour cell nucleoli during interphase. Expl Cell Res. 137,456-459.
LONG, E. A. & DAWID, I. B. (1980). Repeated genes in eukaryotes.A. Rev. Biochem. 49, 727-764.
MIRRE, C. & KNIEBIEHLER, B. (1982). A revaluation of therelationship between the fibrillar centres and the nucleolusorganizing regions in reticulated nucleoli: ultrastructuralorganization, number, and distribution in nucleolus of the mouseSertoli cell. J. Cell Sci. 55, 247-259.
MIRRE, C. & KNIEBIEHLER, B. (1984). Quantitative ultrastructuralanalysis of fibrillar centres in the mouse; correlation of theirnumber and volume with nucleolar organizers activity.Protoplasma 121, 120-128.
ONISHCHENKO, G. E. (1978). On the consistence between thenumber of centrioles and the ploidy in hepatocytes in the mouseliver. Tsitologia (in Russian) 20, 395-399.
PEBUSQUE, M.-J., VIO-CIGNA, M., ALDEBERT, B. & SEITE, R. (1985).
Circadian rhythm of nucleoli in rat superior cervical ganglion
neurons: the two types of fibrillar centres and their quantitativerelationship with the nucleolar organizing regions. J. Cell Sci. 74,65-74.
RASKA, I., RYCHTER, Z. & SMETANA, K. (1983). Fibrillar centres andcondensed nucleolar chromatin in resting and stimulated humanlymphocytes. Z. Mikrosk.-anat. Forsch. 97, 15-32.
RHODIN, J. A. (1974). Histology. A Text and Atlas. New York,London, Toronto: Academic Press.
SEITE, R. & P6BUSQUE, M.-J. (1985). Chronobiological studies of thenucleolus. Chronobiol. Int. 2, 69-91.
SMETANA, K. (1980). Nucleoli in maturing blood cells. In TopicalReviews in Haematology, vol. 1 (ed. S. Roath), pp. 115-137.Bristol: Wright and Sons.
SMETANA, K. & BUSCH, H. (1974). The nucleolus and nucleolarDNA. In The Cell Nucleus, vol. 1 (ed. H. Busch), pp. 73-147.New York: Academic Press.
SMETANA, K. & LIKOVSKY, Z. (1984). Nucleolar silver-stainedgranules in maturing erythroid and granulocytic cells. Cell Tiss.Res. 237, 267-370.
VAGNER-CAPODANO, A.-M., HENDERSON, A. S., LISSITZKY, S. &
STAHL, A. (1984). The relationship between ribosomal genes andfibrillar centres in thyroid cells cultivated in vitro. Biol. Cell 51,11-22.
VOROBJEV, I. A. & CHENTSOV, YU. S. (1987). Centrioles in the cellcycle of L-cells. Ontogenez (in Russian) 18, 487-489.
{Received 24 May 1988 - Accepted 14 July 1988)
448 O. V. Zatsepina et al.