changes in the hydrological character of rainfall on the
TRANSCRIPT

HYDROLOGICAL PROCESSESHydrol. Process. 26, 1752–1766 (2012)Published online 23 May 2012 in Wiley Online Library(wileyonlinelibrary.com) DOI: 10.1002/hyp.9383
Changes in the hydrological character of rainfall on theCanadian prairies
Kevin Shook* and John PomeroyCentre for Hydrology, Saskatoon, Saskatchewan, Canada
*CSas
Co
Abstract:
Many studies have examined trends in the amount and phase of precipitation on the Canadian prairies over the period of recordbut without considering the unusual hydrology and hydrography of the region. On the Canadian prairies, runoff is primarily dueto spring snowmelt over frozen soils but can also be caused by intense rainfall from summer thunderstorms. The fraction ofspring snowmelt forming runoff is strongly influenced by the rate of melt and the presence of ice layers near the surface in frozensoils or at the base of the snowpack, all of which can be influenced by rainfall in the spring and late fall. Precipitation intensitiessufficient to cause runoff are generally due to small, intense convective storms, which are prevalent during the summer months.Historical records of the fraction ofmonthly precipitation falling as rain, obtained from theHistorical Adjusted Climate Database forCanada (HACDC), were found to display statistically significant increasing trends over the periods 1901–2000 and 1951–2000 atmany locations on the Canadian prairies. The fraction of stations showing significant trends, and the importance of the trends, werestrongly dependent on the month of the year.Single-day summer rainfalls are believed to be primarily convective in theCanadian prairies.Historical records obtained fromHACDCindicate that the hydrological importance of single-day summer rainfalls has not increased and has shown significant decreases at manylocations over the periods 1901–2000 and 1951–2000. Conversely, the hydrological importance of summer multiple-day rain eventshas not decreased and has significantly increased at many locations over the periods analysed.Multiscaling analyses of summer rainfall events demonstrated that the temporal uniformity of rainfall on the Canadian prairies hasincreased over the periods 1901–2000 and 1951–2000. Analyses of the ratios of rainfall over multiple days demonstrate significanttrends over the same periods, confirming the general tendency to temporal uniformity over scales between 1 and 32 days. Longerrain events strongly suggest greater spatial extents for storms and therefore the potential for increasing tendencies to promotebasin-scale rainfall–runoff events such as seen in 2011 in the region. Copyright © 2012 John Wiley & Sons, Ltd.
KEY WORDS rainfall; hydrology; trend; prairie
Received 15 August 2011; Accepted 3 April 2012
INTRODUCTION
Many researchers have examined the historical recordfor the presence of significant trends in precipitation inthe Canadian prairies and other regions (Akinremi et al.,1999; Stone et al., 2000; Zhang et al., 2001; Vincentand Mekis, 2006). The existence of significant trendsdemonstrates the non-stationarity of the climate andserves as a guide to the downscaling of future climatesimulations.The hydrography of the Canadian prairies is unusual
in that many of the major rivers rise in the RockyMountains and their foothills and, in most years, arelittle affected by inflows from the prairie agricultural andgrassland pasture regions. Smaller streams are affectedby local runoff, which is only produced from snowmeltor rainfall over frozen soils, intense rainfall rates insummer or long-term heavy rainfall in spring andsummer, but the records of these streams are scarce,short and rarely complete. Therefore, analysis of therainfall variables capable of causing runoff can ultimatelycontribute to methods for estimating trends in the flows ofCanadian prairie streams.
orrespondence to: Kevin Shook, Centre for Hydrology, Saskatoon,katchewan, Canada. E-mail: [email protected]
pyright © 2012 John Wiley & Sons, Ltd.
Some common climatological variables used to detect theeffects of climate change are described byMekis andVincent(2005) and Peterson et al. (2001). The joint CCl/CLIVAR/JCOMM Expert Team on Climate Change Detection andIndices (ETCCDI) defines 27 core indices of climate change,which can be accessed on its website at http://cccma.seos.uvic.ca/ETCCDI/list_27_indices.shtml. The ETCCDI pre-cipitation variables are monthly maximum 1-day precipita-tion, monthly maximum consecutive 5-day precipitation,simple precipitation intensity index, annual count of dayswhen precipitation is ≥10mm, annual count of days whenprecipitation is ≥20mm, annual count of days whenprecipitation is greater than or equal to a defined value,maximum number of consecutive days with rainfall is≥1mm, annual total precipitation in wet days, annual totalprecipitation when rainfall >95th percentile and annualtotal precipitation when rainfall is >99th percentile. Thepercentiles are of precipitation on wet days in the 1961–1990period.The use of standardized indices for detecting climate
change is understandable and often desirable, but thestandardized precipitation variables used do not necessarilycorrelate with important hydrological events in specifichydroclimatic regions. This is particularly true for theCanadian prairies where, because of the region’s dry, coldclimate and unusual hydrography, surface runoff events are

1753CHANGES IN THE HYDROLOGICAL CHARACTER OF RAINFALL ON THE PRAIRIES
comparatively rare and are caused by very specific types ofevents.Although snowfall generally constitutes about a third
of annual precipitation on the Canadian prairies, thespring melt of the winter snow accumulation typicallycauses the majority of annual runoff in prairie basinsbecause of the restricted infiltration rates of frozen soils,large spatial extent and synchronicity of snowmelt andlow spring evaporation rates. Figure 1, which plots themonthly fractions of annual peak runoff events for smallstreams in the Canadian prairies, demonstrates that morethan two-thirds of the annual peaks occur during Marchand April and are due to the spring freshet. Similarly,more than two-thirds of the annual flow volume of theselected sites also occurred during the months of Marchand April.The phase of precipitation in the spring and fall
influences runoff from the spring snowmelt freshet in twoways. In the spring, atmospheric conditions associatedwith rain falling on a snowpack typically include asaturated atmosphere at above freezing temperatures.These conditions can accelerate melt by transferringkinetic energy, conductive heat, turbulent sensible and/orturbulent latent heat to the snowpack. The latent heatcontribution from condensation on the snowpack isnormally the largest contribution (Marks et al., 1998).Rain on snow can also contribute direct runoff by rapidmovement through the snowpack (Singh et al., 1997).Increases in fall rainfall may also contribute to enhancedspring runoff by reducing the infiltration of subsequentsnowmelt water into frozen soils through the formation ofimpermeable ice layers at the soil–snow interface (Grayet al., 2001). All other factors being equal, trends thatincrease the rain fraction of spring and fall precipitation,will tend to cause increased runoff in the spring freshet.Fang and Pomeroy (2007) demonstrated this in a climatechange simulation using physically based hydrological
Jan Feb Mar Apr May Jun Jul Aug Sep Oct Dec
Fra
ctio
n of
Ann
ual P
eak
Flo
ws
0.0
0.1
0.2
0.3
0.4
Figure 1. Monthly fractions of annual peak flows for all 89 unregulatedprairie streams having gross basin areas smaller than 1000 km², over theperiod 1919–2009. Data from the Water Survey of Canada, available at
http://www.ec.gc.ca/rhc-wsc/
Copyright © 2012 John Wiley & Sons, Ltd.
model of a small prairie stream that included energybalance snowmelt and infiltration to frozen soil algo-rithms. The modest warming (2.6 �C) and wetting (11%)predicted by an ensemble of selected scenarios by 2050for south-west Saskatchewan led to a 24% increase inspring runoff. The impact of the phase change ofprecipitation in fall and spring from snowfall to rainfallwas a major factor in this increase in prairie snowmeltrunoff.On the Canadian prairies, summer rainfall is rarely
capable of causing runoff as infiltration rates generallyexceed rainfall rates and evapotranspiration rapidlydepletes soil moisture so that soils are unsaturated formost of the summer and saturation overland flow isunusual. Very exceptionally, large frontal rainfall systemshave persisted for a long period, and then saturationoverland flow does occur, one example being the SourisRiver floods of 2011. Thunderstorms, which occurfrequently during the summer months, can produce veryintense rainfall rates over small areas, which can exceedthe soil’s ability to infiltrate water, causing infiltrationexcess (Hortonian) runoff. Rainfall intensities on theCanadian prairies can be quite high and spatially variableas a result (Dyck and Gray, 1979). The small spatialextent of thunderstorms means that they are generally notable to generate enough runoff to cause changes in thedischarge of Canadian prairie rivers.Raddatz and Kern (1984) classified Canadian prairie
precipitation types by their approximate horizontal scales,including thunderclouds (1 km), fronts and squall lines(10–100 km) and synoptic cyclones (1000 km). Thunder-storms are entirely convective in nature, whereas largerscale events may be non-convective or may containregions of convection embedded within non-convectivefrontal system rainfall. Raddatz and Hanesiak (2008)examined more than 1000 24-h rainfalls greaterthan 10mm on the Canadian prairies over the period2000–2004 and found that 79% were wholly or partiallyconvective.Thunderstorms tend to be small and fast moving, and
although the area affected by each storm may be small,they can be very frequent (Gray, 1970). Raddatz (2000),in examining prairie summer rainfalls for the years1997–1999, determined that some water vapour fromregional evapotranspirationwas recycled andwas responsiblefor 24–35%of the total rainfall, the remainder being advectedinto the region. The prevalence of precipitation recycling isconsistent with small-scale convective storms.The post-glacial hydrography of the Canadian prairies
may also allow storms whose rainfall rates are smallerthan the rate of infiltration to cause runoff. Rather thanhaving a conventional drainage system derived fromfluvial erosion, many of the Canadian prairies drainsinternally to small topographic depressions left by glacialice; wetlands have formed in many of these depressions(Stichling and Blackwell, 1957). In many cases, thewetlands are situated on nearly impermeable glacial till,which restricts deep percolation of water (Woo andRowsell, 1993), and runoff from these wetlands only
Hydrol. Process. 26, 1752–1766 (2012)
1754 K. SHOOK AND J. POMEROY
occurs when their water storage exceeds their depres-sional storage capacity (Fang et al., 2010). Once awetland is full, all further direct rainfall to the wetland,less open water evaporation, will overflow becomingsurface runoff, regardless of the rainfall rate.Three types of prairie rainfall are of great hydrological
interest and were selected for analysis: (1) short duration(typically convective) rain storms, (2) accumulations ofrainfall over multiple days and (3) rainfall occurringduring the fall and spring, usually over frozen, partiallythawed or saturated soils. The purpose of this research isto determine how the distribution of Canadian prairierainfall has changed over the period of record in ways thatcan readily affect the region’s hydrological response bystudying changes in trends in precipitation variables,which can most directly influence prairie hydrology.Because there are multiple runoff-generating mecha-
nisms that can interact in many different ways, theimportance of a trend in a given variable is difficult toassess without the use of a physically based model ofprairie hydrology. The intent of this research is todetermine the locations where there are statisticallysignificant trends in the forcing variables that are linkedto prairie runoff. Those variables showing significanttrends at large fractions of the stations tested are thereforeidentified as being the most important to investigatefurther for their significance in influencing trends inprairie runoff.
DATA SETS
All data were obtained from the Historical Adjusted ClimateDatabase for Canada (HACDC). Monthly data can bedownloaded directly from the website at ec.gc.ca/dccha-ahccd. Daily values must be obtained by e-mailingthe researchers who produced the data. These data originatefrommeteorological stations operated by theMeteorologicalService of Canada to World Meteorological Organization
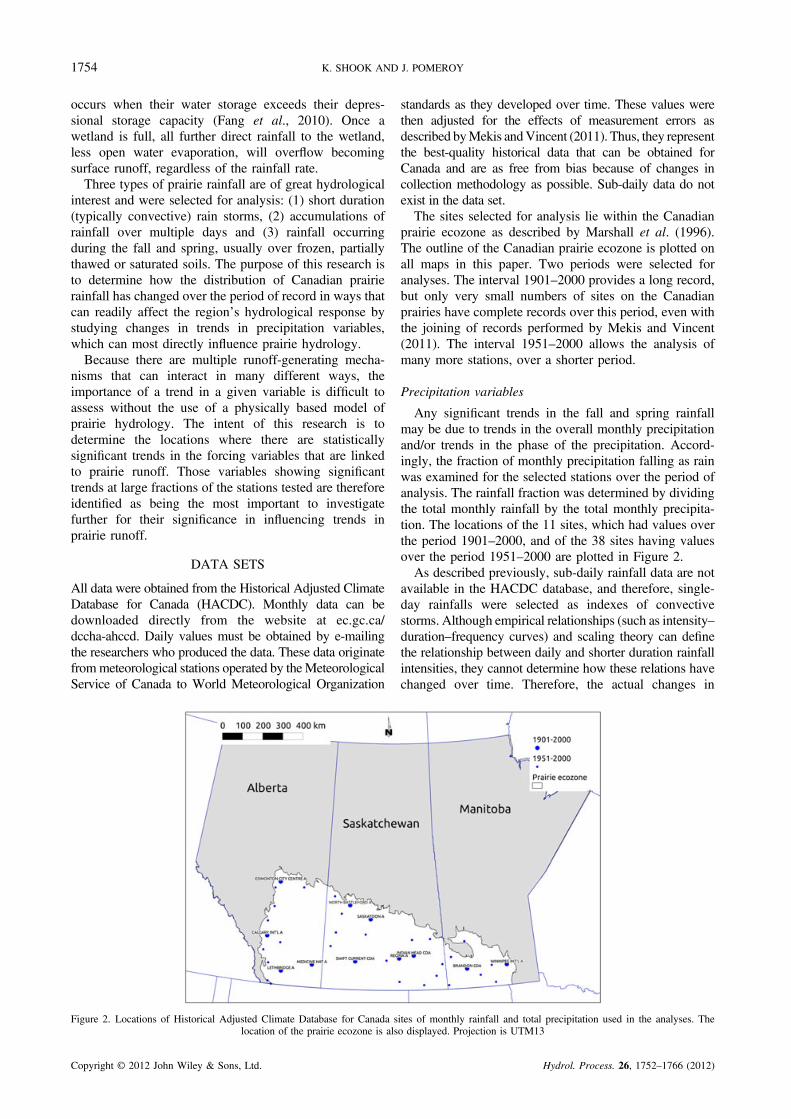
Figure 2. Locations of Historical Adjusted Climate Database for Canada slocation of the prairie ecozone is als
Copyright © 2012 John Wiley & Sons, Ltd.
standards as they developed over time. These values werethen adjusted for the effects of measurement errors asdescribed byMekis andVincent (2011). Thus, they representthe best-quality historical data that can be obtained forCanada and are as free from bias because of changes incollection methodology as possible. Sub-daily data do notexist in the data set.The sites selected for analysis lie within the Canadian
prairie ecozone as described by Marshall et al. (1996).The outline of the Canadian prairie ecozone is plotted onall maps in this paper. Two periods were selected foranalyses. The interval 1901–2000 provides a long record,but only very small numbers of sites on the Canadianprairies have complete records over this period, even withthe joining of records performed by Mekis and Vincent(2011). The interval 1951–2000 allows the analysis ofmany more stations, over a shorter period.
Precipitation variables
Any significant trends in the fall and spring rainfallmay be due to trends in the overall monthly precipitationand/or trends in the phase of the precipitation. Accord-ingly, the fraction of monthly precipitation falling as rainwas examined for the selected stations over the period ofanalysis. The rainfall fraction was determined by dividingthe total monthly rainfall by the total monthly precipita-tion. The locations of the 11 sites, which had values overthe period 1901–2000, and of the 38 sites having valuesover the period 1951–2000 are plotted in Figure 2.As described previously, sub-daily rainfall data are not
available in the HACDC database, and therefore, single-day rainfalls were selected as indexes of convectivestorms. Although empirical relationships (such as intensity–duration–frequency curves) and scaling theory can definethe relationship between daily and shorter duration rainfallintensities, they cannot determine how these relations havechanged over time. Therefore, the actual changes in
ites of monthly rainfall and total precipitation used in the analyses. Theo displayed. Projection is UTM13
Hydrol. Process. 26, 1752–1766 (2012)
1755CHANGES IN THE HYDROLOGICAL CHARACTER OF RAINFALL ON THE PRAIRIES
convective events at sub-daily time scales are not detectablefrom these daily datasets.Single-day rainfall events were identified within the
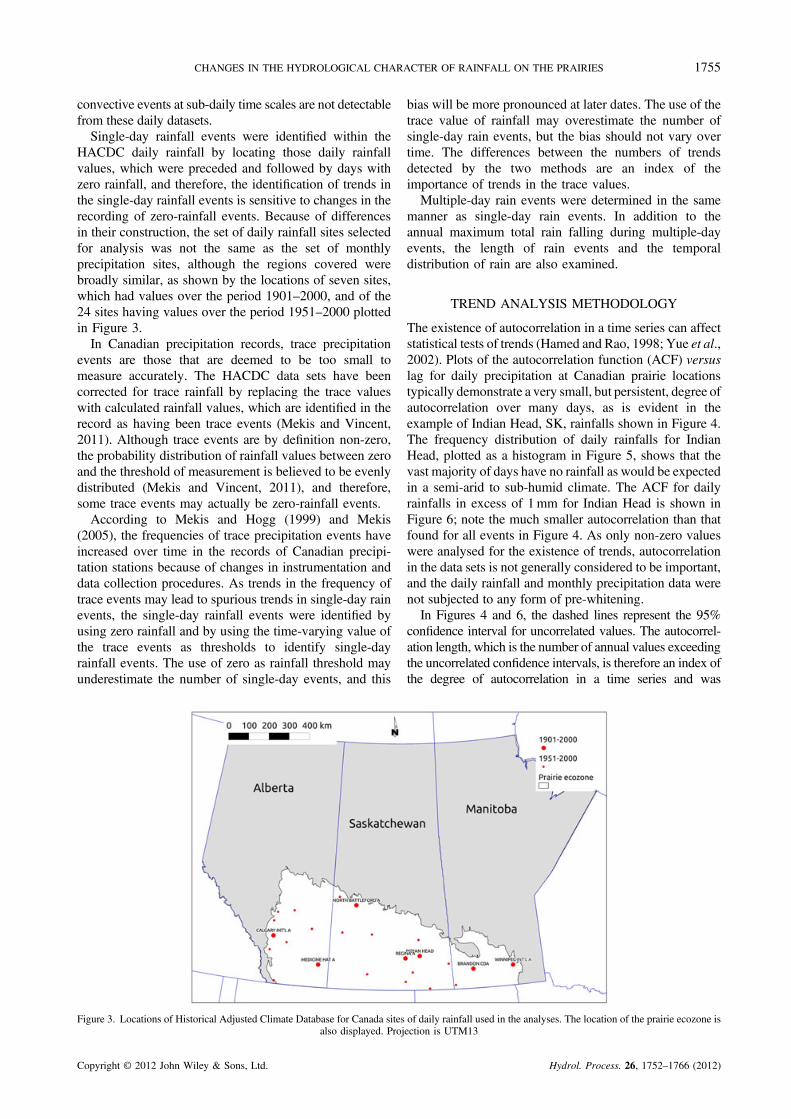
HACDC daily rainfall by locating those daily rainfallvalues, which were preceded and followed by days withzero rainfall, and therefore, the identification of trends inthe single-day rainfall events is sensitive to changes in therecording of zero-rainfall events. Because of differencesin their construction, the set of daily rainfall sites selectedfor analysis was not the same as the set of monthlyprecipitation sites, although the regions covered werebroadly similar, as shown by the locations of seven sites,which had values over the period 1901–2000, and of the24 sites having values over the period 1951–2000 plottedin Figure 3.In Canadian precipitation records, trace precipitation
events are those that are deemed to be too small tomeasure accurately. The HACDC data sets have beencorrected for trace rainfall by replacing the trace valueswith calculated rainfall values, which are identified in therecord as having been trace events (Mekis and Vincent,2011). Although trace events are by definition non-zero,the probability distribution of rainfall values between zeroand the threshold of measurement is believed to be evenlydistributed (Mekis and Vincent, 2011), and therefore,some trace events may actually be zero-rainfall events.According to Mekis and Hogg (1999) and Mekis
(2005), the frequencies of trace precipitation events haveincreased over time in the records of Canadian precipi-tation stations because of changes in instrumentation anddata collection procedures. As trends in the frequency oftrace events may lead to spurious trends in single-day rainevents, the single-day rainfall events were identified byusing zero rainfall and by using the time-varying value ofthe trace events as thresholds to identify single-dayrainfall events. The use of zero as rainfall threshold mayunderestimate the number of single-day events, and this
Figure 3. Locations of Historical Adjusted Climate Database for Canada sitesalso displayed. Proj
Copyright © 2012 John Wiley & Sons, Ltd.
bias will be more pronounced at later dates. The use of thetrace value of rainfall may overestimate the number ofsingle-day rain events, but the bias should not vary overtime. The differences between the numbers of trendsdetected by the two methods are an index of theimportance of trends in the trace values.Multiple-day rain events were determined in the same
manner as single-day rain events. In addition to theannual maximum total rain falling during multiple-dayevents, the length of rain events and the temporaldistribution of rain are also examined.
TREND ANALYSIS METHODOLOGY
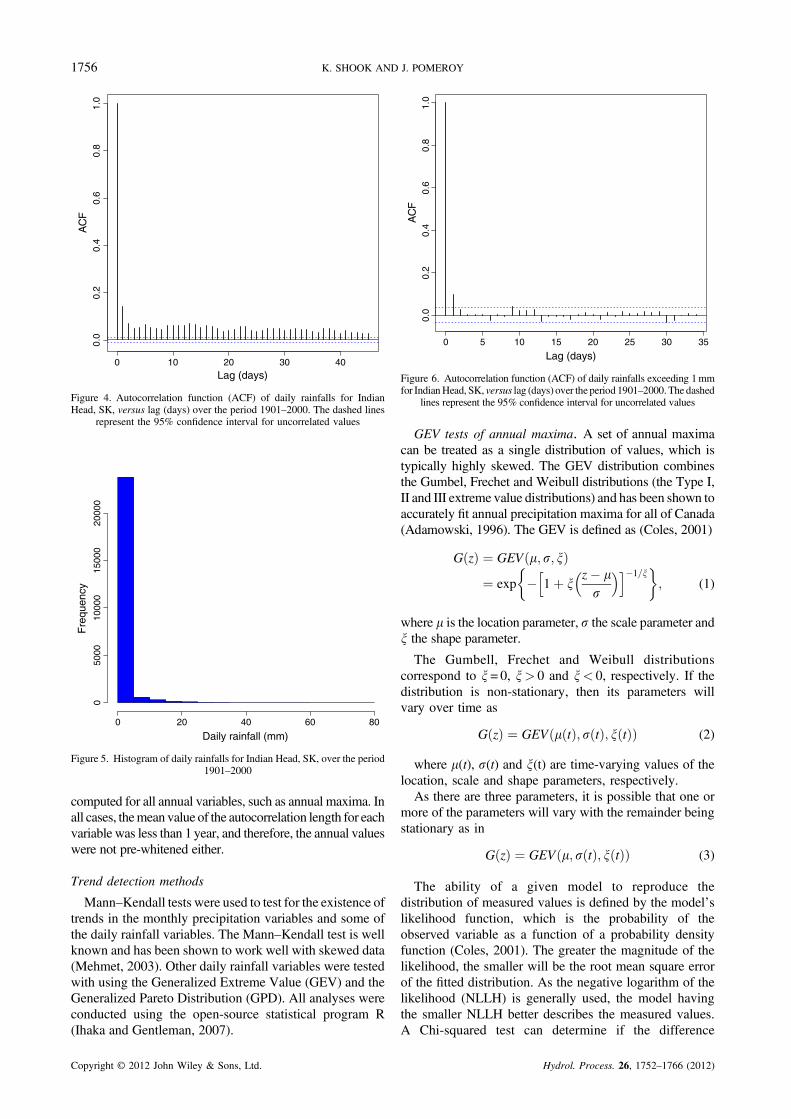
The existence of autocorrelation in a time series can affectstatistical tests of trends (Hamed and Rao, 1998; Yue et al.,2002). Plots of the autocorrelation function (ACF) versuslag for daily precipitation at Canadian prairie locationstypically demonstrate a very small, but persistent, degree ofautocorrelation over many days, as is evident in theexample of Indian Head, SK, rainfalls shown in Figure 4.The frequency distribution of daily rainfalls for IndianHead, plotted as a histogram in Figure 5, shows that thevast majority of days have no rainfall as would be expectedin a semi-arid to sub-humid climate. The ACF for dailyrainfalls in excess of 1mm for Indian Head is shown inFigure 6; note the much smaller autocorrelation than thatfound for all events in Figure 4. As only non-zero valueswere analysed for the existence of trends, autocorrelationin the data sets is not generally considered to be important,and the daily rainfall and monthly precipitation data werenot subjected to any form of pre-whitening.In Figures 4 and 6, the dashed lines represent the 95%
confidence interval for uncorrelated values. The autocorrel-ation length, which is the number of annual values exceedingthe uncorrelated confidence intervals, is therefore an index ofthe degree of autocorrelation in a time series and was
of daily rainfall used in the analyses. The location of the prairie ecozone isection is UTM13
Hydrol. Process. 26, 1752–1766 (2012)
0 10 20 30 40
0.0
0.2
0.4
0.6
0.8
1.0
Lag (days)
AC
F
Figure 4. Autocorrelation function (ACF) of daily rainfalls for IndianHead, SK, versus lag (days) over the period 1901–2000. The dashed lines
represent the 95% confidence interval for uncorrelated values
Daily rainfall (mm)
Fre
quen
cy
0 20 40 60 80
050
0010
000
1500
020
000
Figure 5. Histogram of daily rainfalls for Indian Head, SK, over the period1901–2000
0 5 10 15 20 25 30 35
0.0
0.2
0.4
0.6
0.8
1.0
Lag (days)
AC
F
Figure 6. Autocorrelation function (ACF) of daily rainfalls exceeding 1mmfor IndianHead, SK, versus lag (days) over the period 1901–2000. The dashed
lines represent the 95% confidence interval for uncorrelated values
1756 K. SHOOK AND J. POMEROY
computed for all annual variables, such as annual maxima. Inall cases, themean value of the autocorrelation length for eachvariable was less than 1 year, and therefore, the annual valueswere not pre-whitened either.
Trend detection methods
Mann–Kendall tests were used to test for the existence oftrends in the monthly precipitation variables and some ofthe daily rainfall variables. The Mann–Kendall test is wellknown and has been shown to work well with skewed data(Mehmet, 2003). Other daily rainfall variables were testedwith using the Generalized Extreme Value (GEV) and theGeneralized Pareto Distribution (GPD). All analyses wereconducted using the open-source statistical program R(Ihaka and Gentleman, 2007).
Copyright © 2012 John Wiley & Sons, Ltd.
GEV tests of annual maxima. A set of annual maximacan be treated as a single distribution of values, which istypically highly skewed. The GEV distribution combinesthe Gumbel, Frechet and Weibull distributions (the Type I,II and III extreme value distributions) and has been shown toaccurately fit annual precipitation maxima for all of Canada(Adamowski, 1996). The GEV is defined as (Coles, 2001)
G zð Þ ¼ GEV m; s; xð Þ¼ exp � 1þ x
z� ms
� �h i�1=x� �
; (1)
where m is the location parameter, s the scale parameter andx the shape parameter.
The Gumbell, Frechet and Weibull distributionscorrespond to x= 0, x> 0 and x< 0, respectively. If thedistribution is non-stationary, then its parameters willvary over time as
G zð Þ ¼ GEV m tð Þ; s tð Þ; x tð Þð Þ (2)
where m(t), s(t) and x(t) are time-varying values of thelocation, scale and shape parameters, respectively.As there are three parameters, it is possible that one or
more of the parameters will vary with the remainder beingstationary as in
G zð Þ ¼ GEV m; s tð Þ; x tð Þð Þ (3)
The ability of a given model to reproduce thedistribution of measured values is defined by the model’slikelihood function, which is the probability of theobserved variable as a function of a probability densityfunction (Coles, 2001). The greater the magnitude of thelikelihood, the smaller will be the root mean square errorof the fitted distribution. As the negative logarithm of thelikelihood (NLLH) is generally used, the model havingthe smaller NLLH better describes the measured values.A Chi-squared test can determine if the difference
Hydrol. Process. 26, 1752–1766 (2012)

1757CHANGES IN THE HYDROLOGICAL CHARACTER OF RAINFALL ON THE PRAIRIES
between NLLH values is significant at a specified level,the null hypothesis being that there is no differencebetween the models (Coles, 2001). If one of the modelshas no trends in its parameters, and the other modelparameter(s) include trend(s), then rejection of the nullhypothesis implies the existence of trend(s) in themodelled parameters. All of the GEV tests in thisresearch were based entirely on the existence of trendsin the location parameter, which is the most powerfulchange detection method, according to Zhang et al.(2004). Significant trends designated as being positiveshow increases in the extreme values, whereas significanttrends designated as being negative show decreases in theextreme values, over the period tested.
GPD tests of single-day rainfall. As the GEV only fitsextreme values, it omits the majority of any probabilitydistribution. This is especially true for the GPD, whichwell described the single-day rainfall events identified atthe prairie stations, as this distribution is dominated bysmall values. The cumulative distribution function (F) ofthe GPD is defined as (Coles, 2001)
F zð Þ ¼ GPD m; s; xð Þ ¼ 1� 1þ xz� ms
� �h i�1=x(4)
where m is the location parameter, s the scale parameterand x the shape parameter (for x 6¼ 0).As with the GEV model, a Chi-squared test is used to
detect if values of the parameters incorporating a trendresult in a better fit to the empirical data than does amodel having constant values in its parameters. Thefunction gpd.fit in the R package ‘ismev’ (which isderived from Coles (2001)) used for this analysis tests thescale and shape parameters for the existence of statisti-cally significant trends, the location parameter beingassumed to be constant. Therefore, a statisticallysignificant trend in either of these parameters is regardedas constituting a significant trend in the GPD. In practice,all significant trends found were in the scale parameters.
Table I. Summary of Mann–Kendall tests of precipitation phase o(38 station
1901–2000
Month
Mean monthlypercentage of
precipitation fallingas rain
Number ofsites having asignificant trend
Slope of linemodel (%/yea
Jan 3 11 0.02Feb 4 11 0.09Mar 13 11 0.10Apr 55 1 0.28May 93 0 N/ASep 94 0 N/AOct 67 0 N/ANov 17 5 0.05Dec 5 11 0.03
All significant trends were positive, indicating and increasing fraction of the
Copyright © 2012 John Wiley & Sons, Ltd.
As the GPD is defined for values exceeding athreshold, the selection of a threshold value is important.Coles (2001) recommends plots of the GPD parametersagainst threshold value to determine ranges where thethreshold results in a stable distribution. Unfortunately,the use of large (>10mm) thresholds required to satisfythis condition excludes the majority of single-day rainfallvalues. As all stations showed agreement between thesummer single-day rainfalls exceeding 1mm and fittedGPD values significant according to a Chi-square test atthe 5% level, a 1-mm threshold was used for all GPDtests.Significant trends designated as being positive show
increases in the values of the distribution, whereassignificant trends designated as being negative showdecreases in the values of the distribution, over the periodtested.
Precipitation phase
Mann–Kendall tests were carried out on the rainfallfractions (rainfall as a fraction of total precipitation depth)for the months of September–May, inclusive. Thesummer months were ignored as their rainfall is typicallyvery close to 100% of the precipitation. The results of thetests are summarized in Table I. In addition to the resultsof the Mann–Kendall tests, mean values of slopes fromleast-squares fitted linear models of the rainfall fractionversus time are also listed.The patterns of significant trends were similar during
the two periods evaluated with the greatest numbers ofstations showing significant trends in precipitation phaseduring the months of December–March, although theactual monthly fraction of precipitation falling as rainduring December, January and February was very small.It is probable that the most important precipitation phasechange fractions occur in the months of November(1901–2000), March (1901–2000 and 1951–2000) andApril (1951–2000) when the fraction of stations affectedby trends is large, the monthly precipitation is comprised
ver the periods 1901–2000 (11 stations tested) and 1951–2000s tested)
1951–2000
arr)
Mean monthlypercentage of
precipitation fallingas rain
Number ofsites having asignificant trend
Slope of linearmodel (%/year)
3 7 0.015 10 0.0813 24 0.2153 16 0.3693 3 0.0495 2 0.1665 4 0.2815 1 0.384 8 0.00
precipitation falling as rain. All tests used a 5% level of significance.
Hydrol. Process. 26, 1752–1766 (2012)

1758 K. SHOOK AND J. POMEROY
of both rain and snow and the slopes of the linear modelsare large. By these criteria, it appears that the month ofApril was more important in the second half of the 20thcentury, than the century as a whole, with the oppositebeing true of November. Because 38 time series weretested at a 5% level of significance, over the interval1951–2000, two series could be expected to showsignificant trends by chance.The hydrological importance of rainfall events depends
very much on the state of the winter snowcover. As deepwinter snowpacks have a higher liquid water retentioncapacity than do shallow packs, they will tend to resist theformation of ice lenses. Similarly, the contribution ofspring rain atmospheric conditions to melt (because of itslatent, sensible, conductive and kinetic energy inputs) willalso be affected by the depth and temperature of thesnowpack. Determination of the relative hydrologicalimportance of the trends in monthly rainfall will requirefurther research using physically based hydrologicalmodels.The existence of significant trends in the phase of
precipitation is generally consistent with Akinremi et al.(1999) who found inverse relationships between thetrends for annual rainfall and snowfall totals at manylocations over the periods 1921–1960 and 1961–1995.The trends are also consistent with the trends (bothsignificant and not significant at the 5% level) evident intemperature variables (increasing numbers of warm daysand warm nights, decreasing numbers of cold days andcold nights) and precipitation variables (increasing dayswith rain, decreasing annual snowfall and snowfall toprecipitation ratio) reported by Vincent and Mekis (2006)at locations in the Canadian prairies over the intervals1900–2003 and 1950–2004.
Single-day rainfalls
It is assumed that single-day rainfall, that is, rainfalloccurring during 1 day with zero rainfall on the preceding
Figure 7. Map of sites within the Canadian prairie ecozone having significasummer rainfall determined using zero-v
Copyright © 2012 John Wiley & Sons, Ltd.
and following days, is an index of the occurrence of small-scale convective rain events because of localized thunder-clouds. Averaged over all of the stations, single-day rainfallaccounted for 24% of the summer (June–July–August) totalrainfall. Conversely, rainfalls lasting multiple days arecaused by large-scale systems and/or by repeated small-scale convective events.As described previously, single-day rainfall events
were identified by (1) using zero rainfall as a thresholdand (2) using the trace rainfall as a threshold. The two setsof events are designated here as zero-threshold and trace-threshold single-day rainfall events. All analyses wereconducted over the months of June–August as thesemonths contain the majority of convective storms and toavoiding biassing the data set by including additional rainbecause of the change in precipitation phase in the falland spring. The term ‘threshold’ refers to that used todetermine the existence of rainfall on the days adjacent tothe single-day rainfall.
Annual maximum single-day rainfall. The annualmaxima of rain falling in single-day rainfall events wereanalysed for significant trends in the GEV distribution.The data were tested over both periods using bothmethods for determining the single-day rain events. Theresults of the tests, mapped in Figures 7 and 8, show littleevidence for significant trends.No significant trends were found in the single-day rain
events determined using zero-rainfall thresholds. Only asingle site was found to show a significant trend for thetrace-threshold events over 1901–2000 (Indian Head, SK)and 1951–2000 periods (Stettler, AB). The two significanttrends are negative in that they indicated that the annualmaximum single-day rainfall had decreased over theperiod of record. However, as a 5% level of significancewas used, and more than 20 sites were tested over the1951–2000 period, a single significant trend would beexpected to occur by chance.
nt trends in the generalized extreme value of annual maximum single-dayalue thresholds. Projection is UTM13
Hydrol. Process. 26, 1752–1766 (2012)
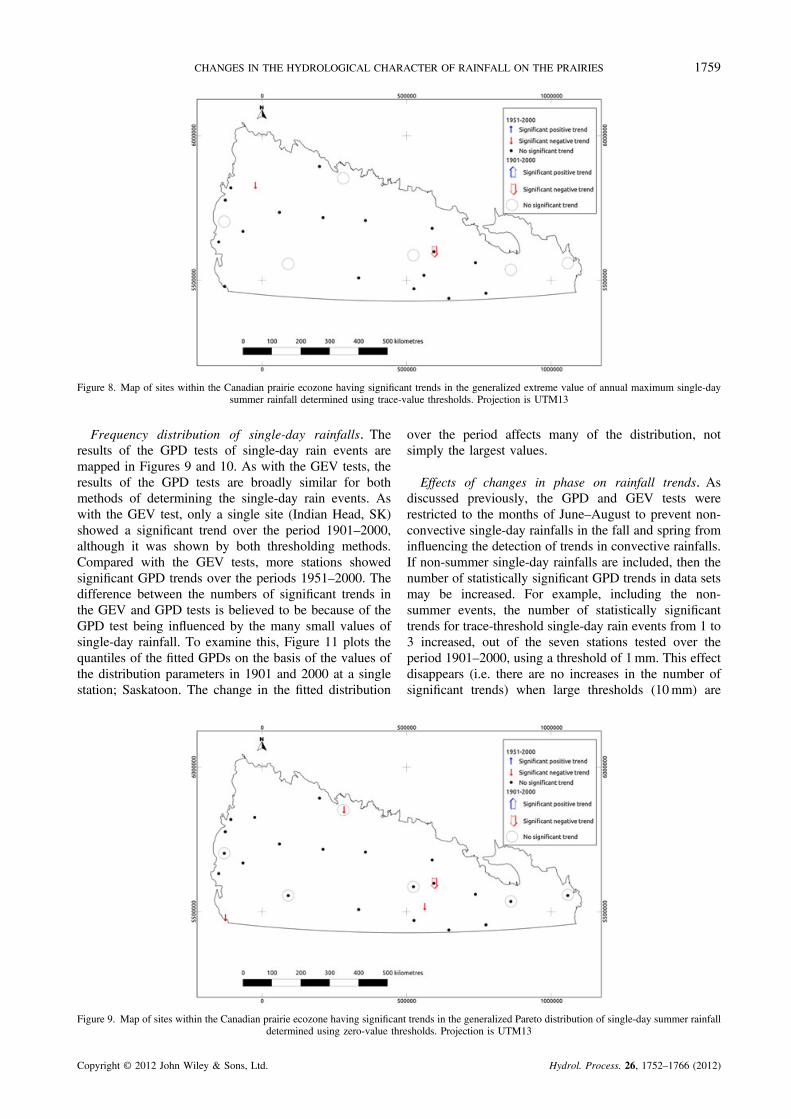
Figure 8. Map of sites within the Canadian prairie ecozone having significant trends in the generalized extreme value of annual maximum single-daysummer rainfall determined using trace-value thresholds. Projection is UTM13
1759CHANGES IN THE HYDROLOGICAL CHARACTER OF RAINFALL ON THE PRAIRIES
Frequency distribution of single-day rainfalls. Theresults of the GPD tests of single-day rain events aremapped in Figures 9 and 10. As with the GEV tests, theresults of the GPD tests are broadly similar for bothmethods of determining the single-day rain events. Aswith the GEV test, only a single site (Indian Head, SK)showed a significant trend over the period 1901–2000,although it was shown by both thresholding methods.Compared with the GEV tests, more stations showedsignificant GPD trends over the periods 1951–2000. Thedifference between the numbers of significant trends inthe GEV and GPD tests is believed to be because of theGPD test being influenced by the many small values ofsingle-day rainfall. To examine this, Figure 11 plots thequantiles of the fitted GPDs on the basis of the values ofthe distribution parameters in 1901 and 2000 at a singlestation; Saskatoon. The change in the fitted distribution
Figure 9. Map of sites within the Canadian prairie ecozone having significandetermined using zero-value thre
Copyright © 2012 John Wiley & Sons, Ltd.
over the period affects many of the distribution, notsimply the largest values.
Effects of changes in phase on rainfall trends. Asdiscussed previously, the GPD and GEV tests wererestricted to the months of June–August to prevent non-convective single-day rainfalls in the fall and spring frominfluencing the detection of trends in convective rainfalls.If non-summer single-day rainfalls are included, then thenumber of statistically significant GPD trends in data setsmay be increased. For example, including the non-summer events, the number of statistically significanttrends for trace-threshold single-day rain events from 1 to3 increased, out of the seven stations tested over theperiod 1901–2000, using a threshold of 1mm. This effectdisappears (i.e. there are no increases in the number ofsignificant trends) when large thresholds (10mm) are
t trends in the generalized Pareto distribution of single-day summer rainfallsholds. Projection is UTM13
Hydrol. Process. 26, 1752–1766 (2012)

Figure 10. Map of sites within the Canadian prairie ecozone having significant trends in the generalized Pareto distribution of single-day summer rainfalldetermined using trace-value thresholds. Projection is UTM13
Figure 11. Quantile–quantile plot of values computed from generalizedPareto distributions (GPD) fitted to single-day rainfalls for Saskatoon, SK,
in 1901 and 2000
1760 K. SHOOK AND J. POMEROY
used, or when GEV tests are performed, presumablybecause heavy single-day rain events require convection,which is very rare during the fall, winter and spring.
Summer single-day fraction of total precipitation. Thefraction of summer rainfall, which occurred in single-dayevents, was calculated as an index of the overallimportance of single-day events and, by extension, ofconvective storms. Figure 12 indicates that over the period1901–2000, the majority (five out of seven) of the stationstested showed trends that were significant at the 5% level,all of which indicated that single-day rainfall eventsaccounted for decreasing fractions of annual rainfall. Thesestations were scattered throughout the prairie region andincluded both semi-arid and sub-humid locations. Over theperiod 1951–2000, the evidence of trends is weaker, with
Copyright © 2012 John Wiley & Sons, Ltd.
only 7 of 24 stations showing trends, with 6 being negativeand 1 (Brandon, MB) being positive. Only a single station(Indian Head, SK) showed trends over both time intervals.
Multiple-day rainfalls
Multiple-day rain events were defined as beingcontiguous rainfalls, with non-zero rainfall occurringeach day. As the differences between the statistics of thesingle-day rainfalls defined by the two thresholdingmethods were demonstrated to be small, zero-rainfallthresholds were used for all analyses of multiple-dayrainfalls.
Length of rainfall event. Although the GPD appears todefine rain cluster lengths well, it was not used for trendanalyses as the length values are integers and, as theyvary over a fairly narrow range, were highly constrained.Instead, Mann–Kendall tests were conducted on themaximum annual lengths of multiple-day rain events. Theresults of the tests are plotted in Figure 13. Over theperiod 1901–2000, the maximum rain event lengthsshowed significant trends for a majority (four out ofseven) of stations. All of the significant trends werepositive. These tended to be in the sub-humid climatelocations and did not occur in the semi-arid PalliserTriangle in the south-west centre of the Canadian prairies.Over the period 1951–2000, only 8 of 24 stations showedany significant trends. The only station showing significanttrends over both periods was Indian Head, SK.
Event rainfall totals. The quantity of rain occurring inmultiple-day events was tested for the existence of trends.The GEV tests of annual extremes, plotted in Figure 14,show no significant trends over the period 1901–2000,but 5 of 24 stations, in the sub-humid northwesternportion of the Canadian prairies, showed positive trendsover the period 1951–2000.
Hydrol. Process. 26, 1752–1766 (2012)

Figure 12. Map of sites within the Canadian prairie ecozone having significant trends, according to Mann–Kendall tests, in the fraction of summerrainfall due to single-day events. Projection is UTM13
Figure 13. Map of sites within the Canadian prairie ecozone having significant trends, according to Mann–Kendall tests, in the maximum annual lengthof summer multiple-day rainfall events. Projection is UTM13
1761CHANGES IN THE HYDROLOGICAL CHARACTER OF RAINFALL ON THE PRAIRIES
Generalized Pareto Distribution tests were conductedon the multiple-day rainfall totals. As with the single-dayrainfalls, the numbers of stations showing significanttrends were much greater for the GPD trends than theGEV trends, presumably because the GPD test includedmore of the frequency distribution than did the GEV test.Figure 15 plots the GPD test results, 11 out of 24 stationsshowing significant positive trends over the period1951–2000. Over the period 1901–2000, 5 out of 7stations showed significant positive trends, all of whichalso had significant trends over 1951–2000. Thesestations were scattered throughout the Canadian prairies.
MULTIFRACTAL ANALYSIS
Although the previous analyses demonstrated the exist-ence of statistically significant trends in many rainfall
Copyright © 2012 John Wiley & Sons, Ltd.
variables, they do not define the variability of the timeseries over many temporal scales, which is necessary fordownscaling. Previous research has demonstrated theexistence of multiscaling in rainfall time series at manylocations (Gaume et al., 2007) (Garcia-Marin et al.,2008), which is useful for downscaling a time series whilereproducing the scaling behaviour of all moments of theoriginal time series.Significant temporal trends have been shown to exist in
the multifractality of precipitation (Royer et al., 2008) andCanadian prairie snowfall (Shook and Pomeroy, 2010).The existence of trends in Canadian prairie rainfall is ofinterest to explain the trends in the temporal variability ofrainfall noted previously. Also, evidence of nons-tationarity in the multiscaling of Canadian prairie rainfallwill influence the selection of methods for downscaling offuture climate simulations.
Hydrol. Process. 26, 1752–1766 (2012)

Figure 14. Map of sites within the Canadian prairie ecozone having significant trends in the generalized extreme value of annual maximum multiple-daysummer rainfall accumulations. Projection is UTM13
Figure 15. Map of sites within the Canadian prairie ecozone having significant trends in the generalized Pareto distribution of multiple-day summerrainfall accumulations. Projection is UTM13
1762 K. SHOOK AND J. POMEROY
The power spectra of all of the daily rainfall data setsanalysed display scaling over intervals between 1 day and1month with parameters virtually identical to thosedetermined by Shook and Pomeroy (2010) for prairiedaily snowfall quantities. As discussed previously, sub-daily rainfall data were not available from HACDC. Hadthese been available, it would have been possible todetermine if the scaling relationships could be extended tofiner temporal scales.All scaling analyses in this research were based on
periods between 1 day and 1month. The methodologyused is described more fully in Shook and Pomeroy(2010) but is summarized here. The magnitude of thescaling present in a time series can be defined by thebehaviour of the moment scaling function, K(q), which isrelated to the normalized value of the time series e(t) by(Olsson, 1995).
Copyright © 2012 John Wiley & Sons, Ltd.
eql� � � lK qð Þ (5)
where q is the moment and l is the scale factor (ratio ofscale of interest to size of entire data set).The symbols hi refer to the process of ensemble
averaging, where the results of the calculations areaveraged over all values of e(t).A nonlinear relationship between K(q) and q, which is
indicative of multifractality, can be quantified by theuniversal multifractal relationship between the constantsa and C1 (Seuront et al., 1999):
K qð Þ ¼ C1a� 1
qa � qð Þ; for a 6¼ 1; q≥0 (6)
The constants a and C1 are indices of the inhomoge-neity of a dataset, and because C1 is in the numerator and
Hydrol. Process. 26, 1752–1766 (2012)

1763CHANGES IN THE HYDROLOGICAL CHARACTER OF RAINFALL ON THE PRAIRIES
a is in the denominator of Equation 6, the constants act inopposite directions. Small values of a and/or large valuesof C1 are indicative of tendencies to large fluctuations inthe data; large values of a and/or small values of C1 areindicative of greater temporal homogeneity (Finn et al.,2001). Therefore, the existence of significant trends ineither or both of the universal multifractal parametersindicates changes over time in the mutliscaling of adataset and trends in its temporal homogeneity.Each time series was divided into 25 subsections, and
the values of a and C1 were computed for each of thesubsections. The results of Mann–Kendall tests on themagnitudes of the parameters are mapped in Figure 16.Because significant trends in either of the parametersindicate a change in the multiscaling of a dataset, theparameter trends were combined to simplify the map.Significant trends designated as being positive are due toincreases in a and/or to decreases in C1.Over the period 1901–2000, 5 out of 7 stations showed
significant trends in a and/or in C1. Over the period1951–2000, 11 out of 24 sites showed significant trendsin the parameters. These stations are well distributedacross the Canadian prairies. In all cases, the trendsindicated an increase in the value of a or a decrease in thevalue of C1, indicating that the data were becoming moretemporally uniform. Shook and Pomeroy (2010) showexamples of the change in temporal distribution ofsnowfall caused by changes in the values of the dataset’smultiscaling parameters.
Measured cascade multipliers
Multifractal data sets are often constructed through themultifractal cascade process (Gaume et al., 2007). Theprocess, as described in Shook and Pomeroy (2010),consists of repeatedly dividing a conserved quantity, suchas rainfall, into smaller units of space and/or time throughrepetitive multiplication by a factor that is randomly
Figure 16. Map of sites within the Canadian prairie ecozone having significanttests, for summer daily rainfalls. Significant positive trends indicate increased
increase in the value of a and/or a significant dec
Copyright © 2012 John Wiley & Sons, Ltd.
generated according to some distribution. By inverting theprocess, the naturally occurring cascade multipliers canbe determined.Each multiplicative cascade divides a rainfall total into
two (usually unequal) pieces. For example, given therainfall over 8 days, the total is divided into two 4-daytotal rainfalls. Each 4-day rainfall is then subdividedunevenly into two 2-day rainfalls. Each 2-day rainfall issubdivided unevenly into two 1-day rainfalls.An advantage of testing the cascade multipliers over
checking ratios for conventional lengths of time (1, 2, 5,7, 10 days) is that the multipliers test the variability ofrainfall over all scales. The presence of significant trendsin the frequency distributions of the multipliers at varyingtemporal scales demonstrates how downscaling of rainfallquantities such as intensity and duration has changed overtime.The natural cascade multipliers were computed using
the following steps:
(1) Divide the rainfall time series into sequential 2-dayperiods;
(2) Compute the mean rainfall for each 2-day period;(3) Omit all 2-day rainfall values equal to 0;(4) Calculate the ratio of the first day’s rainfall to the 2-
day total; and(5) Repeat the steps 1–4 for longer (i.e. 4, 8, 16 days)
periods.
Cascade multiplier values of 0 or 1 indicate that all ofthe rain in the longer period is concentrated in the firsthalf or second half of the period. Conversely, a cascadevalue of 0.5 indicates that the rainfall is evenly dividedbetween each half period.The frequency distributions of cascade multipliers
typically resemble the example histogram plotted inFigure 17 from the Saskatoon observations, the values of
trends in the universal multifractal parameters, according to Mann–Kendalluniformity in the temporal distribution of rainfall because of a significantrease in the value of C1. Projection is UTM13
Hydrol. Process. 26, 1752–1766 (2012)

Figure 17. Histogram of multipliers for 2-day to 1-day rainfall totals. Datafor Saskatoon, SK, for the period 1901–2000
1764 K. SHOOK AND J. POMEROY
0 or 1 being the most frequent and similar in distribution.At all levels, for all stations over their periods of record,the null hypothesis of uniform distribution of the non-zero/one values could not be rejected by Chi-squared testsat the 5% level. Thus, the 0/1 frequency of cascademultipliers defines their overall distribution and can beused to test for the existence of trends.Because the cascade multiplier repeatedly divides
periods in half, the method works best when the numberof days is an even power of 2. As the intent was toanalyse rainfall scaling for periods of up to 1month,
Table II. Means and standard deviations of cascade ratio 0/1fractions over the period 1901–2000
Period (day/s) Mean Standard deviation
2–1 0.65 0.084–2 0.36 0.108–4 0.12 0.0716–8 0.34 0.0632–16 0.33 0.05
Seven stations were tested.
Table III. Significant trends in mult
Num
Period and number of stations Trend 2–1 day
1901–2000 Positive 07 stations
Negative 1None 6
1951–2000 Positive 324 stations
Negative 8None 13
All tests were performed using the Mann–Kendall test at a 5% level of sign
Copyright © 2012 John Wiley & Sons, Ltd.
periods of 96 days = 3� 32 (i.e. 25) days were selected.Days 148–243 (May 28 to August 31 for non-leap years)were selected for analyses as this period is unlikely to beaffected by the observed changes in the phase ofprecipitation.Mean and standard deviations of the 0/1 fractions were
determined over all stations for all five periods and arelisted in Table II. The 0/1 fractions show markeddifferences over the five periods, indicating the timescales over which rain events vary. In particular, the lowmean value for the 8-day to 4-day cascade indicates that4-day dry spells, or rain events, are relatively uncommonunless they are part of a longer-term event. By contrast,the large mean value for the 2-day to 1-day cascadesindicates that single-day rainfall events are relativelycommon, compared with 2-day rainfalls.
Trends in cascade multipliers. The fraction of thecascade multipliers equal to 1 or 0 was determined for sub-ranges of the 100-year and 50-year periods, as was done forthe multifractal parameters. Mann–Kendall tests wereperformed on the 1–0 fractions, and the percentages ofstations showing positive (increasing 0–1 fractions), negative(decreasing 0–1 fractions) or no trends were tabulated foreach stage of the cascades, as shown in Table III.Over the period 1901–2000, only small fractions of the
stations displayed significant trends, all of which werenegative. Over the period 1951–2000, greater fractions ofthe stations showed significant trends, both positive andnegative, with the negative trends predominating. Thenumber of stations showing significant trends appears tovary only slightly with the time scale.The existence of significant trends in the cascade
multipliers, as well as in the values of a and C1, is anindication of non-stationarity in the downscaling ofrainfall in the Canadian prairies over the periods analysed.Because the significant trends are both positive andnegative, more detailed investigation will be required todetermine the effects on a given time series of the trendsat each time scale. However, the greater number ofnegative trends indicates an overall tendency for summerrainfall to be distributed more evenly over temporal scalesbetween 1 and 32 days, over the periods tested.
iple-day cascade ratio 0/1 fraction
bers of stations showing trend significant at 5% level
4–2 days 8–4 days 16–8 days 32–16 days
0 0 0 0
1 1 2 26 6 5 51 4 3 4
13 11 11 1010 9 10 10
ificance.
Hydrol. Process. 26, 1752–1766 (2012)

1765CHANGES IN THE HYDROLOGICAL CHARACTER OF RAINFALL ON THE PRAIRIES
SUMMARY AND CONCLUSIONS
The trends for spring and autumn precipitation to fall asrain rather than snow over the periods 1901–2000 and1951–2000 are consistent with the trends noted byVincent et al. (2007) of increasingly warm mean surfacetemperatures during the winter and spring, although theirstudy was conducted over the period 1955–2005 and isnot directly comparable. Vincent and Mekis (2006) foundsignificant trends of decreasing snowfall fractions ofannual precipitation at several locations in the Canadianprairies over the interval 1950–2003.Enhanced spring runoff has the potential to fundamen-
tally change the response of Canadian Prairie river basinsto subsequent rainfall by filling storage such as that inponds and wetlands, over very large regions. In mostyears, these have represented a significant unfilleddepressional storage capacity that limits the contributingarea for streamflow generation. When this storage isfilled, the hydrological connectivity of these basinsincreases, and the contributing area for runoff alsoincreases resulting in much higher streamflow (Fang et al.2010; Pomeroy et al., 2010).Over the period 1951–2000, the fraction of summer rain
falling as single-day events has been decreasing at manylocations (one site showed a significant increasing trend, andmany showed no trend). Significant decreasing trends werealso found at the majority of sites over 1901–2000. Theannual extreme single-day rainfalls either showed nosignificant trend or significant decreasing trends, dependingon the period examined and the method of analysis. TheGPD of single-day rain events exceeding 1mm alsoshowed either no significant trends or significant decreas-ing trends. Many of the decreasing trends in single-dayextreme rainfall were found in the sub-humid western,northern and eastern fringes of the Canadian prairies.Thus, over the periods 1901–2000 and 1950–2000, the
importance of summer single-day storms for producingrunoff in the Canadian prairies does not appear to haveincreased and appears to have declined at some locations.The increase in trace values over time in the HACDCrainfall record did not greatly affect these results.The summermultiple-day rain events showed significant
trends to increasing annual maximum accumulation at afew locations over the period 1951–2000, although nosignificant trends were evident over 1901–2000.More sitesshowed significant positive trends in their GPD over bothperiods, indicating that smaller events are more affected bythe changes in the nature of rainfall than are the annualmaxima. Many sites also showed significant trends; all ofwhich were positive in the maximum length of summerrain events over the period 1901–2000 and 1951–2000.Thus, over the periods 1901–2000 and 1950–2000, the
importance of summer multiple-day storms for producingrunoff in the Canadian prairies does not appear to havedecreased and appears to have increased at manylocations. In combination with greater spring and fallrainfall fraction causing a hypothesized increase in springrunoff filling prairie wetlands with snowmelt, the
Copyright © 2012 John Wiley & Sons, Ltd.
increasingly important multiple-day rainfall events maybe able to contribute to prairie runoff.There are significant trends in the multifractal parameters
a and C1 for many sites; all of which indicate increasingtemporal uniformity of summer rainfall. As the multifractalanalyses include both single-day and multiple-day events,they are affected by the changes in the fraction of rainoccurring in single-day events.Over the period 1951–2000, significant trends, both
positive and negative, were found in the rainfall cascade0/1 ratios, although the negative trends, which indicategreater uniformity of rainfall, outnumber positive trends.Over the period 1901–2000, there were few significanttrends, but all were negative in direction.The results of the analyses of the multifractal cascades are
consistent with the results of the analyses of the multifractalconstants and show an overall tendency to increasinguniformity of summer rainfall over all scales between 1 and32 days. In practical terms, this indicates that the rainfall wasless likely to be concentrated in short duration events,separated by rain-free intervals, over the periods tested.These results are also consistentwith the significant trends tolonger duration of annual maximum multiple-day summerrainfall and the decreasing fraction of summer rain falling insingle-day events, found at many locations.Further researchwill be required to determine the effects of
the observed trends in precipitation variables on thehydrology of the Canadian prairies. However, the trends toincreasing precipitation uniformity may imply that frontalprecipitation events, rather than small-scale convectivestorms have increased over the periods of records. If thetrends continue in the future, and are accompanied byincreased spring runoff because of significant trends inprecipitation phase during the fall and spring, the multiple-day rain events may be capable of producing large areas ofrunoff generation in Canadian prairie basins, which willchange the hydrological character of the region. The largescale and highly destructive Canadian prairie flooding of2011 was entirely consistent with this mechanism.
ACKNOWLEDGEMENTS
The authors wish to acknowledge the support of the SGICanada Hydrometeorology Programme and the CanadianFoundation for Climate and Atmospheric Sciencesthrough the Drought Research Initiative. This researchwas performed entirely with Free Open Source Software.
REFERENCES
Adamowski K. 1996. Regional rainfall distribution for Canada. AtmosphericResearch 42(1–4): 75–88. DOI: 10.1016/0169–8095(95)00054–2.
Akinremi OO, McGinn SM, Cutforth HW. 1999. Precipitation trends onthe Canadian prairies. Journal of Climate 12: 2996–3003.
Coles S. 2001. An Introduction to Statistical Modeling of Extreme Values.Springer-Verlag: London. ISBN: 1852334592.
Dyck GE, Gray DM. 1979. Prairie rainfall characteristics. In SummerMeeting of ASAE and CSAE. American Society of AgriculturalEngineers: Winnipeg, Manitoba; 13.
Fang X, Pomeroy JW. 2007. Snowmelt runoff sensitivity analysisto drought on the Canadian prairies. Hydrological Processes 2609:2594–2609. DOI: 10.1002/hyp.
Hydrol. Process. 26, 1752–1766 (2012)

1766 K. SHOOK AND J. POMEROY
Fang X, Pomeroy JW, Westbrook CJ, Guo X, Minke AG, Brown T. 2010.Prediction of snowmelt derived streamflow in a wetland dominatedprairie basin. Hydrology and Earth System Sciences 14(6): 991–1006.DOI: 10.5194/hess-14-991-2010.
Finn D, Lamb B, Leclerc MY, Lovejoy S, Pecknold S, Schertzer D.2001. Multifractal analysis of line-source plume concentrationfluctuations in surface-layer flows. Journal of Applied Meteorology40: 229–245.
Garcia-Marin AP, Jiminez-Hornero FJ, Ayuso-Munoz JL, Rabanales C,Mendel EG. 2008. Universal multifractal description of an hourlyrainfall time series from a location in southern Spain. Atmosfera 21(4):347–355.
Gaume E, Mouhous N, Andrieu H. 2007. Rainfall stochastic disaggrega-tion models: Calibration and validation of a multiplicative cascademodel. Advances in Water Resources 30(5): 1301–1319. DOI: 10.1016/j.advwatres.2006.11.007.
Gray D. 1970. Handbook on the Principles of Hydrology: With SpecialEmphasis Directed to Canadian Conditions in the Discussions,Applications, and Presentation of Data. Water Information Center:Huntingdon, New York. ISBN: 0-912394-07-2.
Gray DM, Toth B, Zhao L, Pomeroy JW, Granger RJ. 2001. Estimatingareal snowmelt infiltration into frozen soils. Hydrological Processes15(16): 3095–3111. DOI: 10.1002/hyp.320.
Hamed KH, Rao AR. 1998. A modified Mann-Kendall trend test forautocorrelated data. Journal of Hydrology 204: 182–196.
Ihaka R, Gentleman R. 2007. R: a language for data analysis and graphics.Journal of Computational and Graphical Statistics 5(3): 299–314.
Marks D, Kimball J, Tingey D, Link T. 1998. The sensitivity of snowmeltprocesses to climate conditions and forest cover during rain-on-snow: acase study of the 1996 Pacific Northwest Flood. HydrologicalProcesses 12: 1569–1587.
Marshall IB, Smith CA, Selby CJ. 1996. A national framework formonitoring and reporting on environmental sustainability in Canada.Environmental Monitoring and Assessment 39: 25–38.
Mehmet BON. 2003. The power of statistical tests for trend detection.Turkish Journal of Environmental Science 27: 247–251.
Mekis É, Hogg WD. 1999. Rehabilitation and analysis of Canadian dailyprecipitation time series. Atmosphere-Ocean 37(1): 53–85.
Mekis É. 2005. Adjustments for trace measurements in Canada. In Proc.15th Conference on Applied Climatology. Am. Meteorol. Soc:Savannah, GA.
Mekis É, Vincent LA. 2005. Precipitation and temperature related climateindices for Canada. American Meteorological Society 16th Conferenceon Climate Variability and Change.
Mekis É, Vincent LA. 2011. An overview of the second generationadjusted daily precipitation dataset for trend analysis in Canada.Atmosphere-Ocean 49(2): 163–177.
Olsson J. 1995. Limits and characteristics of the multifractal behavior of ahigh-resolution rainfall time series. Nonlinear Processes in Geophysics2: 23–29.
Peterson TC, Folland C, Gruza G, Hogg W, Mokssit A, Plummer N.2001. Report on the activities of the working group on climate changedetection and related Rapporteurs 1998–2001. Report WCDMP-47,
Copyright © 2012 John Wiley & Sons, Ltd.
WMO-TD 1071, World Meteorological Organization, Geneva,Switzerland.
Pomeroy J, Fang X,Westbrook C,Minke A, GuoX, Brown T. 2010. Prairiehydrological model study final report. Centre for hydrology report no. 7.Centre for Hydrology, University of Saskatchewan, Saskatoon. 127 p.http://www.usask.ca/hydrology/reports/CHRpt07_PHMS-Final-Report_Jan10.pdf
Raddatz RL. 2000. Summer rainfall recycling for an agricultural region ofthe Canadian prairies. Canadian Journal of Soil Science (March 1999),80: 367–373.
Raddatz RL, Hanesiak JM. 2008. Significant summer rainfall in theCanadian prairie Provinces: modes and mechanisms 2000 – 2004.International Journal of Climatology 28(February): 1607–1613. DOI:10.1002/joc.
Raddatz RL, Kern J. 1984. An assessment of the near real-time rainfallnetwork on Canada’s Eastern prairies. Atmospheric Environment 22(4):474–483.
Royer J, Biaou A, Chauvin F, Schertzer D, Lovejoy S. 2008. Multifractalanalysis of the evolution of simulated precipitation over France in aclimate scenario. Comptes Rendus Geosciences 340(7): 431–440. DOI:10.1016/j.crte.2008.05.002.
Seuront L, Schmitt F, Lagadeuc Y, Schertzer D, Lovejoy S. 1999.Universal multifractal analysis as a tool to characterize multiscaleintermittent patterns: Example of phytoplankton distribution inturbulent coastal waters. J. Plankton Res 21(5): 877–922.
Shook KR, Pomeroy JW. 2010. Hydrological effects of the temporalvariability of the multiscaling of snowfall on the Canadian prairies.Hydrology and Earth System Sciences 14(7): 1195–1203.
Singh P, Spitzbart G, Hubl H, Weinmeister HW. 1997. Hydrologicalresponse of snowpack under rain-on-snow events: a field study. Journalof Hydrology 202(1–4): 1–20.
Stichling W, Blackwell SR. 1957. Drainage area as a hydrologic factor onthe Canadian prairies, in IUGG Proceedings, Volume 111.
Stone D, Weaver A, Zwiers F. 2000. Trends in Canadian precipitationintensity. Atmosphere-Ocean 38(2): 321–347.
Vincent LA, Mekis É. 2006. Changes in daily and extreme temperatureand precipitation indices for Canada over the twentieth century. ScienceAnd Technology 44(2): 177–193.
Vincent LA, van Wijngaarden WA, Hopkinson R. 2007. Surfacetemperature and humidity trends in Canada for 1953–2005. Journalof Climate 20: 5100–5113.
Woo M-K, Rowsell RD. 1993. Hydrology of a prairie slough. Journal ofHydrology 146: 175–207.
Yue S, Pilon P, Phinney B, Cavadias G. 2002. The influence ofautocorrelation on the ability to detect trend in hydrological series.Hydrological Processes 16(9): 1807–1829. DOI: 10.1002/hyp.1095.
Zhang X, Hogg W, Mekis É. 2001. Spatial and temporal characteristicsof heavy precipitation events over Canada. Journal of Climate 14:1923–1936.
Zhang X, Zwiers FW, Li G. 2004. Monte Carlo experiments on thedetection of trends in extreme values. Journal of Climate 17(10):1945–1952, DOI: 10.1175/1520–0442(2004)017< 1945:MCEOTD2.0.CO;2.
Hydrol. Process. 26, 1752–1766 (2012)