changes in the arctic environment - the university of virginia · graphics courtesy michael mann/...
TRANSCRIPT

Changes in the Arctic EnvironmentStephen Macko, Professor Department of Environmental Sciences, University of Virginia
May 21, 2009; Seward, AlaskaPhoto courtesy John Snyder

This is a time of unprecedented change in the Arctic. Conditions are changing faster than at any time in the past 10,000 years.
Photo: Stephen Macko

Graphics courtesy Robert A. Rohde / Global Warming Art
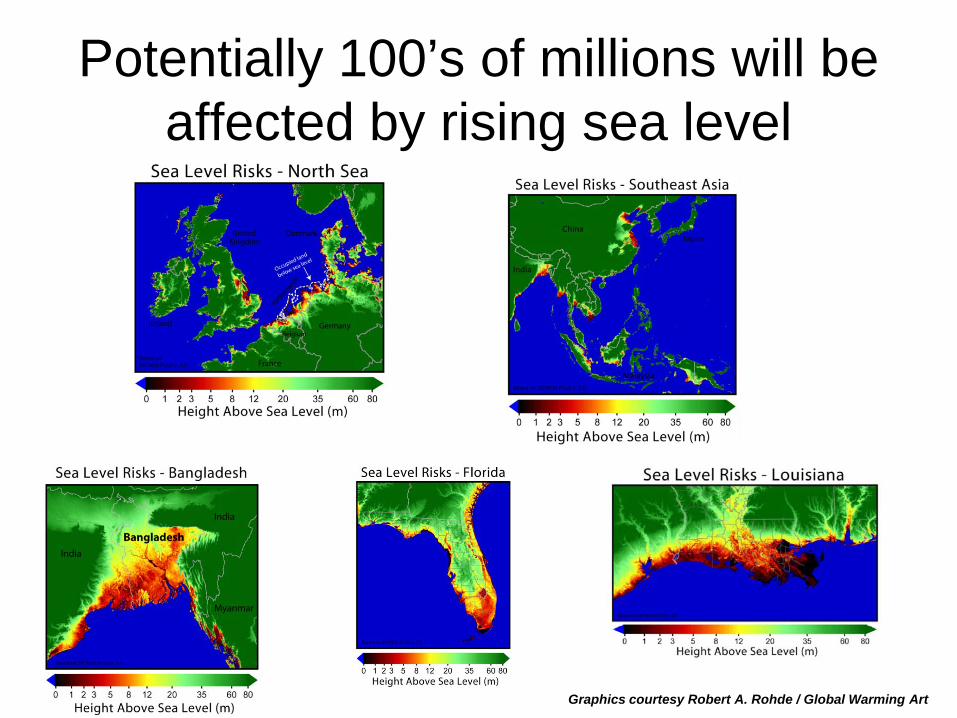
Potentially 100’s of millions will be affected by rising sea level
Graphics courtesy Robert A. Rohde / Global Warming Art

The Arctic receives less recognition
Graphics courtesy Robert A. Rohde / Global Warming Art

Graphics courtesy Michael Mann/ IPCC
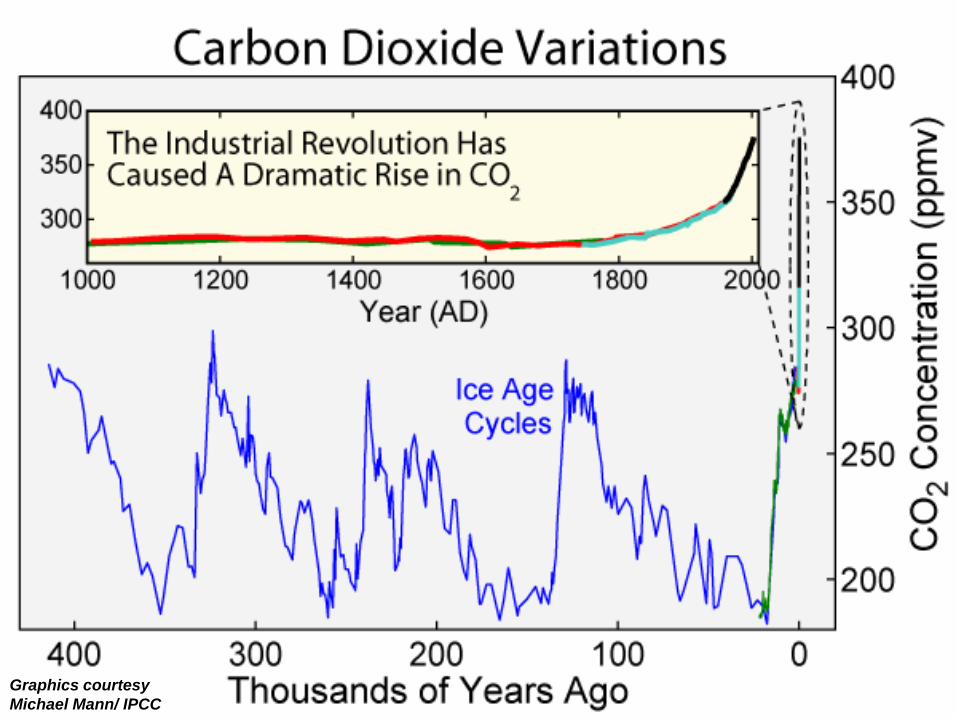
Graphics courtesy Michael Mann/ IPCC

The “usual” suspectsMethane has 10-20 times the effect of carbon dioxide, but does not reside in the atmosphere as long
Most of the emissions come from the developed world, and chiefly a few countries. This will change with higher and warmer seas.

Projected Future Warming
Graphics courtesy Michael Mann, IPCC

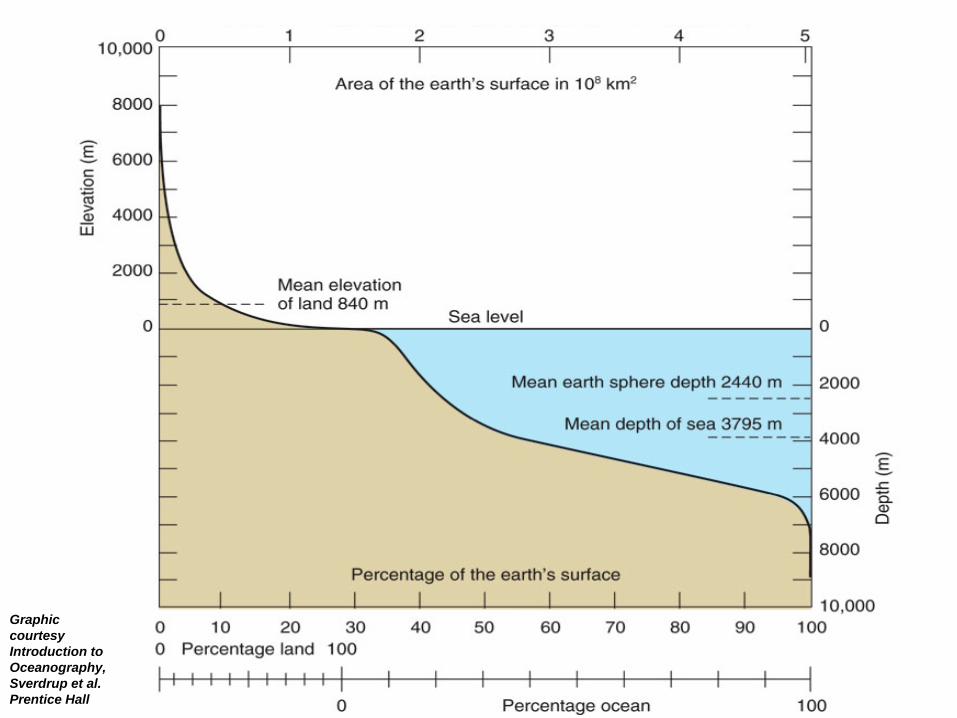
Graphic courtesy Introduction to Oceanography, Sverdrup et al. Prentice Hall


Some of the changes influenced by rising sea levels and warming temperatures are obvious:
Increased exploration and exploitation of Arctic mineral resources (hydrocarbons)
Increased avenues for maritime transport between the Atlantic and Pacific (Northwest Passage)
Increased tourismPhoto: Stephen Macko

Greater Risks of Introduction of Environmental Contaminants
2006, Prudhoe Bay, 1 million litersGreater wind velocities

Propagation of those contaminants within the Arctic food webs

Some of the effects or “collateral” impacts are not so obvious and desperately need further study
• Release of methane from either gas hydrates on the seabed, or stored in the coastal permafrost peats
• Loss of diversity and modification of sustainable trophic structure (food webs)
• Changes to the Ocean chemistry itself (pH)

Gas Hydrates on the Seabed
Potentially many times the reserves of fossil fuel carbon exists as methane hydrates.
The Arctic alone is estimated to have greater than 400 Gt .
Photo: Stephen Macko
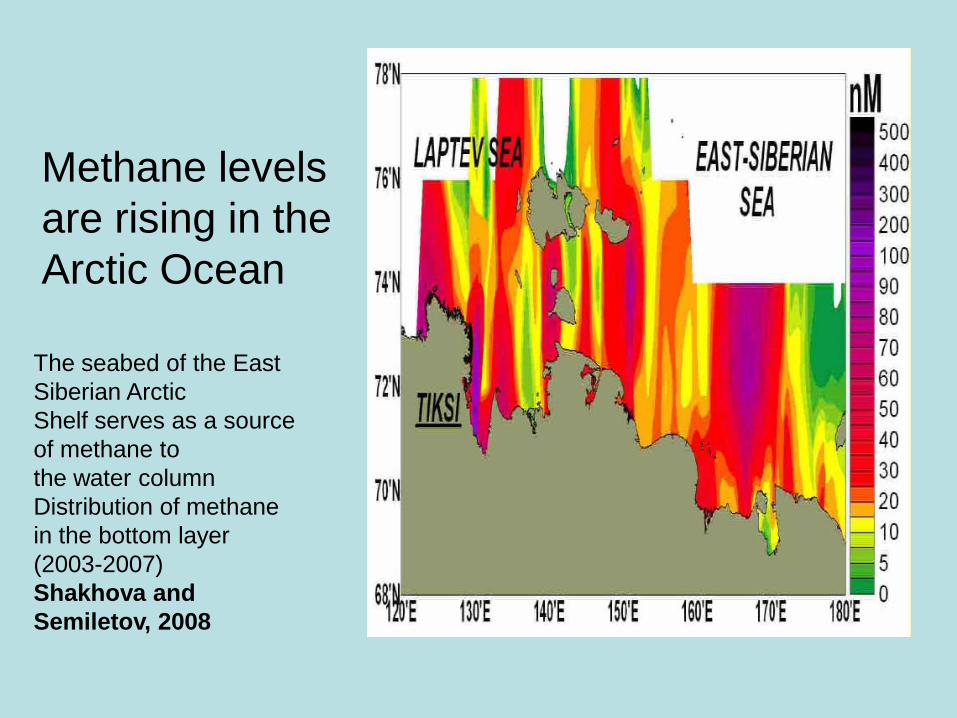
The seabed of the East Siberian ArcticShelf serves as a source of methane tothe water columnDistribution of methane in the bottom layer (2003-2007)Shakhova and Semiletov, 2008
Methane levels are rising in the Arctic Ocean
Graphic courtesy Introduction to Oceanography, Sverdrup et al. Prentice Hall

Arctic Peats and PermafrostLena River delta , Siberia
Mallick Well in Canada Photo credit Department of Energy

With Rising Temperatures Permafrost will Shrink

Graphic courtesy Introduction to Oceanography, Sverdrup et al. Prentice Hall

Graphic courtesy Introduction to Oceanography, Sverdrup et al. Prentice Hall

Primary Production of the Water Column: Phytoplankton
A bloom of coccolithophore plankton recorded near Newfoundland in 1999 by NASA’s SeaWiFs satellite
dinoflagellate
coccolithophore
SEAWIFS Image courtesy NASA

Life at the edge: Melosira arctica
Massive production supports the community of the benthic environment. Diminished sea ice suggests significant loss of this production to coastal food webs
Photo Stephen Macko

Arctic coastal food web

Graphic courtesy Introduction to Oceanography, Sverdrup et al. Prentice Hall

Upper ocean temperatures have increased by 1ºC in the last 50
years -WAP most rapidly warming region on planet
Southern Ocean is also Undergoing Major Environmental Changes
Parkinson (2002)
19
76
19
78
19
80
19
82
19
84
19
86
19
88
19
90
19
92
19
94
19
96
19
98
20
00
20
02
Year
Den
sity
(n
o. m
-2)
1
10
100
1000
30% decline in Antarctic krill in SouthAtlantic in last 30 years
Graphics Eileen Hoffman, Old Dominion University/GLOBEC

GLOBEC INTEGRATED ANTARCTIC STUDY
Graphics Eileen Hoffman, Old Dominion University/GLOBEC

The Southern Ocean Food Web?
Graphics Eileen Hoffman, Old Dominion University/GLOBEC

Multiple Food Webs
Ross Sea
Western AntarcticPeninsula
Classical Food Web
Graphics Eileen Hoffman, Old Dominion University/GLOBEC

Differences influence structure, just like the Arctic
HighAntarctic
SubAntarctic
LowProduction High Production
Seasonal length
Differences due toCirculation
Sea-iceBiogeochemistry
ProductionSeasonality
Graphics Eileen Hoffman, Old Dominion University/GLOBEC
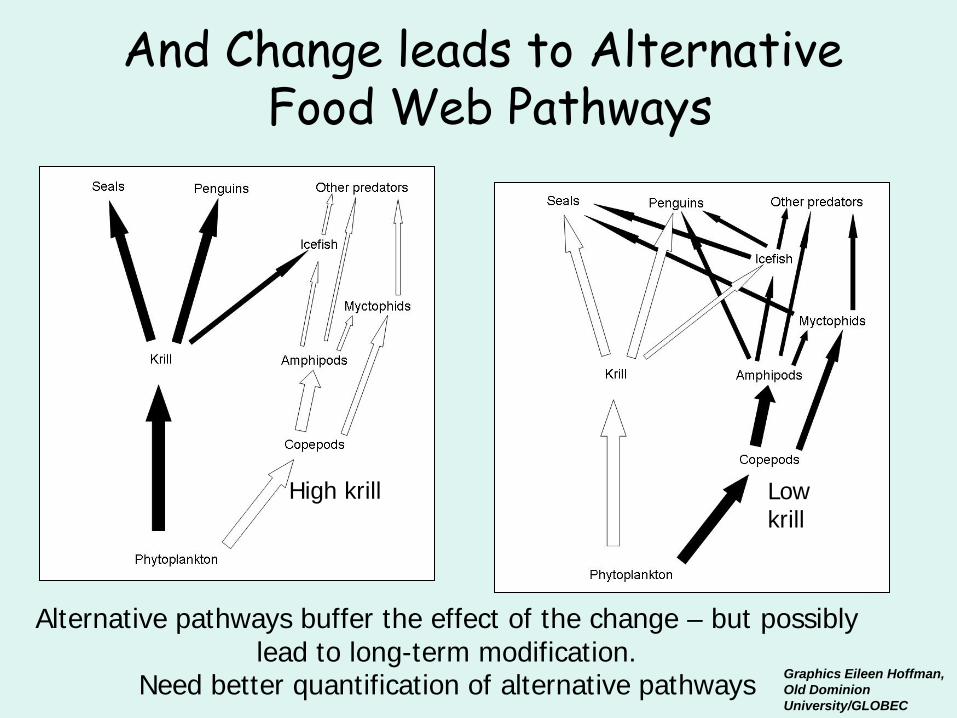
Alternative pathways buffer the effect of the change – but possibly lead to long-term modification.
Need better quantification of alternative pathways
And Change leads to Alternative Food Web Pathways
High krill Low krill
Graphics Eileen Hoffman, Old Dominion University/GLOBEC

Energy flow inalternative food webpathways
Less energy reaching higher trophiclevels
Top predators nutrition affected, potential decline in abundances
Graphics Eileen Hoffman, Old Dominion University/GLOBEC


Idealized patterns of the dominant circulation regimes of the Arctic Ocean. Two circulation regimes of surface waters (anticyclonic—top; cyclonic—bottom) are shown in wide blue arrows. In the cyclonic regime the clockwise circulation pattern in the Beaufort Sea region (the Beaufort Gyre) weakens, and the flow across the basin, from the Siberian and Russian coasts to Fram Strait (the Transpolar Drift), shifts poleward. The cyclonic pattern dominated during 1989–1996; the anticyclonic pattern has prevailed since 1997. The Atlantic water circulatescyclonically (red arrows) at approximately 200–800 m deep, independent of the circulation regime of the surface layer. (Adapted from Proshutinsky et al., 2005.)
Since 1997; cyclonic
From 1986-1996; anticyclonic

Spawning and Higher Temperatures
Critical temperatures exist for all fish
Need for ice cover is unknown for all of the species
Stock size for present populations under ice unknown- easy to overfish

Higher trophic levels, like the mammals
Belugas
Photo Stephen MAcko

Seals, walruses, sea lions, polar bears
Photo Stephen Macko

will have their survival threatened as the habitat and tropic structure changes
Photo GIFT Workshop, EGU

Red Knot Declines in migratory birdsPhoto courtesy Mike Erwin

One of hundreds of species …. and millions of shorebirds… that use the coastal zone for breeding

One of hundreds of species …. and millions of shorebirds… using the Arctic coastal zone for breeding….
and are or will be in decline
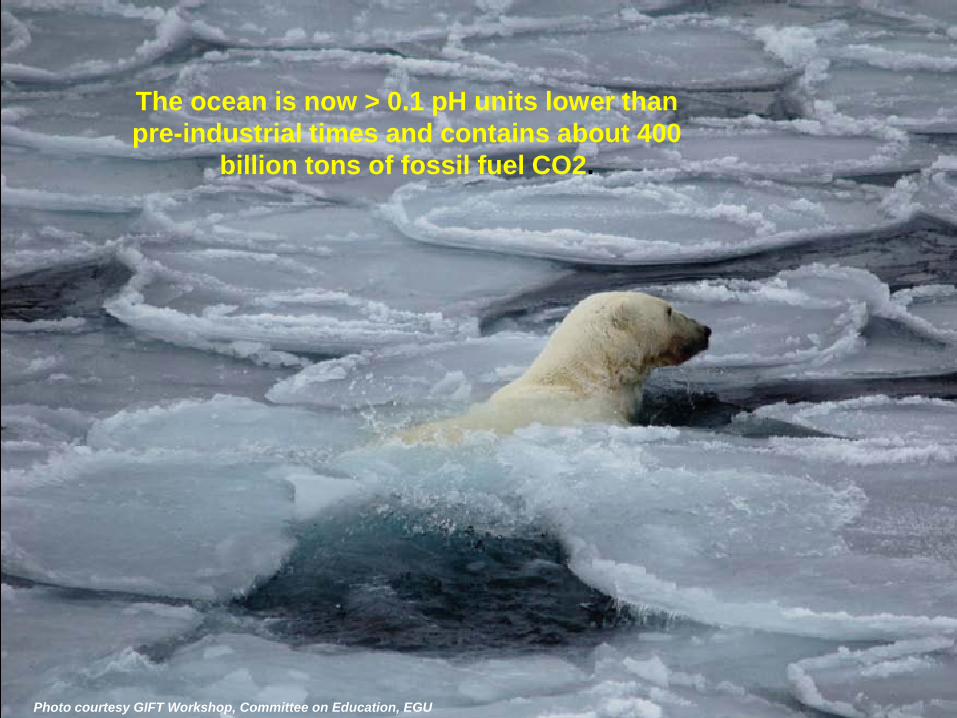
The ocean is now > 0.1 pH units lower than pre-industrial times and contains about 400
billion tons of fossil fuel CO2.
Photo courtesy GIFT Workshop, Committee on Education, EGU

Foraminifera: composed of calcium carbonate
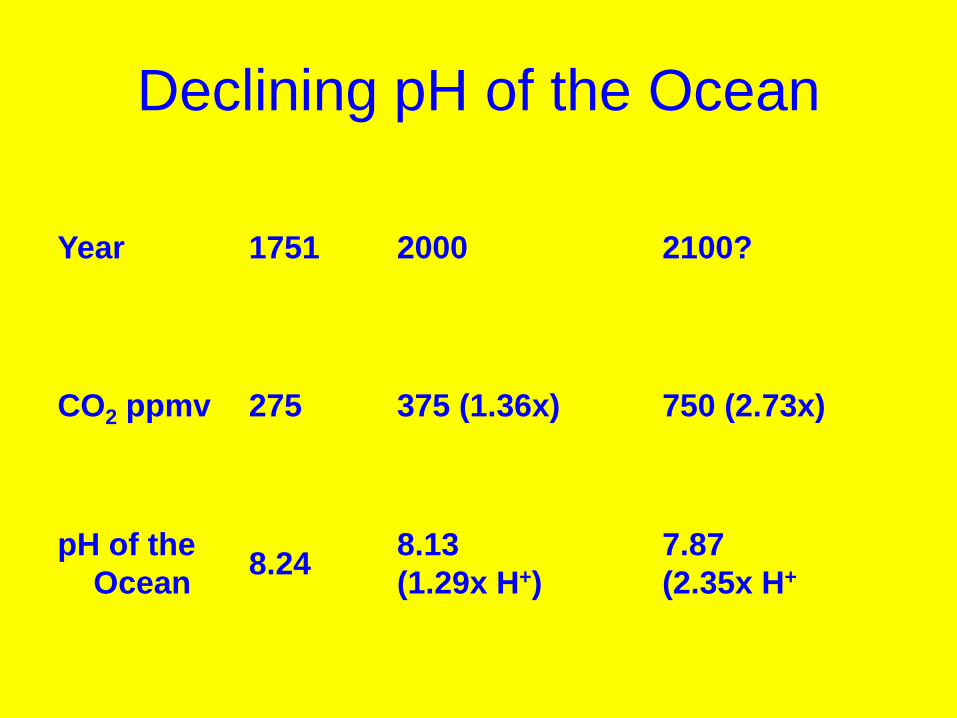
Declining pH of the Ocean
Year 1751 2000 2100?
CO2 ppmv 275 375 (1.36x) 750 (2.73x)
pH of the Ocean 8.24 8.13
(1.29x H+)7.87(2.35x H+


Continued CO2 Emissions and Ocean Acidification
Anthropogenic CO2predicted to decrease surface ocean pH by 0.7
pH has probably already changed by 0.1 in surface waters due to absorption of anthropogenic CO2
While climate change has uncertainty, these geochemical changes are highly predictable. Only the time scale, and thusmixing scale length are really under debate.
Caldeira & Wickett 2003, Nature: A simulation of changes in ocean pH assuming continued usage of known fossil fuel reserves.

Coccolithophores and Ocean Acidification
A bloom of coccolithophore plankton recorded near Newfoundland in 1999 by NASA’s SeaWiFs satellite
Acidification of the ocean waters

PISCIVOROUS FISH
DISSOLVED ORGANIC MATTER
PLANKTIVOROUS FISH
ZOOPLANKTON CILIATES
NANOFLAGELLATES
BACTERIA
PHYTOPLANKTON
2x10⁴
Size
(µ
m)
= microbial loop= classical
food chain
2x10³
200
20
2
0.2
Change in any part of the foodweb may have consequences on the rest of the
foodweb, ocean biogeochemistry and the whole ecosystem
Whole Ecosystem Effects
Graphics Eileen Hoffman, Old Dominion University

An opportunity in a time of unprecedented change?
Photo Stephen Macko

Jurisdictional representations of the Arctic Ocean with boundaries based on (left) sea floor as a source of conflict among nations (different colors) and (right) overlying water column as a source of cooperation, with the high seas (dark blue) as an international space in the central Arctic Ocean surrounded by EEZs (light blue) CREDITS: (TOP) INTERNATIONAL BOUNDARIES RESEARCH UNIT, UNIVERSITY OF DURHAM; (BOTTOM) ADAPTED FROM CANADIAN POLAR COMMISSION
SCIENCE AND GOVERNMENT:Governance and Environmental Change in the Arctic OceanPaul Arthur Berkman and Oran R. Young Science April 17, 2009

An unprecedented opportunity for international environmental cooperation
Photo Stephen Macko

The future for consequential change in the Arctic is already here
Photo courtesy GIFT Workshop, Committee on Education, EGU

Acknowledgements
Michael Mann, Michael Erwin, Carleton Ray, Howie Epstein, Eileen Hofman, Scott Doney, Sarah Cooley, Carol Turley, the IPCC, ACIA, GIFT and the Community of Polar Researchers and their graphics support
A team effort
Photo courtesy GIFT Workshop, Committee on Education, EGU