changes in forest dynamics along a 2.5 km … · abstract . tropical montane cloud forests are...
TRANSCRIPT

CHANGES IN FOREST DYNAMICS ALONG A 2.5 KM ELEVATION GRADIENT ON THE SOUTHEASTERN FLANK OF THE PERUVIAN ANDES
BY
WILLIAM FARFAN RIOS
A Thesis Submitted to the Graduate Faculty of
WAKE FOREST UNIVERSITY GRADUATE SCHOOL OF ARTS AND SCIENCES
in Partial Fulfillment of the Requirements
for the Degree of
MASTER OF SCIENCE
Biology
May 2011
Winston-Salem, North Carolina
Approved By
Miles R. Silman, Ph.D., Advisor
Kathleen A. Kron, Ph.D., Chair
William K. Smith, Ph.D.

ACKNOWLEDGEMENTS
I would like to sincerely thank my advisor, Miles R. Silman, for introducing me to
tropical community ecology, giving me the opportunity to work and travel to remote
areas of Peru, for his patience, support, and for being a mentor and friend to me over the
past seven years. I thank my committee members, Dr. Kathleen A. Kron and Dr. William
K. Smith, for their time, helpful ideas and comments in this research.
Special thanks to Norma Salinas, my undergraduate professor for introducing me to
Botany in the Peruvian Andes, and also my special gratitude to Karina Garcia for her
leadership and support in the plots establishments and data processing, and also for her
friendship and companionship.
I thank the team that accompanied me during my fieldwork, foremost to Natividad
Raurau, Alberto Gibaja, Marlene Mamani, Vicky Huaman and Tatiana Boza, not only for
their help during the data collection process but also for their friendship and support.
Without the Peruvian students I would not have been able to complete this research, my
special thanks to Darcy Galiano, Walter Huaraca, Javier Silva, Angela R. Brian V., Israel
Cuba, Jhoel Delgado, Percy Chambi, Erickson Urquiaga, Alex Nina, Jhoel Salazar, Flor
Zamora, Kilmenia Luna, Karina Luna, Luis Mansilla, Janet Mamani, Jesus Castaneda,
Rosalvina B. and Yolvi V., for being with me in the field collecting data in the first and
second plot census.
ii

I thank my veteran friend Luis Imunda G., the master of the “machete” for his
inexhaustible strength in our campaigns from the Andes to the Amazon. I also thank Josh
Rapp for all of the help with data analysis in “R”, and to Kenneth Feeley, Noah Yavit,
Rachel Hillyer, Becky Dickson and Sarah Maveety for their help and support.
Finally, I would like to thank my family for their unconditional support, especially to
Julio F., Visitacion R., Maikol F. and Henry F.
This study was funded by Andes Biodiversity and Ecosystem Research Group (ABERG),
Wake Forest University, the National Science Foundation, the Gordon and Betty Moore
Foundation and the Blue Moon Foundation. I thank the Servicio Nacional de Areas
Naturales Protegidas por el Estado (SERNANP), Amazon Conservation Association,
Cock-of-the-Rock Lodge and Manu National Park for the opportunity to perform this
research.
iii

TABLE OF CONTENTS
ACKNOWLEDGEMENTS ……………………………………………………… ii
LIST OF TABLES ……………………………………………………………….. vi
LIST OF FIGURES ……………………………………………………………… vii
ABSTRACT ……………………………………………………………………… viii
INTRODUCTION ……………………………………………………………….. 1
Forest dynamics in the lowland tropics …………………………………. 1
Vital Rates in Forest Tree Communities …………………………………. 2
Dynamics in Montane Forests …………………………………………… 4
METHODS ………………………………………………………………………. 7
Study Site ………………………………………………………….……… 7
The Plots …………………………………………………………………. 7
Environmental Characteristics …………………………………….…….. 8
Calculation of Stand-level Rates ………………………………………… 8
Mode of Death …………………………………………………………… 10
Wood Density data ……………………………………………………….. 10
RESULTS ………………………………………………………………………... 12
Montane Forest Structure and Elevation ………………………………… 12
Montane Forest Dynamics ………………….……………………………. 12
Mode of Death in Montane Forest ……………………………………….. 13
Stands Dynamics and Wood Density …………………………………….. 14
iv

DISCUSSION ……………………………………………………………………. 16
Trends in Montane Forest Structure ……………………………………... 16
Stand Forest Dynamics …………………………………………………... 17
How do stems die? ……………………………………………………….. 19
Montane forest dynamics as a function of wood density ………………… 20
CONCLUSIONS …………………………………………………………….…… 22
LITERATURE CITED ….……………………………………………………….. 23
TABLE. …………………………………………………………………….….…. 33
FIGURES ………………………………………………………………………… 34
CURRICULUM VITAE …………………………………………………….…… 53
v

LIST OF TABLES
Table 1. Description of the one hectare permanent plots included in this research. 33
vi

LIST OF FIGURES
Figure 1. Study site ………………………………………………………………. 38
Figure 2. Stem density and multi-stem production across elevation …………….. 39
Figure 3. Relationship of stem basal area and elevation …………………………. 40
Figure 4. Boxplot of mortality and recruitment rates …………………………….. 41
Figure 5. Frequency distribution of death stems across elevation ……………….. 42
Figure 6. Mortality and recruitment rates across elevation .…………………..….. 43
Figure 7. Turnover rates across elevation ………………………………………... 44
Figure 8. Population change rates across elevation ……………………………… 45
Figure 9. Histogram of population change for the entire community ……….…… 46
Figure 10. Mode of death for all stems ………………………………………..…. 47
Figure 11. Mode of death across elevation ………………………………………. 48
Figure 12. Mean species wood density across elevation ………………………… 49
Figure 13. Wood density weighted by species and stems across elevation ……… 50
Figure 14. Mortality, recruitment and turnover vs. wood density ……………….. 51
Figure 15. Mode of death vs. wood density ……………………………………… 52
vii
ABSTRACT
Tropical montane cloud forests are poorly studied botanically, and nearly unstudied
ecologically, even for basic stand-level measurements critical for understanding questions
ranging from maintenance of diversity to ecosystem services (Budd et al. 2004). The aim
of this study was to describe changes in forest structure, dynamics and mode of tree death
across 2.5 km elevation gradient in a tropical montane cloud forest in the Andes of
southeastern Peru. In 16 1-ha permanent tree plots over a four year interval all stems (≥
10 cm DBH) were tagged, identified and measured initially, then recensused 2-4 yrs later.
Results showed that stem mortality decreased significantly with elevation while
recruitment did not, resulting in a significant decrease in stem turnover with elevation.
Across all elevations the dominant mode of death was by being uprooted. Deaths due to
stem snapping were more frequent at lower elevations while uprooting was greater at
higher elevations. Trees dying standing had a non-linear relationship with elevation. This
study also gave insight into the effects of elevation on the species trait of wood density,
and further tested the hypothesis that wood density was an important predictor of how
stems died. Results showed that species wood density increased with elevation and was
associated with decreasing stem mortality; in particular the frequency of snapped stems.
Overall stem density declined in the four year period due the high rates of stem mortality
that were not balanced by recruitment. The high dynamism in low elevations can
probably be attributed to changes in species composition and species trait spectra, as well
as soil-nutrient relationships. The patterns found in this study lay the groundwork for
mechanistic studies of factors controlling forest dynamics in tropical montane sites.
viii

ix
Keywords: Tropical montane cloud forest, Andes, elevation gradient, forest dynamics,
permanent tree plots, mortality, recruitment, turnover, wood density.

INTRODUCTION
Stand dynamics, such as stem mortality, recruitment and turnover rates, have important
implications for forest ecology. Tree diversity, composition, species coexistence
(Denslow 1987, Manokaran and Kochummen 1987, Condit 1992, Phillips et al. 1994,
Rees et al. 2001, Laurance et al. 2004), the evolution of tree life histories (Clark and
Clark 1992), the generation of habitat for other organisms, the control of terrestrial
nutrient cycling (Laurance et al. 2010) and even a major component of earth's carbon
balance depend fundamentally on tree growth, recruitment and mortality at broad
temporal and spatial scales (Phillips et al. 1998, Whittaker et al. 1998, Clark 2002, Chave
et al. 2003, Baker et al. 2004, Phillips et al. 2004, Rice et al. 2004). While studies of
forest dynamics are relatively common in lowland tropical forests, tropical montane
forests are poorly studied (Budd et al. 2004). This study attempts to addresses this gap in
knowledge by describing forest dynamics across a 2.5 km elevation gradient in the
Peruvian Andes.
Forest dynamics in the lowland tropics
Studies of tropical forest dynamics have been conducted mainly in lowland rain forest,
and show contrasting results at different geographic and spatial scales. Across the
Neotropics, forests appear to have become more dynamic, with stand-level measurements
such as mortality, recruitment, and turnover of individuals increasing over the past
several decades (Phillips and Gentry 1994, Phillips et al. 1994). Paleotropical sites,
though, do not show this pattern (Phillips et al. 1998). At the landscape scale, Amazonian
1

forests appear to be more dynamic in terms of both mortality and recruitment rates since
the 1970s (Phillips and Gentry 1994, Susan et al. 2009), while Central American and
Malaysian forests have shown periods of both increasing and decreasing rates, with
mortality and recruitment decoupled in time and both dependent on large-scale climate
forces (Condit et al. 1999).
The cause(s) of widespread acceleration in Neotropical forest dynamics are still in
question. At the regional scale, forest dynamics can change due to environmental
gradients in both space and time while temporal trends appear affected by inter-annual
climatic fluctuations, El Niño events (Condit et al. 2004), unusual droughts (Condit et al.
1995, Phillips et al. 2010) and local squalls (Negron-Juarez et al. 2010). All of these can
increase tree mortality rates and consequently shift tree species composition, especially if
the tree species recruiting differ in relative abundance from those dying, and forest
structure via changes in diameter and height distributions (Laurance et al. 2004, Phillips
et al. 2010). In the Amazon Basin, variations in forest dynamics at regional spatial scales
have been attributed to soil fertility (Condit et al. 1999, Phillips et al. 2004). For example
tree dynamism was greater in richer soils of southern and western Amazonian than in the
poor soils of eastern and central Amazonia (Phillips et al. 2004).
Vital Rates in Forest Tree Communities
Tree mortality and recruitment estimates are fundamental descriptors of Pantropical
forest tree populations (Lewis et al. 2004). Tree recruitment is a manifestation of the
fecundity of the species and the growth and survivorship of juveniles in the population
2
through different sizes class , e.g. seedling, saplings, poles and mature trees (Swaine et al.
1987), which can vary as the successional status of the forest changes. Tree mortality
rates have been correlated with maximum longevity and size class distribution
(Lieberman and Lieberman 1987, Swaine et al. 1987), but these correlations are weak,
with a large component of tree mortality due to damage from random events. Measured
rates of mortality across the tropics are 1-2% y-1 and are independent of size class for
trees (≥ 10 cm DBH) reaching the forest canopy (Lieberman and Lieberman 1987,
Swaine et al. 1987).
Tree recruitment is fundamentally linked to openings in the forest canopy (gap phase
dynamics); (Watt 1947, Denslow 1987). Because tree death creates canopy gaps, how
trees die is important. Different modes of death create a variety of tree regeneration
opportunities due to the diverse environments created in disturbances of different scales
(Gale and Barfod 1999, Arriaga 2000). Trees that die by being uprooted or snapped
cause small-to-large (0.01 to 1 ha) light gaps in the forest, with these light gaps being a
major mode of secondary succession (Denslow et al. 1998). Conversely, when trees die
standing, very little change occurs in light availability in the forest and most of the
change that does occur happens in the canopy layers of the stand rather than at ground
level. Death by uprooting is due to the interplay of disturbance agents such as wind and
rainfall with site properties such as soil anchorage and steep slopes (Gale and Barfod
1999, Arriaga 2000). Snapping involves the same physical agents as uprooting, but biotic
interactions (Gale and Barfod 1999, Arriaga 2000) and wood properties (Putz et al. 1983,
Chao et al. 2009) can be important as well, which means that there can be large
3
interspecific differences in the susceptibility and recovery from snapping. In contrast,
standing death may indicate intrinsic loss of vigor, senescence, and the effects of biotic
interactions such as pathogens, insect attack and competition with other trees or lianas
(Carey et al. 1994, Midgley et al. 1995, Phillips et al. 2005, Ingwell et al. 2010). The
dominant mode of stem death differs at regional scales. For example, snapping is more
common in the north-western Amazonia in contrast with the north-eastern Amazonia
where the standing mode is more common (Putz et al. 1983, Chao et al. 2009). Mode of
death also differs between functional groups, e.g. dicotyledonous trees predominantly die
uprooted and snapped, while arborescent palms mostly die standing and snapped (Gale
and Barfod 1999).
The size of disturbance is also important in forest dynamics, and this can vary from small
scale differences, such as whether trees die standing, in single tree-fall gaps, or are tied
together by lianas into multiple tree-fall gaps (scales of 0.01 to 0.5 ha). Larger scale
disturbances are driven by microbursts (1-10 hectares), local squalls (10-1000 ha) or
regional frontal systems and hurricanes (1000-100000 ha), and can kill much larger
numbers of trees (Negron-Juarez et al. 2010).
Dynamics in Montane Forests
Major gradients in forest diversity, species composition and ecosystem function are seen
along elevational gradients in tropical mountains. Elevational gradients are important for
the study of vegetation–environment relationships because significant environmental
variations are compressed into short distances, with rapid changes in tree communities.
4

They may also be excellent natural laboratories for understanding the effects of biotic-
abiotic interactions in plant communities and processes of ecosystem function (Kitayama
1992, Malhi et al. 2010). Patterns observed across forested tropical elevational gradients
include tree diversity decreasing with greater elevation (Gentry 1988, Kitayama 1992,
Madsen and Ollgaard 1994, Lieberman et al. 1996, Homeier et al. 2010) and turnover in
species composition decreasing at higher elevations (Lieberman et al. 1996, Vazquez and
Givnish 1998). In terms of forest structure, both increases (Heaney and Proctor 1990,
Kitayama 1992, Vazquez and Givnish 1998, Aiba and Kitayama 1999) and decreases
(Homeier et al. 2010) in basal area and stem density have been observed with elevation,
while above ground biomass and net primary productivity decline with increasing
elevation (Girardin et al. 2010, Homeier et al. 2010).
Little is known about forest dynamics in tropical montane forests across elevational
gradients. The few studies in tropical montane forest that have analyzed mortality and
recruitment rates have focused on differences between slope and ridge rather than
elevation per se. In the montane forest of Australia tree turnover is greater on upper
slopes or near the ridge-crest in comparison to downslope areas (Herwitz and Young
1994), whereas in Jamaica mortality can be higher on slopes than on ridges in areas
affected periodically by hurricanes (Bellingham and Tanner 2000).
Even though forest dynamics are important determinants of species composition, species
diversity, functional traits, and ecosystem function, they are little studied on tropical
mountains. Thus, the purpose of this study is to provide the first analysis of stands
5

dynamics in a New World montane forest. The study uses 16 1-ha permanent tree plots
along a 2.5 km elevational gradient in a primary tropical montane cloud forest (TMCF) in
Manu National Park in the southeastern Peruvian Andes. The general goal of this study
was to detect the spatial and temporal patterns of tree communities in TMCF across the
elevational gradient. The specific goals of the study were to: (1) explore the trends in
forest structure across the elevational gradient; (2) explore patterns in tree dynamism
(mortality, recruitment, turnover and population change rates) along the gradient; (3)
investigate trends of mode of death across the gradient, and (4) ask whether this
dynamism and mode of death can be explained by the wood properties in tree
communities. I hypothesized that tree dynamism will decrease with increasing elevation
and predicted that the changes would be explained by wood mechanical properties (wood
density as a proxy), I also hypothesized that the snapped and standing modes of death
would predominate at lower elevations, with uprooted trees being more common at
higher elevations. Finally, I predicted that snapped trees would be stems with low wood
density.
6

METHODS
Study Site
This study was carried out in the tropical montane cloud forest (TMCF) in Manu National
Park (MNP) on the eastern slope of the Peruvian Andes (Figure 1).
The Plots
A network of 16 1-ha permanent plots was established by the Andes Biodiversity and
Ecosystem Research Group (ABERG 2010) along a 2.5 km elevational gradient in a
primary montane forest in MNP. Thirteen plots were established along the transect from
the localities of Trocha Union through Tono in the Kosñipata Valley between 3450 -
1000 m of elevation, with plots located approximately every 250 m in elevation.
Elevational replicate plots were established at the Wayquecha (3000m) and Callanga
(1250m and 1500m) sites (Figure 1). Eleven plots were located on ridges, four were
adjacent to the ridge top, and the last plot was established the in relatively flat ground at
the foot of the mountains. The basic description of the plots is presented in Table 1. For a
detailed description of tree species composition, diversity, structure and additional
permanents plots from ABERG (2010) group see Silman (in prep).
The first census in Trocha Union and Wayquecha was in 2003, for Callanga and Tono in
2004, San Isidro in 2005 and San Pedro in 2006; after 2-4 years the second census for
each tree plot was undertaken. Plot establishment dates and census intervals are found in
Table 1. All living wood stems ≥ 10 cm in diameter at breast height (DBH) were
7

measured, identified, tagged and mapped. Life forms included true trees, tree ferns,
palms and lianas ≥ 10 cm diameter within 2 m of the ground. For individuals with
multiple stems the DBH of each stem was measured. The diameter of each stem was
measured at breast height (1.3 m above ground) unless the trunk presented irregularities
in which case it was measured at the nearest point where the stem was cylindrical and the
most uniform.
Environmental Characteristics
Most of the plots (12 plots) are on Ordivician shales and slates, with exception of the
plots in Trocha Union (2000 m, 1800 m) and Callanga (1500 m, 1250 m) which are on
Permian granite. Temperature decreases linearly with elevation with a lapse rate of 5.2
oC/km and ranges from a mean annual temperature of ~ 20 oC at 1000 m to 7.7 oC at the
top of the transect at 3500 m (Rapp 2010). Annual rainfall is high across the gradient
with an average exceeding 5000 mm at the base of the transect decreasing to ~ 2600 mm
at the highest elevation plot (3450 m), with significant inter-annual variability throughout.
Only at the highest plot does potential evapotranspiration (PET) ever exceed rainfall, and
then only occasionally in month of June. There is a distinct seasonality in rainfall, with
highest rains in January and February and the lowest in June and July. Winds have little
seasonal variation, although higher wind speeds occur at lower elevation. Strong wind
gusts were rare (2007/8), affecting the lower elevations more strongly during austral
summer (Rapp 2010).
Calculation of Stand-level Rates
8

In the final census, all the new (recruits) stems ≥ 10 cm (DBH) were measured, including
individuals with multiple stems. All were marked with spray paint at 1.3 m above ground
or at the closest cylindrical point if there were irregularities in the trunk. To evaluate
mortality, all dead and missing stems were recorded. Stems that were snapped or
uprooted but had sprouts or bark showing fresh tissue were considered alive. To calculate
mortality, recruitment, turnover and population change rates standard methodology was
used (Phillips et al. 1994, Sheil et al. 1995, Condit et al. 1999). In the following equations,
N0 is the number of initial stems, Nt number of final stems, Ns the initial stems surviving
at the final inventory, t is the time interval, and ln N is the natural logarithm of N.
Mortality (m), recruitment (r) and population change (λ) rates were calculated as:
For mortality
tNN
m slnln 0 −= (1)
For recruitment
tNN
r st lnln −= (2)
And for population size change
tNNt 0lnln −
=λ (3)
Turnover rates were calculated as the mean of the mortality (1) and recruitment (2) rates
(Phillips et al. 1994).
9

Mode of Death
Mode of stem death was recorded in the second census (2007/09) for all the ABERG
(2010) plots. Definitions for the three main modes of death are according to Gale and
Barfod (1999). Standing were those dead stems with most of the crown branches on their
standing stems or those with the debris scattered around the trunk. Snapped were stems
broken close to the ground level, characterized by a broken trunk and part of the stem
fallen with the crown and branches attached. Uprooted stems were dead trunks showing
the roots with soils attached. Stems where the mode of death could not be identified were
assigned as unclassified and included in the stems that were not found in the second
census. For this study was not classify tree death in terms of gap size (i.e. single versus
multiple tree-falls) because the goal was to know how the stems died rather than the
spatial distribution of the mode of death. Linear regression was used to determine the
relationship between elevation and the mode of death.
Wood Density data
Wood density is defined as the ratio of the wood dry mass divided by its green volume
(Chave et al. 2006). Wood samples were collected (2009/10) using an increment borer in
individuals of species in the same transect in the Kosñipata Valley (n=185), but outside
the study plots examined here. The samples were taken only from live trees and multiple
individuals from the dominant species were cored in the surroundings of each permanent
plot, but not within the plots. Additional data of wood density was used from published
compilations (Chave et al. 2006, Chave et al. 2009, Zanne et al. 2009). For the arboreal
species where wood density information was not available, trait values were estimated by
10

using the mean values at genus or family level, assuming that 74 % of the variation at the
species level is explained by genus and 34 % by family (Chave et al. 2006). Linear
regression was used to determine the relationship between elevation and wood density,
and also correlations were used to determine the association of wood density with
measures of stand dynamics and wood density with different modes of death.
11

RESULTS
Montane Forest Structure and Elevation
In the Kosñipata Valley, Callanga and Wayquecha sites, a total of 12, 612 stems (≥ 10 cm
DBH) were measured in the 2007/09 census across the elevation gradient. There was not
significant relationship between stem density and elevation (R2 = 0.03, p = 0.51). Stem
density increased from the lowest plot (1000 m) to the middle elevations, reaching a peak
between 1800 - 2500 m, and then decreasing to the highest plot at 3450 m (Figure 2a). In
addition, the percentage of multi-stemmed trees increased significantly (R2 = 0.6, p <
0.001) with increasing elevation (Figure 2b). Stem basal area varied among the plots and
was not significant related to elevation (R2 = 0.14, p = 0.15; Figure 3). Mean stem basal
area for the entire community across the gradient showed no significant increase between
censuses [32.3 m2 ha-1 ± 3.6 (95 % CI), to 32.8 m2 ha-1 ±3.6 (95 % CI) in the second
census].
Montane Forest Dynamics
Over the study period the number of stems in the community across all elevations showed
a statistically significant decline from 12,850 to 12,612 stems (including recruitment) for
all the 16 1-ha permanent tree plots with an annual decrease of 0.52 % y-1 for the entire
community (Paired t-test; p < 0.05). The distribution of mortality and recruitment rates
for all of the plots across the elevations were skewed with mortality exceeding
recruitment rates (Wilcoxon signed rank test, p < 0.001, Figure 4).
12

Stem mortality had a significant effect on stem density (Paired t-test; p < 0.001), with a
decline from 12, 850 to 11, 871 stems for the entire community. The maximum mortality
rate was 4.3 % y-1 in the plot at 1500 m, the minimum was 0.8 % y-1 in the plot at 3000 m
of elevation, and mean mortality rate was 2.4 % y-1 ± 0.5 % (95 %CI), (Figure 6a).
Annualized stem mortality rates decreased significantly with elevation (R2 = 0.4, p <
0.05), with mortality peaking between 1500 - 2250 m, and decreasing above (Figure 6a);
mortality rate was higher for smaller diameter stems (≥ 10 cm DBH, Figure 5) with 72 %
of dead stems found in the 10-20 cm DBH size class. Mean stem recruitment was 1.9 %
y-1 ± 0.35 % (95 % CI) for the entire community, stem recruitment was higher in the
lower plot at 1000 m with an increment of 2.9 % y-1, while the lowest rate was at 1500 m
with 0.9 % y-1. Overall stem recruitment was unrelated to elevation (R2 = 0.01, p = 0.78;
Figure 6b). Although there was not a consistent relationship of recruitment across
elevations, the mortality and recruitment rates taken together showed a significant
decrease in stand turnover (R2 = 0.3, p < 0.05) with increasing elevation (Figure 7). Mean
stand turnover was 2.16 % ± 0.3 % (95 % CI) for all plots combined. Rates of population
growth were negative for all of the plots below 2750 m except for the plot at 1000 m
(Figure 8). Across elevations population growth became less negative with increasing
elevation (R2 = 0.3, p < 0.05). Overall, there was a decline in the density of stems in the
tree community for this four year period in the tropical montane forest at Manu National
Park (Figure 9).
Mode of Death in Montane Forest
13
For all dead stems across the elevational gradient where information was available, the
uprooted mode of death was predominant (43.6 %), followed by snapped (36.7 %) and
standing (19.7 %), (Figure 10). The three types of modes of death showed different
trends across the elevation, the proportion of stems that died snapped decreased
significantly (R2 = 0.4, p < 0.05) with elevation (Figure 11a), standing proportions had no
relationship (R2 = 0.02, p = 0.59) with elevation (Figure 11b) and finally uprooted
increased significantly (R2 = 0.4, p < 0.05) with elevation (Figure 11c).
Stands Dynamics and Wood Density
Across the elevational gradient wood density values for 395 tree species (120 species
ABERG group (2010) and 275 between Chave (2009) and Zanne (2009) data set) were
collected and compiled. Species mean wood density for the study site was 0.61 g/cm3 ±
0.02 (95 % CI) and the median was 0.64 g/cm3. The maximum was 1.12 g/cm3 for
Machaerium acutifolium (Fabaceae) at 1250 m, and the minimum was 0.1 g/cm3 for
Erythrina ulei (Fabaceae) at 1500 m. Across the gradient, values of mean species wood
density at the plot level increased significantly with elevation (R2 = 0.6, p < 0.001; Figure
12).
The association of forest dynamics (mortality, recruitment, turnover rates) with species
wood density varied across the study area. Mortality rate had a tendency to increase with
species with low wood density (Figure 14a), however the coefficient of determination
was not significant (R2 = 0.2, p = 0.14). The relationship between recruitment and species
wood density was not significant (R2 = 0.004, p = 0.81, Figure 14b). Overall, forest
14

turnover had a slight relationship with species wood density (Figure 14c). Nonetheless
the relationship was not significant (N = 16, R2 = 0.2, p = 0.14). Frequency of snapped
stems had a significant association with wood density (N = 16, R2 = 0.4, p < 0.05; Figure
15a), but standing (Figure 15b) showed no association (N = 16, R2 = 0.002, p = 0.87).
Uprooted showed marginal association with species wood density (Figure15c), there was
no relationship (N = 16, R2 = 0.2, p=0.06).
15

DISCUSSION
This study provides insight into forest dynamics across a 2.5 km elevational gradient on
the eastern flank of the Peruvian Andes, ranging from the base of the Andes to tree line.
Across the gradient tropical montane cloud forest dynamics changed markedly with
elevation. This study found a significant effect of elevation in overall stem turnover and
mode of death, and a significant decline in stem density of the entire community.
Trends in Montane Forest Structure
The tendency of stem density and basal area along elevational gradients in the tropics is
to increase with elevation (Heaney and Proctor 1990, Kitayama 1992, Vazquez and
Givnish 1998, Aiba and Kitayama 1999). The results of this research showed a non-linear
relationship of stem density across the elevation from 1000 m to 3450 m, with a peak at
middle elevations (Figure 2a). This peak at mid-elevation could be due to the high
density of tree ferns in the cloud zone (Lieberman et al. 1996). The increase of multi-
stemmed trees was consistent across the elevation (Figure 2b) and the high density of
multi-stemmed trees at higher elevations support the findings in the Borneo transects
(Aiba and Kitayama 1999). The increase of frequency of multi-stemmed trees with
elevation could be due to the low stem diameter increment in the montane tropical forest
(1.8 mm y-1 ± 0.4 95% CI). It could also be explained by nutrient deficiency at high
elevations (Aiba and Kitayama 1999) in this case the high production of multi-stemmed
trees in poor soils promotes persistence of individuals even if some stems die
(Bellingham and Sparrow 2009). Thus, the strategy changes for tree species, from rapid
16

growth and higher individual mortality at low elevations to slower growth with lower
individual mortality at high elevations. Across the transect, the ability to produce multiple
stems was observed as a trait for species restricted to higher elevations with narrow
ranges (250 m range, e.g. Miconia setulosa Cogn., Weinmannia microphylla Kunth) and
also for species with a wide elevational range, though these produced multi-stemmed
individuals mostly at higher elevations (1250 m range, e.g. Prunus integrifolia (C. Presl)
Walp.).
Basal area was independent of elevation (Figure 3), which could be due to the presence of
large diameter trees close to the tree line (68.1 cm max DBH) where the trees have nearly
the same diameter, but are shorter. The lack of relationship of stem density and basal area
with elevation in this study is consistent even if the elevation range is expanded to the
lowland Amazonian forest (between 300 and 1000 m) with an average stem density of
600 h-1 and average of basal area of 38 m2 ha-1 (Pitman et al. 2001, Silman et al. 2006).
Stand Forest Dynamics
Across the 2.5 km elevational gradient, for the entire community in the tropical montane
cloud forest, there was a marked linear decrease of stem mortality with elevation (Figure
6a). Stand recruitment had a non-linear relationship with elevation (Figure 6b). A
decrease of recruitment with elevation was expected because stem diameter increment
decreases with elevation (Rapp 2010). A plausible explanation for the observed non-
linearity could be the internal heterogeneity of each permanent plot caused by local
disturbance (e.g. landslides, tree falls) effects on stand structure (stand diameter and
17

height) and species composition. Among hectares, variation can also be associated at
landscape-level patch dynamics in montane forests (Myster and Fernandez 1995), but this
has yet to be studied in the Andes.
The paucity of studies of stand dynamics in TMCF across elevational gradients makes it
difficult to compare results across tropical montane regions and hinders a better
understanding of patterns of forest dynamics. There are a few focal studies at only one
elevation examining tree mortality, recruitment and turnover in TMCF. Mean mortality
rates for the present study was 2.4 % y-1, which was almost the same value for TMCF at
the Jamaican site (2.5 % y-1), even though there was a high frequency of disturbance by
hurricanes (Bellingham and Tanner 2000). Mean stand recruitment rates were lower in
the present study in contrast to Jamaican stand recruitment rates, with values of 1.9 y-1
and 2.8 y-1 respectively. Overall, the mean stand turnover rate from this study was
2.16 % y-1, which is high in comparison to forest in Australia (1582 m), with a 1.7 % y-1
turnover rate (Herwitz and Young 1994), and was ~ 15 % lower than TMCF in Jamaica
(1300-1920 m) with a turnover increase of 2.6 %y-1 (Bellingham and Tanner 2000).
Across the gradient there was a marked negative association of stem turnover with
elevation. This significant linear relationship may be explained by the increase in species
turnover at lower elevations with the presence of fast growing species with short life
spans. An alternative explanation of the high turnover at lower elevations could be due to
the effect of soil nutrients along a fertility gradient (Phillips et al. 2004, Madelaine et al.
2007, Susan et al. 2009) in which high and low turnover rates are related to rich and poor
18

soils, respectively. In the study area across the elevational gradient, high nutrient soils are
often at lower elevations with progressively poorer soils with increasing elevation
(Zimmermann et al. 2009, M. Silman, unpublished data).
The significant decline of stems over the census interval for the entire community in the
eastern Peruvian TMCF could be explained by environmental factors that may play an
important role in the abundance and distribution of tree communities. High wind speeds
occurs frequently at lower elevations, and the strong gusts documented during 2007/8 wet
season (Rapp 2010) which fell between the two censuses (2003 to 2009) could have
increased the risk of mortality at lower elevations. An alternative explanation for the
decline in stem numbers could be the drought that affected the Amazonian Basin during
the austral winter in 2005 (Marengo et al. 2008) which lead to an increase in tree
mortality across the Amazon due to hydraulic limitations (Phillips et al. 2010). This event
could increase the mortality of stands with the largest impact expected at cloud base
(between 1500 -2000 m), which is consistent with the observed areas where population
growth was the most negative (Figure 8).
How do stems die?
The mode of tree death changed in a consistent manner across the gradient. Uprooting
was the most common mode of death along the gradient in contrast with snapped which
is the predominant mode of death in lowland Amazonian forest (Gale and Barfod 1999,
Chao et al. 2009). The significant increase of death by uprooting with elevation could be
explained by a weak tree anchorage (Putz et al. 1983) combined with shallow soils at
19

higher elevations. Snapped trees are related to biomechanical features and also to soil
depth that controls tree anchorage (Gale and Barfod 1999). These factors may explain the
significant linear relationship with more individuals dying by being snapped at lower
elevations. There may be fewer snapped tress simply due to forest structure. Snapped
trees often result from damage by other falling trees. Smaller trees at higher elevations
may not be able to generate the force required to snap trees. An alternative explanation
could be the difference in species composition along the gradient, where species (e.g.
Ficus spp, Sloanea spp.) at lower elevations have adaptations such as aerial roots and
buttressing for better anchorage. The Standing mode of death is related to slow growth
(Chao et al. 2009) and biotic interactions such as insect attack and fungal pathogens.
Across the gradient, standing had not significant relationship with elevation and it was
the least predominant mode of death that occurred in the lowlands.
Montane forest dynamics as a function of wood density
Wood density is an important functional trait of tropical trees and is also essential for
biomass calculations (Baker et al. 2004, Chave et al. 2006). The results here improve the
knowledge of wood density of tropical trees across an elevational gradient. The
significant increase of species wood density with elevation was not consistent with
findings in other Neotropical forests (Chave et al. 2006) where wood density decreases
with elevation. In this study, mean species mean wood density was 0.61 g/cm3 similar to
0.60 g/cm3 in Chave et al. (2006). Dividing the gradient into three major elevations (from
1000 to 1500 m, 1750 to 2500 m, 2750 to 3450 m), and weighting the wood density by
the number of species (Figures 13 a, b, c) shows an increase of wood density with
20

elevation with mean values of 0.57, 0.61, 0.62 respectively for each elevation. This trend
is even stronger if wood density is weighted by number of stems (Figures 13 d, e, f) with
mean values of 0.54, 0.64, 0.65 g/cm3 respectively for the three elevations. The observed
difference in the results of this study could be a result of the range of elevation sampled
from 1000 to 3450 m for this study, compared to ~ 50 to 2500 m, (Chave 2006).
Ultimately, more samples across elevational gradients and geographical regions are
needed to have a comprehensive view of elevation effects on wood density.
In the tropics, high wood density is associated with decreasing tree mortality, increasing
the probability of death in low wood density species (Chao et al. 2008, Chave et al. 2009).
In the Amazonian forest, fast growing species with low wood density tend to die snapped
(Chao et al. 2008). The results of this research confirm patterns of previous studies
showing a significant association of species with low wood density with dying by being
snapped. This is not a strong test to relate stand mortality and recruitment with wood
density at the plot level because it does not take into account factors such as tree size, tree
height and growth rate. Another way to model mortality, recruitment and the mode of
death across the gradient would be to calculate the individual-level probabilities of death
and recruitment.
21
CONCLUSIONS
This study illustrates the relationship in forest structure with respect to stem density and
basal area across the elevation. The results suggest that in these forests stem size does not
change markedly with elevation. Increasing the production of multi-stemmed individuals
at higher elevations could be a tradeoff of slow stem growth and low nutrients in the soil.
During a four year period of time, there was a decline in stem density due to higher rates
of stand mortality over stand recruitment for the entire community of 16 1-ha tree plots.
Possible explanations include severe wind events and the 2005 drought both of which
may have influenced the decline in stem density. The significant linear relationship of
stem turnover and elevation suggests that the species in this community die and grow
faster at lower elevations than at higher elevations and this could be attributed to both
higher diversity and an increased range of life history strategies coupled with a strong soil
fertility gradient. Species wood density has a strong relationship with elevation and in
turn appears to be related to mortality and it is correlated with snapped as the most
common mode of death at lower elevations. Forest dynamics are a consequence of
multiple factors, and the process of understanding which factors predict stem mortality
and recruitment across elevation is a continuing challenge. More research at larger
temporal and spatial scales is needed to fully understand the changes of dynamics in
montane forest. Studies of small tree size classes (e.g. seedlings, saplings and poles) and
future censuses of the permanent plot network will help to elucidate the life history and
demography of tree communities across elevational gradients in tropical regions.
22

LITERATURE CITED
ABERG. 2010. Permanent tree plot network. http://darwin.winston.wfu.edu/andes/.
Aiba, S., and K. Kitayama. 1999. Structure, composition and species diversity in an
altitude-substrate matrix of rain forest tree communities on Mount Kinabalu,
Borneo. Plant Ecology 140:139-157.
Arriaga, L. 2000. Types and causes of tree mortality in a tropical montane cloud forest of
Tamaulipas, Mexico. Journal of Tropical Ecology 16:623-636.
Baker, T. R., O. L. Phillips, Y. Malhi, S. Almeida, L. Arroyo, A. Di Fiore, T. Erwin, T. J.
Killeen, S. G. Laurance, W. F. Laurance, S. L. Lewis, J. Lloyd, A. Monteagudo,
D. A. Neill, S. Patino, N. C. A. Pitman, J. N. M. Silva, and R. V. Martinez. 2004.
Variation in wood density determines spatial patterns in Amazonian forest
biomass. Global Change Biology 10:545-562.
Bellingham, P. J., and A. D. Sparrow. 2009. Multi-stemmed trees in montane rain forests:
their frequency and demography in relation to elevation, soil nutrients and
disturbance. Journal of Ecology 97:472-483.
Bellingham, P. J., and E. V. J. Tanner. 2000. The influence of topography on tree growth,
mortality, and recruitment in a tropical montane forest. Biotropica 32:378-384.
Budd, P., I. May, L. Miles, and J. Sayer. 2004. Cloud Forest Agenda. United Nations
Environment - Programme-World Conservation Monitoring Centre, Cambridge,
UK.
23

Carey, E. V., S. Brown, A. J. R. Gillespie, and A. E. Lugo. 1994. Tree Mortality in
Mature Lowland Tropical Moist and Tropical Lower Montane Moist Forests of
Venezuela. Biotropica 26:255-265.
Chao, K. J., O. L. Phillips, E. Gloor, A. Monteagudo, A. Torres-Lezama, and R. V.
Martinez. 2008. Growth and wood density predict tree mortality in Amazon
forests. Journal of Ecology 96:281-292.
Chao, K. J., O. L. Phillips, A. Monteagudo, A. Torres-Lezama, and R. V. Martinez. 2009.
How do trees die? Mode of death in northern Amazonia. Journal of Vegetation
Science 20:260-268.
Chave, J., R. Condit, S. Lao, J. P. Caspersen, R. B. Foster, and S. P. Hubbell. 2003.
Spatial and temporal variation of biomass in a tropical forest: results from a large
census plot in Panama. Journal of Ecology 91:240-252.
Chave, J., D. Coomes, S. Jansen, S. L. Lewis, N. G. Swenson, and A. E. Zanne. 2009.
Towards a worldwide wood economics spectrum. Ecology Letters 12:351-366.
Chave, J., H. C. Muller-Landau, T. R. Baker, T. A. Easdale, H. Ter Steege, and C. O.
Webb. 2006. Regional and phylogenetic variation of wood density across 2456
neotropical tree species. Ecological Applications 16:2356-2367.
Clark, D. A. 2002. Are tropical forests an important carbon sink? Reanalysis of the long-
term plot data. Ecological Applications 12:3-7.
Clark, D. A., and D. B. Clark. 1992. Life-History Diversity of Canopy and Emergent
Trees in a Neotropical Rain-Forest. Ecological Monographs 62:315-344.
24

Condit, R., S. Aguilar, A. Hernandez, R. Perez, S. Lao, G. Angehr, S. P. Hubbell, and R.
B. Foster. 2004. Tropical forest dynamics across a rainfall gradient and the impact
of an El Nino dry season. Journal of Tropical Ecology 20:51-72.
Condit, R., P. S. Ashton, N. Manokaran, J. V. LaFrankie, S. P. Hubbell, and R. B. Foster.
1999. Dynamics of the forest communities at Pasoh and Barro Colorado:
comparing two 50-ha plots. Philosophical Transactions of the Royal Society of
London Series B-Biological Sciences 354:1739-1748.
Condit, R., S. P. Hubbell, and R. B. Foster. 1995. Mortality-Rates of 205 Neotropical
Tree and Shrub Species and the Impact of a Severe Drought. Ecological
Monographs 65:419-439.
Condit, R., Hubbell, S.P., Foster R.B. 1992. Short-Term Dynamics of a Neotropical
Forest. BioScience 42:822-828.
Denslow, J. S. 1987. Tropical Rain-Forest Gaps and Tree Species-Diversity. Annual
Review of Ecology and Systematics 18:431-451.
Denslow, J. S., A. M. Ellison, and R. E. Sanford. 1998. Treefall gap size effects on
above- and below-ground processes in a tropical wet forest. Journal of Ecology
86:597-609.
Gale, N., and A. S. Barfod. 1999. Canopy tree mode of death in a western Ecuadorian
rain forest. Journal of Tropical Ecology 15:415-436.
Gentry, A. H. 1988. Changes in Plant Community Diversity and Floristic Composition on
Environmental and Geographical Gradients. Annals of the Missouri Botanical
Garden 75:1-34.
25

Girardin, C. A. J., Y. Malhi, L. E. O. C. AragÃO, M. Mamani, W. Huaraca Huasco, L.
Durand, K. J. Feeley, J. Rapp, J. E. Silva-Espejo, M. Silman, N. Salinas, and R. J.
Whittaker. 2010. Net primary productivity allocation and cycling of carbon along
a tropical forest elevational transect in the Peruvian Andes. Global Change
Biology:no-no.
Heaney, A., and J. Proctor. 1990. Preliminary Studies on Forest Structure and Floristics
on Volcan Barva, Costa Rica. Journal of Tropical Ecology 6:307-320.
Herwitz, S. R., and S. S. Young. 1994. Mortality, Recruitment, and Growth-Rates of
Montane Tropical Rain-Forest Canopy Trees on Mount Bellenden-Ker, Northeast
Queensland, Australia. Biotropica 26:350-361.
Homeier, J., S. W. Breckle, S. Gunter, R. T. Rollenbeck, and C. Leuschner. 2010. Tree
Diversity, Forest Structure and Productivity along Altitudinal and Topographical
Gradients in a Species-Rich Ecuadorian Montane Rain Forest. Biotropica 42:140-
148.
Ingwell, L. L., S. J. Wright, K. K. Becklund, S. P. Hubbell, and S. A. Schnitzer. 2010.
The impact of lianas on 10 years of tree growth and mortality on Barro Colorado
Island, Panama. Journal of Ecology 98:879-887.
Kitayama, K. 1992. An Altitudinal Transect Study of the Vegetation on Mount Kinabalu,
Borneo. Vegetatio 102:149-171.
Laurance, S. G. W., W. F. Laurance, A. Andrade, P. M. Fearnside, K. E. Harms, A.
Vicentini, and R. C. C. Luizao. 2010. Influence of soils and topography on
Amazonian tree diversity: a landscape-scale study. Journal of Vegetation Science
21:96-106.
26
Laurance, W. F., A. A. Oliveira, S. G. Laurance, R. Condit, H. E. M. Nascimento, A. C.
Sanchez-Thorin, T. E. Lovejoy, A. Andrade, S. D'Angelo, J. E. Ribeiro, and C. W.
Dick. 2004. Pervasive alteration of tree communities in undisturbed Amazonian
forests. Nature 428:171-175.
Lewis, S. L., O. L. Phillips, D. Sheil, B. Vinceti, T. R. Baker, S. Brown, A. W. Graham,
N. Higuchi, D. W. Hilbert, W. F. Laurance, J. Lejoly, Y. Malhi, A. Monteagudo,
P. N. Vargas, B. Sonke, N. Supardi, J. W. Terborgh, and R. V. Martinez. 2004.
Tropical forest tree mortality, recruitment and turnover rates: calculation,
interpretation and comparison when census intervals vary. Journal of Ecology
92:929-944.
Lieberman, D., and M. Lieberman. 1987. Forest Tree Growth and Dynamics at La-Selva,
Costa-Rica (1969-1982). Journal of Tropical Ecology 3:347-358.
Lieberman, D., M. Lieberman, R. Peralta, and G. S. Hartshorn. 1996. Tropical forest
structure and composition on a large-scale altitudinal gradient in Costa Rica.
Journal of Ecology 84:137-152.
Madelaine, C., R. Pelissier, G. Vincent, J. F. Molino, D. Sabatier, M. F. Prevost, and C.
de Namur. 2007. Mortality and recruitment in a lowland tropical rain forest of
French Guiana: effects of soil type and species guild. Journal of Tropical Ecology
23:277-287.
Madsen, J. E., and B. Ollgaard. 1994. Floristic Composition, Structure, and Dynamics of
an Upper Montane Rain-Forest in Southern Ecuador. Nordic Journal of Botany
14:403-423.
27

Malhi, Y., M. Silman, N. Salinas, M. Bush, P. Meir, and S. Saatchi. 2010. Introduction:
Elevation gradients in the tropics: laboratories for ecosystem ecology and global
change research. Global Change Biology 16:3171-3175.
Manokaran, N., and K. M. Kochummen. 1987. Recruitment, Growth and Mortality of
Tree Species in a Lowland Dipterocarp Forest in Peninsular Malaysia. Journal of
Tropical Ecology 3:315-330.
Marengo, J. A., C. A. Nobre, J. Tomasella, M. F. Cardoso, and M. D. Oyama. 2008.
Hydro-climatic and ecological behaviour of the drought of Amazonia in 2005.
Philosophical Transactions of the Royal Society B-Biological Sciences 363:1773-
1778.
Midgley, J. J., M. C. Cameron, and W. J. Bond. 1995. Gap Characteristics and
Replacement Patterns in the Knysna Forest, South-Africa. Journal of Vegetation
Science 6:29-36.
Myster, R. W., and D. S. Fernandez. 1995. Spatial Gradients and Patch Structure on Two
Puerto Rican Landslides. Biotropica 27:149-159.
Negron-Juarez, R. I., J. Q. Chambers, G. Guimaraes, H. C. Zeng, C. F. M. Raupp, D. M.
Marra, G. Ribeiro, S. S. Saatchi, B. W. Nelson, and N. Higuchi. 2010.
Widespread Amazon forest tree mortality from a single cross-basin squall line
event. Geophysical Research Letters 37.
Phillips, O. L., T. R. Baker, L. Arroyo, N. Higuchi, T. J. Killeen, W. F. Laurance, S. L.
Lewis, J. Lloyd, Y. Malhi, A. Monteagudo, D. A. Neill, P. N. Vargas, J. N. M.
Silva, J. Terborgh, R. V. Martinez, M. Alexiades, S. Almeida, S. Brown, J. Chave,
J. A. Comiskey, C. I. Czimczik, A. Di Fiore, T. Erwin, C. Kuebler, S. G.
28

Laurance, H. E. M. Nascimento, J. Olivier, W. Palacios, S. Patino, N. C. A.
Pitman, C. A. Quesada, M. Salidas, A. T. Lezama, and B. Vinceti. 2004. Pattern
and process in Amazon tree turnover, 1976-2001. Philosophical Transactions of
the Royal Society of London Series B-Biological Sciences 359:381-407.
Phillips, O. L., and A. H. Gentry. 1994. Increasing Turnover through Time in Tropical
Forests. Science 263:954-958.
Phillips, O. L., P. Hall, A. H. Gentry, S. A. Sawyer, and R. Vasquez. 1994. Dynamics and
Species Richness of Tropical Rain-Forests. Proceedings of the National Academy
of Sciences of the United States of America 91:2805-2809.
Phillips, O. L., Y. Malhi, N. Higuchi, W. F. Laurance, P. V. Nunez, R. M. Vasquez, S. G.
Laurance, L. V. Ferreira, M. Stern, S. Brown, and J. Grace. 1998. Changes in the
carbon balance of tropical forests: Evidence from long-term plots. Science
282:439-442.
Phillips, O. L., R. V. Martinez, A. M. Mendoza, T. R. Baker, and P. N. Vargas. 2005.
Large lianas as hyperdynamic elements of the tropical forest canopy. Ecology
86:1250-1258.
Phillips, O. L., G. van der Heijden, S. L. Lewis, G. Lopez-Gonzalez, L. Aragao, J. Lloyd,
Y. Malhi, A. Monteagudo, S. Almeida, E. A. Davila, I. Amaral, S. Andelman, A.
Andrade, L. Arroyo, G. Aymard, T. R. Baker, L. Blanc, D. Bonal, A. C. A. de
Oliveira, K. J. Chao, N. D. Cardozo, L. da Costa, T. R. Feldpausch, J. B. Fisher,
N. M. Fyllas, M. A. Freitas, D. Galbraith, E. Gloor, N. Higuchi, E. Honorio, E.
Jimenez, H. Keeling, T. J. Killeen, J. C. Lovett, P. Meir, C. Mendoza, A. Morel, P.
N. Vargas, S. Patino, K. S. H. Peh, A. P. Cruz, A. Prieto, C. A. Quesada, F.
29

Ramirez, H. Ramirez, A. Rudas, R. Salamao, M. Schwarz, J. Silva, M. Silveira, J.
W. F. Slik, B. Sonke, A. S. Thomas, J. Stropp, J. R. D. Taplin, R. Vasquez, and E.
Vilanova. 2010. Drought-mortality relationships for tropical forests. New
Phytologist 187:631-646.
Pitman, N. C. A., J. W. Terborgh, M. R. Silman, P. Nunez, D. A. Neill, C. E. Ceron, W.
A. Palacios, and M. Aulestia. 2001. Dominance and distribution of tree species in
upper Amazonian terra firme forests. Ecology 82:2101-2117.
Putz, F. E., P. D. Coley, K. Lu, A. Montalvo, and A. Aiello. 1983. Uprooting and
Snapping of Trees - Structural Determinants and Ecological Consequences.
Canadian Journal of Forest Research-Revue Canadienne De Recherche Forestiere
13:1011-1020.
Rapp, J. 2010. Climate control on plant performance across an Andean altitudinal
gradient. Dissertation, Wake Forest University, Winston Salem, North Carolina,
USA.
Rees, M., R. Condit, M. Crawley, S. Pacala, and D. Tilman. 2001. Long-term studies of
vegetation dynamics. Science 293:650-655.
Rice, A. H., E. H. Pyle, S. R. Saleska, L. Hutyra, M. Palace, M. Keller, P. B. de Camargo,
K. Portilho, D. F. Marques, and S. C. Wofsy. 2004. Carbon balance and
vegetation dynamics in an old-growth Amazonian forest. Ecological Applications
14:S55-S71.
Sheil, D., D. Burslem, and D. Alder. 1995. The Interpretation and Misinterpretation of
Mortality-Rate Measures. Journal of Ecology 83:331-333.
30

Silman, M., A. Araujo Murakami, H. Pariamo, M. Bush, and D. Urrego. 2006. Changes
in tree community structure at the southern limits of Amazonia: Manu and Madidi.
Ecologia en Bolivia 40:443-452.
Susan, G. W. L., W. F. Laurance, E. M. N. Henrique, A. Andrade, P. M. Fearnside, R. G.
R. Expedito, and R. Condit. 2009. Long-term variation in Amazon forest
dynamics. Journal of Vegetation Science 20:323-333.
Swaine, M. D., D. Lieberman, and F. E. Putz. 1987. The Dynamics of Tree Populations
in Tropical Forest - a Review. Journal of Tropical Ecology 3:359-366.
Vazquez, J. A., and T. J. Givnish. 1998. Altitudinal gradients in tropical forest
composition, structure, and diversity in the Sierra de Manantlan. Journal of
Ecology 86:999-1020.
Watt, A. S. 1947. Pattern and Process in the Plant Community. Journal of Ecology 35:1-
22.
Whittaker, R. J., S. F. Schmitt, S. H. Jones, T. Partomihardjo, and M. B. Bush. 1998.
Stand biomass and tree mortality from permanent forest plots on Krakatau,
Indonesia, 1989-1995. Biotropica 30:519-529.
Zanne, A. E., G. Lopez-Gonzalez, D. A. Coomes, J. Ilic, S. Jansen, S. L. Lewis, R. B.
Miller, N. G. Swenson, M. C. Wiemann, and J. Chave. 2009. Data from: Towards
a worldwide wood economics spectrum. in Ecology Letters. Dryad Data
Repository.
Zimmermann, M., P. Meir, M. Silman, A. Fedders, A. Gibbon, Y. Malhi, D. Urrego, M.
Bush, K. Feeley, K. Garcia, G. Dargie, W. Farfan, B. Goetz, W. Johnson, K.
31

32
Kline, A. Modi, N. Rurau, B. Staudt, and F. Zamora. 2009. No Differences in Soil
Carbon Stocks Across the Tree Line in the Peruvian Andes. Ecosystems 13:62-74.

Table 1. Basic description of the 16 1-ha permanent tree plots along an elevational
gradient in the Manu National Park, Peru.
Location Plot Elevation (m) UTM E UTM N 1°Census 2°Census Substrate
Tono TO_1000 1000 225215 8567314 2004 2007 Shale
San Isidro SI_1250 1245 222870 8562054 2005 2009 Shale
Callanga CA_1250 1250 197947 8582756 2004 2008 Granite
Callanga CA_1500 1500 198534 8582816 2004 2008 Granite
San Pedro SP_1500 1500 224863 8556052 2006 2008 Shale
San Isidro SI_1500 1521 222305 8561620 2005 2009 Shale
San Pedro SP_1750 1750 224258 8556260 2006 2008 Shale
Trocha Union TU_1800 1800 222887 8553630 2003 2007 Granite
Trocha Union TU_2000 2000 222622 8553538 2003 2007 Granite
Trocha Union TU_2250 2250 221737 8552556 2003 2007 Shale
Trocha Union TU_2500 2500 220816 8551070 2003 2007 Shale
Trocha Union TU_2750 2750 219193 8549686 2003 2007 Shale
Trocha Union TU_3000 3000 218992 8549454 2003 2007 Shale
Wayquecha WA_3000 3000 219595 8540370 2003 2007 Shale
Trocha Union TU_3250 3250 217594 8549222 2003 2007 Shale
Trocha Union TU_3450 3450 217309 8548834 2003 2007 Shale
33

FIGURE LEGENDS
Figure 1. Map of the 16 1-ha ABERG network permanent tree plots in Manu National
Park across an elevational gradient. Each dotted circle represents a 1-ha tree plot.
Figure 2. (a) Variability of stem density (ha-1) across elevation in 16 permanent plots
(Linear regression; R=0.18, p=0.52, DF=14, n=16; R2=0.03, p=0.51), error bars depict
the 95 % confidence intervals. (b) Multi-stem production across elevation (Linear
regression; R=0.77, p < 0.001, DF=14, n=16; R2=0.6, p < 0.001), each point represents
the percentage of multi-stem individuals per hectare of stems ≥ 10 cm DBH below 1.3 m
height, error bars depict the bootstrapped 95 % confidence intervals. In both cases solid
lines are a nonparametric regression fit using a LOESS function.
Figure 3. Relationship of stem basal area (m2 ha -1) across elevation (Linear regression;
R=-0.38, p=0.15, DF=14, n=16; R2=0.14, p=0.15). Error bars depict bootstrapped 95 %
confidence intervals.
Figure 4. Difference in mortality and recruitment rates for all 16 1-ha plots across the
elevational gradient (Wilcoxon signed rank test, p < 0.001).
Figure 5. Frequency distribution for all dead stems along an elevational gradient as a
function of DBH (≥ 10 cm DBH).
34

Figure 6. Rates of forest dynamics across the elevation gradient for all stems ≥ 10 cm
DBH for: (a) Mortality using equation (1), points show annualized rates as a function of
elevation (Linear regression; R=-0.61, p < 0.05, DF=14, n=16; R2=0.4, p < 0.05). (b)
Recruitment using equation (2), points show annualized rates as function of elevation
(Linear regression; R=0.08, p=0.78, DF=14, n=16, R2=0.01, p=0.78). Error bars depict
the bootstrapped 95 % confidence intervals.
Figure 7. Turnover rates (mean of mortality and recruitment rates) for all stems ≥ 10 cm
DBH. Points show annualized rates as a function of elevation (Linear regression; R=-0.50,
p < 0.05, DF=14, n=16; R2=0.3, p < 0.05). Error bars depict the bootstrapped 95 %
confidence intervals.
Figure 8. Population change rates for all stems ≥ 10 cm DBH across the elevational
gradient. Rates for each permanent plot were calculated from equation (3), (Linear
regression; R=0.56, p < 0.05, DF=14, n=16; R2=0.3, p < 0.05), dashed lines indicate no
change. Error bars depict the bootstrapped 95 % confidence intervals. Solid line is a
nonparametric regression fit using a LOESS function.
Figure 9. Histogram of rates of population change for all stems ≥ 10 cm DBH across the
gradient. Rates for each permanent plot were calculated from equation (3). Dashed lines
depict no change.
35
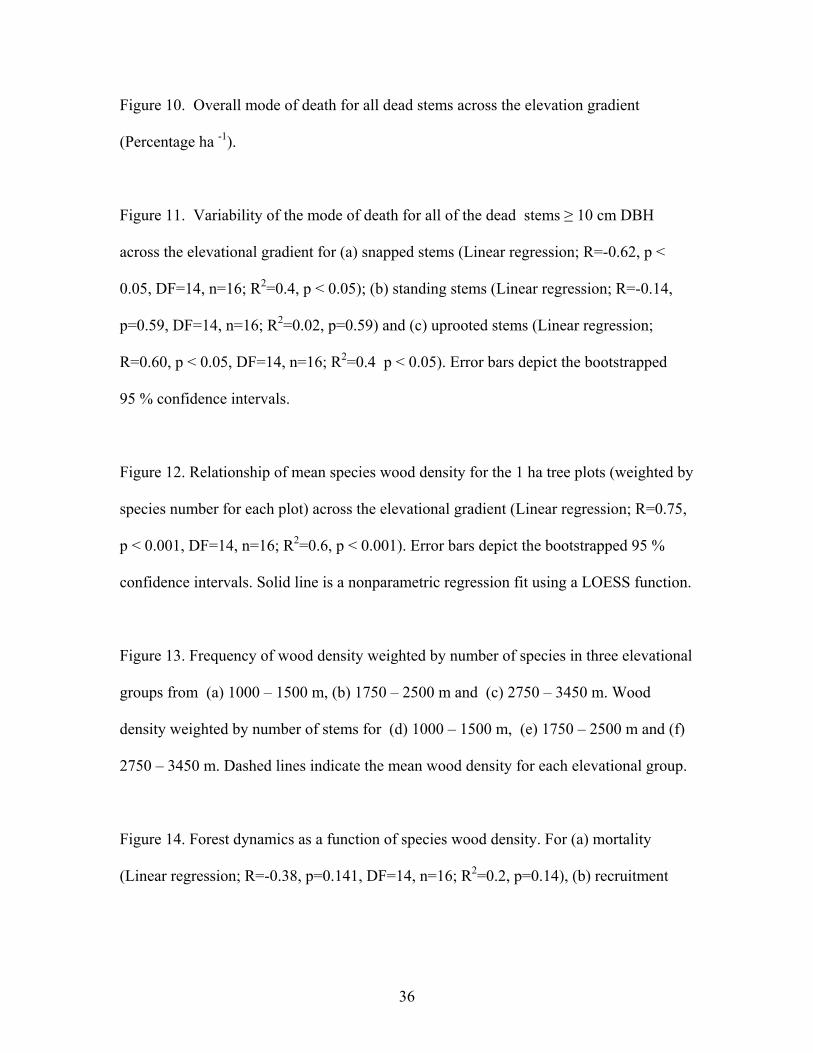
Figure 10. Overall mode of death for all dead stems across the elevation gradient
(Percentage ha -1).
Figure 11. Variability of the mode of death for all of the dead stems ≥ 10 cm DBH
across the elevational gradient for (a) snapped stems (Linear regression; R=-0.62, p <
0.05, DF=14, n=16; R2=0.4, p < 0.05); (b) standing stems (Linear regression; R=-0.14,
p=0.59, DF=14, n=16; R2=0.02, p=0.59) and (c) uprooted stems (Linear regression;
R=0.60, p < 0.05, DF=14, n=16; R2=0.4 p < 0.05). Error bars depict the bootstrapped
95 % confidence intervals.
Figure 12. Relationship of mean species wood density for the 1 ha tree plots (weighted by
species number for each plot) across the elevational gradient (Linear regression; R=0.75,
p < 0.001, DF=14, n=16; R2=0.6, p < 0.001). Error bars depict the bootstrapped 95 %
confidence intervals. Solid line is a nonparametric regression fit using a LOESS function.
Figure 13. Frequency of wood density weighted by number of species in three elevational
groups from (a) 1000 – 1500 m, (b) 1750 – 2500 m and (c) 2750 – 3450 m. Wood
density weighted by number of stems for (d) 1000 – 1500 m, (e) 1750 – 2500 m and (f)
2750 – 3450 m. Dashed lines indicate the mean wood density for each elevational group.
Figure 14. Forest dynamics as a function of species wood density. For (a) mortality
(Linear regression; R=-0.38, p=0.141, DF=14, n=16; R2=0.2, p=0.14), (b) recruitment
36

(Linear regression; R=-0.06, p=0.81, DF=14, n=16; R2=0.004, p=0.81), and (c) turnover
(Linear regression; p=0.14, DF=14, n=16; R2=0.2, p=0.14).
Figure 15. Mode of death as a function of species wood density. For (a) snapped (Linear
regression; R=-0.61, p=0.01, DF=14, n=16; R2=0.4, p < 0.05), (b) standing (Linear
regression; R=-0.01, p=0.87, DF=14, n=16; R2=0.002, p=0.87), and (c) uprooted stems
(Linear regression; R= 0.43, p=0.06, DF=14, n=16; R2=0.2, p=0.06).
37

Figure 1.
Tono
San Isidro
San Pedro
Callanga
Wayquecha
Trocha Union
Andes
Amazon
38

Figure 2
1000 1500 2000 2500 3000 3500
400
600
800
1000
1200
Elevation (m)
Ste
ms
(ha-
1)
(a)
1000 1500 2000 2500 3000 3500
02
46
810
1214
Elevation (m)
Per
cent
age
(ha-
1)
(b)
39
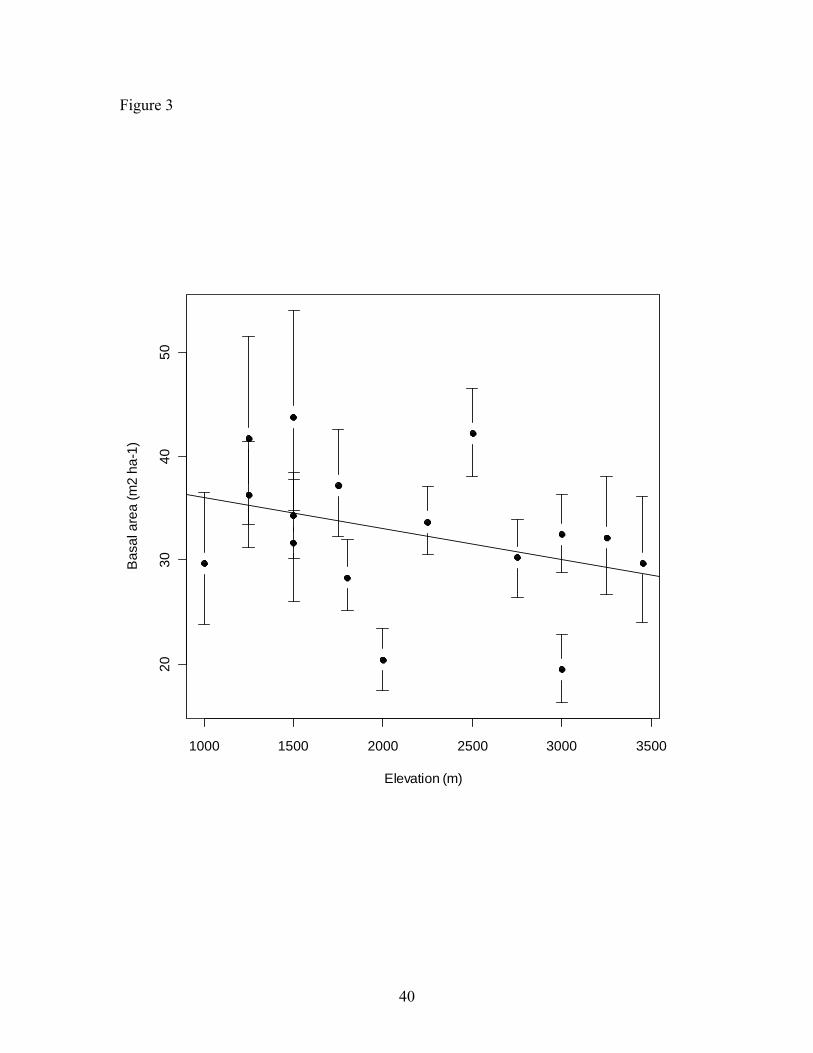
Figure 3
1000 1500 2000 2500 3000 3500
2030
4050
Elevation (m)
Bas
al a
rea
(m2
ha-1
)
40

Figure 4.
plots$mort.rate.stem plots$recruit.rate.stem Recruitment rates Mortality rates
0.01
00.
015
0.02
00.
025
0.03
00.
035
0.04
0
41
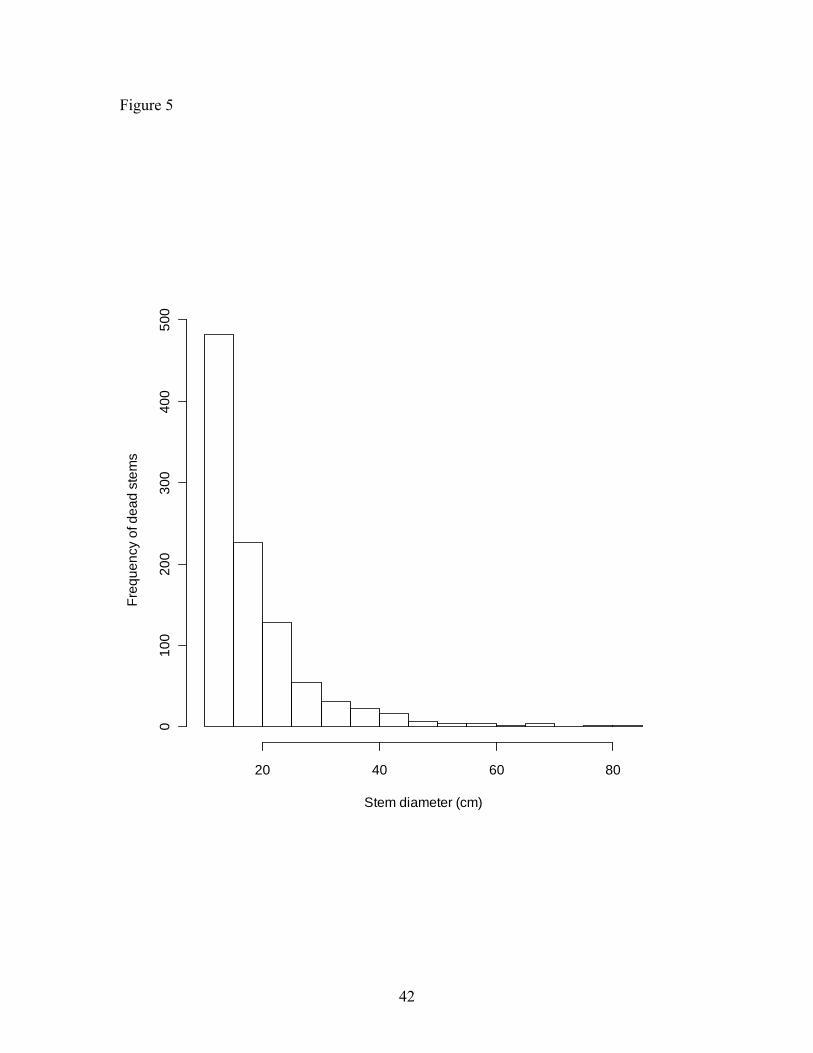
Figure 5
Stem diameter (cm)
Freq
uenc
y of
dea
d st
ems
20 40 60 80
010
020
030
040
050
0
42

Figure 6
(a)
0.01
0.02
0.03
0.04
0.05
0.06
1000 1500 2000 2500 3000 3500
Elevation (m)
Mor
talit
y ra
te (h
a -1
)
(b)
1000 1500 2000 2500 3000 3500
0.01
0.02
0.03
0.04
Elevation (m)
Rec
ruitm
ent r
ate
(ha
-1)
43

Figure 7
1000 1500 2000 2500 3000 3500
0.01
0.02
0.03
0.04
Elevation (m)
Turn
over
rate
(ha
-1)
44
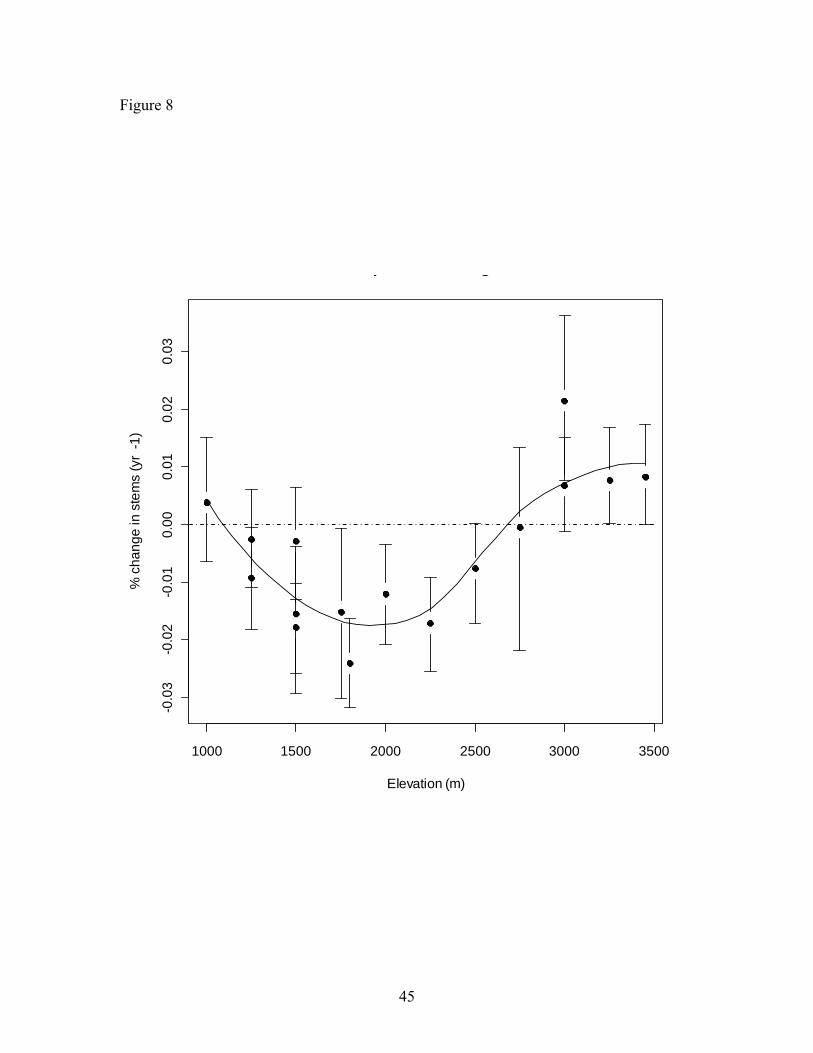
Figure 8
1000 1500 2000 2500 3000 3500
-0.0
3-0
.02
-0.0
10.
000.
010.
020.
03
p g
Elevation (m)
% c
hang
e in
ste
ms
(yr
-1)
45
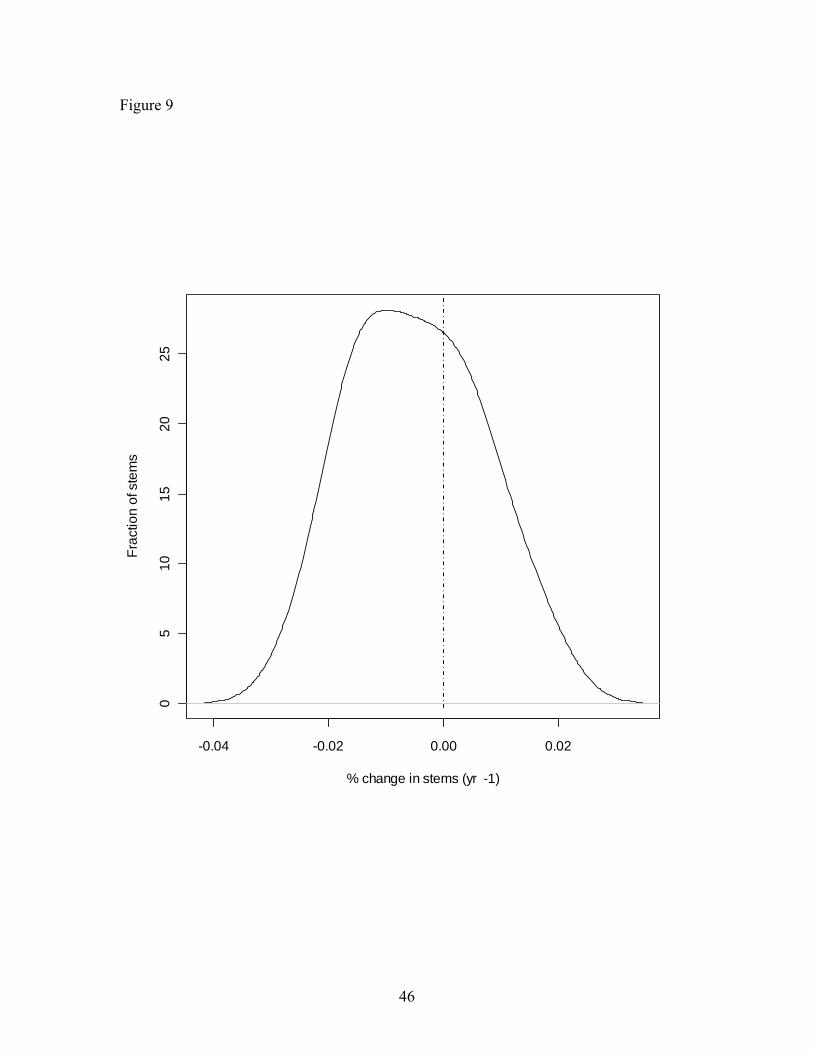
Figure 9
-0.04 -0.02 0.00 0.02
05
1015
2025
% change in stems (yr -1)
Frac
tion
of s
tem
s
46
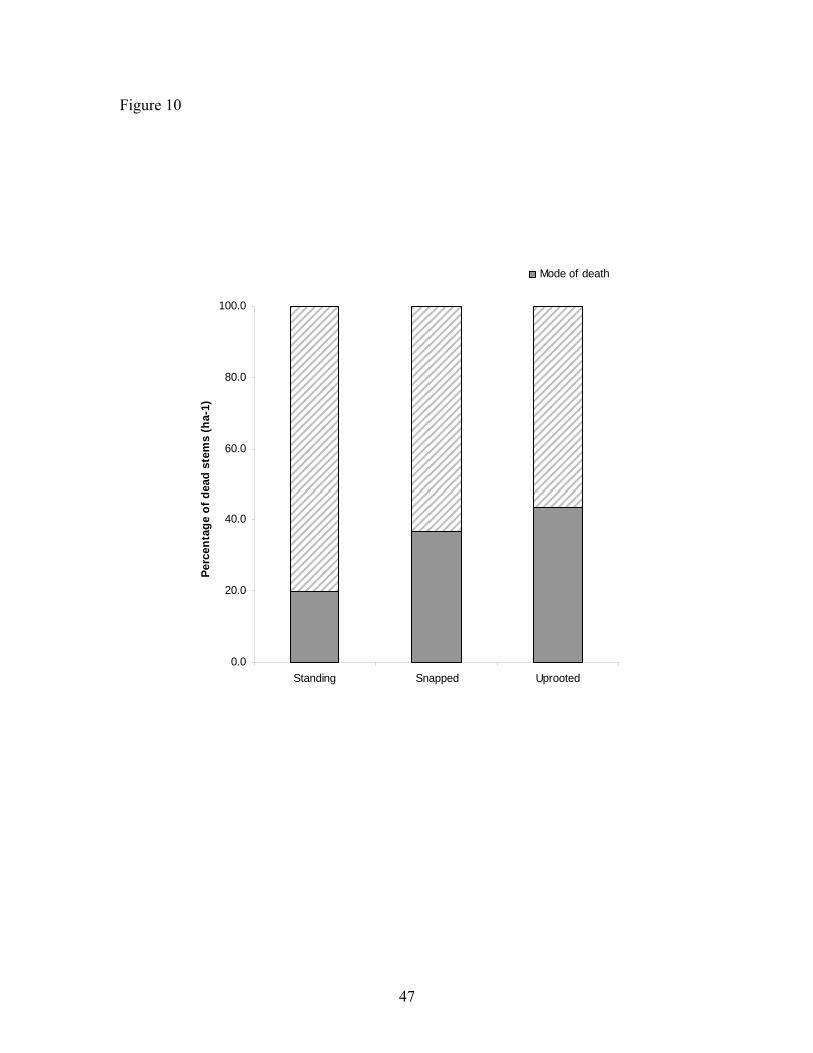
Figure 10
0.0
20.0
40.0
60.0
80.0
100.0
Standing Snapped Uprooted
Perc
enta
ge o
f dea
d st
ems
(ha-
1)
Mode of death
47

Figure 11
(a) (b)
020
4060
1000 1500 2000 2500 3000 3500
2040
6080
Elevation (m)
Per
cent
age
of s
napp
ed s
tem
s (h
a -1
)
(c)
1000 1500 2000 2500 3000 3500
020
4060
8010
0
Elevation (m)
Per
cent
age
of u
proo
ted
stem
s (h
a -1
)
1000 1500 2000 2500 3000 3500
Elevation (m)
Per
cent
age
of s
tand
ing
stem
s (h
a -1
)
48

Figure 12
1000 1500 2000 2500 3000 3500
0.55
0.60
0.65
0.70
Elevation (m)
Mea
n sp
ecie
s w
ood
dens
ity (g
/cm
3 h
a-1)
49

Figure 13
Fre
quen
cy o
f ste
ms
0.2 0.4 0.6 0.8 1.0 1.2
020
040
060
080
010
0012
00
(d)
Fre
quen
cy o
f spe
cies
0.2 0.4 0.6 0.8 1.0 1.2
050
100
150
200 (a)
Fre
quen
cy o
f ste
ms
0.2 0.4 0.6 0.8 1.0
050
010
0015
0020
0025
00
(e)
Fre
quen
cy o
f ste
ms
Fre
quen
cy o
f spe
cies
0.2 0.4 0.6 0.8 1.0
020
4060
8010
012
0
(b)
(c) (f)
0.2 0.4 0.6 0.8 1.0
050
010
0015
0020
0025
0030
00
Fre
quen
cy o
f spe
cies
020
4060
80
0.2 0.4 0.6 0.8 1.0
Wood density g/cm3
50

Figure 14
(a) (b)
(b)
0.56 0.58 0.60 0.62 0.64
0.01
00.
015
0.02
00.
025
0.03
00.
035
0.04
0
Mean species wood density (g/cm3 ha-1)
Mor
talit
y ra
te (h
a -1
)
0.56 0.58 0.60 0.62 0.64
0.01
00.
015
0.02
00.
025
0.03
0
Mean species wood density (g/cm3 ha-1)
Rec
ruitm
ent r
ate
(ha
-1)
0.56 0.58 0.60 0.62 0.64
0.01
50.
020
0.02
50.
030
0.03
5
Mean species wood density (g/cm3 ha-1)
Turn
over
rate
(ha
-1)
51
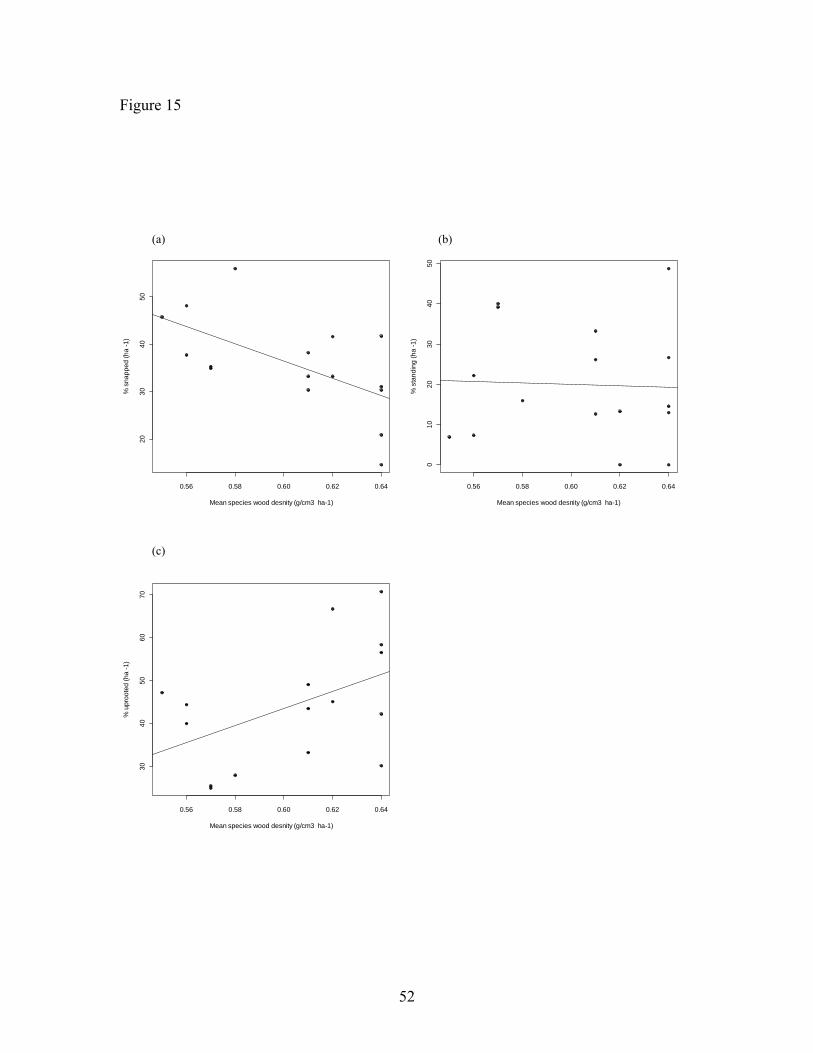
Figure 15
010
2030
4050
(a) (b)
(c)
0.56 0.58 0.60 0.62 0.64
2030
4050
Mean species wood desnity (g/cm3 ha-1)
% s
napp
ed (h
a -1
)
0.56 0.58 0.60 0.62 0.64
3040
5060
70
Mean species wood desnity (g/cm3 ha-1)
% u
proo
ted
(ha
-1)
0.56 0.58 0.60 0.62 0.64
Mean species wood desnity (g/cm3 ha-1)
% s
tand
ing
(ha
-1)
52
CURRICULUM VITAE
WILLIAM FARFAN RIOS EDUCATION B.S. Biology, Universidad Nacional de San Antonio Abad del Cusco (Cusco-Peru). RESEARCH EXPERIENCE • Researcher, Andes Biodiversity and Ecosystem research Group, 2007 – present.
Project: Conservation implications of climate change and fire in the Eastern Andes: Impacts on plant distributions and montane ecosystems” in southern Peru, Location: Manu (Peru)
• Researcher, Conservacion Internacional, 2007 - 2009 Project: Expanding the permanent plot network into the montane forests of the Andes Location: Bolivia, Colombia, Ecuador, Peru
• Researcher, Wake Forest University, 2003 - 2006 Project: Vegetation and climate along an altitudinal gradient in Manu National Park. Location: Manu (Peru)
• Research assistant, Centro Huaman Poma de Ayala, 2004. Project: Diagnostico de Recursos Naturales del Valle de Cusco Location: Cusco (Peru)
• Responsible botanist, O.N.G. Jardín Botánico de Missouri, 2003 - 2004 Location: Manu (Peru)
• Research assistant, Erick A. Christenson, 2002 Project: Orchid of the South of Peru Location: Calca, Cusco, Manu (Peru)
• Research assistant, Fondo Nacional Para Áreas Protegidas Por el Estado (PROFONAMPE), 2001-2002 Project: Orquídeas del Santuario Histórico de Machu Picchu Location: Machu Picchu (Peru)
PUBLICATIONS • Feeley K.J., M.R. Silman , M. Bush, W. Farfan, K. Garcia Cabrera, Y. Malhi, P. Meir,
N. Salinas Revilla, M. N.Raurau Quisiyupanqui, S. Saatchi. 2011. Journal of Biogeography 38:783–791.
• Gibbon, A., M. R. Silman, Y. Malhi, J. B. Fisher, P. Meir, M. Zimmermann, G. C. Dargie, W. R. Farfan, and K. C. Garcia. 2010. Ecosystem Carbon Storage Across the Grassland-Forest Transition in the High Andes of Manu National Park, Peru. Ecosystems 13:1097-1111.
• Zimmermann, M., P. Meir, M. R. Silman, A. Fedders, A. Gibbon, Y. Malhi, D. H. Urrego, M. B. Bush, K. J. Feeley, K. C. Garcia, G. C. Dargie, W. R. Farfan, B. P. Goetz, W. T. Johnson, K. M. Kline, A. T. Modi, N. M. Q. Rurau, B. T. Staudt, and F.
53

Zamora. 2010. No Differences in Soil Carbon Stocks Across the Tree Line in the Peruvian Andes. Ecosystems 13:62-74.
• Farfan, W., K. Feeley. 2009. Deforestación y el mercado de carbono en los bosques tropicales. Xilema 26:11-16.
• Girardin C.A.J., W. Farfan, K. Garcia, Y. Malhi, T. Killeen, K.J. Feeley, M.R. Silman, C. Reinel, D. Niell, P. Jorgensen, M. Serrano, J. Caballero, M.A. De la Torre Cuadrada, M. Macía. 2009. RAINFOR-Andes Expanding the Amazon Forest Inventory Network to the montane forests of the Andes. Technical Report, Conservation International.
• García K., W. Farfan, N. Salinas, B. León. 2005. Helechos Arbóreos de Trocha Unión. Environmental & Conservation Programs, The Field Museum, Chicago, USA. Rapid color guide Nº 182 version 1, 2.
• Collaboration in the field work for the elaboration of the book “AMANECER EN EL BAJO HUATANAY”, Diagnostico de Recursos Naturales del Valle de Cusco”, published by the Centro Huaman Poma de Ayala, Cusco 2004.
• Farfan W. and E.A. Christenson. 2003. Lankesterella, A GENUS NEW TO CUSCO, PERU. THE ORCHID REVIEW, Volume 111, Number 1251, pp 150-151.
• Moretz C.C. and W. Farfán. 2003. A NEW Telipogon FROM SOUTHERN PERÚ. THE ORCHID REVIEW, Volume 111, Number 1252, pp. 239-241.
• Salinas Revilla N., W. Farfán. 2003. Dos Nuevas Especies de Orquídeas para el Santuario Histórico de Machupicchu. CANTUA Revista de Ciencias Biológicas. Nº 11. pp. 31-34.
IN REVIEW • Jankowski J., C. Merkord, W. Farfan Rios, K. Garcia Cabrera, N. Salinas Revilla,
M.R. Silman. Links between Andean bird and tree communities: Using current associations to anticipate effects of climate change. Journal of Biogeography.
• Gurdak D.J., L.E.O.C. Aragão, A. Rozas-Dávila, W. Huaraca Huasco, W. Farfan Rios, K. Garcia Cabrera, C.A.J. Girardin, M.R. Silman, D.B. Metcalfe, J.E. Silva Espejo, N. Salinas Revilla, Y. Malhi. Tropical Necromass - Dynamics along an Elevational Gradient of Mature Forest in the Peruvian Andes. Ecosystems.
FELLOWSHIPS AND GRANTS • Andes Biodiversity and Ecosystem Research Group (ABERG). Fellowship
2009-2011 • Wake Forest University. Vecellio grant 2010 • Wake Forest University. Vecellio grant 2009 • Fondo Verde. Fellowship 2007 • Pan – Amazonia. Fellowship 2006 • Red Latinoamericana de Botánica. Travel grant 2005 • Missouri Botanical Garden. Fellowship 2003
54

55
WORKSHOPS and ADDITIONAL TRAINING • Trained “Diplomado de Experto en desarrollo sustentable Universidad Nacional del
Centro” – Facultad de pedagogía y humanidades, Institución Fondo Verde. 2007 - 2008.
• II Workshop “Internacional de Treinamento em Analises e Interpretacao de Datos em Ecosistemas Florestais”, Bolivia, July 2006.
• II Curso de Ecología de Bosques Nublados, Bolivia. April 2005. • Curso - Procesamiento y Análisis de datos con el Paquete SPSS 11.5, November 2004. • Curso - Pasantía Preprofesional del Programa de Capacitación en Botánica y Conservación auspiciado por Christensen Fund y Missouri Botanical Garden, Ecuador. February–March 2003. SERVICE Member of the scholarship selection committee for “Asociacion para la Conservacion de la Cuenca Amazonica” (ACCA). Peru. Jun – July 2010.