change in field of study from undergraduate to graduate school · change in field of study from...
TRANSCRIPT


Change in Field of Study from Undergraduate to Graduate School: Creation of a GRE Data Base for Studying Talent Flow
Jerilee Grandy and
Nancy Robertson
GRE Board Report No. 86-12P
April 1992
This report presents the findings of a research project f&ded by and carried out under the auspices of the Graduate Record Examinations Board.
Educational Testing Service, Princeton, N.J. 08541

The Graduate Record Examinations Board and Educational Testing Service are dedicated to the principle of equal opportunity, and their programs,
services, and employment policies are guided by that principle.
Graduate Record Examinations and Educational Testing Service are U.S. registered trademarks of Educational Testing Service; GRE, ETS,
and the ETS logo design are registered in the U.S.A. and in many other countries.
Copyright Q 1992 by Educational Testing Service. All rights reserved.

Abstract
In recent years the Graduate Record Examinations (GRE) Wes have become recognized as a valuable source for studies of talent flow. When test takers register to. take the GRE, they complete a background questionnaire that asks, among other things, their undergraduate major field and their intended field of graduate study. With this information, along with subsequent test scores, grades, parents’ education, age, gender, ethnic group, citizenship, and other variables, we are able to examine patterns that relate major field choices, and changes in those choices, to background data and academic ability.
Studies using the GRE files had been costly because of the length and complexity of the files and because of the careful and tedious programming that has had to be done to accommodate the coding changes that took place as the questionnaire was revised over the years. If we were to conduct further talent flow studies using the GRE data, it became clear that we needed a data base designed especially for that purpose.
In this project we designed a special GRE talent flow data base from 1978 to 1987 having three different structures. The first is an individual examinee file in which one record exists for each test taker. The record is short and identically formatted from year to year. The second structure is a matrix in which rows correspond to intended graduate fields of study and columns correspond to undergraduate majors. One hundred major fields are arranged in a rational order. Contained within the cells of the matrices are statistics such as numbers of test takers, mean GRE verbal score, percentage planning to earn a doctorate, numbers of minorities, and so forth. The third matrix structure collapses the 100 specific fields into 10 general fields. All three data bases are on computer files for public use; the matrices are available in hard copy as well.
During the project, we demonstrated some uses of the data base and devoted considerable effort to the design of graphic representations that could clearly express various aspects of talent flow.
Some of the findings from our examples (on U.S. citizens only) were as follows:
0 Engineering, physical sciences, and mathematics showed steady growth as graduate fields of study, whereas all other broad fields showed declines through about 1984 and then increases.
l The common belief that as numbers entering a field decline, student quality rises, and as numbers rise, quality declines, was not supported.
l The percentage of examinees over age 30 increased from 15% to 28%; the greatest percentage were in the service professions.
0 The percentage of female test takers grew only slightly; physical sciences and engineering showed very little increase in female representation.
0 Consistent with the decline in doctorates earned by Black students was the number of Black test takers, which also declined.

Among test takers with degrees in humanities, and physical, biological, and social sciences, a higher percentage of women than men changed fields for graduate work. Among those in health sciences, education, and business, men were more likely to change than were women.
Test takers appeared to choose graduate specialties consistent with their relative verbal and quantitative skills, as reflected in their GRE scores: low-scoring students in demanding undergraduate fields appeared to move to less demanding graduate fields, and high-scoring individuals in less demanding fields appeared to move to more demanding ones.

CONTENTS
PART I. TALENT-FLOW DATA BASE DESIGN
BACKGROUAD . . . . . . . . . . . . . . . . . . . . . . . . . . . . . . . . . . . . . . . . . . . . . . . . . 1
Reasons for Studying Talent Flow .................................... 1 Suitable Data Bases ............................................. 2 Studies of Talent Flow ........................................... 3 DesignofaSpecialGRETalentFlowDataBase.. ......................... 6
DATABASEDESIGN.............................................. 7
Years of Data Included ........................................... 7 Design Considerations ........................................... 7
PART II. USE OF THE DATA BASE
ANALYSIS AMJ PREsENTAnON OF DATA . . . . . . . . . . . . . . . . . . . . . . . . . . . . . . . 13
EXAMPU 1: XUEIUDS IN XUE SELEcllON OF GRQDUAlE FIW OF STUDY . . . . . . . 14
GRE Population Trends ......................................... 14 Trends within the Ten Broad Fields of Graduate Study ...................... 18 Age, Gender, and Ethnic Composition ................................ 27 Trends among Doctoral Candidates .................................. 33
EXAMPLE 2: ClURAClERISl7CS OF EX4MINEES JVXIO C‘GE FIELLU . . . . . . . . . . 36
Changers versus Nonchangers ..................................... 37 Variables Associated with the Decision to Change Fields ..................... 44
EXAMPU 3: A LOOK AT GRADUAlE FIELD CHOICE FUOA4ANOllZER ANGLE . . . . . 48
COMMENTONZHEEXAMPLES . . . . . . . . . . . . . . . . . . . . . . . . . . . . . . . . . . . . . 55
SUGGESTIONS FOR FURTHER RESEARCH . . . . . . . . . . . . . . . . . . . . . . . . . . . . . . . 55
RESEARCH ON IhDMDUAL FIELDS OF SmY . . . . . . . . . . . . . . . . . . . . . . . . . . 56
MODELS TO EXPLAIN XREADS . . . . . . . . . . . . . . . . . . . . . . . . . . . . . . . . . . . . . . 57
STUDIES OF PARlXULAR SUBPOPULAl’ONS . . . . . . . . . . . . . . . . . . . . . . . . . . . 57
TABLES . . . . . . . . . . . . . . . . . . . . . . . . . . . . . . . . . . . . . . . . . . . . . . . . . . . . . . . 59
APPENDIXES . . . . . . . . . . . . . . . . . . . . . . . . . . . . . . . . . . . . . . . . . . . . . . . . . . . . 99
REFERENCES . . . . . . . . . . . . . . . . . . . . . . . . . . . . . . . . . . . . . . . . . . . . . . . . . . . 125

PART I. TALENT-FLOW DATA BASE DESIGN
BACKGROUND
Reasons for Studying Talent Flow
Higher education is a critical national resource. Success in all of our endeavors, from mathematics to the arts, depends on higher education.
Leadership in science and technology demands that our scientists and engineers create new frontiers of knowledge and lead in the development of technological innovations. At the same time, our survival depends on expanding our awareness and understanding of our relationship with the natural environment so we do not destroy the organism that feeds us. Our economic and political systems are among the most complex in history, requiring ongoing observations and measurements; we monitor countless “indicators” of the health of our society and create theories and prediction models to anticipate progress and foresee catastrophes. The preservation and growth of our culture--its arts, languages, and philosophies, its expressions of what it means to be human-could be lost by a careless shift in educational priorities. The continuing progress of our nation requires well-informed education policymaking and the finest quality teaching. Our scientific, economic, cultural, and political survival depend on higher education.
In their passage through the educational pipeline, students may choose and change direction many times. Their choice of direction at any particular moment depends on many forces--academic skills; influences of family, teachers, and peers; financial resources; satisfaction with courses; perceived rewards of occupations; and anticipated job markets. It is central to the American Dream for each individual to work at an occupation in which he or she experiences fulfillment. Most of us share the belief that by doing so, both the individual and society benefit to the fullest, that is, society maximizes its human resources, and individuals achieve their maximum potential.
When a shortage or surplus of talent occurs in any academic or occupational area, one result is a failure to maximiz e human resources and individual potential. An oversupply of scientists and engineers in the late sixties resulted in a surplus of talent that was then wasted when people had to be “retooled” for other jobs. The present flow of talent away from nursing into more lucrative and prestigious professions has resulted in a critical nursing shortage. Society at large, as well as the individual who has devoted time and money to education, suffers when there is an imbalance between the supply of trained people and the demands of a profession.
We have used the expression “talent flow” to mean the movement of people having various skills and abilities from one line of endeavor to another. From studies of talent flow, we can monitor changes in the supply of people training for different types of occupations, and we can observe changes in the personal characteristics of students entering specific fields and the kinds of academic preparation they have.
Based on what we report from observation, policy makers, educators, members of the professions themselves, as well as the news media can intervene to provide information to students who are making career decisions. Educators and policy makers can provide improved instruction as well as financial support and incentives. The professions and the news media have the power to alter the image of a profession either to attract or to repel students. The outcome can be changes in the flow of talent--changes having the potential both to improve the student’s ability to choose a satisfying career and to improve the utilization of human resources.
Suitable Data Bases
To study talent flow, we must have large, accurate, regularly updated data bases. There are currently a number of data bases containing information on students’ plans and aspirations at various times in their academic careers. Some of the more readily available sources include the National Longitudinal Study of the Class of 1972 (NLS), High School and Beyond (HUB), Scholastic Aptitude Test (SAT) files, the Cooperative Institutional Research Program (CIRP), and the Graduate Record Examination (GRE) files.
The first two of these sources are derived from longitudinal studies of high school students sponsored by the National Center for Education Statist&. NLS data collection began with the senior year of the high school class of 1972, and HUB began with sophomore year data on the high school class of 1980. Both studies continued with additional data collection periodically thereafter.
The Scholastic Aptitude Test (SAT) files of the College Board also provide information on the plans of high school seniors at the time they take the SAT. While this is not a longitudinal data base, followup surveys of students can be conducted. The SAT files can also be matched with the GRE data base at a later time to follow up that subset of students who take both exams. Educational Testing Service (ETS), which administers the GRE, recently created a matched file containing the records of nearly half a million students who took the GRE between 1985 and 1989 and who took the SAT between 1980 and 1986. This very large data base contains all of the information from both the SAT and GRE records, including information from repeated testings. On the average, there are five records for each student.
Even without later student information, the SAT files contain a considerable quantity of background data that can be related to test scores and intended college major. The Student Descriptive Questionnaire (SDQ), which is completed by more than 90% of all students registering to take the SAT, containsa question about intended major field of study as well as many other questions related to background and future plans.
CIRP data, which are collected annually on a large nationwide sample of college freshmen, contain information about student background, interests, aspirations, and values. At present, CIRP is the nation’s largest empirical study of higher education, with data on more than eight million students.
As students near completion of their undergraduate work, or at any time following graduation, those who plan to attend graduate or professional school may again change their field of study. Students who take the GRE provide essential talent flow information. The GRE
2

background questionnaire contains two questions having a direct bearing on talent flow. One asks for the student’s major field as an undergraduate, and the other asks for the intended graduate field of study. Students make a critical decision when they choose whether or not to enroll in graduate school, and if they do enroll, whether to remain in the same field of study.
The GRE files themselves and the Data Summary Reports produced annually from those files provide a data base for studying talent flow from undergraduate to graduate school.
Studies of Talent Flow
In August 1987, the director of the GRE Program proposed a framework for the study of talent flow to graduate education (Kuh, 1987). She contended that an awareness of the supply of graduate-educated workers is important to government, to industry, and to academia. Among possible research studies she suggested the exploration of early indicators of interest in graduate school through a matched GRE-SAT data base, studies of the effects of labor market and non- economic factors on choices of undergraduate and graduate major, and studies of both foreign talent flow and minority talent flow. As sources, she suggested the NIS data base, High School and Beyond surveys, Astin’s college freshmen (CIRP) data, NAEP, and the National Research Council’s Survey of Doctorate Recipients, as well as the SAT and GRE data bases.
The GRE Board has since funded a number of studies of talent flow, some based on the GRE files, and some on other data bases. The following studies conducted at ETS highlight some recent research on talent flow funded by the GRE Board as well as other agencies and foundations.
iVLs data base. A study entitled Pathways to Graduate School, conducted by Hilton and Schrader (1986), analyzed the NLS data base. Beginning with high school data on the class of 1972, this data base now contains additional follow-up information collected in 1973, 1974, 1976, 1979, and 1986.
HS&B data base. Subsequently, Hilton and Pollack received GRE funding to study talent flow in the 1980 High School and Beyond data base. Their study (Hilton & Pollack, 1989), which compared the HUB data base with the 1972 NLS data base, showed declines in the percentages of Black males who completed undergraduate school, and particularly in the percentages of high-ability Black males who did so. These declines were seen as particularly troubling and are the subject of another study now in progress.
As a part of the Hilton and Pollack study, GRE scores were retrieved for 370 people in the HS&B cohort. These scores were the subjects of a separate analysis.
SAT &a base. In a study funded by NSF, Hilton, Hsia, Solorzano, and Benton (1989) selected a sample of 6,000 high-scoring minority SAT examinees planning to major in math, science, and engineering. They surveyed these students two years after high school graduation and again five years afterward. The results indicated that the high-ability minority students persisted in their
3

science careers at a rate equal to or higher than a comparison sample of high-ability White students.
Grandy has analyzed the SAT files annually for trends in the popularity of various major fields, especially among high-scoring students. The National Endowment for the Humanities (NEH) funded a study of the changing characteristics of prospective humanities majors in which she analyzed trends in the SAT scores and background data on high school seniors taking the SAT and planning to major in humanities (Grandy, 1984a; Grandy & Courtney, 1985).
Grandy found that during the infamous score-decline era, the “quality” of students planning to major in most areas of the humanities was not declining as severely as the overall SAT score. Though a decreasing percentage of students planned to major in the humanities, they tended to be the better students. Allegations that the brightest high school seniors were being drawn into fields like medicine and business appeared not to be true.
Similar studies are being funded biennially by NSF. From those studies we have been able to follow trends in the popularity of all major fields among high school seniors, to observe trends in the test scores of prospective science majors, and to note which fields tend to draw the brightest students (Grandy, 1987, 1989, 1990a).
The information obtained from the SAT files has provided useful indicators of how effectively the professions are attracting talented high school students and how other forces in students’ lives are driving them into or away from particular fields. In addition, we are able to see what kinds of academic preparation students have for their chosen fields of interest.
GRE &Z&-J base. The GRE Board, in addition to other agencies, has funded a number of studies describing the talent flow of GRE takers.
A GRE-funded study by Baird (1982) followed a group of GRE examinees intending to pursue graduate study in four fields. About 1,800 applicants in each of the fields of English, psychology, and education were surveyed, along with about 700 in microbiology. Baird drew samples of examinees intending study in these fields from the 1979-80 GRE administrations and surveyed them about the success of their applications to graduate departments. A follow-up survey requested information on the examinees’ satisfaction with, and success in, their respective departments.
Another longitudinal study of GRE examinees is still in progress. Wilder is currently directing a project that was begun in 1987 by Nettles and Wilder as a survey of a small sample of 1986-87 GRE takers on the subject of fmancial aid. The sample included approximately 900 Black, 900 Hispanic, and 900 other (mostly White) GRE takers from that year. There have been three follow-up surveys since the original financial aid survey, with about 75% of the originally sampled examinees continuing to respond. Examinees who did not enter graduate school have also been retained in the data base. Becaue some of the examinees who entered graduate school soon after taking the GRE were approaching termination of their degree programs, the data base provides information on attendance, persistence, and completion of graduate programs in various program areas.
4

Based on the first year’s data from the Nettles and Wilder study, Grandy (199Ob) examined the validity of the GRE background question on intended field of study and found it to be a reasonably valid indicator of the actual field in which the examinee would subsequently be enrolled.
Another GRE talent flow study (Grandy, 1992) just being completed is a survey of a stratified sample of undergraduates who planned to earn bachelor’s degrees in math, physical sciences, and engineering and who took the GRE in December 1990. This study will contribute to our understanding of the various factors that distinguish between people who remain in the sciences and those who change into another field.
Back in 1983, the National Endowment for the Humanities (NEH) recognized the value of the information in the GRE data base and funded two projects to study the characteristics of GRE examinees planning graduate work in the humanities. The first of these studies (Grandy, 1984a) compared prospective graduate humanities students with examinees planning studies in other areas, and it analyzed patterns in changes in major field selection from undergraduate to graduate school.
That study required analysis at a more detailed level than what appeared in the Data Summary Reports. The results showed that examinees planning to major in many areas of the humanities at the graduate level did not suffer from a GRE score decline at all, whereas there was a decline among examinees overall. The mean verbal scores of U.S. citizens planning to study foreign languages at the graduate level actually increased from 554 to 561 between 1976 and 1984. It appeared that the “best” students were not leaving the humanities, as some had suspected. These findings were similar for each gender and for each ethnic group studied.
The information from that study was of considerable interest not only to NEH, but to government agencies, universities, foundations that support the humanities, and the academic community at large.
The second study funded by NEH (Grandy & Courtney, 1985) attempted to explain the results of the first study. It suggested that students who discover that they are achieving well above the level of their colleagues may plan to move into a more challenging field. Students feeling that they are less able than their colleagues may choose a less demanding field. But there were other trends, such as a flow of talent out of the humanities, that were not explained by the GRE data alone. Grandy and Courtney concluded that many social and economic explanations offered by the media were only partially true, and in many instances, were completely fallacious. Quite possibly, it was the pseudostatistical information promulgated by the media that was largely responsible for driving students away from the humanities and, to some extent, away from higher education.
Grandy conducted a similar study of the GRE data base for NSF, the results of which were prepared for the NSF publication Science Indicators. NSF was especially interested in future science and math teachers--the ones who would have bachelor’s degrees in a science or math field and who planned to earn a master’s degree in education.
The data showed, perhaps not surprisingly, that among GRE examinees with undergraduate degrees in math, science, or engineering, the mean GRE quantitative scores and
5

mean undergraduate grade point averages of those planning to do graduate work in science areas were considerably higher than the mean scores and grade averages of those planning to study education @randy, 1984b). An examinee who has majored in physics but has earned less than exemplary grades in physics and expects to obtain relatively low GRE scores may enroll in a graduate program in education with the intention of teaching physics or a related subject. So long as education is perceived as a default option, it is bound to attract a number of low-scoring, low-achieving students.
Once the GRJ3 data base was recognized as a valuable source for talent-flow studies, representatives of a variety of professions began inquiring about the flow of students into and out of their fields. In a study for the Lilly Endowment (Grandy & Greiner, 1990), for example, it was found that examinees planning to enter the ministry (as inferred from several background questionnaire items) came from a variety of backgrounds, and that those who had majored in religion as undergraduates earned lower average GRE scores than examinees who majored in other areas. Among candidates for the ministry, women earned higher GRE scores than men, and their undergraduate grades were higher. These findings were important to religious leaders, and they confirmed anecdotal information from seminaries.
Design of a Special GRE Talent Flow Data Base
With increasing interest in the GRE data base as a source for talent flow study, it was becoming clear that a special data base for that purpose was called for. The cost of accessing the history files and writing special programs for each project was excessive. Furthermore, many changes had been made in the background questionnaire over the years. Major fields had been recoded several times and the wording of some items had been revised. These changes, especially the changes in major field codes, had led to costly programming errors. If we were to conduct further talent flow studies, it would be highly desirable to design a special data base for that purpose.
Before investing in further studies of talent flow and the design of a special data base, however, it was reasonable to ask how accurately the GRE background question on intended field of study could be taken as an indicator of actual field of study. A survey conducted by Nettles for the GRE Board contained information that enabled us to make estimates of subsequent enrollment patterns of GRE examinees.
From these survey data we were able to infer that only about 56% of the 1986-87 GRE population enrolled in graduate or professional school in the fall of 1987 @randy, 1990b). The enrollment rate was highest among those planning to enter the various areas of education (66%) and the physical sciences (65%) and somewhat lower in the combined social and behavioral sciences (50%). But among those who did enter graduate school, 82% were enrolled in a field of study identical to or nearly identical to the one they intended to study when they registered to take the GRE. Only 7% were found to be in areas that were judged to be unrelated or “remotely” related to the planned field of study. Overall, this finding seemed to suggest that the intended field of study question does have reasonably good validity as a predictor of actual field of study.

DATA BASE DESIGN
Years of Data Included
The data base begins with 1978 and ends with 1987, excluding 1979. In 1979, problems in the formatting of the major field questions resulted in erroneous coding of undergraduate major field and intended field of study. For purposes of a talent-flow data base, therefore, 1979 could not be included. Data prior to 1978 had not been retained by ETS, so the oldest data available came from 1978. In 1988, the background questionnaire was revised, and the list of major fields was expanded and modified extensively. Inclusion of data from 1988 onward will be proposed later.
Design Considerations
In designing the data base, we had four major considerations.
First, the cost of access should be as low as possible. Files should be as short as possible, and their layouts simple enough to facilitate easy analysis programming. If all or part of the data base could reside on floppy disks or Bernoulli cartridges, computer processing costs to the user would be eliminated.
Second, major fields of study would have to have consistent codes from year to year, and the code numbers should be ordered to correspond to some rational ordering of major fields. In the questionnaire itself, prior to 1988, there was no apparent connection between a code and the subject it represented.
Third, if one possible structure of the data base suited certain kinds of analyses and another structure suited very different kinds of analyses, we should consider devising two or more data base structures so as to maximize the usefulness of the information.
Fourth, the structure of the data base, as well as analyses generated from it, would require that some major fields be combined. Not everyone would want to analyze data for zoology majors separate from data for majors in other biological sciences. Some rationale had to be devised for combining fields in ways suited to the study of talent flow. The rationale we used is described below, under “Matrices of Broad Areas of Study.”
With these considerations in mind, we developed three different structures, each suitable for a different type of analysis.
One structure is a simplified form of the GRE history files, where each record contains the data for one examinee, major fields are coded identically from year to year, and the record formats are the same for each year. The other two data base structures use a square matrix design. These are the simplest structures, in which rows represent intended graduate fields of study and columns represent undergraduate majors. Cells of the matrix contain aggregated statistics for the test takers specifying that particular combination of graduate/undergraduate major. The diagonal of the matrix contains the statistics for people remaining in the same field.
7

Each of these three data base structures is described in detail below.
13te individual examinee data base. The individual examinee data base contains selected information from the GRE background questionnaire in addition to test scores and registration data. Appendix A gives the record layout for that data base. It contains the following information for everv test taker in the history files:
Sex Educational level Test year GRE verbal score GRE quantitative score GRE analytical score
Background questions: Whether and when GRE was taken previously U.S. citizenship (yes or no) Ethnic identity Whether English is best language Year of bachelor’s degree Undergraduate major Degree objective Intended graduate major Undergraduate grade-point-average in major Overall grade-point-average last 2 years of college Hours worked for pay while in college Hours of service work while in college Area of most important honor or award Father’s formal education Mother’s formal education Date of birth
Creating this data base required the gathering of documentation--often difficult to find and often containing serious errors or omissions. Minor changes in the background questionnaire over the lo-year period required meticulous attention to whether the documentation actually fit the data files. Some major field choices had been eliminated, for example, because few examinees selected those choices. When fields were eliminated, their code numbers were reassigned to new fields. Often it was only through the tedious reviewing of apparent trends in numbers or test scores that we uncovered errors arising from inadequate or unavailable documentation.
Because there had been changes in major field codes over the years, and because the numbers used for the codes showed little or no pattern that could be associated with the fields themselves, we redefined the codes completely for this data base. The new code numbers begin with 01 designating mathematics. The numbers increase through the physical sciences, engineering, biological sciences, applied biological sciences and health professions, administration, social sciences, applied social sciences, education, humanities, and arts. In total,
8

there are 100 major fields. Number 101 is assigned to “other” fields. The revised codes for all fields are listed in Appendix B.
The individual examinee data base contains no information whereby the examinee or attending institution can be identified. Currently this data base exists only on a tape that can be accessed through the ETS mainframe.
M&rices of detailed major@&. Once the individual-examinee data base was complete, it provided the input for large square matrices. These matrices are 102 rows by 102 columns. The rows correspond to intended graduate fields of study, and the columns correspond to undergraduate major field. Row 102 and column 102 contain marginals.
Each square matrix contains a single statistic, such as mean verbal score, for each combination of undergraduate and graduate field for a single year. Each file contains the matrices for all nine years, arranged sequentially from 1978 to 1987, excluding 1979. For example, if we wish to know how many Black examinees taking the GRE in 1978 had bachelor’s degrees in mathematics, we would look at the column marginal of the first matrix, that is, column 1, row 102. We find the number 208 in that cell. How many of those 208 test takers planned to study mathematics at the graduate level? Column 1 row 1 shows 60. Only 60 of 208 Black math majors taking the GRE planned to continue in mathematics. What did the rest plan to study? Looking down the first column we see 11 people switching to applied mathematics, 7 to statistics, 2 to physics, 38 to computer science, and so forth, with a few planning to enter very different fields, such as occupational therapy and public administration. We could continue paging through the file to the last matrix to compare the same statistics for each year through 1987.
In constructing the detailed matrices, we did not include all records from the GRE files. We excluded examinees who omitted either of the questions on major field, though we retained * those who marked “other.” An omission of either question would make it impossible to study the flow of those examinees into or out of a field. We also included only U.S. citizens for reasons that should become evident.
In recent years, increasing numbers of foreign students have been taking the GRE and attending U.S. graduate schools. According to the GRE Data Summary Reports, 91.1% of the GRE population in 1978 were U.S. citizens (Wild, 1979). By 1987, this figure had dropped to 84.2% (Educational Testing Service, 1988). Foreign examinees, not surprisingly, tend to score
In 1987, the verbal score average for lower than U.S. citizens on the verbal and analytical tests. all examinees was 487; for U.S. citizens, the average was 505. There was a similar difference in analytical score averages, with the total population averaging 528 and U.S. citizens averaging 541. Quantitative scores tend to be higher for foreign examinees because a large proportion of foreign students are in the sciences and engineering. The average quantitative score in 1987 for all test takers was 539; for U.S. citizens the average was 531.
Because foreign test takers score so differently from U.S. citizens, researchers studying GRE data are finding it increasingly necessary either to restrict analyses to U.S. citizens or to analyze U.S. citizens separately from foreign examinees. In the design of the talent flow data base matrices, therefore, we included only U.S. citizens for two reasons.
9

First, talent flow questions generally pertain to U.S. education, the U.S. economy, and the interests and values of U.S. students. Foreign examinees may exhibit very different patterns of talent flow depending on their nation’s priorities, cultural differences, and other factors. Although statistics about foreign examinees may be interesting, they would not be central to most studies of talent flow.
The second reason for excluding foreign examinees was based on data processing, storage, and maintenance demands. Because of the matrix structure of the data base, inclusion of foreign examinees would triple the number of files that would have to be created and managed? Already, with our focus just on U.S. citizens, a considerable number of files were required, and more may be added in the next few years. If, at some future time, we have reason to create a matrices for foreign examinees, we can easily create them from the individual examinee data base.
At the present time, the detailed matrices are in two locations. One copy is on tape accessible through the ETS mainframe, and one is hard copy with labels for easy reading. The matrices on tape omit the marginal rows and columns and are therefore 101 rows by 101 columns.
Although the hard copy is easy to read, it constitutes many volumes and cannot be easily dupIicated for distribution. Appendix C shows an example of the hard copy: the percentage of 1987 female examinees planning to earn a doctorate. Appendix D lists the files currently existing on tape.
Matrices of broad areas of study. The “small” matrices are the easiest to use and provide summary statistics for broad fields of study. For example, we might be interested in combining areas of biology instead of analyzing zoology, genetics, and other specialties separately, as we must do if we wish to obtain summaries from the detailed matrices. Thus we combined 11 fields into a single category labeled biological sciences.
There are many ways we might have combined major fields, depending on the purpose of the analysis. Some investigators may, for example, include history within the humanities. Others may include it in the social sciences. Still others may wish to keep it separate so they can compare it with other areas of the humanities or social sciences. Students of the humanities may wish to exclude the arts, particularly the fine arts and design, from the broad area of arts and humanities. Similarly, some scientists would include metallurgy in the physical sciences but others would place it under engineering. The interdisciplinary fields are especially hard to classify. Hospital administration is both administrative (suitable to include with business and public administration) and appropriate for inclusion with health services.
‘The background questionnaire recognizes three categories: U.S. citizen, resident aiien, and neither.
An analysis of foreign examinees would probably distinguish between resident aliens, most of whom would have been educated in the United States, and the third category, most of whom would have received their education abroad. Future studies of talent flow among foreign examinees can create the necessary matrices for these two groups from the individual examinee data base.
10

For the purposes of studying talent flow, we are concerned with change in field of study--how many people change, and whether the changes are to slightly different fields or greatly different fields. Just what defines a “different” field of study, however, is subject to interpretation.
Consider some of the common classifications of disciplines. “Physical sciences,” for example, often includes astronomy, physics, and chemistry. A student who earns a B.S. in chemistry and then enters graduate school in astronomy is an extreme rarity, however, because the chemistry curriculum does not prepare someone for graduate study in astronomy. There is very little course overlap, and the technical contents of the two fields are quite different. From the point of view of curriculum content, therefore, a change from chemistry to astronomy would be a significant change.
Viewed from another point, switching from chemistry to astronomy is only a trivial change because the person does not leave the physical sciences. This latter view might be held by someone concerned with talent flow into and out of the sciences. There is no loss of talent from the sciences if someone makes a lateral shift to a different physical science.
Suppose a person changed from mathematics to education. In terms of curriculum content, this is a considerable change. The student’s graduate education courses will be quite different from his or her advanced undergraduate math courses. But the change from math to education is a frequent change because many math students wish to teach in high school. From that perspective, their undergraduate curriculum prepares them appropriately for their graduate work. They are not really changing to a different field--they are not abandoning mathematics--but are merely progressing along a natural course to become math teachers.
What if a student changes in the reverse direction, from education to mathematics? Such a change is far less frequent than the change from math to education. Furthermore, higher level mathematics (advanced calculus, for example) is not part of the undergraduate education curriculum. So if education majors intend to become mathematicians, they must take even more advanced courses than their fellow students who are planning to teach math. From any perspective it seems likely that the transition from education to mathematics would be regarded as a large change. Furthermore, it is greater than the change in the reverse direction. In some instances, therefore, a change from a to b is not the same magnitude of change as a change from b to a.
11

For the purposes of the talent flow data base, we grouped major fields into the following 10 categories:
Arts/Humanities Physical Sciences/Mathematics Engineering Biological Sciences Applied Biology/Environmental Sciences Social Sciences Applied Social Sciences Health Sciences/Services Education Business/Public Administration
Appendix E lists the specific fields of study that were grouped into each of these broad areas of study. Although the classification scheme used here will not be satisfactory to everyone, it provides a useful “first shot” at studying talent flow. When we receive an inquiry about science students planning to earn a master’s degree in education, or about the brain drain from the physical sciences into other fields, or about how well the humanities are doing, these tables 1
can provide a convenient source for a simplified answer. When the question involves a more detailed look at disciplines, in-depth analyses using the detailed matrices will be appropriate.
The small matrices are also simplified in that they exclude examinees who marked “other” or “undecided” major field categories because those responses could not be grouped into broad fields. Thus the total number of records used to create the smaller matrices is somewhat smaller than the total number in the detailed matrices.
Like the matrices of detailed fields, the matrices of broad areas of study exist in two forms: hard copy in a binder, and tapes accessible through the ETS mainframe. The matrices are small enough to be copied onto floppy disks or Bernoulli cartridges for analysis on a personal computer. Appendix D lists the file names and formats of all matrices of broad areas of study.
12

PART II. USE OF THE DATA BASE
ANALYSIS AND PRESENTATION OF DATA
After creating such a large number of talent flow data bases, it became clear that the possibilities for analysis were limited only by time and the capacity to ask questions. Up to 70% of the resources for the project went into development of the data base. The hard-copy output made for fascinating reading in itself. But reporting, in some organized fashion, the “major findings” in the data base could be a lifetime task.
Many kinds of questions could be answered. We could discuss each and every field of study--who enters it, who leaves it, and how they have changed over the last decade. Readers could search one of the many volumes of that encyclopedia to learn about the field of their choice. That goal seemed unrealistic. Furthermore, readers are interested in patterns. They are interested in causal explanations for those patterns, in terms of student background, economic and political conditions at the time of career choice, and relations to other data bases. Analyses at this level of detail and sophistication were unrealistic as “first cracks” at this new data base.
What was a more realistic undertaking for this project was to identify and discuss trends in the marginals of the small matrices (numbers entering and leaving broad fields of study) and some simple analyses of patterns in talent flow into and out of broad fields of study and selected specific fields. Perhaps most important was to find informative ways to present those patterns. Matrices that are 102 rows by 102 columns by 9 years are readable, both visually and by computer, but patterns in data do not simply “emerge.”
As a start in data presentation, we produced five sets of tables:
Table 1: Trends for all U.S. citizens taking the GRE
Tables 2.1 to 2.10: Trends for all U.S. citizens intending to major in each broad field of graduate study
Tables 3.1 to 3.10: Trends for all U.S. citizens with an undergraduate degree in each broad field of study
Tables 4.1 to 4.10: Trends for all U.S. citizens with the same undergraduate major and intended graduate major
Tables 5.1 to 5.8: Relationships of selected background variables with the decision to change from each of 10 broad fields of study to another field
We found that in addition to the trend tables, the most effective way to identify patterns was to graph the data in many different ways and then to present the most informative graphs. The shells of those graphs can be retained for the display of other combinations of data at a later time.
13

Much of this second phase of the project, therefore, involved the trial-and-error design of informative visual presentations, and then the preparation of verbal summaries of those charts.
EXAMPLE 1: TRENDS IN THE SELECTION OF GRADUATE FIELD OF STUDY
GRE Population Trends
The total number of U.S. citizens taking the GRE and specifying fields of study increased from just under 160,000 in 1978 to over 170,000 in 1980 and then declined sharply to less than 120,000 in 1983. Gradually, it rose again to about 150,000 in 1987. Over that same period of time, the mean GRE verbal score wavered, showing no overall gain or loss between 1980 and 1987. The quantitative score average increased until 1983, dropped a few points in the next two years, and rose again to a peak of 533 in 1986. The analytical score average wavered considerably between 1978 and 1982 and then rose steadily. Between 1980 and 1986, the mean analytical score increased 27 points. It is important to note, with respect to analytical scores, that the General Test was revised several times during this period, and trends in scores are probably not meaningful. Comparisons among groups of examinees within the same year are, of course, appropriate.
Figures are shown below and in Table 1:
1978 1980 1981 1982 1983 1984 1985 1986 1987
Nuker 159,907 171,780 145,944 128,740 117,777 118,727 133,636 141,179 148,841 Verbal 501 505 500 499 503 505 502 506 505 Quantitative 515 516 517 522 530 529 527 533 531 Analytical 521 515 524 520 528 536 538 542 541
The following graph shows more vividly that the trends in test scores (line graphs, right scale) did not follow the decline and rise in examinee volume (bar graph, left scale).
14

Number of Examinees and GRE Scores of U.S. Citizens Who Specified Graduate
and Undergraduate Fields of Study
Number (Thousands) Mean Score
ANALYTICAL --------___
250 QUANTITATIVE
200 - VERBAL
’ 550
.525
425
1978 1980 1981 1982 1983 1984 1985 1986 1987
Year
Many educators believe that there is an inverse relationship between volume and ability: when the number of people planning to enter a field changes, there will be a corresponding change in population characteristics, such as test scores. As a field increases in popularity, for example, we might expect it to attract a less select (that is, lower scoring) population. The assumption is that as demand increases--whether for scientists, teachers, college graduates, or some other pool of talent--an increasing volume of people will begin to fii that pool, and those people will be less qualified than the smaller number of people who previously filled the pool.
Adelman (1985) formulated this conventional wisdom hypothesis: “The greater the number of test takers, the lower the scores; the lesser the number of test takers, the higher the scores.” He went on to test the hypothesis with trends over nearly two decades in the volumes and scores from nine different tests: the verbal and quantitative sections of the GRE General Tests, the GRE English, History, Biology, Mathematics, and Sociology tests; the Law School Admission Test (LSAT); and the Graduate Management Admission Test (GMAT). Only two of these tests followed conventional wisdom: the GRE quantitative section and the GRE Mathematics Subject Test. These results--two tests out of nine--could hardly be said to support conventional wisdom.
It seems likely that the conventional wisdom hypothesis, rather than being wrong, is just one aspect of a very complex process. We know, for example, that attraction to specific professions changes over time, and the corresponding volume of examinees planning graduate study in those professions changes accordingly. Computer science, for example, showed a considerable gain in popularity in the early 198Os, but geography nearly dropped out of sight
15

during that time. As the population shifts in its interests, we would expect corresponding shifts in aptitudes and experiences.
To see whether a decline-and-rise pattern in examinee volume occurred in all fields of study, and to see whether test scores followed a related pattern, we compared the volumes and test scores of examinees planning to enter each of 10 ten broad fields of study. The next two graphs show the overall patterns of examinee volume. Note that the vertical axis is scaled differently on each graph.
Intended Graduate Fields of Study Physical Sciences/Math, Engineering,
Biological and Health Sciences
Number (Thousands)
... . .
. . . . . . . . . ... . . ... . . . . . . . . . . . . . . . . . . . . . ... ... ... . . . . . . ... . . . . . . . . . ... . . . . . . . . ... . . . . . . . . . . . . . . . . . . . . . . . . . ..... . . . . . . . . . .................................................................................................................................. .................................................................................................................................. .................................................................................................................................. .................................................................................................................................. . . . . . . . . . . ... ... . . . . . . . .... . . . . ... .... . ...... . . . . . . . ..... .... . . . . . . . . . . ... . . . . . . . . . . . ... ..... . . . . . ... . . . . . . . ... . ... . ... . ..........
0, . . . I I . . .
- . . . . . . . .._ L . .._ I . _ . ”
7
2 e !alth
1978 1980 1981 1982 1983 1984 1985 1986 1987
Year U.S. citizens only
16

intended Graduate Fields of Study Social Sciences, Arts/Humanities,
Education, and Business
Number (Thousands) A
1978 1980 1981 1982 1983 1984 1985 1986 1987
Year
U.S. citizens only
From these graphs we can make three very striking observations:
1. Most fields, but not all, showed a decline-and-rise trend. For some fields the trend was only slight; for others, it was quite dramatic.
2. Some fields showed very different trends. Engineering, physical sciences, and mathematics showed steady growth.
3.~ Education and social sciences had the largest volumes, and, consequently, their numbers provided the greatest weights in the population statistics. Even the third largest area, humanities and arts, showed a similar trend. Hence, the fields attracting the greatest numbers of examinees-education, social sciences, and humanities--may be viewed as having determined the decline-and-rise trend in the population.
The observation that trends in examinee volume did vary across fields leads us to examine each of these broad fields of study more closely and, in particular, to see if trends in test scores seem to relate in any way to trends in volume.
17

Trends within the Ten Broad Fields of Study
Education. The largest field of study, attracting one fifth of the examinee population, is education. The following graph shows the decline-and-rise trend in the volume of examinees planning to study education at the graduate level. GRE score trends are also shown.
Number of Examinees and GRE Scores of U.S. Citizens Planning to Study
Education
Number (Thousands) Mean Score 70
- 490
60 - - 470
50 - __-- __--________ .___-------------_ - - __________
hERBAL 450
40 430
30 410
20 390
10 370
0 I . . . . 350 1978 1980 1981 1982 1983 1984 1985 1986 1987
Year
In the three years from 1980 to 1983, the number of examinees planning to study education (including teacher education, administration, educational psychology, and guidance/counseling) dropped 41%~-from 38,425 to 22,568. The decline of some 16,000 people from education is even more dramatic than the 31% decline in GRE candidate volume during those three years. After 1983, the number entering education slowly increased, but it never reached the peak shown in 1980.
Although volume showed a decline-and-rise pattern, verbal scores showed a small but steady improvement, from a mean of 451 in 1978 to a mean of 460 in 1987. Quantitative scores paralleled verbal scores. Contrary to conventional wisdom, there is no evidence whatever that the dramatic changes in the number planning to study education was associated with any change in academic ability.
18

Social sciences. The area attracting the second largest number of examinees has been the social sciences, which accounted for 19% of the examinee volume in 1987. The graphs for social sciences and applied social science follow the same trends in volume as the total GRE population. Note that the applied social sciences draw a much smaller volume than the “pure” social sciences (the ordinates of the graphs are different).
Numbers of Examinees and GRE Scores of U.S. Citizens Planning to Study
Social Sciences
Number (Thousands) Mean Score 60
VERBAL ____---------em _____-------_____ --______--
- QUANTlTATlVE
550
500
30
20 450
10
0 400 1978 1980 1981 1982 1983 1984 1985 1986 1987
Year
19

Numbers of Examinees and GRE Scores of U.S. Citizens Planning to Study
Applied Social Sciences
Number (Thousands) 20
15- -
Mean Score
ANALYTICAL ___-- ________-----_--____________
VERBAL - 500
QUANTITATIVE 1450
10 400
5 350
0 300 1978 1980 1981 1982 1983 1984 1985 1986 1987
Year
During the three years following 1980, the number of people planning to study social sciences decreased by more than 10,000-a decline of 32%. In the applied social sciences, the decline continued through 2984, so that in the four years--from 1980 to 19840-there was a 40% decrease in examinee volume.
In direct contradiction of the conventional wisdom hypothesis, verbal scores actually peaked in 1980, at the same time volume peaked, especially for examinees entering applied social sciences. Also note that the score means were consistently lower, by about 25 points in verbal, 55 points in quantitative, and 40 points in analytical, for examinees entering the applied social science fields. A hypothesis that students choose their graduate field of study by an evaluation of their own verbal and mathematical skills is explored later in this report.
Biological sciences. The biological sciences, applied biological sciences, and health sciences and services showed quite different trends.
20

Numbers of Examinees and GRE Scores of U.S. Citizens Planning to Study
Biological Sciences
30
25
20
15
10
5
0
Number (Thousands) Mean Score I I 600
:
QUANTITATIVE
--__ --__ ____----- e-.--m_________- 550
1 VERBAL
i 500
450
400 1978 1980 1981 1982 1983 1984 1985 1986 1987
Year
Numbers of Examinees and GRE Scores of U.S. Citizens Planning to Study
Applied Biological Sciences
Number (Thousands) Mean Score 6 600
QUANTITATIVE 5 --- _rcL__---
__- -- __-- __-- 550 --__ -_ --_.___---- __.--_-_____ --
ANALYTICi;-
4 500
450 >.-
400
350
300 1978 1980 1981 1982 1983 1984 1985 1986 1987
Year
21

In the “pure” biological sciences, there was a pronounced peak in 1980, just as there was in education, though in relative numbers, only a small percentage of examinees planned to study biological sciences. As in the overall GRE population, biological sciences declined in volume after 1980 with only a gradual rise after 1984.
The applied biological sciences (primarily agriculture and environmental sciences) showed only a minor peak in 1980, and numbers increased after 1982. The following graph, compared with the previous one, suggests a drift in preferences from biological sciences in the earlier years to applied biological sciences in the later years. Note that the scales of all three graphs are different; biological sciences has always attracted from two to four times as many students as the applied biological sciences, and the health sciences have attracted more students the biological sciences.
Health sciences and services, the largest and most stable of the three life science categories, showed only a small decline through 1984, followed by a slight increase in volume.
Numbers of Examinees and GRE Scores of U.S. Citizens Planning to Study Health Sciences and Services
Number (Thousands) - - Mean Score 30 550
25
500
20
15 450
10
400
5
Year
All three of the life science areas showed some type of decline and rise in volume, but no area quite paralleled the trend in overall examinee volume. As for test scores, the means for both the verbal and quantitative sections rose very slightly for the applied biological sciences and declined very slightly for health sciences and services, but the score changes were so small that they probably do not indicate any real talent flow from one field to the other.
22

Arts and hzmunities. Trends in arts and humanities were very similar to population trends.
Numbers of Examinees and GRE Scores of U.S. Citizens Planning to Study
Arts and Humanities
Number (Thousands) Mean Score 50
- 565 VERBAL
40- T - 545 -_ ---___
ANALYTICA.L--- _.-----_____
- 525 30-
--GGITATIvE - 505
20 485
465 10
445
0, I 425 1978 1980 1981 1982 1983 1984 1985 1986 1987
Year
The number of examinees planning to study arts and humanities followed the same decline and rise seen in education and the social sciences. The test scores, however, showed more pronounced patterns than we saw in other fields of study. Verbal scores peaked in 1980, when the candidate volume was largest. Means then declined in 1981 and 1982. Over the next five years, however, verbal scores rose a full 16 points. Quantitative score averages rose steadily ’ over the entire lo-year period, with a total increase of 10 points. The score increases occurred for both males and females. In addition, the percentage planning to earn a doctorate increased during this time. It appears as if the humanities have been attracting more able students having high aspirations since 1982.
Engineering and physical sciences. Among all of the broad fields of study, engineering showed the largest growth.
23

Numbers of Examinees and GRE Scores of U.S. Citizens Planning to Study
Engineering
Number (Thousands) Mean Score 25 I 1 700
QUANTITATIVE
20
1
___1---__-__________-~--_______ ____----_____--- ____---- ----___ __.__--- X~ALYTICAL 600
I \ I 15
VERBAL 500
10
400 5
0 300 1978 1980 1981 1982 1983 1984 1985 1986 1987
Year
Between 1978 and 1987, the number planning to study engineering at the graduate level increased from just over 7,000 to more than 12,000~-an increase from 4.6% to 8.1% of the examinee population. The number of women planning to study engineering doubled over the lo-year period, and the percentage who were Black rose from 2.76 to 3.98. It is perhaps interesting to note that among females planning to study engineering in 1987,7.6% were Black. There was no consistent change in the test score means over that period.
Math and physical sciences also showed a steady growth of 18% during the lo-year period.
24

Numbers and GRE Scores of U.S. Citizens Planning to Study
Physical Sciences or Mathematics
Number (Thousands) Mean Score 30
QUANTITATIVE - 650
25 - e-w---- _________________-.-______________~~~----.-- __-- ____---i--AL;Y;;CAL ______--
20- - 550 VERBAL
15 450
10
350 5
0. . . . . . 250 1978 1980 1981 1982 1983
Year 1984 1985 1986 1987
In the five years after 1982, quantitative score averages rose 16 points. This may suggest that within the physical sciences there was some growth after the early eighties both in both the quantity and quality of examinees planning graduate study.
Business, commerce, and law. Students who plan to pursue advanced study in fields such as law, business, commerce, and other forms of administration generally apply to professional schools requiring tests other than the GRE. Some of these students--between 8,000 and 15,000 a year- also take the GRE. We do not know how well the sample who take the GRE represent applicants to law and business schools, so we must be cautious in drawing inferences about this group from our
Our data population as a through 1987.
analysis.
show a peak in candidate volume in 1980, just as there was for the GRE whole, followed by a sharp decline through 1984, and then a very slight increase
25

Numbers of Examinees and GRE Scores of U.S. Citizens Planning to Study
Business, Commerce, or Public Admin.
Number (Thousands) Mean Score
I ANALYTICAL
20 VERBAL
15
1978 1980 1981 1982 1983 1984 1985 1986 1987 Year
The data show that GRE scores, both verbal and quantitative, peaked in 1980, along with the numbers of examinees. Scores dropped slightly in 1982 and changed little thereafter. If this sample adequately represents candidates who apply to law and business schools, at least in their numbers, we see no sign of a brain drain into business and law, as the academic world often fears.
Proportional &t&&on of the broadfields of study. The data presented so far on volumes of examinees have been based on absolute numbers. Because the total population size varied over the lo-year period, it is difficult to see whether any fields grew or diminished as a proportion of the GRE population. In the following graph, the 10 fields have been reduced to 8, with applied social sciences combined with social sciences, and with applied biological sciences being combined with social sciences. The graph shows the percentages of the GRE population planning graduate study in each area for 1978 (solid bar) and 1987 (shaded bar). The percentage choosing social science fields did not change over the lo-year period, but remained at about 25%. The proportions choosing education, health sciences and services, business, and biological sciences all declined. The proportions choosing engineering, physical sciences and mathematics, and arts and humanities all increased. The selection of engineering, in particular, showed a large proportional increase, from 4.6% to 8.1%.
26

Change in the Percentages of the GRE Population Planning Graduate Study in
Each of Eight Areas: 1978 to 1987
Percent 30
These areas decreased ..- . . . . . _” . . . . . . -_.._-._ . . . . . . . - . . . . . . .._.. _ _ . . . . . . “.“_.._ . -_ . “._..._. . ...” __......-.
15 __._-___.“._____ . _ . .._._ -.” . . . .._..... ..-._ .._.. ._.._.._._._.._.....” . . . . .
10 . . . . . . . .._.........” .._.............._.. . . . . . . . “,.,” ..“.“” ,... _
5
0
These areas increased . . . . . . . . . . . . . . . ..“. . . . . . . . . . . . -... .” . . . . . . . . . . . . _ ̂ ...... I .” . . . . . .._........ “..._._“__.”
Educ Health Bus Biol SocSci Engin Phys Hum/Art
Field of Study
- 1978 t$$@! 1987
U. S. citizens only
Age, Gender, and Ethnic Composition
Age. Among the matrices for the talent flow data base are mean ages, by gender and by degree goal, and numbers of examinees over age 30, by gender and by degree goal.
In the GRE population as a whole, regardless of gender or intended field of study, the percentage of older examinees increased between 1978 and 1987. Among those who specified graduate fields of study, the percent over age 30 rose from 15.1% in 1978 to 27.7% in 1987. The greatest increase, however, was between 1978 and 1980. After 1980, the proportion of older examinees dropped slightly and then rose very slowly over the remaining seven years.
Female examinees, on the average, were older than males. The mean age for males in 1987 was 26.4, and for females the mean was 27.6. The real difference shows up in the percentage over age 30. Over the lo-year period, the percentage of women over 30 increased from 17.7% to 30.6%, and the percentage of men over 30 rose from 11.8% to 22.3%.
If we look at the number, rather than the percentage, over age 30, we see that the numbers under 30 declined and the numbers over thirty actually remained quite constant, at least after 1980.
27

Number of Examinees Over and Under Age Thirty, by Gender
Number (Thousands) 80 I 1
--__ --__ --__ --__ --__ -_ 60-
0 I 1978 1980
U.S. citizens only
Female, over 30 ___--- ____----- ___---
__-- __-- -________-------- __--
Male, over 30
I 1 I I I I 1981 1982 1983 1984 1985 1986 1987
Year
The graph also shows that the peak in examinee volume occurring in 1980 was primarily due to an increase in older students. That increase, especially among older males, reversed by 1981. We might conjecture that the peak in 1980 was associated with the rather severe recession that occurred at that time, and that the recession may have affected older males more than others. We see from the same graph that after 1984, there was an increase in numbers of males and females, younger and older students.
Some fields of study more than others attract older students. In certain fields, such as education, people often work a while before returning for an advanced degree, or they continue their education one or two courses at a time while they work. The following two graphs show trends in the percentages of examinees over age 30, by intended field of study. Note that the scales of the two graphs are different.
28

Percentage of Examinees Planning to Enter Each Field Who Were Over Thirty:
30
25
20
15
10
5
Engineering, Physical and Life Sciences
Percent 35
. ..-- _.-- _.-- _..-
_.-- Health Sciences
..-- _..- c...---....
_.-. _C..
.- ..-- _..-
, *-a_ , --__ .- .- --__.- , Applied Biological Sciences
I / , \ / dN----- . . . . , I / Physical Sciences/Math
___.._......--
Biological Sciences
1
1978 1980 1981 1982 1983 1984 1985 1986 1987
Year U.S. citizens only
Social Sciences, Arts/Humanities, Education, and Business
Percent 50
___._._........ . ..- _.*- ..-- .
40 - ,,~--..__~_________...------------.__....-~~~f~~~- , / I / /
Business
Social Sciences
0 I I I I I I I
1978 1980 1981 1982 1983 1984 1985 1986 1987
Year U.S. citizens only
29

It is clear from both of these graphs that the greatest proportion of older examinees were in service professions--the health sciences and services and education. Within any given area, the most applied fields appeared to attract the older students. More older examinees entered applied social sciences than “pure” social sciences, and, among the life sciences, biological sciences attracted the fewest older examinees, applied biological sciences attracted about 50% more, and the health sciences and services attracted about three times the percentage of older students as did “pure” biological sciences.
The fact that some fields attracted more older students than did other fields has implications for talent flow. We would expect more older students than younger students to be changing careers, since, by necessity, younger students include most of the population who have not yet worked. As increasing numbers of older people return to college or graduate school for a career change, we can expect to see more flow of talent from one profession to another. Talent flow as a result of career change would have quite different effects from talent flow during student years. After people have had work experiences in one area, they have specialized knowledge that gives them a unique perspective on their new field. This unique perspective and knowledge base has the power to change the very nature of the second career.
In 1987, 100 GRE takers over age 30 had undergraduate majors in engineering and planned to do graduate work in the social sciences or applied social sciences. These examinees, if they pursued their goals, would bring to the social sciences a very different body of experiences than would the bulk of other social science majors. Because they were over 30, they were likely to have had careers--probably as engineers--and for whatever reasons, they had chosen a complete change of field.
Consider another example--the graduate field of education. Older people entering education may be leaving industry in order to teach, they may be homemakers planning to enter the work force, or they may be leaving teaching for administration. In any case, their movement has a different effect on their careers and on the profession than if they had never been employed or had never homemakers.
A 40-year-old scientist leaving a chemistry laboratory to teach high school has considerably more to offer students to prepare them for an occupation in the sciences and in industry than does a 230year-old graduate who has studied education but has had no work experience in chemistry. On the other hand, the laboratory is losing a productive (or unproductive) worker. A person leaving teaching for administration brings to that position much first-hand experience in the problems of teachers, while his or her students may be losing an effective (or ineffective) teacher. Someone who has been a full-time homemaker and who now plans to teach has had the unique experiences of rearing children--experiences quite different from those of the student who has learned about children exclusively from education and psychology classes. Although she (or he) may bring valuable experience from the home, the home may also suffer by losing much of the valued parent’s time. In all cases, there will be a pronounced shift in the balance of talents among occupations when people transfer their efforts from one line of endeavor to another.
Not all older students, of course, are changing careers. Some are advancing their careers. Some started college when they were older and are continuing straight through graduate school. All of these examinees are worthy of study, and with additional information from the data base,
30

such as years since they earned a bachelor’s degree, we can research the characteristics of people who are structuring their education and their careers in many different ways.
Gender. Among all U.S. citizens taking the GRE General Test and specifying fields of study, the percentage who were female increased very little over the lo-year period studied. In 1978 the figure was 55.1%. It rose only to 56.5% by 1987. This is surprising because the number of women awarded doctorates increased substantially over that decade. Between 1978 and 1987, the percentage of U.S. citizens awarded doctorates who were female rose from 29.0% to 40.9% (National Research Council, annually from 1978 to 1987).
One explanation could be that GRE takers are not representative of doctoral candidates. From our talent flow data base on examinees planning to earn a doctorate, we find the percentage of females increasing from 46.4% to 50.3%. Although this is a slightly larger increase than we found among all GRE takers, it by no means resembles the statistics for doctoral recipients.
From the GRE data base alone, of course, we cannot explain this discrepancy. A curious speculation would be that more women who intend to earn a doctorate are now successfully completing their work.
An alternative explanation could be that the lag time between taking the GRE and acquiring the doctorate is too long to allow the two data bases to be compared with much precision. If the women who earned a doctorate in 1987 took the GRE in 1980, the percentage earning the doctorate and the percentage taking the GRE and intending to earn a doctorate differ by only 2 percentage points. 1 This finding not only supports the alternative explanation for the apparent discrepancy between the two data bases, but it suggests remarkable predictive validity for the GRE background question on degree aspirations.
What these observations also suggest, however, is that in the near future, based on GRE predictions, the percentage of women earning doctorates will not increase noticeably. This prediction is believable because the percentage of doctorates awarded to women did level off after 1986. Prior to 1986, the numbers increased by 1 or more percentage points each year. From 1986 to 1988, the percentage of doctorates awarded to women increased only from 40.9% to 41.0%--just one-tenth of 1 percentage point in a period of two years.
For whatever the small increases in female test takers means, it is-worthwhile to examine the numbers of women planning to undertake graduate work in each area. Regardless of that figure’s predictive validity, it indicates which fields are being selected by more women and may indicate how well the various professions are encouraging female participation.
In the GRE files, fields such as the applied social sciences and education, which have always been predominantly female, did not show noticeable increases in female examinees. In both of these fields, women constituted about 75% of the population, and this figure has remained fairly constant over 10 years studied. In health sciences and services, however, the numbers grew slightly from an already high 76% in 1978 to 80% in 1987. This field, however, includes medicine as well as nursing and numerous other allied health professions. Women have been traditionally underrepresented in some of these fields.
31
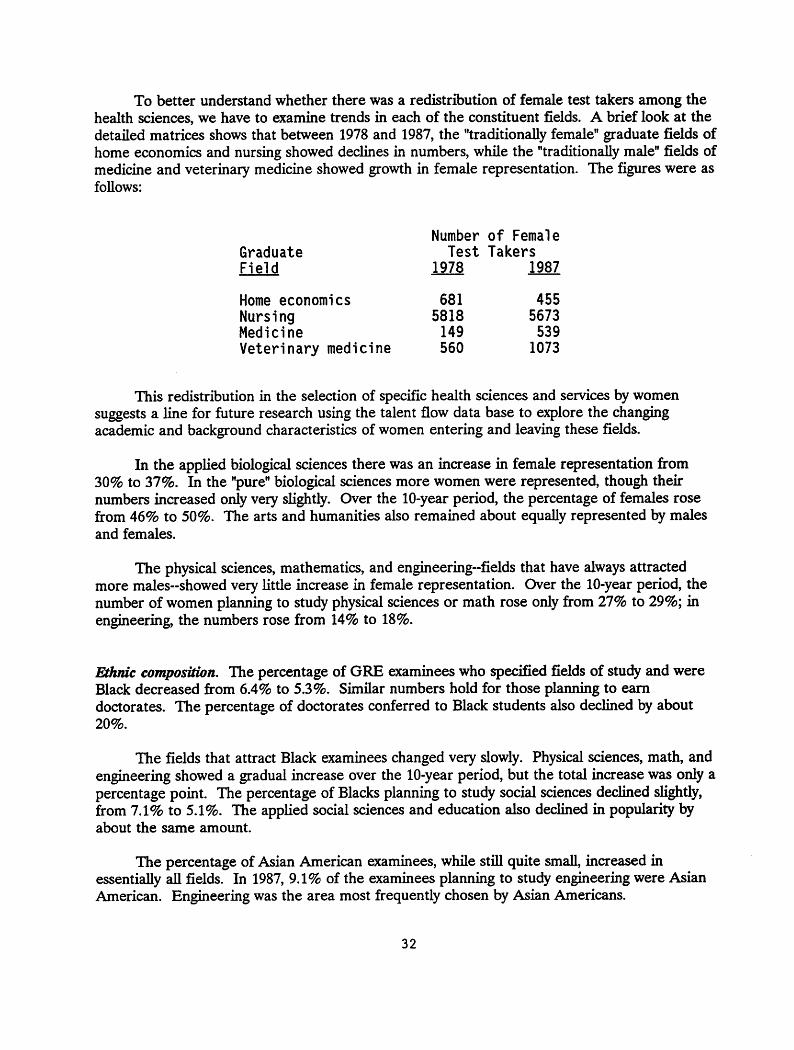
To better understand whether there was a redistribution of female test takers among the health sciences, we have to examine trends in each of the constituent fields. A brief look at the detailed matrices shows that between 1978 and 1987, the “traditionally female” graduate fields of home economics and nursing showed declines in numbers, while the “traditionally male” fields of medicine and veterinary medicine showed growth in female representation. The figures were as follows:
Graduate Field
Number of Female Test Takers
1978 1987
Home economics 681 455 Nursing 5818 5673 Medicine 149 539 Veterinary medicine 560 1073
This redistribution in the selection of specific health sciences and services by women suggests a line for future research using the talent flow data base to explore the changing academic and background characteristics of women entering and leaving these fields.
In the applied biological sciences there was an increase in female representation from 30% to 37%. In the “pure” biological sciences more women were represented, though their numbers increased only very slightly. Over the lo-year period, the percentage of females rose from 46% to 50%. The arts and humanities also remained about equally represented by males and females.
The physical sciences, mathematics, and engineering--fields that have always attracted more males--showed very little increase in female representation. Over the lo-year period, the number of women planning to study physical sciences or math rose only from 27% to 29%; in engineering, the numbers rose from 14% to 18%.
Ethnic composition. The percentage of GRE examinees who specified fields of study and were Black decreased from 6.4% to 5.3%. Similar numbers hold for those planning to earn doctorates. The percentage of doctorates conferred to Black students also declined by about 20%.
The fields that attract Black examinees changed very slowly. Physical sciences, math, and engineering showed a gradual increase over the lo-year period, but the total increase was only a percentage point. The percentage of Blacks planning to study social sciences declined slightly, from 7.1% to 5.1%. The applied social sciences and education also declined in popularity by about the same amount.
The percentage of Asian American examinees, while still quite small, increased in essentially all fields. In 1987, 9.1% of the examinees planning to study engineering were Asian American. Engineering was the area most frequently chosen by Asian Americans.
32

Like Asian American examinees, the number of Hispanic American examinees increased in virtually all fields. Their numbers were fairly evenly spread over all broad fields of study.
Trends Among Doctoral Candidates
It is fairly well known that students aiming for a master’s degree have lower test scores and grades, on the average, than students aiming for a doctorate. Self-selection plays a primary role before the student ever takes the GRE.
The analyses discussed so far apply to all U.S. citizens who specified both graduate and undergraduate fields of study. On the average, just under 40% planned to earn a doctorate. For the talent flow data base, we computed a parallel set of all matrices just for examinees seeking a doctorate.
Dodorates conferred, by field of study. The GRE data base cannot be expected to reflect the actual flow of students into graduate school and, subsequently, to the earning of a doctorate. To see how much comparability there may be between the two populations, we compared the numbers of doctorates actually conferred to U.S. citizens in six broad fields with the numbers of GRE examinees planning to enter those fields. It is difficult to correct for the lag time between taking the GRE and receiving a doctorate because people require varying amounts of time to complete their graduate completed their studies.
work, and because those who took the GRE most recently had not yet
Trends in Doctoral Recipients within Six Fields of Study
(U.S. citizens only)
Thousands 7-
_____---.-- __-- e---m_ ----___ --__ -_ ---_a________ 6- --__ ---___ Education ----___ ----___ -----_____
5 _ Social Science- ----____
_______-------- _____-___________----- ---------___________ _-
4 ‘____--- ___--- Life Sciences
Physical Sciences _________.--____-______ ----_._____________------ ____---
Arts/Humanities
l- Engineering
n I I I I I I I I I
-ii378 1979 1980 1981 1982
Source: National Research Council
1983
Year
-1
1984 1985 1986 1987 1988
33

We see, however, that both bases do support the conclusion that education, social sciences, and humanities lost popularity, at least through the mid-eighties and possibly later.
Comparisons in life sciences are rather difficult without recombining specific fields from the GRE data base. The number of doctorates conferred increased between 1978 and 1988, whereas the number of GRE candidates planning to earn doctorates declined and then rose gradually. These patterns do not appear to be consistent, especially when compared with those of education, humanities, and social sciences. The GRE trends in those three areas were very similar to the trend in each area of the life sciences, but the trend in the number of doctorates awarded in those three areas was the opposite of the trend in doctorates awarded in life sciences.
in the Physical sciences and engineering GRE files of examinees planning
both showed upward to earn doctorates in
trends in doctorates these fields.
awarded and
Although the trends in some fields selected by GRE examinees followed the trends in doctorates awarded, this was not true of all fields. There were also some surprising discrepancies between the actual numbers of doctorates awarded in a field and the number of GRE examinees planning to earn a doctorate in that field.
In the social sciences and applied social sciences, from 14,000 to 20,000 examinees each year indicated the intention to earn a doctorate. In actuality, only about 5,000 students a year earned doctorates in social sciences. At the other extreme were engineering and education, in which the numbers earning a doctorate were nearly as high as the numbers taking the GRE and aspiring to do so. It is difficult to know how to explain these differences across fields in the capacity to predict doctorates earned from doctorates intended. Keeping the differences in mind is important when making predictions from GRE information.
Doctorates conferred, by ethnic group and gender. In addition to comparing GRE data with doctorates received by field of study, we also compared the two data bases by ethnic group and gender.
34

Trends in Doctoral Recipients among Four Ethnic Groups
(U.S. citizens only)
Number 1200
____-------___ 1000 -
--.--mm__ ___--- __--5
l . *_ Black *. ____--- _--_-___ --__ -_ -_ 5.
800 - --__ --__ -.__--- _---
600 - Asian American
200 - Mexican American _-
__-.---_a_________________-----------.
Puerto Rican
$76 1979 1980 1981 1982 1983 1984 1985 1986 1987 I 1988
Year Source: National Research Council
Consistent with the GRE data are the trends in doctorates awarded to each minority group. Of the four defined minority groupings, the Black group was the only one declining both in numbers earning doctorates and numbers planning to earn a doctorate. All other groups were increasing.
The percentage of all female doctoral recipients was discussed earlier when we noted that the percentage increased until 1986 and then leveled off. If the women earning doctorates took the GRE around 1981, the two data bases are consistent because the percentage of women planning to earn doctorates reached a peak around 1981 and remained roughly constant thereafter. Women taking the GRE in 1981 would have been earning their doctorates around 1986, when the numbers leveled off.
Trends among GRE examinees planning to earn doctorates. Rather than discussing all fields again for those pursuing a doctorate, we will note some highlights.
The number of examinees planning to earn a doctorate showed the same decline-and-rise pattern that we observed with the total data base, with a peak occurring in 1980. Each of the broad fields of study followed patterns very similar to those observed above.
Overall, the test scores of examinees planning to earn a doctorate increased during the lo- year period. Verbal means rose from 533 to 539, and quantitative means rose substantially, from 544 to 559. Several fields reflected these score increases more than did other fields.
35

Among examinees in applied biological sciences, verbal means rose from 517 to 534, and quantitative means rose from 574 to 582. It was entirely among males in these fields that the scores increased.
In the area of education we also observe an improvement in test scores. Verbal means increased from 488 to 496, and quantitative scores increased from 469 to 484. The greatest improvement in verbal scores was among males; the increase in quantitative scores occurred for both genders.
EXAMPLE 2: CHARACTERISTICS OF EXAMINEES WHO CHANGE FIELDS
External forces--economic, social, political, and scientific--may prompt people to select and change fields at any time during their student years. During the sixties, there was an intense awareness of social issues such as racial equality, a fear of nuclear war that aroused suspicion of technology, and a virtual shutdown of many scientific research facilities that contributed directly or indirectly to the Vietnam War effort by accepting Defense Department funding. Major corporations, such as Boeing and RCA, each laid off hundreds of engineers, Princeton University shut down its accelerator, and aerospace engineers were retooling for new careers. For several years there was a shortage of jobs for scientists and engineers and abundant jobs in education and in social welfare agencies. Federal fellowship support for graduate study in science and engineering declined during the seventies, as did the number of scientific and technical articles published. Correspondingly, science and engineering degrees awarded declined abruptly during the early seventies and stabilized later in the decade. (See National Science Board, 1983 .)
Eventually, the pendulum began to swing the other way. Fewer jobs for humanities majors and teachers and low salaries in the service professions drove some students to consider the professions of business, medicine, law, engineering, biological sciences, and computer science, where the employment outlook had improved. (See Grandy, 1984, 1985.)
By the mid-eighties, student interest in law and medicine were in a decline, and business was soaring. Students had learned that computer science was difficult, which may account for its decline in popularity. Meanwhile, the humanities continued to decline, as did the sciences. (See Grandy, 1989; National Research Council, 1986).
CIRP surveys of college freshmen show that changes in occupational preferences appear to be associated with corresponding changes in student values. Liberal political attitudes were associated with the social concerns of the sixties; since 1970, a “middle-of-the-road” identification has steadily risen (Astin & Green, 1987). The wish to be very well off financially was not such an important goal in the sixties, when fewer than 40% of American freshmen identified that goal as essential or very important. By the later eighties, almost 80% of college freshmen had decided it was essential or very important (Astin, 1990). In an inverse relationship, the value of developing a meaningful philosophy of life declined from being essential or very important to more than 80% of the freshman class of 1967 to less than 40% of the 1987 freshmen. Finally, between 1986 and 1990, there was another swing of the pendulum. It became very important or essential to influence social values and influence the political structure. Along with this desire to become personally involved in changing American society came a renewed interest in developing
36

a meaningful philosophy of life and promoting racial understanding. Furthermore, the importance of financial security began to decline, and the desire to clean up the environment began to rise.
Although we cannot be sure that students starting graduate school reflect the same values as incoming freshmen, it is likely that their values are similar because they do reflect the values of the larger culture around them.
Aside from external forces that influence student values and beliefs about occupations and the job market, there are characteristics of the individual that lead students to recognize the fields that might be most appropriate for them. In the case of students who are “late bloomers” or who are inspired by particular undergraduate courses or professors, this recognition may not occur until their senior year in college, at which point, because it is too late to declare a change in undergraduate major, they decide to enter graduate school in a different field.
In the large number of students who spend some time in the work force between undergraduate and graduate school, this self-recognition process may be even more marked because work experiences may lead college graduates to reevaluate their interests. Perhaps one compelling reason for choosing a graduate major is a feeling that one “belongs” in that field.
This feeling may be based on a belief that others in that field are of similar ability level or that they share the same background characteristics and interests as the applicant. While the GRE data do not permit us to gauge examinee interests, they do allow us to conjecture about examinees who may be changing fields because of convictions about their ability or about their background characteristics vis-a-6 those of others in their chosen field. The concurrent survey of GRE examinees mentioned earlier will enable us to test some of these hypotheses and to elaborate upon the statistical findings we are presenting here.
Changers versus Nonchangers
The matrix structure of the talent flow data base lends itself to many approaches for studying changes in major field. In the detailed matrices, those cells lying on the diagonal contain data on people who planned to continue their graduate program in exactly the same field as their undergraduate major. Those off the diagonal intended to change fields, though that change might have been to a “nearby” field, such as the change from biology to microbiology, or it may have been a radical change, such as from mathematics to archaeology.
The smaller matrices were designed to cluster fields so degrees of change would be less of a problem to define and calibrate. Anyone remaining in the same general area is regarded as not changing. Anyone moving from a pure to an applied area or to education is seen as having made somewhat more of a change, although they may have been preparing for the applied field or for teaching when they chose the undergraduate major. If they changed between other broad areas of study, we defined their move as a definite change. A move, for example, from some area of humanities to some social science is regarded as a definite change.
To simplify preliminary analyses, we regarded a person who made any change, even a small one, as a “changer.” Anyone who remained in the same broad field of study (on the
37

diagonal of the matrix) was analyzed as a “nonchanger.” For most purposes of studying talent flow, these definitions seem adequate. To the individual student, of course, change may be perceived quite differently. Furthermore, by our definition, the changer category is overinclusive; that is, it includes people flowing from a preparatory field to a graduate specialty, such as biology majors intending to go to medical school. Thus, the number of people included as changers in our analysis is an overestimate of the number of people who actually decided to change into a different field.
The analyses in this section will compare the characteristics of the “on-diagonal, non- changers” to the characteristics of the “off-diagonal, changers.” We will examine each of the 10 broad categories of undergraduate majors in turn. Trend tables for males and females combined and for males separately and females separately are in Tables 2.1 to 2.10, (for each graduate major), in Tables 3.1 to 3.10 (for each undergraduate major), and in Tables 4.1 to 4.10 (for those whose undergraduate and graduate majors were the same).
Undergraduate arts and humanities majors (Tables 3.1 and 4.1). About a third of undergraduate arts and humanities majors choose a different field for their graduate work. This percentage held fairly constant from 1978 to 1987. The percentage of undergraduate arts and humanities majors who were female also held fairly constant, at about 58%. It may be surprising, however, that when male undergraduate humanities majors are compared to female majors, it is the females who showed a greater tendency to change fields. Across the studied years, about 73% of the males who majored in humanities intended to continue in this field, as opposed to only 56% to 60% of the females. GRE scores did not seem to be a factor: nonchanger scores were about the same as those for humanities majors as a group.
The percentage of undergraduate arts and humanities majors who were over 30 at the time they took the GRE was high and steadily increased across the study period (17% in 1978 to 31% in 1987). Among those who intended to stay in the humanities, the percentage was somewhat lower (10% in 1978,22% in 1987). Therefore some of the older people tended to be changers. Many of these people gravitated toward majors in education.
The percentage of humanities majors pursuing a doctorate increased slightly over the study period (from 36% in 1978 to 42% in 1987). It is not surprising that those humanities majors who remained in the humanities were even more likely to be seeking doctorates (40% were in 1978 and 47% in 1987).
Undergraduate physical science and mathematics majors (Tables 3.2 and 4.2). Undergraduate physical science and math majors tended to choose the same field for graduate school. Over the lo-year period studied, about three-quarters of them were nonchangers. These examinees scored high on all three parts of the GFE, with quantitative scores around 650, verbal scores around 530 and analytical scores around 600.
Physical science majors tend to be young when taking the GRE, although there is a trend toward a slightly higher percentage of older physical science major examinees. In 1978, less than 8% were over 30 but by 1987 the percentage over 30 had doubled. The percentage over 30 among those who remained in the physical science field from undergraduate to graduate school
38

was slightly lower (4% in 1978 and 12% in 1987). Therefore, some of the physical science majors who changed fields must also have been older people. The few undergraduates who left physical sciences or mathematics tended to go into engineering or education.
The transition from physical science to education might be worthy of exploration in some detail because these people are likely to become the science and mathematics teachers who are most knowledgeable in their discipline. The talent-flow data base shows that in 1987, 886 undergraduate physical science majors intended a graduate major in education. The mean GRE scores for these changers (verbal = 509, quantitative = 639, analytical = 581) were slightly lower than those for undergraduate physical science majors as a group (verbal = 529, quantitative = 649, analytical = 609), but they were high enough for admission to many graduate science programs and certainly higher than those of the average graduate education major (verbal = 460, quantitative = 462, analytical = 488). It cannot be true, therefore, that all of these examinees were moving from physical science to education because they were of lower ability than the majority of physical science majors (at least in terms of GRE scores). An examination of GPA in major may shed more light on their rationale.
In 1987, the 886 undergraduate physical science majors had a mean GPA in major of only 2.98, whereas the 11,894 nonchangers had a mean GPA in major of 3.24. The physical science to education changers also tended to be much older (mean age of 31 in the 1987 cohort) than the nonchangers (whose mean age was only 24). The physical science to education changers had other characteristics (58% were female, 10% were Black, 20% had fathers with graduate or professional degrees) that differentiated them from the physical science nonchangers (29% female, 4% Black, 30% with fathers with graduate or professional degrees). Therefore, the fact that these changers found their niche in teaching as opposed to physical science may have more to do with their sex, age, ethnic@ and family background than it does with their ability as measured by the GRE.
This analysis is an informal one. Future studies using the talent-flow data base could employ more rigorous statistics to estimate the contribution of each of these variables to the prediction of whether or not a physical science major (or other major) will change fields.
Undergmciuate engineering majors (Tables 3.3 and 4.3). Engineering students tended to be among the youngest (mean age 24) at the time they took the GRE. Undergraduate engineering majors also tended to be among the most faithful to their field when choosing a graduate major: about 80% of them remained in engineering. This was true of both males and females. Among the relatively few who &cJ change fields, the majority opted for physical science or math. Similarly, a physical science/math undergraduate degree could also be a ticket into graduate engineering; very few graduate engineering majors came from other fields.
The percentage of females in both undergraduate and graduate engineering programs remained small (about 17% in 1987, increasing from about 11% in 1978). Female engineering majors still scored somewhat lower, on the average, than their male counterparts on the General Test quantitative section, but their average analytical and verbal scores were consistently higher than the average scores of males.
39

Engineering, both graduate and undergraduate, had the highest representation of Asian Americans of any field, and this representation increased slightly throughout the 1980s~~from about 6% to about 9%. (These data do not take into account the large number of non-U.S. citizens in engineering). The number of Black test takers planning to study engineering at the graduate level, while small (482 in 1987), more than doubled between 1978 and 1987.
Undergraduate biological science majors (Tables 3.4 and 4.4). Biological sciences is a field that is much less inbred than engineering; in fact, about half of graduate biological sciences majors come from other broad fields. “Pure” biological sciences as a graduate major was much less popular than it is as an undergraduate area. In 1987, there were 12,635 undergraduate majors in a biological sciences field but only 7,852 people intending to major in one of those fields in graduate school. Biology, in particular, was a feeder to many programs at the graduate level, including the other “pure” fields of botany, zoology, microbiology, and genetics. In addition, it fed the applied biological sciences and health sciences, many of which were not available on the undergraduate level. In general, biological sciences was a shrinking field during the 198Os, both in undergraduate and in graduate schools.
What were the characteristics of people who remained in “pure” biological sciences in contrast to those who moved into a service-oriented field? Among the nonchangers, about half were female. The female nonchangers tended to be slightly less likely to be pursuing a doctorate (57% indicated they would in 1987) than were the male nonchangers (about 65% of whom intended to pursue a doctorate). In other important respects (GRE scores, age and ethnic composition) the female nonchangers in this field were much like the males.
The undergraduate biological sciences majors who moved to other fields tended to go to health science and services, education, business and public administration, and applied biological/environmental science, in that order. We can work up a profile of the typical person who moved from biological sciences to health sciences and services in 1987. Sixty-four percent were female. Their mean GRE scores were: verbal, 568; quantitative, 570; and analytical, 570~- not much lower than the scores of verbal, 571; quantitative, 578; and analytical, 577~-for the Biological science majors who remained in biological sciences. They were still quite young (average age of 24), the same as for nonchangers at the time they took the GRE. Their mean GPA of 3.10 in their major compared quite favorably to the 3.12 GPA in major of the average nonchanger.
They were no more likely than nonchangers to be Black, Hispanic, or Asian American (each ethnic group constituted about 4% of each population). They may have been slightly less likely to have a father with a graduate degree (24% did) or a mother with a graduate degree (12% did) than was the average nonchanger (31% of whom had fathers, and 15% mothers, with graduate degrees). There are undoubtedly other compelling reasons (social concerns, family obligations, altruism) which lead people away from a career in “pure” biological science and into a service-oriented field, but from our limited data, the fact of being female seems to be most strongly associated with that decision.
Undeqywh.te applied biological/environmental science majors (Tables 3.5 and 4.5). This was a relatively small field for both graduate and undergraduate students, attracting about 3,000
40

students in each group in each year. It includes such fields as audiology, entomology, mining, forestry, and environmental science. The percentage of females in both the undergraduate and graduate programs increased slightly but steadily over the study period, and in 1987 about 37% of undergraduates in this field were female.
About 57% of the undergraduate majors taking the GRE intended to continue in an applied biological or environmental science major. About 30% of those continuing intended to earn a doctorate, whereas over 40% of those changing to other fields are aiming for a doctorate. The changers tended to gravitate toward health sciences or biological sciences.
There was a low representation of minority group members in the cohorts of both undergraduate and graduate students in this field. The percentage of people over 30 in the graduate field grew substantially, from 6% in 1978 to 17% in 1987, but it was still well below the average for all GRE takers (28%). Mean GRE scores for examinees in this field were somewhat higher than average on quantitative and about average on verbal and analytical.
Un&rgraduate social science majors (TabZes 3.6 and 4.6). About one-quarter of undergraduates who took the GRE had majored in a social science field. Approximately 19% of graduate students intended to major in one of these fields. Therefore, there were a substantial number of changers among undergraduate social science majors. In fact, about 40% of undergraduate social science majors changed fields. The fields they gravitated to were education, business, and applied social science, in that order. In 1987, education attracted 4,832 of the 35,814 undergraduate social science majors; 22,310 remained in a social science field.
These two groups of people (nonchangers, and social science-to-education changers) were different in several respects and deserve a detailed examination here. The GRE scores of those who moved into education were low (verbal = 489, quantitative = 472, analytical = 501) compared to those of nonchangers (verbal = 521, quantitative = 517, analytical = 545). With an average GPA in major of 3.09, the social science-to-education changers were once again lower than the nonchangers, whose average GPA in major was 3.32. Changers to education also tended to be older, with an average age of 30, while nonchangers were on average about 25 at the time they took the GRE. Finally, the changers to education were about 67% female but the nonchangers were only about 56% female. It appears that women with relatively low quantitative skills were abandoning careers in a social science field for a less quantitatively demanding career in education. This trend parallels that of the pure biological science majors who migrated to a health services field.
Uhde~mduate applied social sciences mujors (Tables 3.7 and 4.7). Applied social science fields include social work, library science, journalism, and communications. About 70% of undergraduates, and about 74% of graduate students, in this field were female. Black and Hispanic examinees were well represented among the undergraduate majors and particularly among the nonchangers (those who intended to continue in this field). Very few of the examinees who intended to do graduate work (about 15%) in this field were going for a Ph.D. Scores tended to be low; means were well below 500 on each part of the General Test.
41

About 60% of those who intended to major in this field also did their undergraduate work in the same field. Those who did their undergraduate work in a different field tended to come from social sciences or from arts and humanities. People who migrated from arts and humanities into this field tended to have much higher scores on all three parts of the GRE than did those who came from either the applied social science or social science field.
UndergFaduate he&Jr sciences majors (Tables 3.8 and 4.8). Health sciences at the undergraduate level was undoubtedly the most female-dominated of all fields; about 89% of undergraduate majors were females. Average GRE scores hovered just below 500, and doctoral aspirations were low--only about 25% of undergraduate health sciences majors aspired to a doctorate. There was a very high percentage of older students. In fact, in 1987,45% of undergraduate health sciences majors were over 30. This represents a steady increase from 22% in 1978.
About 74% of those who intended to major in a health sciences field in graduate school came from one of these fields as undergraduates. Most of the others came from biological sciences, as discussed above.
About 80% of graduate students in these health sciences and services were female, and the relatively few men who chose to enter these fields differed substantially from the women on several dimensions. The first dimension was ability, in particular, math ability. Male graduate students who intended to major in this broad area had GRE quantitative scores of about 570, whereas the mean score for females was only 495. About 54% of the males intended to pursue a doctorate in this area, but only 27% of the females did. The males also tended to be younger, with only 19% being over 30 years old, as compared to 35% of the females. In fact, the males in this field seemed so different from the females that it is important to look at the specific fields within health sciences and services to see if particular fields attracted men and women of different abilities, or if the gender ratios in each field were very different.
A look at the detailed matrices (which show the transition of majors for each individual major field) reveals, not surprisingly, that more males were intending to major in medicine, veterinary medicine, and dentistry; the majority of females were drawn to nursing and nutrition. Therefore, the health sciences area, at least at the graduate level, is such an eclectic one that it is hard to make generalizations about those who intend to specialize in one of its fields.
In future studies of talent flow, researchers may wish to divide health sciences fields according to degree aspiration so that medicine and veterinary medicine, which attract high- scoring individuals, will be separate from nursing, nutrition, and other fields that tend to attract lower scoring individuals aiming for a master’s degree. The talent flow data base, as it now exists, contains matrices for examinees planning to earn a doctorate as well as matrices for the whole population of U.S. citizens taking the General Test.
Any researcher studying talent flow within the health sciences will have to exercise caution in the study design so as not to confound gender, degree aspirations, and field of study. Simply because they are correlated, they are not interchangeable as categories for analysis, and there is a strong tendency to infer causation in the relationships observed between these categories and the mean test scores associated with these categories.
42

It is also important to remember that medical school applicants often do not take the GRE, so those in the data base may not be representative of all medical school applicants. Most likely, those who take the GRE are also considering other graduate or professional school options, such as physiology, biochemistry, or veterinary medicine. Those programs generally require GRE scores.
Undergraduate education majors (T&les 3.9 and 4.9). Education is among the most popular majors. About 15% of the undergraduates who go on to take the GRE have majored in education, and about 20% of GRE examinees choose education as their graduate school field. These figures were fairly constant throughout the 1980s. Education is also a field with relatively few changers: in 1987, 82% of undergraduate education majors continued in that field.
Undergraduate education majors in the yars studied were predominantly female (79%) and had a higher representation of minorities than did most other fields, although the percentage of Black education majors dropped slightly, from 9% in 1980 to only 6% in 1987. Representation of Hispanics and Asian Americans remained fairly constant. One outstanding feature of undergraduate education majors is a tendency to be older at the time of GRE, and this tendency seems to have increased throughout the 1980s. In 1978 only 25% of the education majors were over 30, but by 1987 this percentage had increased to 44%. GRE scores for education majors increased very slightly over the period but remained relatively low, at 443 verbal, 450 quantitative, and 478 analytical in 1987.
Males who intended to do graduate study in education were different from females in this field in two important respects. First, they were more likely to be pursuing a doctorate (36% of the males in 1987 claimed to be doing so, as opposed to only 20% of the females). Second, an even higher percentage of males (53%) than females (43%) was older than 30 when they took the GRE.
The vast majority (82%) of undergraduate education majors taking the GRE intended to continue their studies in education. The fields attracting the remainder of the undergraduate education majors included social sciences, applied social sciences, arts and humanities, and health sciences, in that order. Undergraduate education majors who moved into other fields tended to have higher GRE scores than those who remained in education.
The graduate education majors who did not come from an undergraduate background in education were from a variety of fields. The GRE scores for these examinees tended to be quite high for graduate education majors but somewhat lower than those of other examinees in their respective undergraduate fields.
Undergraduate business and public administration majors (Tables 3.10 and 4.10). Business is a field that had notable fluctuations during the 1980s. The GRE-taking population may not be representative of either undergraduate business majors or of those intending to pursue graduate studies in business, because many of the more serious business students (those interested in M.B& programs, for example) would probably be taking the GMAT. Nevertheless, like students considering medical school, some students consider business as one alternative among many possible fields of graduate study, so they may take the GRE to apply in those other fields.
43

In spite of the fact that the present study group may be a nonrepresentative sample of undergraduate business majors, some trends may be observed. For example, the number of undergraduate business majors peaked in 1980 at 6,684, declined to 4,399 in 1984, and then rose to 5,832 in 1987. Numbers of GRE examinees intending graduate study in business followed a similar trend, with a high of 15,404 students in 1980, a low of 8,118 in 1984, and a more moderate number of 9,681 in 1987.
It is clear from the above numbers that there were more GRE examinees going into business as a graduate field than there were coming out of a business undergraduate major. In fact, in 1987 a graduate business major attracted more people from the social sciences than from undergraduate business. Undergraduate social science majors interested in business had GRE verbal, quantitative and analytical score means that were about 50 points higher than those of the undergraduate business majors.
Business as a major for both undergraduate and graduate students is a field that became increasingly attractive to women throughout the 1980s. About 49% of undergraduate business majors were female in 1987, in contrast to only 33% in 1980. Among graduate business majors the increase was equally marked: from 41% female in 1980 to 57% female in 1987. Business is also a field that is very attractive to Black examinees, particularly Black female examinees. For example, in 1987, 14% of the females with an undergraduate major in business were Black, 15% of the females with an intended graduate major in business were Black, and 20% of females with both undergraduate and graduate major in business were Black. These figures remained fairly constant throughout the 1980s.
Variables Associated with the Decision to Change Fields
To explore the relationship of background variables and scores to the decision to change major fields, we crosstabulated a changer/nonchanger indicator with background variables that had been dichotomized using the data from 1987.
A person was defined as a changer if he or she moved from an undergraduate major in one of the 10 broad major groups to another broad major group. Therefore a person who had an undergraduate major in physics and who chose to do graduate work in chemistry would not be categorized as a changer, but a person who moved from physics to electrical engineering would.2
Cross-tabulations were performed on GRE examinees from 1987 within the 10 broad undergraduate major categories. Seven demographic or background variables were recoded to two categories each. The variables and their recoded categories are as follows:
2Ue remind the reader that changes within a broad field of study, with the exception of the biological
sciences, is rare. This is probably the case because the curriculun that prepares a chemistry major is very different, for example, from the curriculum that prepares a physics major. A chemistry major might, on the other hand, switch to economics because he or she may have taken necessary social science courses whi le majoring in chemistry, and the mathematics courses taken for a chemistry degree would be equally suitable preparation for economics. Some fields, of course, are exceptions. Computer science, for example, draws people from all academic backgrounds, including other physical sciences, especially mathematics.
44

Variable Gender Ethnicity Year of B.A./B.S. Degree objective UGPA in major Father's education Hours community serv.
Cateqorv 1 Male White Still in college Masters or lower B or lower Not college grad. None
Cateqorv 2 Female Non-White Already out of college Doctorate or postdoc. A- or A GPA College grad. or above One or more per week
Finally, t-tests were performed on the GRE verbal, quantitative and analytical score means of examinees in the changer and nonchanger groups in each of the 10 broad major categories.
Relationship of gender to the &&on to change or not to chunge fields. Table 5.1 shows the relationship between gender and the decision to change, or not to change, fields. For nine of the major fields, the gender composition of the changer group was found to be significantly different from the composition of the nonchanger group. In arts and humanities, physical sciences, engineering, biological sciences, applied biological sciences and social sciences, there were higher percentages of females in the changer than in the nonchanger groups. The reverse was true in applied social sciences, health sciences, education, and business.
There is no doubt that course work in the six former fields is generally more academically rigorous than in the four latter fields. The four applied areas, on the other hand, are more directly service oriented and/or require greater interpersonal skills. It seems that women in the more rigorous fields tend to move to less rigorous, more “people-related” fields, and those in the applied fields tend to stay in those areas.
Tables 5.1 to 5.8 provide an easy way of comparing the number of changers to nonchangers in each field. In general, nonchangers exceeded changers by a ratio of two-to-one (arts and humanities, physical science and math, engineering, social sciences, health sciences, and especially education). In biological sciences, however, the number of changers was almost exactly equal to the number of nonchangers. In applied biological sciences and in applied social sciences, the number of nonchangers was only slightly greater than the number of changers. And in business and public administration, more undergraduate majors were moving out of the field than were staying in.
Relationship with ethnicity. It should be remembered that the data used in all analyses include only U.S. citizens. Therefore, the 11.4% of the changer group for arts and humanities who were non-White were U.S. minority examinees. Several results of the cross-tabulation of ethnic&y by the changer/nonchanger indicator were nonsignificant. In other words, the ethnic composition of the changer and nonchanger groups within these fields was not significantly different. In general the percentage of minorities in these groups was below 20%. The notable exception is in the group of business and public admininistration undergraduates who remained in that field for graduate study. Twenty-five percent of these examinees were minority group members; as mentioned above, a large proportion were Black females.
45

RelatiunshzYp with year of bachelor’s degree. Because this analysis was conducted on the 1987 GRE file, examinees were likely still to be in college if they had graduation years of 1987 or later; anyone graduating in 1986 or earlier was categorized as “already out”. Because more than half of GRE examinees in general have completed undergraduate school by the time they take the General Test, it is not surprising that high percentages of both the changers and nonchangers categories in each major field were already out of college. In each field except education, the percentage of the changer group who were already out significantly exceeded the percentage of the nonchanger group who had already completed college.
It is not surprising that examinees who have been out of college for one or more years would be more likely to think of changing fields than would examinees who are still in college at the time they take the GRE. Work experiences and other postcollege activities open new interests and may lead to a desire to pursue a new career path. Large proportions of examinees who change out of arts and humanities, health sciences, and business have already graduated from college.
Relation&p with degree objective. Table 5.4 shows the percentages of changers and nonchangers in each undergraduate major who aspired to a doctoral degree. In the four disciplines that are more academically oriented (arts and humanities, physical sciences and math, biological sciences, social sciences), the percentage of doctoral aspirants in the nonchangers group exceeded that in the changers group. Therefore, those who were inclined to go the furthest in an academic field tended to stay in the field in which they did their undergraduate work. Conversely, the six remaining fields (which may be characterized as more “applied”) had higher percentages of doctoral aspirants choosing to change fields. The highest percentage of doctoral aspirants was in the group of social science students who were remaining in a social science field for graduate school.
Relationship with undergraduate GPA in major. It seems reasonable that examinees who have performed exceptionally well in course work in their major would consider remaining in that major for graduate study and those with less impressive performance might consider changing fields. This hypothesis seems to be born out by Table 5.5, which shows the percentages of changers and nonchangers in each field who achieved A or A- averages in their majors. In all fields except education and business, the changers group had a significantly higher percentage of A or A- students than did the nonchangers group. This distinction is particularly marked in Arts and humanities, where 63.7% of nonchangers had an A or A- average but only 47.4% of the changers achieved such an average.
The grade distinctions between changers and nonchangers in physical sciences and math and in social sciences were also considerable. In rigorous fields such as math and physical sciences we might expect students who have difficulty mastering the material in their field to change into a less demanding field.
Relationship with father’s education. We may hypothesize that students whose parents are more highly educated would concentrate in academically oriented fields and would tend to continue in
46

these fields through graduate school. We dichotomized variables for both father’s and mother’s education levels to categories of ‘less than four years of college’ and “bachelor’s degree or above”. In general, mothers were less highly educated than fathers. The level of mother’s education seemed to have little relationship to undergraduate field choice or the decision to remain in the field for graduate school. Father’s education seemed to be related to change of field in several areas, however. There were somewhat higher percentages of examinees with highly educated fathers in arts and humanities, physical sciences and math, engineering, and biological sciences. In arts and humanities and in physical sciences and math, these percentages were significantly higher for nonchangers than for changers. The reverse was true in the more “applied” fields of health sciences, education, and business: in these fields the changers tended to have more highly educated fathers.
Relationship with commun&y service. A variable for number of hours of community service was dichotomized into two categories: “none” and “one or more hours per week”. As might be expected, virtually all (at least 70%) examinees in applied social sciences and education performed some community service during college but fewer than half of engineering students did so.
Examinees changing out of academic fields such as arts and humanities, physical science and math, biological sciences and social sciences were more likely to perform community service than were the examinees remaining in these fields. Conversely, the examinees who remained in such fields as applied social science, health sciences, and education (which include many of the “helping professions”) were more likely to perform community service than were the examinees who left these fields.
ReWonship with GRE scores. We have conjectured throughout this study that examinees tend to find their niche when applying to graduate school. This involves applying to programs where, first of all’ one is likely to be accepted, and second of all, one is likely to be comfortable. Comfort involves finding colleagues with similar, or at least complementary, backgrounds, interests, and abilities. We have explored the relationship between several background variables and the decision to remain in, or change from, one’s undergraduate major. Ability level may, however, have an even stronger bearing on this decision. Because GRE scores offer three measurements of ability to pursue graduate study, Table 5.8 shows some complex relationships between scores and the decision to change majors.
In summarizing Table 5.8 we can say that examinees who remain in academic disciplines (such as arts and humanities and physical sciences and math) tend to have higher scores than do undergraduate majors in these fields who decide to pursue other graduate work. Conversely, examinees who move out of such fields as education, business and applied social sciences tend to be higher scoring than the examinees who remain in these fields.
Looking further at Table 5.8, we can see that examinees leaving arts and humanities are not, in general, those with lower verbal scores but those with lower quantitative and analytical scores. In engineering, those with the highest quantitative and analytical scores tend to stay and those with somewhat higher verbal scores may seek other fields. In social sciences, the
47

nonchangers are significantly higher than the changers on all three parts of the GRE.
None of these conclusions are entirely surprising, but they do provide a kind of construct validity for the GRE as an indicator of the general academic ability required to undertake graduate study in various areas. Students who cannot succeed in a rigorous field seem to know that fact before taking the GRE, and they opt for fields that are less rigorous. Students who are outperforming their colleagues in less demanding fields know that they are capable of more challenge, so they switch to more rigorous fields. The scores of both kinds of students subsequently confirm their self-estimates of their abilities.
EXAMPLE 3: A LOOK AT GRADUATE FIELD CHOICE FROM ANOTHER ANGLE
We know from GRE data and other sources that students entering a field such as chemical engineering have higher quantitative skills and probably lower verbal skills than do students entering a field such as comparative literature. This is not a very profound observation, and, indeed, we would hope that studies of talent flow would move beyond the obvious. But in this same light, it would be informative to know if students who have already completed an undergraduate major in one subject select a graduate field in accordance with their relative verbal and quantitative skills. We explored this question in a graphic mode, plotting mean GRE verbal scores on one axis and mean quantitative scores on the other.3
Within the graph are points for graduate fields having the ordered pair of verbal and quantitative means for the group under consideration. More simply, consider the following chart.
%e found that plots of verbal against analytical, or quantitative against analytical, were not very informative. The analytical score behaved like an 11average8m of the other two and did not give the striking separation of points that we observe with verbal versus quantitative.
48

GRE Verbal vs Quant. Score Means in 1987 for Physical Science and Math Majors
Planning Graduate Work in Selected Areas
Mean GRE-Q
700
650
600
PHYSICAL SCIENCESIMATH
Engineerlng A A
Education A
Health Sci/Setvlcer A
Burinearl A
Public Admin.
Al tr/ Humanltler
A
Biological Science8
A A Social Scie4ncea
U.S. cit. only.
500 550
Mean GRE-V
N > 250 in each area.
600
This chart was generated for all examinees having undergraduate majors in physical sciences or mathematics. Those planning to do their graduate work in business or a related _ _ -- area of administration tended to score lower on both the verbal and quantitative test sections than did those planning to continue in other fields. Those planning to switch to arts and humanities scored quite high on both sections; those switching to engineering scored high in quantitative but relatively Iow in verbal. Their verbal scores were approximately the same as the scores of physical science major planning to study education, health sciences and services, and business.
49

It is especially interesting to note that people with extremely high verbal skills left the physical sciences for the humanities even though their quantitative skills were as high as or higher than those of their colleagues who continued in the physical sciences.
This kind of analysis suggests that people change fields not just because of economic conditions or because they cannot make it at the graduate level in the field in which they have done their undergraduate work. For a highly verbal as well as highly quantitative science student to leave the sciences for the humanities suggests an important lack of verbal challenge for that student in the physical sciences.
The following graph shows the intended graduate fields of study for examinees earning a bachelor’s degree in the social sciences.
GRE Verbal vs Chant. Score Means in 1987 for Majors in Social Sciences
Planning Graduate Work in Selected Areas
Mean GRE-Q 650
600
550
500
450
400
Phyricrl Scl8nc88 n Math8m8ticr
Artrl
H88lth ScilS8rvlc88 A A tiUlll8niti88
A SOCIAL SCIENCES
EdUC8tiOn A
A Appti8d sOCi81 SCi8llC88
I I I I
400 450 500 550
Mean GRE-V
U.S. cit. only. N > 300 in each area.
600 650
50

What stands out most remarkably is that a sizable number of social science majors planned to switch to the physical sciences or mathematics, and that those who were switching had verbal and quantitative scores considerably higher than did those remaining in the social sciences. Examinees choosing to move into the applied social sciences had quantitative scores that were not up to the average for students continuing in the social sciences. The abilities of those moving into education and business fell short of both verbal and quantitative skills.
Examinees who majored in education also show a very informative pattern.
GRE Verbal vs Quant. Score Means in 1987 for Majors in Education
Planning Graduate Work in Selected Areas
Mean GRE-Cl 650
600 n Phyeicrl
$ciencer/M8th
550
500 He8lth Science8/ A
Servlcer A Art81
A Hum8nitie8
SOCi81 Science8
450 EDUCATION A A ;u,$:c"" Admlnlrtrrtion
400 I
350 400
U.S. citizen8 only.
I I
450 500
Mean ORE-V
I
550 600
51

Those who planned to remain in education for their graduate work earned the lowest combination of verbal and quantitative score averages. Education majors with the highest scores on both sections switched to the physical sciences or mathematics. Much higher verbal and slightly higher quantitative students moved into the arts and humanities or social sciences.
Having seen that clear patterns exist to explain the movement from one broad field of study to another, we selected several specific major fields to see if students choose their area of specialization in accordance with relative verbal and quantitative skills.
This first chart is for the 3,356 examinees who reported an undergraduate major in chemistry in W37.
GRE Verbal vs Quant. Score Means in 1987 for Chemistry Majors Planning Graduate
Study in Frequently Chosen Fields
Mean GRE-Q
700
650
Chem Ical Englnoarlng
(661 Computer
A Science 059)
A
CHEMISTRY A blochemlatry (260)
(L.020) A
A Education (61)
EnvIronmental Scloncor (66) A Medicine (69)
600 A A
Phrrm8cology (66)
550 450 500 550
Mean GRE-V
U.S. cit. only. Number In panntheaea.
600
52

Of this group of chemistry majors, 56 planned to switch to chemical engineering for their graduate work. The average verbal score of those 56 students was lower than the average verbal score of students who intended to continue in chemistry, and their quantitative scores were higher. This profile would fit well with the images of people in both of these professions. Notice that 53 chemistry majors with higher average verbal and quantitative scores than their colleagues planned to do graduate work in computer science. Those switching to education or medicine had lower quantitative abilities than those of their colleagues, and 66 of the chemistry majors with lower verbal and quantitative skills than those of their colleagues switched to pharmacology.
Many of the chemistry majors who changed fields switched to a quite different area, probably because chemistry does not lead to a great many graduate specializations. Biology, on the other hand, does branch into many specialties at the graduate level. The next graph shows that the specialties seem to be associated with relative amounts of verbal and quantitative skill.
53

GRE Verbal vs Quant. Score Means in 1987 for Biology Majors Planning Graduate
Study in Frequently Chosen Fields
Mean GRE-Q
600
550
500
Oeneticr (3681
Blochemlatry (159) l?
Vet. Med. (sol) A
A Environmental Science6 (456)
P hyeiology (246)
A A Medicine (334)
Phyrical Therapy
(430) A BIOLOQY (1,262)
A Pub. Health (2f38)A A Education (964)
A A Mlcroblology
Harp/Health (379)
“‘(:‘,‘g”p’
450 500
Mean ORE-V
550
U.S. cit. only. Number In parenthwes.
The high verbal, high quantitative biology majors seemed to aspire to molecular biology, a field that is certainly in the spotlight of science today. The biology majors with the lowest average verbal and quantitative scores were planning to enter hospital and health services. There are essentially no fields with sizable numbers attracting people with high verbal/low quantitative, or vice versa. The all-around bright students head for molecular biology, environmental sciences, genetics, biochemistry, and veterinary medicine. Those with relatively low academic skills, compared with other biology majors, head for hospital and health services, microbiology, public health, physical therapy, and education.
54

COMMENTONTHEEXAMPLES
The limited analyses we have done with the talent flow data base have permitted us to make some generalizations about GRE examinees over a lo-year period and about their choices to remain in, or move out of, a major field. We have been able, through use of the matrix data, to describe the background and score characteristics of groups of individuals who make certain transitions in major (for example, from physical sciences to education). We have been able, through cross-tabulations of the raw data, with associated significance tests, to determine which background and score variables have a statistically significant relationship to the choice to change, or not to change, majors for groups of people in 10 broad majors.
We have been able to draw comparisons between males and females in the same fields, and we have been able to note the differences between academically oriented majors (such as arts and humanities, physical science and math, biological sciences, social sciences and, to a lesser extent, engineering) and the service-oriented majors (applied biological sciences, applied social sciences, health sciences, education, and business) in terms of the examinees they attract and retain.
Many of the conclusions we have drawn conform to prior experience and expectation. We have tried to examine some of the demographic characteristics (gender, ethnicity), background variables (year of bachelor’s degree, degree objective, father’s education, hours of community service) and abilities (undergraduate GPA in major and GRE scores) that may have a bearing on decisions about graduate field of study. We have not, of course, been able to explain any of the idiosyncratic reasons that lead people to switch from one field to another.
In a concurrent GRE study, we are surveying a sample of examinees earning bachelor’s degrees in math, natural sciences, and engineering to determine some of the factors that may lead them to change fields or to remain in the same field for graduate school. Information from that survey will enhance our understanding of patterns we are observing in the talent flow data base.
SUGGESTIONS FOR FURTHER RESEARCH
Within the limits of this initial project, it has been impossible to analyze all major fields and combinations of major fields or to explore the data in the light of broader economic or social trends that would be likely to affect the directions of talent flow.
Throughout this report we have alluded to a number of ideas for further research. In this section we will briefly outline some of these suggestions. We welcome further ideas and encourage other researchers to explore these files themselves.
55

RESEARCH ON INDIWDUAL FIELDS OF STUDY
The current project was unable to deal with every major field. Persons in specific occupations will be interested in the flow of talent into and out of their fields. They may also be interested in the undergraduate majors that feed their graduate field and how those majors may be changing over time. This question would be of particular interest in the newer fields, such as computer science. Historically, most computer scientists studied either mathematics or electrical engineering; those interested in business programming applications often majored in business. Once computer science acquired its own identity, some students began majoring in computer science at the undergraduate-level. To what extent did a shift to computer science as an undergraduate major occur?
As an example of the kind of analysis that would be informative, we generated a graph showing trends from 1978 to 1987 in the proportional undergraduate makeup of the body of examinees planning graduate study in computer science.
The following chart shows the proportional distribution of undergraduate major fields among examinees planning graduate work in computer science.
Undergraduate Majors of Prospective Graduate Students in Computer Science
Percent 100%
75%
25%
0% 1978 1980 1981 1982 1983 1984 1985 1986 1987
Year
m CompSci m Math f!% ElecEng m Business m AlI Other
U.S. citizens only
Of those examinees planning graduate work in computer science, the proportion who did their undergraduate studies in computer science essentially doubled over the lo-year period, whereas the proportion with degrees in mathematics dropped sharply from 20% to just 8%.
56

electrical engineering and business continued to supply 10% to 15% of the students headed for computer science.
A study of this sort could proceed to show how test scores and other student characteristics were associated with the change in student composition and undergraduate preparation.
MODELS TO EXPLAIN TRENDS
The present study, to some extent, has been conducted in a vacuum, with very little attention given to social or economic conditions that might account for patterns or trends. We intentionally gave little interpretation to our observations because, in the absense of a well- constructed and comprehensive model, interpretations are mere speculation.
We might, for example, have examined parallels between numbers of examinees planning to study engineering and starting salaries in the engineering professions. If we had found such a parallel, we might have been inclined to assign a causal connection between them. What other reason would there be to look for that particular parallel? In actuality, growth in engineering is a complex issue deserving a model that includes many social and economic variables. Furthermore, such a study deserves the expertise of economists, engineers, and other specialists who can point to the many sources of influence on students’ choices of engineering as a profession.
Any attempt to study the flow of talent into or out of a particular field will require specialized professional expertise and, in addition, a careful analysis of material released by the news media. An earlier study of students in the humanities (Grandy & Courtney, 1985) found numerous media reports on the rising cost of education, unemployability of humanities graduates, and declining quality of humanities majors. Some these reports distorted the facts and may have been written to create controversy. Their impact may even have been to drive students away from the humanities and subsequently to create a shortage.
Students’ decisions regarding a field of study can rest only on the information they are able to access. A considerable amount of that information is first processed by the media. It becomes increasingly important that we, as researchers, separate the facts from the distorted reports in order to weight their relative impacts on student decision making.
STUDIES OF PARTKJXAR SUBPOPULATIONS
The talent flow data base matrices generated on GRE General Test takers thus far are for all U.S. citizens, males, females, examinees planning to earn a doctorate, and examinees over age 30. Within these matrices there is minority information, statistics on parents’ education, and other data. These, we assumed, would be the most sought after kinds of information.
We could easily generate matrices, however, for special populations. A study could compare each of the Hispanic populations, for example, or it could trace patterns in test scores and major field interests of Native Americans.
57

None of the existing matrices contain information about foreign examinees. Special matrices can be constructed from the individual examinee data base to compare talent flow among U.S. citizens, resident aliens, and all other test takers.
Generally when we speak of subpopulations, we tend to think of female and minority groups. Equally interesting might be analyses based on parents’ education or other variables. We know that some major fields more than others still attract students from predominantly high (or low) socioeconomic levels. In the 1987 GRE data base, for example, 40% of the male examinees earning bachelor’s degrees in chemistry had fathers with a graduate or professional degree. Only 15% of the males with degrees in education had fathers with a graduate or professional degree. These statistics can, of course, be broken down by ethnic group to see if it is father’s education, more than ethnic@, that is related to major field choice.
Similarly, we can conduct studies of talent flow among older students (compared with younger ones) or among examinees who have been out of school for a while (compared with those who are currently enrolled). The latter study could have implications for talent flow among second-career populations.
These are only a few suggestions for further research on talent flow using the GRE data base. We hope that this study has served to introduce this data base and to provide direction to its research possibilities.
58
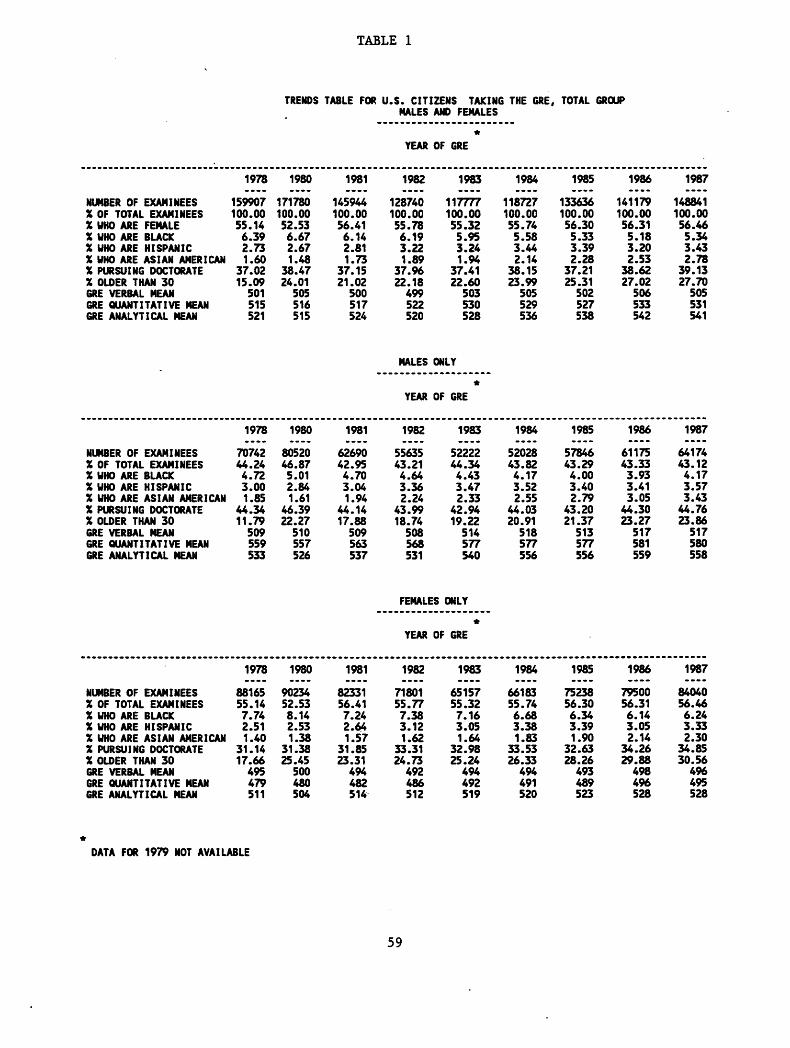
TABLE 1
TRENDS TABLE FOR U.S. CITIZENS TAKING THE GRE, TOTAL GROUP HALES AND FEMALES . _-___-__-___________----
*
YEAR OF GRE
1970 ____
NlHBER OF EXAMINEES 159907 X OF TOTAL EXAMINEES lDD.00 X UHO ARE FEMALE 55.14 X UHO ARE BLACK 6.39 X UHO ARE HISPANIC 2.n X UHO ARE ASIAN AMERICAN 1.60 X PURSUING DOCTORATE 37.02 X OLDER THAN 30 15.09 GRE VERBAL UEAN 501 GRE QUANfITAlIVE MEAN 515 GRE ANALYTICAL MEAN 521
1980 __e_
171780 100.00 52.53
6.67 2.67
4:: 24.01
505 516 515
wwwwwwwwwwwwwwwwwwwwwwwwwwwwwwwwwwww
1978 me-m
NlJHBER OF EXAMINEES 70742 X OF TOTAL EXAMINEES 44.24 % UHO ARE BLACK 4.72 X UHO ARE HISPANIC 3.00 % WI0 ARE ASIAN AMERICAN 1.05 % PURSUING DOCTORATE 44.34 X OLDER THAN 30 11.79 GRE VERBAL UEAN 509 GRE UJANTITATIVE WEAR 559 GRE ANALYTICAL UEAN 533
1981 --w_
145944 100.00 56.41
6.14 2.81
3::: 21.02
500 517 522 524 520
1982 _-am
128740 100.00 55.78
6.19 3.22 1.89
37.96 i2.18
499
1983 ----
117n7 100.00 55.32
UALES ONLY ___________~-~~~-_--
*
YEAR OF GRE
1984 ----
118727 100.00 55.74
5.58 3.44 2.14
38.15 23.99
505
zz
1985 ----
133636 100.00
56.30 5.33 3.39
3s 25:31
502 527 538
1906 ----
141179 100.00
56.31 5.18 3.20 2.53
38.62 27.02
zii 542
wwwwwwwwwwwwwwwwwwwwwwwwwww
1980 1981 1902
---- ---- ---- 80520 62690 55635 46.87 42.95 43.21
5.01 2.84 i.: kit 1.61 1194 2:24
46.39 44.14 43.99 22.27 17.88 18.74
510 509 508
557 563 526 537 z:
wwwwwwwwwwwwwwwwwwwww~
1983 1984 ---- ----
52222 52028 44.34 43.82
4.43 4.17 3.47 3.52
4:.2 2.55
19122 44.03 20.91
514 510
z zz
w-wwwww-w-
1985 ----
Pit 4:oo 3.40 2.79
43.20 21.37
513
z5;:
1987 ----
148041 100.00
56.46
Z:Z
3:.!! 27170
505 531 541
,wwwwwwwwwwwwwww
1986 1987
---- ---- 61175 64174 43.33 43.12
?Z 4.17
3:05 z 44.30 44176 23.27 23.86
517 517
581 559 z:
NUMBER OF EXAMNEES X OF TOTAL EXAMINEES X WI0 ARE BLACK X WI0 ARE HISPANIC X WI0 ARE ASIAN AMERICAN X PURSUING DOCTORATE X OLDER THAN 30 GRE VERBAL NEAN GRE GUANTITATIVE UEAN GRE ANALYTICAL MEAN
1978 ----
88165 55.14
7.74 2.51
3::: 17.66
495 479 511
1980 ----
90234 52.53 0.14 2.53
3:=ii 25145
500
z!
1901 ----
82331 56.41
7.24 2.64 1.57
31.85 23.31
4%
z
71801 65157 55.77 55.32
;:F 7.16 3.05 1.62
33.31 3::g 24.73 25.24
492
iYi z 519
1984 ----
66183 55.74
;:Z!
3i.g 26:33
494 491 520
1985 ----
7523a 56.30
:.z 1190
32.63 20.26
493
1986 _a_-
79500 56.31
6.14 3.05 2.14
34.26 29.88
tit! 528
1907 ----
84040 56.46
6.24 3.33 2.30
z.: i% 495 520
l
DATA FOR 1979 NOT AVAILABLE
59
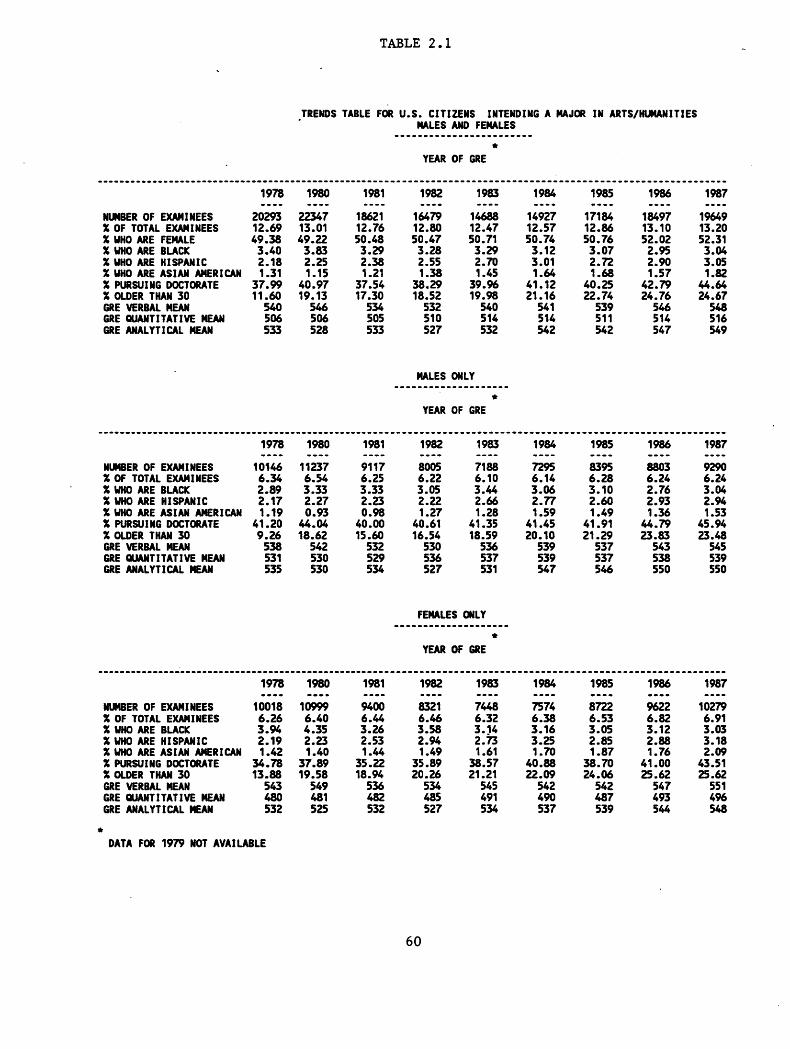
TABLE 2.1
TRENDS TABLE FOR U.S. CITIZENS INTENDING A MAJOR IN ARTS/HUMANITIES HALES AND FEMALES
-..._._--__..-.....--.-- *
YEAR OF GRE
1978 1980 ---- ----
20293 22347 12.69 13.01 49.38 49.22
3.40 3.83 2.18 2.25 1.31 1.15
37.99 40.97 11.60 19.13
540 546
Et 55:
1981 1982 ---- ----
18621 16479 12.76 12.80 50.48 50.47
3.29 3.28 2.38 2.55 1.21 1.38
1983 ----
:Ef 50.71
3.29 2.70 1.45
39.96 19.98
540 514 532
1984 ----
14927 12.57 50.74
3.12 3.01 1.64
41.12 21.16
541 514 542
1985 ----
17184 12.86 50.76
3.07 2.72
4s 22174
539 511 542
1986 ----
18497 13.10 52.02
2.95 2.90 1.57
42.79 24.76
z 547
1987 ----
19649 13.20 52.31
i::
4i.z 24167
5: 549
NUMBER OF EXAUINEES X OF TOTAL EXAMINEES X UHO ARE FEMALE X UHO ARE BLACK X WI0 ARE HISPANIC X UHO ARE ASIAN AUERICAN X PURSUING DOCTORATE X OLDER THAN 30 GRE VERBAL MEAN GRE WANTITATIVE MEAN GRE ANALYTICAL MEAN
37.54 17.30
534 505
z=z 332 510
533 527
MALES ONLY . . . . . . . . . .._........
*
YEAR OF GRE
________ 1978 ----
10146
t6.g 2117 1.19
41.20 9.26
________ 1980 ----
11237 6.54 3.33 2.27 0.93
44.04 18.62
542
__________ 1981 ----
9117 6.25 3.33 2.23 0.98
40.00
________________--____________)________
1982 1983 1984 1985 ---- ---- ---- ----
8005 7188 6.22 6.10 z2E
3106 t3E
3.05 3.44 3:to 2.22 2.66 2.77 2.60 1.27 1.28 1.59 1.49
40.61 41.35 41.45 41.91 16.54 18.59 20.10 21.29
530 536 539 537 536 537 539 537 527 531 547 546
________________ 1986 1987 ---- ----
FE 2:76
9290 6.24 3.04
2.93 2.94 1.36 1.53
x
J43
45 23'48 94
545 538 539 550 550
NLMBER OF EXAUINEES X OF TOTAL EXAMINEES X UHO ARE BLACK X WI0 ARE HISPANIC X UHO ARE ASIAN AMERICAN % PURSUING DOCTORATE % OLDER THAN 30 GRE VERBAL MEAN GRE QUANTITATIVE UEAN GRE ANALYTICAL MEAN
15.60 532
z
538 531 535
530 530
FEMALES ONLY .._.................
*
YEAR OF GRE
________ 1980 ---.
10999 6.40 4.35 2.23 1.40
37.89 19.58
549 481 525
.________________II_~~~~~~~~~~~~~~~~~~~~~~~~~~~~
1981 1982 1983 1984 1985
--II- ---- ---. ---- ---- 9400 8321 7448 7574 8722 x 36.z
2194
3.14 6.32 36.: 3.05 6.53
2.53 2.?3 3125 2.85 3i.z
18194
35.89 1.49 38.57 1.61 4x 30.70 1.87
20.26 21.21 22:09 24.06 536 534 545 542 542 482 485 491 490 487 532 527 534 537 539
._________ 1986 -w-w
9622
;.: 2188 1.76
41.00 25.62
547 493 544
w_____
1987 ----
10279 6.91
;:ii
45.: 25162
551 4% 548
________ 1978 ----
10018
36:E 2.19 1.42
Eli 543
532
NUUBER OF EXAMINEES X OF TOTAL EKAMINEES X UHD ARE BLACK X UHO ARE HISPANIC X UHO ARE ASIAN AMERICAN X PURSUING DOCTORATE X OLDER THAN 30 GRE VERBAL UEAN GRE GUANTITATIVE UEAN GRE ANALYTICAL MEAN
l
DATA FOR 1979 NOT AVAILABLE
60

TABLE 2.2
TRENDS TABLE FOR U.S. CITIZENS INTENDING A MAJOR IN PHYSICAL SCIENCES OR MATH
MALES AND FEMALES _-__________-___________
*
YEAR OF GRE
NUMBER OF EXAUINEES X OF TOTAL EKAMINEES X WI0 ARE FEMALE X WHO ARE BLACK X UHO ARE HISPANIC % UHO ARE ASIAN AMERICAN X PURSUING DOCTORATE X OLDER THAN 30 GRE GRE GRE
1978 w--m
12400
267-z 3107 2.15 2.39
47.10 6.03
1981 -w-w
12261 8.40
29.57 3.20 2.17
4t-z 10:11
1982 ____
12548
2i-E 3:35 2.23
4zi ilk
1983 _a_-
13549 11.50 29.32
3.47 2.67
4::: 12.42
VERBAL MEAN 531 536 533 528 532 WANTITATIVE MEAN 652 ANALYTICAL MEAN itz 583 z z
________________________________________------ 1978 1980 em__ ____
NUMBER OF EXAUINEES 9030 9024 X OF TOTAL EXAUINEES 5.65 5.25 % WHO ARE BLACK 2.46 2.36 X WHO ARE HISPANIC % WI0 ARE ASIAN AMERICAN ::!t
1.27 1.88
X PURSUING DOCTORATE 50.35 54.99 X OLDER THAN 30 5.94 12.28 GRE VERBAL MAN 532 538 GRE QUANTITATIVE UEAN 654 GRE ANALYTICAL MEAN 584
MALES ONLY ____________-_______
l
YEAR OF GRE
_____________________________ 1981 1982 1983 -w-w w___ mm__
8562 8605 9531 5.87 2.42 i-z
2114 28.4:
2.08 2:65 482-z
9:78
45.62 2.53 44.91 2.71
11.50 12.10 536 531 536
651 648 587 582 ?i
1984 a___
13256 11.17 30.13
3.39 2.68 3.18
43.93 13.60
535
1985 we--
14187 10.62 30-M
3.43 2.62 3.93
44.56 14.10
529
iii
_____________-__- 1984 1985 _w__ B-w-
9200 9788 I:E 2.74 7.32
2.42 2.42 2.85 3.64
47.05 47.91 13.21 13.75
539 533 653 656 605 607
1986 w-w_
14693 10.41 30.52
1987 ma-_
14592
2E! 3:95
Z-E 47:80 16.18
532 652 612
_ 1986 M-w_
10152 7.19 2.65 2.24 3.78
49.17 15.02
537
zi
1987 w-m_
10272 6.90
f-Z 4:31
50.60 16.32
538
iit
FEMALES ONLY _____________~~~~~__
*
YEAR OF GRE
NUMBER OF EKAHINEES . X OF TOTAL EXAMINEES X UHO ARE BLACK X UHO ARE HISPANIC X UHO ARE ASIAN AMERICAN X PURSUING DOCTORATE X OLDER THAN 30 GRE VERBAL MEAN GRE OUANTITATIVE MEAN GRE ANALYTICAL UEAN
1978 w-m-
32% 2.06 4.76 2.91 3.00
37.94 6.19
526 613 584
1983 ____
3015 1.76 5.77 2.09 2.65
41.23 10.52
530
E
1981 ____
3626
5'$ 2140 3.28
35.63 10.87
524
E
1982 ____
3758 2.92 5.64 2.42 3.35
35.79 12.48
522
E
2.67 3.30 3.32
34.92 3i:E 13.07 14.42
522 525 tit 600 615
1985 e-w_
4355 3.26 4.91 3.08 4.57
37.15 14.84
520 619 604
1986 -w-w
YEi 6135 2.61
3Z 15.86
519
z
1987 m_--
4267 2.87 6.80
;-"n 41:11 15.77
518
ii?
* DATA FOR 1979 NOT AVAILABLE
61
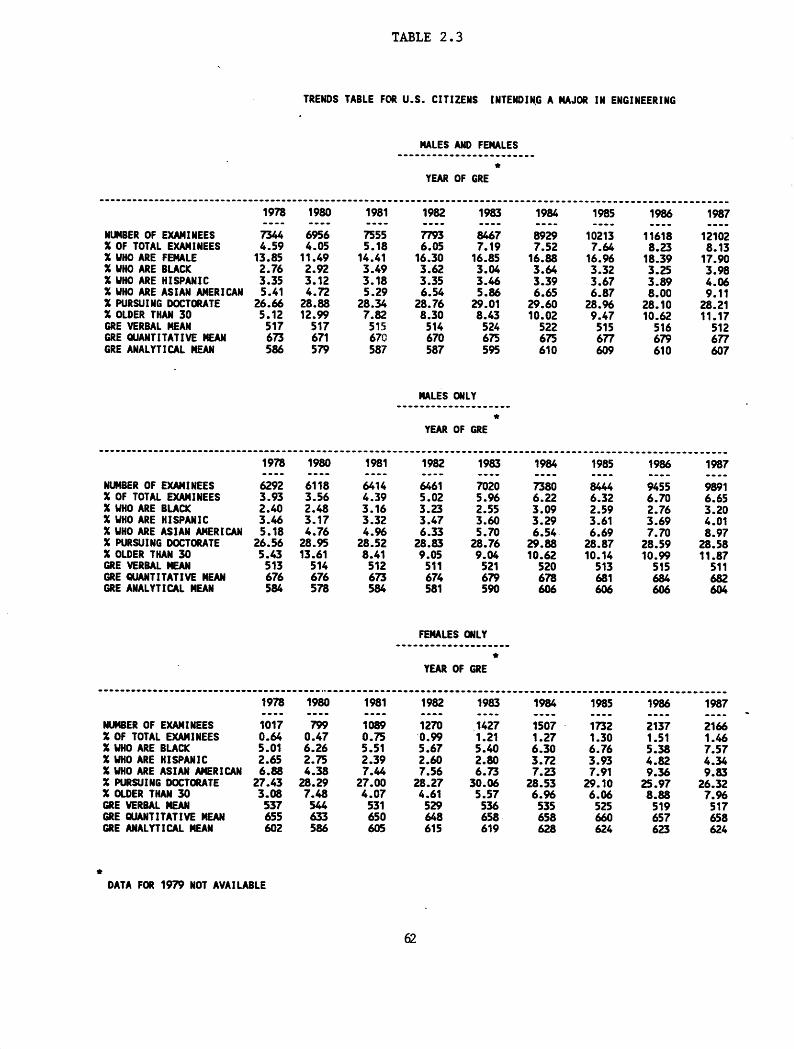
TABLE 2.3
TRENDS TABLE FDR U.S. CITIEENS INTENDING A MAJOR IN ENGINEERING
MALES AND FENALES ~_~~~~~~~~~~_~~~~~_~~~~~
*
YEAR OF GRE
1978 -m-m
NLMBER OF EXAMINEES % OF TOTAL EXAMNEES z3z X UHO ARE FEMALE 13185 % WI0 ARE BLACK 2.76 X WI0 ARE HISPANIC 3.35 X UHO ARE ASIAN AMERICAN 5.41 % PURSUING DOCTORATE 26.66 % OLDER THAN 30 5.12 GRE VERBAL MEAN 517 GRE OUANfITATIVE MAN GRE ANALYTICAL MEAN
---------___________-~~~~-~~~~~---~ 1978 ----
NUUBER OF EXAMINEES 6292 % OF TOTAL EXAMNEES 3.93 % UHO ARE BLACK 2.40 % UHO ARE HISPANIC 3.46 % UHO ARE ASIAN AMERICAN 5.18 %PURSUINGDDCTDRATE 26.56 X OLDER THAN 30 5.43 GRE VERBALMEAN 513 GRE WANTITATIVE UEAN 676 GRE ANALYTICAL MEAN 584
1980 1981 1982 1983
---- ---- ---- 6956 7555 ii; 4.05 5.18 i7z 7.19
11.49 14.41 16130 16.85 2.92 3.49 3.62 3.12 3.18 3.35 i::
2z 12199
28.34 5.29 28.76 6.54 2cz 7.82 8.30 8143
517 515 514 524 671 670 670 675 579 587 587 5%
__________ 1980 --mm
6118 3.56
5:; 4.76
28.95 13.61
514 676 578
3.16 3.32
2z 8.41
512
:ii
MALES ONLY __________________m
*
YEAR OF GRE
1982 ----
6461 5.02 3.23 3.47 6.33
28.83 9.05
511 674 581
1984 ----
8929 7.52
16.88
i-z 6165
29.60 10.02
522 675 610
~____________________ 1983 1984 ____ m-m_
7020 5.96 61:
2.55 3.60 i-z 5.70 6154
28.76 29.88 9.D4 10.62
521 520 679 678 590
FEMALES ONLY
1985 ----
10213
1:-; 3:32 3.67 6.87
28.96 9.47
515 677
1986 ----
11618
1x:zs
z-g 8:00
28.10 10.62
516
f;
---__-_-_________ 1985 1986 ---- ----
9455 6.32 6.70 2.59 2.76 3.61 3.69 6.69 7.70
28.87 28.59 10.14 10.99
513 515
iti z
_____________________~~~~~~~~~~~~~~ 1978 ----
NUMBER OF EXARINEES 1017 % OF TOTAL EXAM NEES X UHO ARE BLACK 5o:tt % UBO ARE HISPANIC 2.65 X UHO ARE ASIAN AMERICAN 6.88 % PURSUING DOCTORATE 27.43 X OLDER THAR 30 3.08 GRE VERBAL MEAN 537 GRE GLMNTITATIVE MEAN 655 GRE ANALYTICAL MEAN 602
_____~-_____-----_________I_____________~-~-~~~-------~--~--------~~-~
1980 1981 1982 1983 1984 1985 1986
---- ---- ---- _;4;; ;;;; ----
6126 OT 1089 1270 $2 2137 ii-: .0.99 5.67 5.40 1.21 6.30 1.27 6.76 1.30 1.51
2.75 2:39 2.60 3.72 3.93 ::ii 4.38
25-z 7.56
t: 7.91
28.29 4:07
28.27 30:06 2z 61%
29.10 2:.g 7.48 4.61 5.57 6.06 8188
546 531 529 535 525 519 633 650
:zi 658 657
586 605 it!
619 iz!
623
1987 ----
12102 8.13
17.90 3.98 4.06 9.11
28.21 11.17
512 677 607
I_____
1987 ----
9891 6.65 3.20 4.01 8.97
28.58 11.87
511
zi
_____ 1987 ---- -
2166
:-z 4134
2:-: 71%
517 658 624
t DATA FOR 1979 NOT AVAILABLE
62

TABLE 2.4 '
TRENDS TABLE FOR U.S. CITIZENS INTENDING A UAJOR IN BIOLOGICAL SCIENCES
HALES AND FEMALES ________________________
+
YEAR OF GRE
____________________--------~~~~~~-. 1978 m-m-
NUUBER OF EXAM1 NEES 11017 % OF TOTAL EKAUINEES 6.89 % WI0 ARE FEMALE 45.89 % UHO ARE BLACK 3.58 % UHO ARE HISPANIC 2.73 % UHO ARE ASIAN AUERICAN 2.37 % PURSUING DOCTORATE 56.33 % OLDER THAN 30 4.72 CRE VERBAL UEAN 523 GRE QUANTITATIVE MEAN GRE ANALYTICAL MEAN
NUMBER OF EXAMNEES % OF TOTAL EKAUINEES % UHO ARE BLACK % UHO ARE HISPANIC % UHO ARE ASIAN AMERICAN % PURSUING DOCTORATE % OLDER THAN 30 GRE VERBAL MEAN GRE QUANTITATIVE WEAN GRE ANALYTICAL MEAN
NUMBER OF EXAMINEES % OF TOTAL EKAMINEES X UHO ARE BLACK X WI0 ARE HISPANIC X UHO ARE ASIAN AMERICAN % PURSUING DOCTORATE X OLDER THAN 30 GRE VERBAL MEAN GRE WANTITATIVE UEAN GRE ANALYTICAL MEAN
1978 a.__
5897 3.69 2.65 2.66 2.19
60.45 3.63
519
zz
._m______-.
1980 -m-w
13287
407.E 3:43 ' 2.52 2.14
58.51 9.50
526 576 553
I________W
1980 -m-w
z 2156 2.38 2.13
61.80 8.89
519 590 549
._______________________________________--~--~~~.. 1981 1982 1983 1984 1985 -e-w ____ -_a- _-em ____
47148 6": 49117 E!
6811 6621 7325
48144 578 51.17 5.58 4;.2
Ei 4.03 3.65 4.11 3.71 4.36 4.59 4114 3.55 5i.z
7124
56.29 2.25 5:.47
8.54 8185
5i.E
10169
59.43 3.14
10.22 520 521 520 519 520
55z zz 581 564 z z:
MALES ONLY _____...___.._..__._
*
YEAR OF GRE
._a_-___________
1986 1987 __w_ mew-
7610 7852 5.39
50.55 5E
3.73 4.22 ::ii 3.76
61.37 6i.z 11.54 11:91
521 518 580 576 zz
I__________
1981 w-w_
5161 3.54 2.83 2.77
6::g 6.39
520
55:
____-__ 1982 ____
4389 3.41 3.01 3.62 2.21
61.56 7.72
519 591 548
~~~~~~~~~~~~~__~~_~~~~~~~~~~~~~~~~~~~~~~ 1983 1984 1985 1986 ____ _--- __-- ____
3498 3216 3666 3733 2.97 2.71 2.74 3.26 3.36 3.19 32s 3.66 4.23 4:10
622-z 8135
63.53 2.74 63164 I.: 6z 10.62 9.54 11:25
519 520 519 521
E 5z 573 597 z
FEUALES MLY ...._....“.-------.-
l
YEAR OF GRE
~~~~~~~~~~~_~~~~~~~~~~~~~~~ 1978 1980 1981 w--w -em_ __w_
5062 5426 4714 3.17 3.16 4.62 4.64 t.: 2.77 2.76 3:29 2.55 2.19 2.27
51.40 53.63 so.49 5.92 10.34 8.13 .
528 536 520 552 556 553 563 557 560
ta___m_m
1982 _a__
4340 3.37 4.86 3.62 2.30
51.11 9.32
524 555 564
________ 1987 ____
3855 2.59
f-E 4:10
64.80 11.36
521
;z
~~~-~-~~~~~~~~~~~_~~~~~~~~~~~~~~~~~~~~~~~~~~~~~~ 1983 1984 1985 1986 1987 -e-w ___w _w.- w-w_
3299 3635 3847 &ii
3:79 Pii
Et
2-z 3116
3:66 Ki f=Z 4137 t:: 4.42 2.76 3.59
53.96 53.51 5f.E 57.97 5i.E 9.30 10.77 10187 11.78 12:41
521 518 521 522 515
565 559 563 573 568 579 ztt Et!
l
DATA FOR 1979 NOT AVAILABLE
63
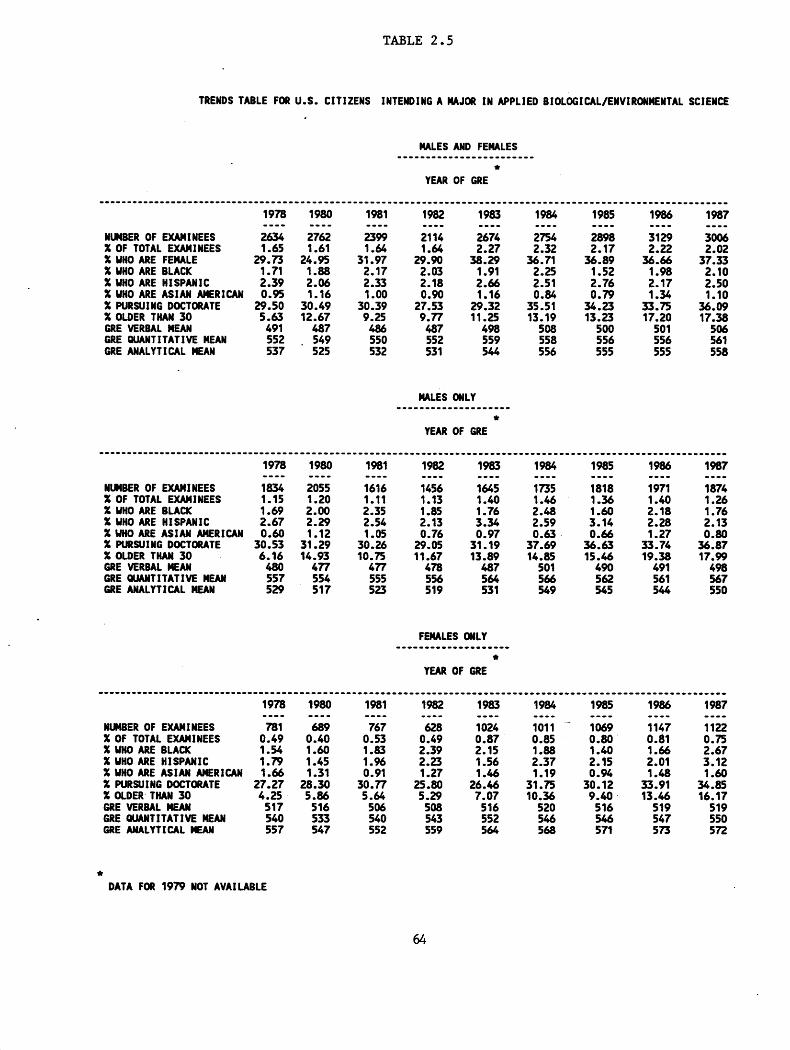
TABLE 2.5
TRENDS TABLE FOR U.S. CITIZENS INTENDING A UAJOR IN APPLIED BIOLOGICAL/ENVIRONMENlAl
HALES AND FEMALES ----__--__-_____________
l
YEAR OF GRE
SCIENCE
~~~~~~~~~~~~~~~~~~~~~~--~~~~~------~--~~~~---~~~~~~~~~~~~~~~~~~~~~~~~~~~~~~~~~~~~~~~~~~~~~~~~~~~~~~~~~~~~~~~~~ 1978 1980 1981 1982 1983 1984 1985 1986 1987 m-w_ -w__ ___w ____ ____ ---_ ---- --_- ____
NUMBER OF EXAUINEES 2634 2762 2399 2114 2674 2754 2898 3129 3006 X OF TOTAL EXAUINEES 1.65 1.61
3:-g 2~~~ JZ 2.32 2.17 2.22 2.02
X UHO ARE FEMALE 29.73 24.95 2:17 2103 1191
36.71 36.89 36.66 37.33 X UHO ARE BLACK 1.71 1.52 1.98 2.10 % UHO ARE HISPANIC 2.39
:z
X WI0 ARE ASIAN AMERICAN 0.95 1116
2.33 2.18 2.66 5::
2.74 2.17 2.50
1.00 1.16 X WRSUING DOCTORATE 29.50 30.49 30.39 2z 9177
29.32 350.: 13119
3fz X OLDER THAN 30 5.63 12.67 9.25 11.25 13123
3;s 17:20
3t2 17:38
GRE VERBAL UEAN 491 z;
486 487 498 SD8 500 501 GRE GUANTITATIVE MEAN 552 550 . 552 559 558 556 556 iif CRE ANALYTICAL MEAN 537 525 532 531 544 556 555 555 558
~--~-~~~~~~~~~~~~~~~~~~~~~~~~~~~~~~~~~~~~~~~~~~~~~~~~~~~~~~~~~~~~~~~~~~~~~~~~~~~~~~~~~~~~~~~~~~~~~~~~~~~~~~~~~
1978 1980 1981 1982 1983 1984 1985 1986 1987 ___w w-w_ ___w _w__ -w-m we-- s___ ___m
NWBER OF EXAMINEES
1%
2055 1616 1456 1645 1735 1818 1971 ii
X OF TOTAL EXAHINEES 1169 1.20 1.11 1.13 1.40 1.46 1.36 1.40 X WI0 ARE BLACK 2.00 2.35 % UHO ARE HISPANIC 2.67 2.29 2.54
:*z 1 76 3’34
f:: ::fi! 2.18 :z 2.28 2:13
XUHOARE ASIANAUERICAN 0.60 1.12 0176 0:97 % PURSUING DOCTORATE 30.53 31.29 3::: 29.05 31.19 3;-: 14:85
3kz 1.27 33.74 3z X OLDER THAN 30 6.16 14.93 10.75 11.67 13.89 15:46 19.38 17:99 GRE VERBAL MEAN 477 477 478 487 501 490 491 498 GRE OUANTITATIVE MEAN 557 554 555 556 564 561 567 GRE ANALYTICAL MEAN 529 517 523 519 531
zt ;z 544 550
~___~~~~~~~~~_~~~~~~~~~~~~~~~~~~~~~~~~~~~~~~~~~~~~~~~~~~~~~~~~~~~~~~~~~~~~~~~~~~~~~~~~~~~~~~~~~~~~~~~~~~~~~~~~
1978 1980 1981 1982 1983 1984 1985 1986 1987 ___e m-w_ __w_ m___ __m- w-w_ ___e ___M
NUUBER OF EXAMINEES
X OF TOTAL EXAMNEES 0:; 0%
- 767
0::
1024 ii;; 1069 1147 1122
0.53 2.39 0.87 0.85 0.80 0.81 X UHO ARE BLACK :?i :*z :z 2'23
2.15 z
1.40 ::tf
5:: X UHO ARE HISPANIC 1.56 2.15 3.12
X UHO ARE ASIAN AMERICAN 1166 1131 0191 1127 1:19 0.94 X PURSUING DOCTORATE 27.27 28.30 30.77 25.80 2:z 7107
31.75 30.12 3i-g 32.: % OLDER, THAN 30 4.25 5.86 5.64 5.29 10.36 9.40 13:46 16117 GREVERBALUEAN 517 516 506 508 516 520 516 519 519 GRE OUANTITATIVE UEAN 540 GRE ANALYTICAL MEAN 557
zz 540 543 552 546 547 550 552 559 564 568
2: 573 572
l
DATA FOR 1979 NOT AVAILABLE
64

TABLE 2.6
TRENDS TABLE FOR U.S. CITIZENS INTENDING A UAJOR IN SOCIAL SCIENCES
MALES AND FEUALES _..______._.__..________
*
YEAR OF GRE
~~~~~~~~~~~~~~~~~~~~~~~~~~~~~~~~~~~~~~~~~~~~~~~~~~~~~~~~~~~~~~~~~~~~~~~~~~~~~~~~~~~~ 1978 1980 1981 1982 1983 1984 w-w_ -.w. -.._ --.. .._w __.M
NUMBER OF EXAMINEES 29402 32035 27531 24469 20953 21798 X OF TOTAL EXAMINEES 18.39 18.65 18.86 19.01 17.79 18.36 % UHO ARE FEUALE 51.68 47.76 54.38 55.69 55.60 55.76 % UHO ARE BLACK 7.07 7.00 X WHO ARE HISPANIC 3.10 3.26
$.it
1150
0.:: 36:zi 6 19
% YHO ARE ASIAN AMERICAN 1.26 1.22 1156 3.98 1:72
% PURSUING DOCTORATE 60.72 61.24 60.47 61.95 6i.g % OLDER THAN 30 12.51 21.14 18.06 19.47 19:95 ::ii GRE VERBAL MEAN 521 527 520 516 522 522 GRE GUANTITATIVE MEAN
z: 512 510 511 516 514
GRE ANALYTICAL MEAN 526 535 522 530 536
_-------________________________________~---- _e________
1978 1980 1981 -w-m Mm__ W.-w
NWBER OF EXAUINEES 14035 16535 12402 % OF TOTAL EXAMINEES
58.: ;.z 8.50
% WHO ARE BLACK 5.35 % UHO ARE HISPANIC 3:40 3146 3.38 X UHO ARE ASIAN AMERICAN 1.35 1.20 1.53 % PURSUING DOCTORATE 62.74 63.09 61.51 X OLDER THAN 30 10.55 21.09 16.80 GRE VERBAL MEAN 525 527 524 GRE GUANTITATIVE WAN 535 533 537 GRE ANALYTICAL MEAN 534 ,527 538
MALES ONLY _.__._.__.__________
l
YEAR OF GRE
1985 WM..
24331 18.21 56.36
Z:ii
6:.cn: 21:23
518 513 539
--~~~~-- 1982 --mm
10623 8.25 5.61 3.77 1.55
62.50 17.90
520 537 521
-_--__________________________ 1983 1984 1985 -w-w .__s _.w.
9233 9547 10525
:.ft 3:86
:.: 4137
47.; 3182
1.82 1.56 1.72
61.28 62.90 18.86 20.06 ii.: 528 533 526 z 543 544 544 541
FEUALES ONLY .________.___._._m._
*
YEAR OF GRE
-----________-__________________________--------~---- 1978 1980 1981 ____ ._w. w-w.
NUUBER OF EKABINEES 151% 15301 14970 % OF TOTAL EXAMINEES 9.50 8.91 10.26 X UHO ARE BLACK % UHO ARE HISPANIC 5.:
1118 f:: ;.z
% UHO ARE ASIAN AMERICAN 5;.g
1150 % PURSUING DOCTORATE 58.87 59.59 X OLDER THAN 30 14.23 21108 19.03 GRE VERBAL MEAN 518 527 516 GRE GUANTITATIVE MEAN 488 GRE ANALYTICAL MEAN 526 533
a_ ______w___
1982 w...
13627 10.58 7.60 3.32 1.58
61.6D 20.59
512 491 522
----mm-a_-
1983 __.a
11650 9.89
3.; 1:52
ii.: 317 4% 530
_
1986 m-w.
25996 18.41 56.45
5.24 3.66 1.76
63.16 22.88
525 519 544
56.42 5.13 3.65 1.81
63.32 23.06
;pP 544
I_______________
1986 1987 -w.. .-we
11240 12235 7.96 8.22 4.35 3.94 i:Z 1.66 1.76
z:z 62.58 22.59 zz 533
549 zz
-_-________________________________ 1984 1985 1986 1987 .-_w -.-. w-w- ..-.
12155 13714 14674 15994 10.24 10.26 10.39 10.75
7.49 6.27 3.68 3.89 kit Z:Z 1.84 1.84
z.z 62.24 6i.g
ah 518
6i.z
514 21.79 512 23:34 516 492 491 498 499 529 534 541 542
* DATA FOR 1979 NOT AVAILABLE
65

TABLE 2.7
TRENDS TABLE FOR U.S. CITIZENS INTENDING A MAJOR IN APPLIED SOCIAL SCIENCES
BALES AND FEMALES ________________________
*
YEAR OF GRE
NUMBER OF EXAUINEES % OF TOTAL EXAHINEES X UHO ARE FEMALE X UHO ARE BLACK X UHO ARE HISPANIC % UHO ARE ASIAN AMERICAN X PURSUING DOCTORATE X OLDER THAN 30 GRE VERBAL MEAN GRE QUANTITATIVE BEAN GRE ANALYTICAL BEAN
1978 1980 B-w- -_-w
10851 11952
7x! 7x! Sk 8179 2.76 2.59 1.13 1.19
14.39 15.33 16.54 26.26
501 509
iti r7
1981 mm-m
I?: 74192
9.02 2.54 1.22
15.24 24.07
499
1982 ----
8177 6.35
n.54
39s 1116
15.09 24.41
492
if
1983 -___
7214 6.13
73.81
3'=: 1:10
14.51 26.71
497
BALES ONLY __*m_____m___m_w____
*
YEAR OF GRE
1984 mm--
7116
7:.z 9:15 3.58 1.41
15.51 28.25
4%
z
1985 ____ 8154 6.10
73.83 7.52 3.80 1.24
1986 mw--
8714 6.17
74.41 7.87 3.06 1.58
14.78 15.25 31.22 33.37
499 500 663 504
1987 _-mm
zi 73143
3z 1:86
15.83 33.67
497 464 503
NLMBER OF EXAMNEES % OF TOTAL EXAMNEES X UHO ARE BLACK % YHO ARE HISPANIC % UHO ARE ASIAN AMERICAN % PURSUING DOCTORATE X OLDER THAN 30 GRE VERBAL MEAN GRE QUANTITATIVE BEAN GRE ANALYTICAL BEAN
1978 1980 1981 ---- _--a --a-
2827 3283 2408 1.77 1.91 1.65
5-z 1127
z! 0:91
8.14 3.24 1.20
19.24 22.05 22.67 13.12 26.78 23.33
513 515 511
2; 4% 502 54:
1982 1983 1984 1985 1986 1987 -_-- a-_- ---- ---- 2092 ii 1780 2097 2203 ;t;;
:*z 1.58 3149 3'*:
7.92 1.50 5.58 1.57 1.56 6 1.63 19
1:07 3.43 3.53 z-z 3:8D
1.24 1.07 1.24 1:50 21.03 20.74 21.29 20.51 20.47 2:=: 23.03 23.87 28.60 31.31 33.18 33:33
507 515 513 513 513 512 498
zti 499
4% 510 it? 4% 500 511 512
FEMALES ONLY _~____~_~~~~~_~~~___
l
YEAR OF GRE
NUMBER OF EXAHINEES % OF TOTAL EXAWNEES % UHO ARE BLACK % UHO ARE HISPANIC % UHO ARE ASIAN AMERICAN X PURSUING DOCTORATE X OLDER THAN 30 GRE VERBAL MEAN GRE QUANTITATIVE HEAN GRE ANALYTICAL BEAN
1980 --mm
PG 9:20 2.27 1.28
12.76 26.05
so7 is4 4%
1981 1982 --_- w--w
9:3D z 6013 4.67
2.34 ;-Yt 1.22 1113
12.83 13.04 24.29 24.73
4% 487 449 500
1983 w-w-
5325 4.52
10.29 3.29 1.09
12.26 27.61
490
z
1984 ----
5308 4.47 9.53 3.62 1.53
13.56 28.10
490
z
1985 ---w
6020 4.50 8.17 3.90 1.25
12.76 31.07
494 450 502
1986 w-w-
4"ii 8156 3.08
lkz 33142
496 452 502
1987 -w_-
6814 4.58 8.37 3.45 1.81
14.04 33.73
491 451 500
* DATA FOR 1979 NOT AVAILABLE
66
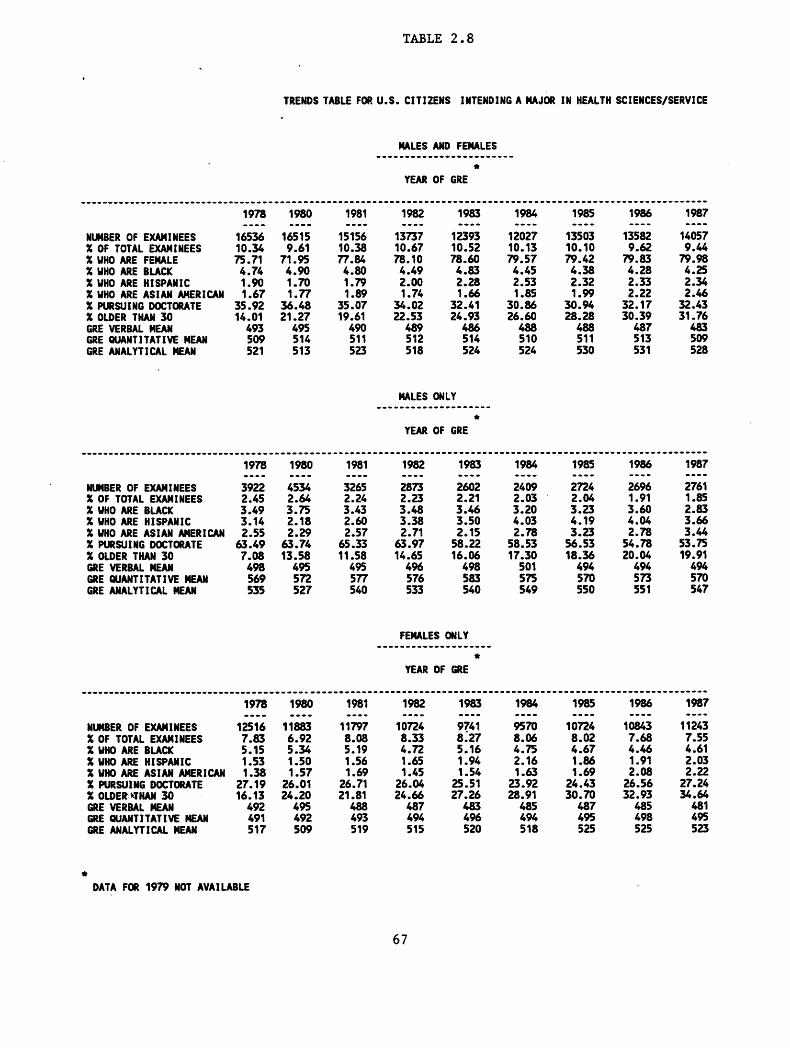
TABLE 2.8
TRENDS TABLE FOR U.S. CITI2ENS INTENDING A MAJOR IN HEALTH SCIENCES/SERVICE
MALES AND FEMALES ------------------------
*
YEAR OF GRE
____-_______________~~~~~~~~~~~~~~~~ 1978 ----
NUMBER OF EXAMINEES 16536 X OF TOTAL EXAMINEES 10.34 X UHO ARE FEUALE 75.71 X UHO ARE BLACK 4.74 X UHO ARE HISPANIC 1.90 X UHO ARE ASIAN AMERICAN 1.67 X PURSUING DOCTORATE 35.92 X OLDER THAN 30 14.01 GRE VERBAL MEAN 493 GRE QUANTITATIVE MEAN GRE ANALYTICAL MEAN
____________________-99-99-99999999-
1978 ----
NUUBER OF EXAMNEES 3922 % OF TOTAL EXAHINEES 2.45 % UHO ARE BLACK 3.49 X UHO ARE HISPANIC 3.14 X UHO ARE ASIAN AMERICAN 2.55 X PURSUING DOCTORATE 63.49 % DLDER THAN 30 7.08 GRE VERBAL MEAN 498 GRE QUANTITATIVE UEAN 569 GRE ANALYTICAL NEAR 535
,___________________---9999999
1980 1981 1982 ---- ---- ----
16515 15156 13737 9.61 10.38 10.67
71.95 77.84 78.10 4.90 4.80 4.49 1.70 1.79 2.00 1.77 1.89 1.74
zf.: 34.02
i9s R.60: ioo 22.53
514 511 512 513 523 518
-_-_-___----__-__-- 1983 1984 ---- ----
12393 12027 10.52 10.13 78.60 79.57
4.83 4.45 2.28 2.53
3i.z 1.85
24193 30.86 26.60
514 510 524 524
I___________________------
1985 1986 1987 ---- ---- ----
13503 13582 14057 10.10 79.42 7i.E i.:
4.38 4128 4:25 2.32
3A.E f :Z f :z
28128 32.43 31.76 483
511 530 531 ZE
MALES ONLY ___________mm_---_--
l
YEAR OF GRE
_____________________~~~~~~~~~~~~~~~~~~~~~~~~~~~~ 1980 1981 1982 1983 1984 ---- ---- ---- ---- ----
4534 3265 2873 2602 2409 i.:
2118
3.43 2.24 5.:
3:38
3.46 2 21 3.20 2.03
2.60 3:50 4.03 2.29 2.57 2.71 2.15
63.74 65 -33 63.97 58.22 5i.z 13.58 11.58 14.65 16.06 17:30
49s 4% 4% 498 501
:I27 :ii 533 576 zz zz
FEMALES ONLY _ew_________________
*
YEAR OF GRE
____________________~~~~~~~~~~~~~~~~~~~~.~~~~~~~~~~~~~~~~~~~~~~~--~~~~-~~~-~~-~--~- 1978 1980 1981 1982 1983 1984 ---- ---- ---- ---- ---- ----
NWBER OF EXAMINEES 12516 11883 llf97 10724 9741 9570 X OF TOTAL EXAMINEES
:.t 6 92 5:34 5”.!
8 33 8.27 XUHOAREBLACK X WI0 ARE HISPANIC 1:53 1.50 1:56
4:n 5.16 5.: 1.65 1.94 2116
X WI0 ARE ASIAN AMERICAN 1.38 1 .s7 1.69 1.45 1.54 1.63 X PURSUING DOCTORATE 27.19 26.01 26.71 26.06 25.51 X OLDERYRAN 30 16.13 24.20 21.81 24.66 27.26 ii.: GRE VERBAL MEAN 492 4% 487 iB5 GRE GUANTITATIVE REAR 491 492 493 496 494 GRE ANALYTICAL MEAN 517 509 519
:: 520 518
1985 ----
10724 8.02 4.67 1.86 1.69
24.43 30.70
487 4% 525
I_____
1987 ----
11243 7.55 4.61 2.03
2z 34164
481
* DATA FOR 1979 NOT AVAILABLE
67

TABLE 2.9
TRENDS TABLE FCR U.S. CITIZENS INTENDING A UAJOR IN EDUCATION
MALES AND FEHALES ________________________
l
YEAR OF GRE
NUMBER OF EXAMINEES X OF TOTAL EXAMINEES X YHO ARE FEUALE X WHO ARE BLACK X WHO ARE HISPANIC % WHO ARE ASIAN AMERICAN X PURSUING DOCTORATE X OLDER THAN 30 GRE VERBAL MEAN GRE GUANTITATIVE MEAN GRE ANALYTICAL MEAN
NLMBER OF EXAMINEES % OF TOTAL EXAMINEES % WHO ARE BLACK % WHO ARE HISPAW’,G X UHO ARE ASIAN AHERICAN % PURSUING DOCTORATE X OLDER THAN 30 GRE VERBAL MEAN GRE UJANTITATIVE MEAN GRE ANALYTICAL MEAN
1978 ----
35010 21.89 72.60
a.34 3.10 0.85
24.02 28.49
451 449
1980 -w_-
38425 22.37 70.75
9.18 3.21 0.83
x is3 450 461
1981 ____
30199 20.69 73.40
7.54 3.29
240-g 38114
452
ii;
1982 ----
24588 19.10 73.01
8.40 4.03 0.89
25.82 41.11
450
z:
1983 ____
22568 19.16 74.71
7.36 3.66
29z 39:90
450 455 473
MALES ONLY __w__m___________m__
*
YEAR OF GRE
~----____-__-_______~~~~~~~~~~ 1980 1981 1982 ---- ---- ----
10989 z 6332 6.40 4.92 7.94 6166 7.30 4.06 4.22 4.64
3K 3z 3Ki 49.38 43161 46187
452 452 452
478 455 z 44z
1984 ----
23181 19.52 74.71
6.55 3.51
240=: 40:89
453 454 479
1985 ----
26918 20.14 75.81
:-Ft D:%
ZZY 452 453 481
1986 ----
28163 19.95 74.91
3"-$ 0:98
24.47 45.56
it: 487
1983 ----
5622
t-z 4136 0.82
zi is3
z
FEMALES ONLY _~~~~~~~_~~~_-~-~---
*
YEAR OF GRE
NUMBER OF EXAMNEES X OF TOTAL EXAUINEES X WHO ARE BLACK % UHO ARE HISPANIC X UHO ARE ASIAN AMERICAN X PURSUING DOCTORATE X OLDER THAN 30 GRE VERBAL UEAN GRE OUANTITATIVE MEAN GRE ANALYTICAL MEAN
1984 ----
5745
i=ii 3176 0.91
36.47 49.05
459
z
1985 ----
6362 4.76 6.05 3.85 1.12
34.55 50.11
458
z
1986 w-m-
6952 4.92 5.65 3.51 1.12
Zt:Z
tt:
1987 ----
30275 20.34 75.06
9z 1:18
24.08 45.89
z
I______
1987 ----
7413 4.98
z-zz 1:25
35.71 52.96
z . 487
.~~_~~~~~I~~~~~~~_~~~~~~~~~~~~~~~~~~~~~~~~~~~~~~~~~~~~~~~~~~~~~~~~~~~~~~~~~~~~~~~~~
1978 1980 1981 1982 1983 1984 1985 1986 1987
---- ---- ---- ---- ---- ---- ---- ---- I--- 25615 271a7 22191 17952 16861 11319 20407 21098 22723 15.89 15.83 15.21 13.94 14.32 14.59 15.27 14.94 15.27 8.60 9.67 5:: 5-: 37-z 6 81
3:44 7 11 6 71 6 35
2.87 2.87
27161 190-z 36193 1:=:x 36112 18-i? 0191 0:76
3.77 0:92
3-06 0:94
3.36 1116
38.98 21.47 37.37 20.89 38108 2:-i! 41.00 19.27 43.10 20.48 43.49 20.27
452 454 452 449 449 452 450 459 459 439 440 439 438 445 452 453 468 463 -470 476 479 2 487
* DATA FOR 1979 NOT AVAILABLE

TABLE 2.10
TRENDS TABLE FOR U.S. CITIZENS INTENDING A MAJOR IN BUSINESS/@lBLIC ADMINISTRATION
MALES AND FEMALES ------------------------
l
YEAR OF GRE
--~~~~~~~~~~~~~~~~~~~~~~~~~~~~~~~~~~~~~~~~~~~~~~~~~~~~~ 1978 1980 1981 ---- ---- ----
NLR!BER OF EXAMINEES 14420 15405 12462
% OF TOTAL EXAMINEES 9.02 8.97 X UHO ARE FEMALE 47.88 41.13 5:.ii X WI0 ARE BLACK 12.20 12.15 12:37 X WI0 ARE HISPANIC 3.04 2.86 3.15 X UHO ARE ASIAN AMERICAN 1.69 % PURSUING DOCTORATE 20.37
2:-E 2.16
X OLDER THAW 30 15.46 25191 20.11 22.97
GRE VERBAL MEAN 490 484 GRE OUANTITATIVE MAN GRE ANALYTICAL MEAN
51.65 12.36 4.18 1.91
20.00 24.65
52.13 53.67 12.81 12.03 3.88
IE 25 197
482 503 505
HALES ONLY --------------------
*
YEAR OF GRE
--_______ 1984 ----
8118 6.84
4.46 2.18
19.19 28.26
__________ 1985 ----
izi 54.47 11.64 4138 2.12
18.87 29.98
483
Z!
___--_-__--_--_- 1986 1987 ---- ----
9177 6.50 z6i; 56.26 56152 11.34 13.20 4.05 4.82
31:25 zfz 2.56
33.10 20.45
485
503 518 E
---------~~~~~~~~~~~~~~~~~~~~~~~~~~~~~~~~~~~~~~~~~~~~~~~~~~~~~~ 1978 1980 1981 1982 m-M_ ___w
---- ---- NUUBER OF EXAMINEES 7421 8967 5968 4719 % OF TOTAL EXAMINEES % UHO ARE BLACK % UHO ARE HISPANIC % UHO ARE ASIAN AMERICAN 1.72 % PURSUING DOCTORATE 21.39 :-g X OLDER THAN 30 16.18 27193 25.15 26.49 GRE VERBAL MEAN 682 485 483 GRE DUANTITATIVE MEAN 530 531 531 527 GRE ANALYTICAL MEAN SD6 505 509 498
~~~-~_~_~_~~_~~~~~~~~~~~~~~~~~~~~~~~~~~~~. 1983 1984 1985 1986 ---- ---- ---- ----
4017 3721 4027 3970 3.41 3.13 3.01 2.81 9.88 9.54 8.94 9.02 4.31 5.16 4.59 4.94 1.59 2.18 1.59 2.27
20.26 20.48 20.16 22.22 28.41 31.16 31.21 32.17
483 487 528 520 527 530 502 519 517 522
--------~~~~~~~~~~~~~~~~~~~~~~~~~~~~ 1978 ----
NLMBER OF EXAUINEES 6904 % OF TOTAL EXAMINEES 4.32 % UHO ARE BLACK 15.11 X UHO ARE HISPANIC 2.53 % UHO ARE ASIAN AMERICAN 1.64 % PURSUING DOCTORATE 19.31 X OLDER THAN 30 14.67 GRE VERBAL UEAN 491 GRE QUANTITATIVE UEAN GRE ANALYTICAL UEAN
FEMALES OWLY --------------------
*
YEAR OF GRE
526 518
I---------~~--~~~~~_~~~~~~~~~~~~~~~~~~~~~~~~~~~~~~~~~~~~~~~~~~~~~
1981 1982 1983 1984 1985 1986 1987 w-m_ ---- _ ---- -___ ____ 66,2 5168 4410 4357 z! ;;-& &-&
4.39 4.01 3.74 3.67 15.24 15.09 15.44 14.23 13:85 1::: If-E
2.71 3.68 3.51 3.90 4.20 4:n 2.35
129-z 2.31 2.18 2.55
32-z 2.65
19.82 20.79 22188
18.59 18.18 17.84 19:06 18.79 23.76 25.72 28.86 30.56 31.50
485 481 481 482 478 481 FiE
:z z z 509 503 508 509 516 512
* DATA FOR 1979 NOT AVAILABLE
69

TABLE 3.1‘
. TRENDS TABLE FOR U.S. CITIZENS UITH UNDERGRADUATE MAJOR IN
MALES AND FEMALES ____________________----
l
YEAR OF GRE
ARTS/HUMANITIES
NUMBER OF EXAMINEES % OF TOTAL EXAUINEES % UHO ARE FEUALE % UHO ARE BLACK % UHO ARE HISPANIC % UHO ARE ASIAN AUERICAN % PURSUING DOCTORATE % OLDER THAN 30 GRE VERBAL MEAN GRE QUANTITATIVE UEAN GRE ANALYTICAL UEAN
1978 w--w
25676 16.06 58.10
4.38 2.60 1.19
36.21 16.56
542 4% 528
1980 w--m
28638 16.67 57.49
4.54 2.80
3:.ii 25188
547 4% 522
NUMBER OF EXAMINEES X OF TOTAL EXAUINEES % UHO ARE BLACK X UHO ARE HISPANIC X UHO ARE ASIAN AMERICAN X PURSUING DOCTORATE X OLDER THAN 30 GRE VERBAL UEAN GRE OUANTITATIVE MEAN GRE ANALYTICAL MEAN
1978 _-Mm
10604
36s 2168 1.14
42.80 12.11
542 525 531
1980 -__a
12034 7.01 3.71 2.99 0.81
44.76 23.51
545 524 526
1981 w-w_
23228 15.92 59.20
4.00 2.62 1.17
35.82 23.89
537 494 529
1982 _wm_
20162 15.66 57.89
4.08 2.89 1.26
37.02 25.06
zi 520
1983 w--e
18003 15.29 57.76
3.96 3.07 1.27
38.69 25.96
541 506 526
UALES OWLY ---_________________
l
YEAR OF GRE
--____________________ 1981 1982 --_w -w-m
9322 8288 6.39 3.75 36.: 2.68 2179 0.94 1.19
41.53 41.83 19.92 21.20
536 534 521 530 530 523
_-_---____ 1983 m-me
7539 6.40 3.59 3.20 1.14
43.04 22.92
539
z
FEMALES ONLY -me_____-__-________
*
YEAR OF GRE
---------------------------------------------------------~---~- 1978 1980 1981 1982 _w__ m___ mw__ -a--
NUMBER OF EXAMINEES 14887 16463 13752 11647 X OF TOTAL EXAWNEES 9.31 9.58 9.42 9.05 X UHO ARE BLACK 5.02 5.13 4.16 4.49 % UHO ARE HISPANIC 2.53 2.66 2.58 3.01 X UHO ARE ASIAN AMERICAN 1.23 1.25 1.32 1.31 % PURSUING DOCTORATE 31.56 32.30 31.97 33.70 % OLDER THAN 30 19.59 27.55 26.49 27.58
GRE VERBAL WAN 543 547 537 GRE GUANTITATIVE UEAN 475 476 476 z GRE ANALYTICAL MEAN 526 519 528 518
1984 __a_
180% 15.24 58.01
c:: 1:45
39.60 27.42
543 506 535
1985 ____
20584 15.40 57.82
3.61 3.06
3:-i! 28145
541 503 536
22083 15.64 58.64
3.43 2.89 1.50
40.91 31.14
548 507 541
1987 ____
23611 15.86 58.96
3.48 3.25 1.63
41.92 31.04
zz 541
____________-______________________ 1984 1985 1986 1987 w-m_ am__ _M__ -m-w
7531 8588 9597 36-z 6.43 3.40 3:14 iz 6.45
3113 3.07 3.14 ?Z 1.37 1.51 1.34 1:37
42.68 42.50 46.03 46.50 24.45 25.09 28.22 28.29
543 540 547 547
zz 530 540 zz 532 543
~~I~I~--~~~~~~~~~~~~~~~~~~-~~~~~.
1983 1984 1985 -v-w _-mm a-m_
10398 10498 11902 t-u"
2197
i-ii
3127
3'78 8 91
3:08 1.37 1.52 1.67
35.48 37.43 35.25 28.02 29.48 30.79
543 543 541 485
527 531 533
1986 1987 -w-m _-__
12949 13920 9.17 9.35 3.64 3.58 2.73 3.17 1.61
37.36 3z 33.20 32187
548 iii
538 539
l
DATA FOR 1979 NOT AVAILABLE
70

TABLE 3.2
TRENDS TABLE FOR U.S. CITIZENS UITH UNDERGRADUATE MAJOR IN PHYSICAL SCIENCE/MATH
MALES MD FEMALES ________________________
*
YEAR OF GRE
NUMBER OF EXAUINEES X OF TOTAL EXAMINEES X UHO ARE FEMALE X UHO ARE BLACK X UHO ARE HISPANIC X UHO ARE ASIAN AMERICAN X PURSUING DOCTORATE X OLDER THAN 30 GRE VERBAL NEAN GRE GUANTITATIVE MEAN GRE ANALYTICAL MEAN
1978 1980 m-s_ w___
14196 15027
2::: 2::: 3.67 3.91 2.26 1.66 2.29
48.05 5:.: 7.84 14179
529 533
1981 1982 1983 __w_ --am mm__
13561 13109 3X:fX 30:09 :z 30.16 11.64
3.64 3.73 3.68 2.25 2.33 2.71
4?E
ii:24
4E!
11166
45.56 2.91
12.04 531 527 531
ii: iii ii;
UALES ONLY
* YEAR OF GRE
1984 1985 1986 1987 w--m __-a m-e- ____
13681 14976 15936 16032 11.52 11.21 11.29 10.77 31.55 32.30 32.58 32.19
3.57 3.83 4.27 4.58
46:51 5=: 2.54 2.33
4Fz
13:32
47.29 4.26 48177 t-E
12.88 14.70 16.22 533 527 528
iii: ii: iti z
NURSER OF EXAMINEES X OF TOTAL EXAMINEES X UHO ARE BLACK X UHO ARE HISPANIC % UHO ARE ASIAN AUERICAN % PURSUING DOCTORATE X OLDER THAN 30 GRE VERBAL UEAN GRE WANTITATIVE WEAN GRE ANALYTICAL MEAN
1978 -s-w
10068 6.30 2.92
i-2 51:05 7.13
531 656 583
1980 W-M-
10734 6.25 3.01 1.39 1.96
55.18 14.02
535
g
----------------------------------------------. 1978 1980 w-m_ w-m_
NUMBER OF EXAMINEES 4036 4219 X OF TOTAL EXARINEES 2.52 2.46 X UHO ARE BLACK 5.50 6.16 X UHO ARE HISPANIC 3.05 2.35 X WI0 ARE ASIAN AUERICAN 2.90 X PURSUING DOCTORATE 40.29 402:ii X OLDER THAN 30 9.43 16.46 GRE VERBAL WEAN 526 528 GRE QUANTITATIVE MEAN 617 GRE ANALYTICAL MEAN 581 5:
1981 __a-
9334 6.40 2.80 2.14
5::: 10.18
534
z
4147
f.58”7 2:51 3.35
39.14 13.47
524
--a--
1982 1983 1984 1987 me__ __a_ __mm ww--
Ei 4134 4317 5160 3.51
5.89 6.07 E 3.47 7.34
xi 40176
z-z 3147 2.87
38178 3.80 5.17
40.10 42.42 13.'27 13.51 14.96 16.91
6i6 523 523 525 518 616 618 622 627 627
582 590 593 zf
I~~~-~-
1985 m--w
?i; 5.69 2.92 4.11
40.91 14.40
519
_~~___~_~~ 1986 m___
5192
;:F
5:35 41.01 16.05
518
1982 w-w_
8924
2"'89: 2113 2.49
48.91 10.87
E 582
1983 mm__
9530
S:E 2.65 2.57
48.57 11.39
534 651 584
1984 --mm
9309
1-E 2149
4z 11189
537 653 604
1985 _a__
10097 7.56 2.91 2.36
4s 12176
531
iii"7
FEMALES ONLY _-__________________
*
YEAR OF GRE
1986 1987 we_- ___-
lo689 10818 7.57 7.27 3.12 3.24 2.15 2.94
5301559 51.80 4.10
14.03 15.84 534 535
z z
* DATA FOR 1979 NOT AVAILABLE
71

TABLE 3.3
.
TRENDS TABLE FOR U.S. CITIZENS UIfH UNDERGRADUATE UAJOR IN ENGINEERING
MALES AND FEUALES ____________---_____----
*
YEAR OF GRE
NUMBER OF EKAUINEES % OF TOTAL EKAUINEES % UHO ARE FEMALE % UHO ARE BLACK % UHO ARE HISPANIC % UHO ARE ASIAN AMERICAN % PURSUING DOCTORATE X OLDER THAN 30 GRE VERBAL UEAN GRE QUANTITATIVE MEAN GRE ANALYTICAL MEAN
2.55 3.37 5.33
27.53 8.66
517
z
---________-________---------------- 1978 ____
NUUBER OF EXAUINEES 6712 % OF TOTAL EXAMINEES 4.20 % UHO ARE BLACK 2.22 X UHO ARE HISPANIC 3.44 % UHO ARE ASIAN AMERICAN 5.13 % PURBUINGDOCTORATE 27.21 XOLDER THAN 30 9.34 GRE VERBAL MAN 514 GRE QUANTITATIVE MEAN 675 GRE ANALYTICAL MEAN 582
1980 ew__
z 8161
5:';"2 4.62
28.89 18.98
518
:E
1981 w--w
?K 11165 3.09 3.44
2::: 11.14
516 674 587
1982 -_a_
7701
l?Z 3:36 3.57
2;:z 10.88
514 674 587
1984 m-m_
9568
158::
::z
2z 11176
525
f::
1985 a___
10834 8.11
15.53
i::
2x 11:53
518
zi
1986 -e-a
12265 8.69
17.55 3.05 3.91
287-f 11:77
520
it?:
)---------------------------------------------------------------------
1980 1981 1982 1983 1984 1985 1986 ____ --*a ma_- ~~~~ -ma- ---- ----
2118 i6zi 2189 t6i: 6610 7455 8065 9108 10086 3.10 5.13 2.41 6.33 2"-: 6.82 2.60 2.54 7.14
3.18 3.52 3.69 3.62 3143 3.65 3.82 4.60 5.15 5.62 6.50 7.54
ft.8 il5
12.03 28.44 11.97 2::: 28.44 11.58 30.08 12.99 12.71 2Z 29.22 12.77 513 512 524 516 519
676 i: 577 :iz ii: 590 607 z tit
FEMALES ONLY --a_________________
*
YEAR OF GRE
~~_~~__~~~~~~~~~~~~~~~~~~~~~~~~~~~~~~~~~~~~~~ 1978 1980 m-w_ --ee
NUMBER OF EXAM NEES % OF TOTAL EXAUINEES 0:: OS X UHO ARE BLACK % UHO ARE HISPANIC 52-z 52’$ % UHO ARE ASIAN AMERICAN 7:13 l
% PURSUING DOCTORATE 3D.05 3zz X OLDER THAN 30 3.11 9112 GRE VERBAL UEAN 541 550 GRE WANTITATIM WAN GRE ANALYTICAL REAR iiT 2
---w-_-w_.
1981 -w-e
0; 4176
ii*: 28:09 4.47
537
z
~~~~~~~~~~~~_~~~~~~~~~~~~~~~ 1982 1983 1984 -_a- -w-e _-em
1036 1316 1478 1.24
::z
3:-i! 3180
3:.: 4144
297.: 5:05
531 539 iii 631 z: 667
1987 w-m_
13095
1:-t! 3:54 4.10 8.94
28.84 12.52
517
:i
10814 7.27
t 2 2% 13:54
516
iii
~~~~~~~~~~~__~~~~~~_~~~~~~~~ 1985 1986 1987 w--w ____ mm__
1683 2153 2220 1.26 1.53 1.49 5.53 4.16 :-g 4°C
380-z
5:04
27.45 9157 27.57 10:41
7.16 7.30 531 524
iii! z ii? 629
!
*
DATA FOR 1979 NOT AVAILABLE
72

TABLE 3.4
TRENDS TABLE FOR U.S. CITIZENS UITH UNDERGRADUATE MAJOR IN BIOLOGICAL SCIENCES
UALES AND FEMALES ________________________
*
YEAR OF GRE
NUMBER OF EXAM1 NEES X OF TOTAL EXAMINEES X UHO ARE FEMALE X UHO ARE BLACK X WI0 ARE HISPANIC X UHO ARE ASIAN AMERICAN X PURSUING DOCTORATE X OLDER THAN 30 GRE VERBAL MEAN GRE OUANTITATIVE MAN GRE ANALYTICAL UEAN
1978 1980 _-mm ____
16643 19112 10.41 11.13 47.20 41.91
4.55 4.55 2.86 2.68 2.61 2.33
52.96 54.89 6.32 11.45
519 520
z: z
___________________________________ 1978 __w_
NWBER OF EXAMINEES 8700 X OF TOTAL EXAMNEES X UHO ARE BLACK 35’: X b/HO ARE HISPANIC 2198 X UHO ARE ASIAN AUERICAN 2.59 XPURSUING DOCTORATE 57.23 X OLDER THAN 30 5.24 GRE VERBAL MEAN 515 GRE QUANTITATIVE MEAN GRE ANALYTICAL UEAN
I__________
1980 e-w_
10966
36-g 2161
5x-g 11121
512 581 541
1981 w--m
14945 10.24 49.21
4.73 2.91
5f.Z 9k
518 569 555
1982 1983 e-s- ____
12875 10510 10.00 8.92 51.12 50.80
4.89 5.02 3.56 3.82 2.50
52.43 5z 11.05 12129
519 520
55: 576 559
UALES ONLY _____e_____________-
*
YEAR OF GRE
-_____________m____
1981 1982 w--m ____
7492 6162 5.13 3.58 34'; 2.74 3157 2.52 2.45
57.62 57.11 9.30 10.98
515 516
55: 586 542
_ ________ 1983 w-m-
5145 4.37 3.69 3.91
55-z 13107
517 591 550
__
1984 -w-s
10336 8.71
52.27 5.07 4.29 3.05
53.65 13.62
519 571 564
_______--- 1984 -w-s
4900 4.13 3.82 4.12 3.02
59.14 15.10
519 587 563
1985 -m-w
11442 8.56
52.08 4.80 3.67 3.29
53.43 14.35
518
;:
__________ 1985 ____
5440 4.07 3.57 3.58
5z 14:70
515 589 566
FEMALES ONLY ______~__~~-~~~____-
*
YEAR OF GRE
----------------------------------------------------~~~~~---~~----~~-~-----~------ 1978 1980 1981 1982 1983 1984 e-m- emem w-w_ w-M_ w--m ____
NUUBER OF EXAUINEES z
8009 7354 5339 5403 X OF TOTAL EXAMINEES XUHOARE BLACK 6.12 :-ff 55.:
fi 4.53 4.55
2:81 3:09 6.10 6.29 6.20
X UHO ARE HISPANIC 2.71 3.54 3.75 4.46 X UHO ARE ASIAN AMERICAN 2.61 2.31 2.56 3.20 3.07 X PURSUING DOCTORATE 48.03 49.51 45.iz
9193 47.61 49.69 48.70
X OLDER THAN 30 7.41 11.80 11.02 11.48 12.29 GRE VERBAL MEAN 524 530 522 523 519 GRE OUANTITATIVE MEAN zz 549 553 555
zz 556
GRE ANALYTICAL MEAN 550 558 561 568 565
1986 _-mm
12214 8.65
53.22 4.57 4.20 3.65
53.89 15.32
520
z-ii
>______ 1986 ____
5669 4.02
t::
538-z 16117
518
1987 _-mm
12635 8.49
54.71
t-z 4:11
54.14 16.47
517
zz
__m___
1987 -w-w
5662
?Z 4126 4.15
59.55 17.18
518
zz
w-m ,__________-________-------- 1985 1986 1987 ____ m-w- em-m
5959 6500 6913
3176 i-s 4.60 4.64 4.08 5.25 5.89
4i:Z 49.89 3.52 49166 t-z
13.97 14.56 15.87 520 521 515
55: ;: 558 573
* DATA FMI 1979 NOT AVAILABLE
73
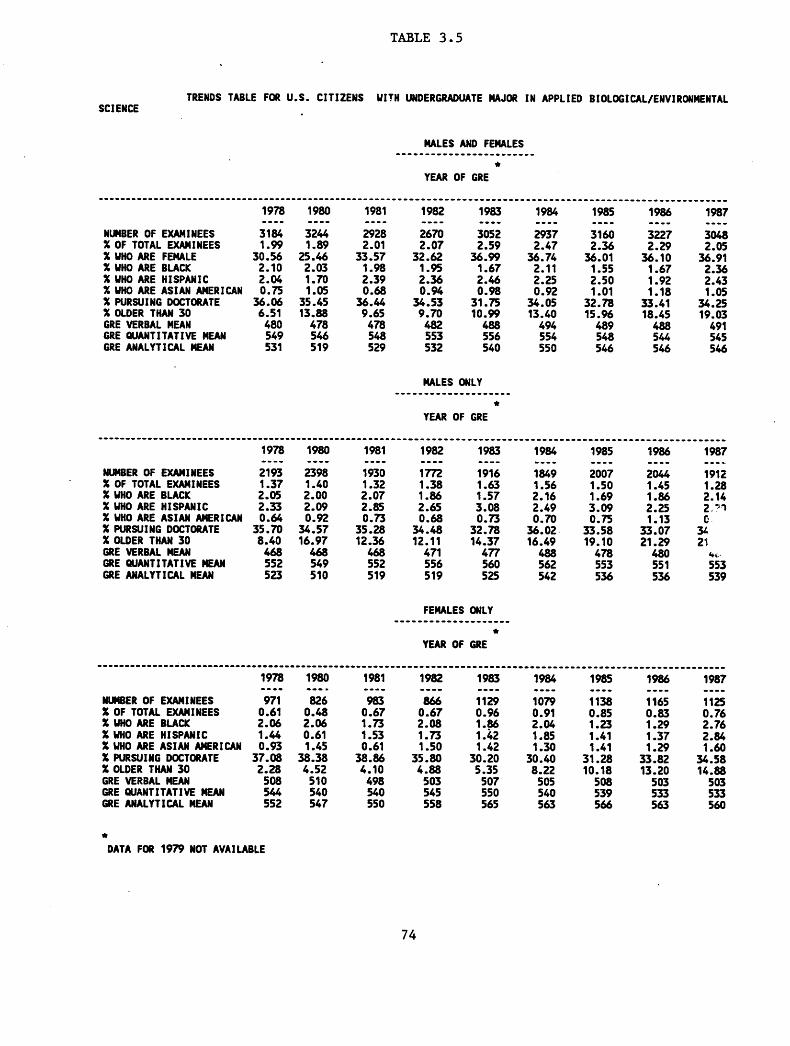
TABLE 3.5
TRENDS TABLE FOR U.S. CITIZENS UITH UNDERGRADUATE RAJOR IN APPLIED BIOLDGICAL/ENVIRDNHENTAL SCIENCE
1978 ____
3184
3x 2:lD 2.04
3z 4:51
1980 -v-m
3244 1.89
25.46 2.03 1.70
3:-z 13188
1981 w-w_
1983 w-w_
3052 2.59
36.99 1.67 2.46
3:-z lo:99
1984 m__m
2937 2.47
36.74 2.11
1985 w--w
3160
J-Z 1:55 2.50
1986 -w-m
3227 2.29
36.10 1.67 1.92 1.18
33.41 18.45
NUMBER OF EXAMINEES % OF TOTAL EXAUINEES X UHO ARE FEUALE % WI0 ARE BLACK X WI0 ARE HISPANIC X UHO ARE ASIAN AUERICAN X PURSUING DOCTORATE X OLDER THAN 30
2928 2.01
33.57
::g
c-z 9165
2670 2.07
1.01 32.18 15.96
GRE GRE GRE
494 554 550
489 548 546
VERBAL UEAN 480 478 478 QUANTITATIVE HEAN 549 553 556 ANALYTICAL WEAN 531 532 540
MALES ONLY -_-_____________w_.
*
YEAR OF GRE
________________________________________~_~_ 1978 1980 -w-w _m__
NUMBER OF EXANIWEES 2193 2398 X OF TOTAL EXAMINEES 1.37 1.40 % UHO ARE BLACK 2.05 2.00 % UHO ARE HISPANIC 2.09 % UHO ARE ASIAN AUERICAN ‘o:z 0.92 % PURSUING DOCTORATE 35.70 34.57 % OLDER THAW 30 8.40 16.97 GRE VERBAL MEAN 468 668 GRE QUANTITATIVE REAN 552 549 GRE ANALYTICAL UEAN 523 510
m m --_-____ 1981 w-w_
1930 1.32 2.07 2.85
350-z 12136
468 552 519
t--_______ 1982 e--w
:g
::it
340-z 12111
471 556 519
e_________
1986 w--w
2044 1.45 1.86
________ 1987 e--m.
1912 1.28 2.14 2+-J?
3i 21
ii3 539
I_-______---__-___
1984 1985 e___ mm__
1849 2007 1.56 1.50 2.16 1.69 2.49 3.09
3titi 16149
3s 19:10
478 562 553 542 536
1983 m-m_
1916
::: 3.08
320-z 14137
477 560 525
FEUALES OWLY __________a-________
l
YEAR OF GRE
‘--------------------------------------~-~~~~~~~~~---~~~~~~~~~~~~~
1981 1982 1983 1984 1985 1986 1987 w-m_ -ww_ _-we me-_ w-we w-w_ mm-_
0% 0% 0.96 1129 0.91 1079 0.85 1138 1165 0.76 1125
:-2 0161
2108 1.73 :-!i 1:42
2.04 1.85 :*: 1141
!:fZ 1.37 2.76 2.84 1.50 1.30
38.86 35.80 30.20 30.40 31.28 3;.z 3z 4.10 4.88 5.35 8.22 10.18 13:20 14:88
498 503 507 505 503 z: 558 545 550 565 540 563
z: 563 533
;iz 566 560
NUUBER OF EXARINEES % OF TOTAL EXAUINEES X UBO ARE BLACK % UHO ARE HISPANIC % UHO ARE ASIAN AUERICAN % PURSUING DOCTORATE X OLDER THAN 30 GRE VERBAL MEAN GRE QUANTITATIVE MEAN GRE ARALYTICAL UEAN
* DATA FOR 1979 NOT AVAILABLE
74

TABLE 3.6
TRENDS TABLE.FOR U.S. CITIZENS UITH UNDERGRADUATE MAJOR IN SOCIAL SCIENCES
MALES AND FEMALES -__________________-----
l
YEAR OF GRE
~~~~~~~~~~~~~~~~~~~~~~~~~~~~~~~~~~~~~~~~~~~~~~~~~~~~~~~~~~~~~~~~~~~~~~~~~~~~~~~~~~~ 1978 1980 1981 1982 1983 1984 ____ _-MM -w-m ____ ____ -_-_
NUMBER OF EXAMINEES 41789 46499 37764 32725 27420 27712 X OF TOTAL EKAMINEES 26.13 27.07 25.88 25.42 23.28 X UHO ARE FEMALE 53.20 49.68 55.65 55.88 56.06 :=z X WHO ARE BLACK 7.76 8.05 7.69 7 82 7112 X WI0 ARE HISPANIC 3.11 3.20 3.21
;z 3177 3.91
X WHO ARE ASIAN AMERICAN 1.31 1.33 1.54 1167 X PURSUING DOCTORATE 48.16 48.65 z-z 50.54
Skz 1.71
21147 51 .?D
X OLDER THAN 30 13.52 22.15 20.64 22.41 GRE VERBAL MEAN 513 518 511 508 513 515 GRE QUANTITATIVE WEAN 502 500 502 507 505 GRE ANALYTICAL BEAN
zz 517 525 514 522 530
m___w________
1985 ___a
31005 23.20 57.37
6.43 4.01 1.80
so.??
"5:
:!i
_______ 1986 ____
33152
g=: 6:03 3.76 1.87
51.43 24.62
517 509 537
e___m___
1987 __a_
35814 24.06 57.82
6.16 3.80 1.87
52.60 24.81
516 508 536
BALES ONLY __________----------
l
YEAR OF GRE
~~~~~_~~~~~~~~~~~~~~~~~~~~~~~~~~~~~~~~~~~~~~~~~~~~~~~~~~~~~~~~~~~~~~~~~~~~~~~~~~~~~~~~~~~~~~~~~~~~~~~~~~~~~~~~~. 1978 1980 1981 1982 1983 1984 1985 1986 1987 ___w w-m_ a__- -___ __w_ __m_ m-w_ ___w __a_
NUMBER OF EXAMINEES 19304 23lD4 16533 14094 11944 11866 13097 13911 14956 % OF TOTAL EXAUINEES 12.07 13.45 11.33 10.95 10.14 9.80 9.85 10.05
X UHO ARE BLACK 6.21 6.63 6.08 6.24 6.34
5-z
4.82 X UHO ARE HISPANIC 3.45 3.38 3.39 3.83 3.94 4126 ;:ii 4.03 ZZ % UHO ARE ASIAN AMERICAN 1.35 1.18 5:-Z! 1.56 1.57 1.65 1.81 1.65 % PURSUING DOCTORATE 52.37 52.96
19152 53.58
5:.z 54.42 52.80 53.76 55.12
X OLDER THAN 30 12.42 23.43 20.51 21:78 23.33 23.59 25.90 25.M GRE VERBAL UEAN 516 518 517 514 521 525 521 527 527 GRE WANTITATIVE UEAN z zt 527 528 532 531 535 533 GRE ANALYTICAL BEAN 528 514
zi 537 537 540 539
FEUALES ONLY mwe_w_______________
*
YEAR OF GRE
________________________________________--~~--. 1978 1980 ___a w_e_
NUMBER OF EXAUINEES 22232 23100 X OF TOTAL EKAUINEES 13.90 13.45 X UHO ARE BLACK 9.10 9.46 X UHO ARE HISPANIC 2.82 3.03 X UHO ARE ASIAN AMERICAN 1.28 1.49 X PURSUING DOCTORATE 44.54 44.35 X OLDER TBAN 30 14.42 20.81 GRE VERBAL MEAN 510 519 GRE WANTITATIVE UEAN GRE ANALYTICAL BEAN t; :;
.-e_____
1981 ___w
21015 14.40 8.95 3.10
2:: 19.14
i: 523
_m_m_____-
1982 ____
18287 14.20
0-z 1176
48.29 20.66
503 482 515
____________ 1983 w-m_
15312 13.05 8.96 3.64
4;-tii 21114
507
____a____.
1984 -m-w
15710 13.23 8.40 3.65-
4;=: 21:65
2: 524
1985 ____
17787 13.31 7.31 4.10 1.92
49.29 22.65
506
iii
1986 -we_
19133 13.55 6.91 3.55 1.92
49.?3 23.65
510 490 534
_-a___
1987 w-w_
20709 13.91
xi 2103
50.78 24.08
2: 533
l
DATA FOR 1979 NOT AVAILABLE
75
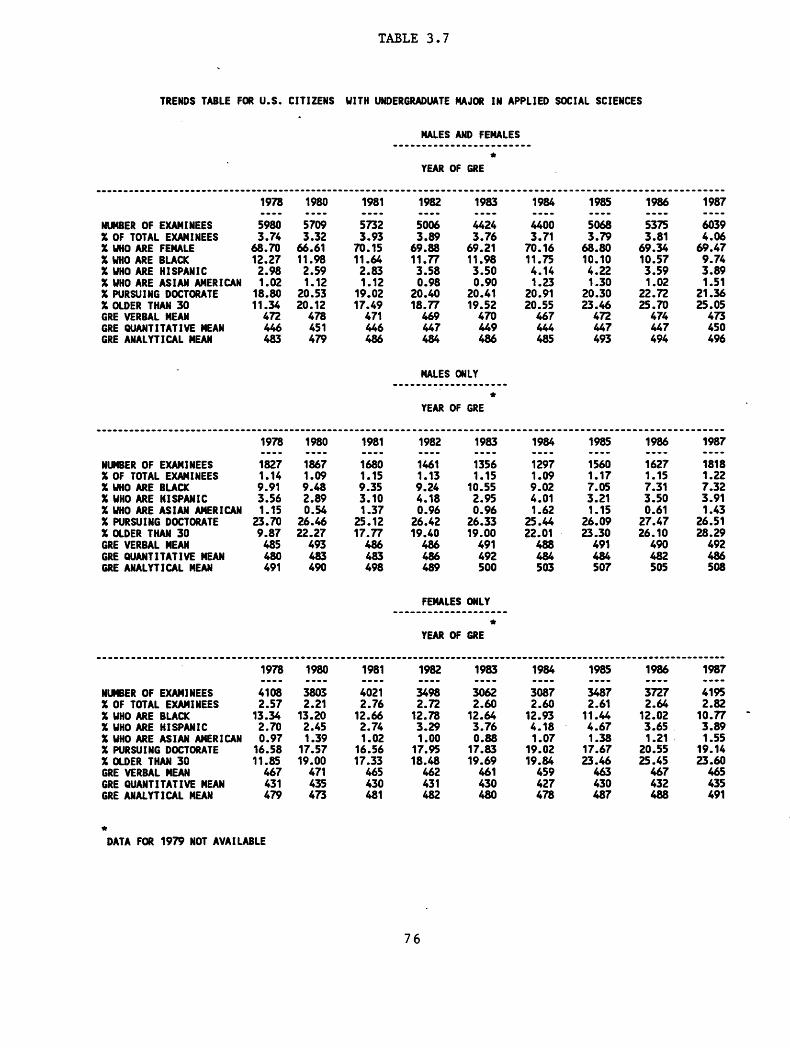
TABLE 3.7
TRENDS TABLE FOR U.S. CITIZENS UITH UNDERGRADUATE MAJOR IN APPLIED SOCIAL SCIENCES
MALES AND FEUALES _____________.______----
*
YEAR OF GRE
____________________-~~~~~~~~~~~~~-------------~~~~~~~~~~~~~~~~~~~~~~~~~~~~~~~~~~~~~~~~~~~~~~~ 1970 1900 1981 1982 1983 1984 1985 ---- - --- ---- ---_ _ ___ ___ _ ____
NLMBER OF EXAMINEES 5980 5709 5732 5006 4424 4400 X OF TOTAL EXAUINEES 3.74 3.32 3.93 3.09 3.76 3.71 3? X WI0 ARE FEMALE 68.70 66.61 70.15 69.88 69.21 70.16 68:00 X WHO ARE BLACK 12.27 11.98 11.64 11.77 11.98 11.75 10.10 X UHO ARE HISPABIC 2.98 2.59 2.03 3.50 3.50 4.14 4.22 X UHO ARE ASIAN AUERICAN 1.02 1.12 1.12
2oo:g 0.90 1.30
XPURSUING DOCTORATE 10.00 20.53 19.02 20.41 2z 20.30 X OLDER THAN 30 11.34 20.12 17.49 18.77 19.52 20155 23.46 GRE VERBAL MEAN 472 470 471 469 470 467 472 GRE QUANf1lATIVE BEAN 446 451 447 GRE ANALYTICAL BEAN 479 tit ziii z z
UALES ONLY ___________________a
*
YEAR OF GRE
____________________~~~~~~~~~~~~~~~~~~~~~~~~~ 197a 1980 a___ _-mm
NUMBER OF EXABINEES 1827 la67 X OF TOTAL EXANINEES 1.14 1.09 X UHO ARE BLACK 9.91 9.48 X UHO ARE HISPANIC 3.56 2.89 X UHO ARE ASIAN AMERICAN 1.15 X PURSUING DOCTORATE 23.70 2:z X OLDER WAN 30 9.07 22.27 GRE VERBAL MEAN 485 493 GRE OUABfITAlIVE BEAR GRE ANALYTICAL WEAN z! iii
NUMBER OF EXAMINEES X OF TOTAL EXAUINEES X UHO ARE BLACK X UHO ARE HISPANIC X UHO ARE ASIAN AMERICAN X PURSUING DOCTORATE X OLDER THAN 30 GRE VERBAL BEAN GRE OUARTITATIVE MEAN GRE ANALYTICAL UEAN
4108 3803 2.57 2.21
13.34 13.20 2.70 2.45 0.97 1.39
16.58 17.57 11.85 19.00
467 471 431 435 479 473
__________- 1981 ----
1680 1.15
I___________________-~~~~~-~
1982 1983 1984 ---- ---- ----
1461 1356 1297 1.13 1.15 9.24 10.55 ;-ii 4.10 2.95 4101 0.96 0.96 1.62
26.42 26.33 25.44 19.40 19.00 22.01
486 491 488
iit 492 500 484 503
FEMALES ONLY ____________________
*
YEAR OF GRE
---_-_-__--___-___--_ 1981 19a2 ---- ---e
4021 3498 2.76 2.72
12.66 2.74 1.02
16.56 17.33
465 430 481
12.78 3.29
r:=: 10:48
462 431 482
.________----_-- 1986 1907 ---- ----
5375 6039 3.81
69.34 6;:: 10.57 9.74 3.59 3.09 1.02 1.51
22.72 21.36 "Z 25.05
ii47 :z 4%
____________________-- 1985 1986 ---- ----
1560 1627 1.17 1.15
37:: 7.31 3.50
1.15 0.61 26.09 27.47 23.30 26.10
491 490
507 505
__-___ 1987 ----
1818 1.22 7.32 3.91 1.43
26.51 28.29
492
____________________-~~~~~-~~~~--~~~-~~--~-------- 1983 1984 1985 1986 1907 ---- ---- ---- ---- ----
3062 3087 3407 3727 41% 2.60 2.61 2.64
12.64 1:-t! 11.44 12.02 1f-E - 3.76 4118 4.67 3.65 3:89
19:69 1SZ 1.07
19.84 19.02 23146 r:-zf 1.21 1.55
25.45 20.55 23.60 19.14
461 459 FO 467 430 427 432 ii; 480 478 487 491
l
DATA FOR 1979 NOT AVAILABLE
76

TABLE 3.8 ’
TRENDS TABLE FOR U.S. CITIZENS UITH UNDERGRADUATE MAJOR IN HEALTH SCIENCES/SERVICE
HALES AND FEMALES __________________------
l
YEAR OF GRE
___________________-_______________ 1978 _a__
NUMBER OF EXAHINEES 13434 X OF TOTAL EXAMINEES 8.40 X UHO ARE FEMALE 87.09 % WHO ARE BLACK 5.54 X UHO ARE HISPANIC 1.40 % UHO ARE ASIAN AUERICAN 1.31 % PURSUING DOCTORATE 24.49 % OLDER THAN 30 21.76 GRE VERBAL MEAN 484 GRE GlJANTITATIVE MEAN GRE ANALYTICAL MAN
__--a_-__-
1984 _a__
i8z 89138
4.69 2.16 1.58
s_____-_
1985 ____
11216 8.39
88.92 4.96 1.80
_________---_ 1983 ____
10069 8.55
88.22 4.85 1.65
2::z 35.73
__________m_______
1986 1987 m___ -a--
11462 11800 8.12 7.93
88.81 88.66 4.57 4.75 1.68 1.97 1.61 1.97
25.00 43.53 Z:ii
zt z 508
___-__a___
1980 e-e_
12722 7.41
83.97
:-ii 1152
24.63 32.15
---____-_____---- 1981 1982 ewe_ w-w_
12595 11416 888:: 87.66 8.87
5.01 4.94 1.56 1.66 1.57 1.49
24.61 24.79
29.18 31&7
509 502
1.35 22.87 39.63
22.68 37.57
481 484 SD6
484 512
KALES DNLY ____________-__-__--
*
YEAR OF GRE
1978 W-M-
1655
:-iii 3:08 2.05
48.28 14.37
490
Ki
1980 w-m_
1712
1981 v--w
1423 0.98 2.60 2.25
1982 ____
1326 1.03 3.47 3.39 2.56
49.62 24.20
493
1983 _a__
1147 0.97
::3": 2.01
46.12 26.87
494
zii
1985 ___m
1201
s-z 4:00
4~-~ 32118
4% 552 535
1987 w-w_
1291 0.87
NlHBER OF EXAUINEES % OF TOTAL EXAMINEES % UHO ARE BLACK X UHO ARE HISPANIC % UHO ARE ASIAN AMERICAN X PURSUING DOCTORATE X OLDER THAN 30 GRE VERBAL MEAN GRE GUANTITATIVE BEAN GRE ANALYTICAL MEAN
f :Z 3.02 3.02
2:: 35.15
490 541 527
2.11 51.09 23.08
493
4::zi 29.61
4% 550 532
5f-E 23169
550 555 556 514 528 519
FEMALES ONLY ___~________~-~~___-
l
YEAR OF GRE
198D 1981 m-a-
11088
T-: 1147 1.50
21.22 29.92
481
ii?
1983 1984 1985 1986 1987 a___ _-mm -m-w -w-w e-w_
5:09 f8fi
8791 9973
:-:
2:01
s-x
1154
'KY 4171 'Yti 4197
1.44 1.51 1.19 1.55 1.26 21.47 20.16 20.40 2:s
:::
36.88 38.43 40.45 44.36 zi 478 482 481 i76 478 476 476 477 472 506 503 509 508 506
__mw
10937 6.37 5.80 1.29
NUMBER OF EKAMINEES % OF TOTAL EXAHINEES X UBO ARE BLACK % UHO ARE HISPANIC % UBO ARE ASIAN AMERICAR X PURSUING DOCTORATE X OLDER THAN 30 GRE VERBAL MEAN GRE QUANTITATIVE UEAN GRE ANALYTICAL BEAN
11700 7.32 5.72 1.17 1.20
21.09 22.74
483
* DATA FOR 1979 NOT AVAILABLE
77

TABLE 3.9
TRENDS TABLE FOR U.S. CITIZENS UITH UNDERGRADUATE MAJOR IN EDUCATION
NUUBER OF EXAMINEES X OF TOTAL EXARINEES X b/HO ARE FEUALE X UHO ARE BLACK X WI0 ARE HISPANIC X UHO ARE ASIAN AUERICAN X PURSUING DOCTORATE X OLDER THAN 30 GRE VERBAL MEAN GRE QUANTITATIVE UEAN GRE ANALYTICAL UEAN
1978 ----
25229 15.78 76.02
8.28 2.92
2zz 25110
436
z:
____________________-~-~--------- 1978 ----
NUUBER OF EKAMINEES 5869 X OF TOTAL EXAMINEES 3.67 XUHOARE BLACK 7.33 X UHO ARE HISPANIC 3.49 X UHO ARE ASIAN AMERICAN 0.58 X PURSUINGDGCTORATE 31.98 X OLDER THAN 30 24.36 GREVERBAL MEAN 431 GRE GUANTITATIVE MEAN GRE ANALYTICAL MEAN
1980 ----
26783 15.59 74.88
9.39 2.76 0.57
20.40 36.45
438 439
. 452
42.71 431
z
1981 ----
21795 14.93 76.70
7.49 3.19 0.65
20.71 34.01
439
z:
______ 1981 ----
4920 3.37 6.40 4.37 0.51
31.42 36.01
433
z:
1982 ----
18171 14.11 76.58
8.01 3.79
ti-$t 36169
437 442 462
MALES GNLY --------------------
*
YEAR OF GRE
1984 ----
17762 14.96 78.14
6.31 3.38 0.74
21.65 36.99
441
z
________------ 1982 ----
iDti 6173 4.40
3:.z 39126
435
tg
________________ 1983 1984
---- ---- 3611 3.07 Z7Z 6.45 5:72 4.10 3.82
39126 3:.z 0.74
42.37 32.46
436 441
474 460 t:
1985 ----
20438 15.29 79.02
6.30 3.75 0.74
19.84 40.26
439 443 474
_________--- 1985 ----
4177 3.13
::Z
3s &a
439
tz
1986 ----
20336 14.40 78.77
0.92 21.42 42.92
445 450 478
1986 ----
i2z 5147 3.33
302': 48:49
z 473
1987 ----
20935 14.07 78.68
5.87 3.23
21-: 44:15
izi! 478
1987 ----
4366 2.93
z-5 1142
32.00 48.90
tit 474
FEUALES DNLY --------------------
+
YEAR OF GRE
_~~~~~~~~~-~~~~~~~~~~~~~~~~~~~~~~~~~~~~~~~~~~~~~~~~~~~~~~~~~~~~~~~~~~~~~~~~~~~~~~~~~~~~~~~~~~~~~~~~~~~~~-------- 1918 1980 1981 1982 1983 1984 1985 1986 1987 ---- ---- ---- ---- ---- ---- ---- ---- ----
NLMBER OF EXAHINEES 19178 20056 16716 13914 13511 13879 16150 16019 16472 X OF TOTAL EKAMINEES 11.99 11.68 11.45 10.81 11.47 11.69 12.09 11.35 11.07
X WHO ARE BLACK 8.59 9.71 7.81 8.39 7.28 6.47 6.54 X UHO ARE HISPANIC 2.72 2.49 2.85 3.62 3.29 3.28 3.70 36:: ::it X WI0 ARE ASIAN AMERICAN 0.79
18:Z 0.67 0.66 0.74 0.74 0.97
X PURSUING DOCTORATE 17.0s 17.60 19.12 l?Z 18.68 17.08 1x-g 18.20 XOLDER THAN30 2ml_ 34-2; 33.34 35.82 34104 35.39 39.09 41:40 42.81
GRE VERBAL MEAN 440 438 439 440 439 GRE QUANTITATIVE UEAN 433 432 434 434 iii z 2:
iii iii GRE ANALYTICAL UEAN 461 456 479 479
* DATA FOR 1979 NOT AVAILABLE
78

TABLE 3.10
TRENDS TABLE FOR U.S. CITIZENS UITH UNDERGRADUATE UAJOR IN BUSINESS/PUBLIC ADUINISTRATION
MALES AND FEMALES ------------------------
*
YEAR OF GRE
-------------------------------------- -------------------------------------------------------------------------
1978 1980 1981 1982 1983 1984 1985 1986 1987 ---- ---- ----
5819 ----
---- ---- ---- ---- ----
NUMBER OF EWINEES 6181 z
5078 4615 4399 4913 5129 5832 X OF TOTAL EKAMINEES 3.87 X WI0 ARE FEMALE 37.60 32172 403.z 4i.g
3.92 3.71 3.92 43.62 44.12 4z 4i.t 49.11
X UHO ARE BLACK 12.15 12.25 12:08 11:95 12.70 10.96 lo:65 11:02 11.45 X WHO ARE HISPANIC 2.94 3.07 2.56 3.76 3.27 4.43 3.85 3.43 3.89 X UHO ARE ASIAN AUERICAN 1.49 1.23 1.31 1.50 1.45 1.51 1.31 1.85 XPURSUING DOCTORATE 21.02 22.13 21.33 20.70 21.32 2i.g
32:9? 22.06 24.49 23.34
X OLDER THAN 30 2oiz 33*89
28.18 29.09 29.42 32.10 34.41 34.47 GRE VERBAL MEAN 456 458 457 457 460 GRE GUANTITATIVE MEAN 501 501 501 GRE ANALYTICAL MEAN z
499 4% 496 481 492 489 iif 503 504 fzi 506
UALES ONLY --------------------
*
YEAR OF GRE
--------------------------------------------------------------------------------------------------------------
1978 1980 1981 1982 1983 1984 1985 1986 1987 ---- ---- ---- ---- ---- ---- ---- ---- ----
NUMBER OF EKAMINEES 3810 4466 zi
2954 X OF TOTAL EXAMINEES 2.38 2.60
9:31 2.29 225;
2436 2571 2628 2940
8176 2.05
:-ii i.: 1.98
X UHO ARE BUCK 8.69 8.71 8.50 8.21 8.61 X UHO ARE HISPANIC 2.94 3.05 3.02 3.76 3.61 4.23 3:97 3142 4.08 X UHO ARE ASIAN AMERICAN 1.31
23.12 2::: 1.14 1.39 1.43 1.68 1.32 1.22
X PURSUING DOCTORATE 23.37 22.61 23.30 X OLDER THAN 30 21.85 36.03 30.69 31.88 32.45 GRE VERBAL MAN 459 460 462 461 464
g 25.17 28.12 2;s 34.59 38.46
471 37i5: GRE QUANTITATIVE MEAN 521 520 GRE ANALYTICAL MEAN 4% 489 z z
521 520 g 522 521 495 507 512 512 511
FEMALES ONLY --------------------
*
YEAR OF GRE
--------------------------------------------------------------------------------------------------------------
1978 1980 1981 1982 1983 1984 1985 1986 1987 ---- ---- ---- ---- ----
2013 iii;
---- ---- ----
NUMBER OF EXAMINEES 2324 2074 2322 2483 2864 X OF TOTAL EXARINEES 1.45 21w PZ 1.27
15:9B 1.61 1.71 1.63 1.74 1.76 1.92
X UHO ARE BLACK 17.90 19.66 16.83 17.69 14.32 13.57 14.18 14.49 X UHO ARE HISPANIC 2.97 3.16 1.94 3.86 2.83 4.69 3.70 3.42 3.67 X UHO ARE ASIAN AMERICAN 1.68 1.78 1.52 1.69 1.49 1.41 1.89 X PURSUING DOCTORATE 17.51 18.06 18.30 18.03 18.73 1X 1Zi 20.66 19.83 X OLDER THAN 30 18.62 29.36 24.48 24.89 25.48 28176 29130 30.12 31.56 GRE VERBAL MAN 451 448 453 451
iii 457 451 456
GRE OUANTITATIVE MAN 462 GRE ANALYTICAL MEAN iti 467 :z
471 493 493 :z 2
iii 471 504 502
*
DATA FOR 1979 NOT AVAILABLE
79

TABLE 4.1
TRENDS TABLE FOR U.S. CIlI2EN.s UIfH SAUE UGRAD. 8 GRAD. MAJOR: ARTS/HUMANITIES
MALES AND FEUALES __--____-__-_____-__----
YEAR OF GRE *
NUMBER OF EXAMINEES X OF TOTAL EXAHINEES ** X WI0 ARE FEUALE % YHO ARE BLACK % b/HO ARE HISPANIC X UHO ARE ASIAN AMERICAN X PURSUING DOCTORATE % DLDER THAN 30 GRE VERBAL MEAN GRE WTITATIVE WEAN GRE ANALYTICAL MEAN
.____________________~_~~~~_~~~~~~~_~~ 1978 1980 1981 1982 ---- ---- ----
16106 18222 14668 ---- 13009 63.04 63.63 63.15 64.52 51.53 51.37 52.73 52.57
3.39 3.83 3.31 3.24 2.28 2.39 2.40 2.71 1.20 1.11 1.19
39.51 42.14 38.89 3i.z 10.10 17.10 15.56 16:62
542 547 535 531 502 503 533 527 i:
505 527
________--__-____ 1983 1984 ---- ----
11651 11726
g.97 3:13
g.: 3:00
2.82 3.15 4::z! 43.05 1.52
17.50 19.05 541 541 510 510 533 541
UALES ONLY _______~___~_~_~~___
YEAR OF GRE *
------_----_______---~~--~----~~~-~~---~~~~~~. 1978 1980 ---- ----
NUUBER OF EXAUINEES X OF TOTAL EXAUINEES ** 7iii?ii f; X UN0 ARE BLACK 2109 X UHO ARE HISPANIC 2.34 2147 X WHO ARE ASIAN AMERICAN 1.14 0.82 X PURSUING DOCTORATE 43.55 46.05 X OLDER TNAN 30 7.65 16.27 GREVERBAL MEAN 540 545 GRE GUANTITATIVE MEAN 527 527 GRE ANALYTICAL MEAN 534 530
-~~~~~~~~~~~~~-~~~~~~~~~~~~~~~~~~~~~ 1978 ----
NIHBER OF EXAhINEES 8321 X DF TOTAL EXMINEES m 55.89 X UHO ARE BLACK 3.88 X MT0 ARE HISPANIC 2.21 X WI0 ARE ASIAN AUERICAN 1.41 XWRSUINGDDCTORATE 35.85 X DLDER TNAN 30 12.28 GRE VERBAL MEAN 543 GRE WANTITATIVE UEAN GRE ANALYTICAL MEAN
--____-__ 1980 ----
5z3t 4124 2.33 1.39
38.53 17.90
550 481 525
--_______- 1905 ----
13544 65.80 52.89
3.09 2.70 1.67
41.80 20.39
540
55z
._-___-__---___------~-~~~~~--~~-~~~---- 1981 1982 1983 1984 ---- ---- ---- ----
6853 5505 73.51 73.10 3.49 2.91 2.29 3.05 0.96 1.19 1.17 1.45
i.; . 42.13 14.26 43.20 15.98 43.42 17.84 532 529 521 530
z 539 535
531 527 531 545
FEUALES DNLY --------------------
YEAROF GRE *
-___-_____________ 1986 1907
---- ---- 14373 15322 65.09 64.09 53.73 53.97
2.65 2.98 5:ii
4z! 22137
4i.z 22:38
547 511 z: 547 547
---_------_-___--___-~~~~ 1985 1986 1987 ---- ---- ----
6330 6500 6989 73.71 72.84 72.82
3.08 2.57 2.73 3.20 z-: 4:s
10157
47.34 1.41 40.10 1145
20.85 20.90 537 532 zii zz 545 549 549
~~~~~~~~~~~~~~~~~~~~~~~~~~~~~~~~~~~~~~~~~~~~~~~~~~~~~~~~~~ 1981 1982 1983 1386 1985 1986 ---- ---- ---- ---- ---- ----
5z7z 3115
58.55 6819 59.29 6165 58.83 6176 60.19 7164 5z 3.43
5:: 306 3:25
3 10 2.48
36197 t.; 2'83
40.49 1:88 f.zf
3tii
17103
40.50 1.57 42.78 1.59 42.76 1176
10.55 10.72 20.03 21.93 23c65 537 533 545 543 $5. 549
490 489 491 532 526 535 538 540 544
_--__-- 1987 ----
5:; 3.01 3.30
4f.; 23;;;
493 547
DATA FOR 1979 NOT AVAILABLE 8e
IN THAT UNDERGRADUATE UAJDR
80

TABLE 4.2
TRENDS TABLE FOR U.S. CITIZENS WITH SAHE UCRAD, 8 GRAD. UAJDR: PHYSICAL SCIENCE/CUTH
MALES MD FEUALES ______________________~~
YEAR OF GRE *
1978 1980 .-.w
530
WM._
537
10437 10497 73.52
648
69.85
658
25.94 24.60 3.03
586
3.12
586
2.20 1.43 2.14 2.05
49.74 53.67 4.25 9.33
1981 -_w.
10065 74.22 28.71
3.09 2.15 2.52
48.03 7.34
533
&f!i
1982 -m-m
10043
ix! 3:23 2.24 2.54
46.56 8.38
528
zfi
1983 -e-w
10842
z.ii 3:21 2.64
z.: 9110
531
iii
1984 w-m.
10730 78.43 29.41
3.18 2.73 2.93
47.44 9.65
534
it;
1985 V.-m
11588
z.: 3124 2.58
437.; lo:25
528
iii
1986 1987 m-w. _-.a
12132 11894 76.13 74.19 30.00 28.98
3.75 3.99 2.37 2.94 4.24 4.45
48.85 51.49 11.47 12.09
528 530 652 654 612 615
NUMBER OF EXAUINEES
GRE
X OF TOTAL EXAUINEES **
VERBAL UEAN
X UHO ARE FEUALE X UHO ARE BLACK X UHO ARE HISPANIC
GRE
X UHD ARE ASIAN AMERICAN
QUANTITATIVE UEAN
X PURSUING DOCTORATE X OLDER THAN 30
GRE MALYTICAL UEAN
UALES ONLY _--__________-____--
YEAR OF GRE *
1978 1980 Wm.. w-w_
7667 76.15 nm2; 2.47 2136 1.87 1.17
5::: 5:::
1981 w-w.
7116 76.24
2.35 2.01
5::zz
1982 -mm_
7z 2122 2.06
4;.z 7193
531 653 586
1983 _w..
872 2122 2.60 2.52
48.59 8.92 9.14 9.79
535 538 532
1984 1985 _w_. -v-w
7529 8062 80.88 79.85
2.43 2.53 2.42 2.34 2.58 3.35
50.44 51.10
1987 . Wm._
8407 77.71
2.76 2.87 *
NWBER OF EXAMINEES X OF TOTAL EXAMINEES ** X UHO ARE BLACK X UHO ARE HISPANIC X UHO ARE ASIAN AMERICAN X PURSUING DOCTORATE X OLDER THAN 30 GRE VERBAL UEAN GRE QUANTITATIVE WEAN GRE ANALYTICAL WEAN
3.59 3.97 52.18 54.24 11.18 12.34
535 536 4.05 9.43 6.91
532 539 537 658 656 586 z 589
652 587
658 611
655
FEMALES ONLY _--_____-a___--____-
YEAR OF GRE l
1978 --we
2707 67.07
4.62 3.21
4t.z 4177
526 621 587
1980 w-w_
6:5ii 5138 2.25 2.67
42.87 8.74
530 629 585
1981 1982 1983 -w_- a___
7:: 74.07 3062
;:ii 5.72
392'z i.z
9129 38:57 9.50 522 523 617 619 5% 597
1984 1985 1986 a-__
7fz 6138 2.75
4:s 12:12
514 629
-a__
6:z 4198 2.49 3.22
38.89 8.36
524 617 584
__a_
3156 73.11 4.91 3.52
4i.: lo:86
525 622 604
ma_-
3493
7% 3:12 4.29
40.74 11.32
519 625 608
NUUBER OF EXAUINEES X OF TOTAL EXAUINEES * % UHO ARE BLACK X UHO ARE HISPANIC X UBO ARE ASIAN AMERICAN X PURSUING DOCTORATE X OLDER TNAN 30 GRE VERBAL UEAN GRE QUANTITATIVE UEAN GRE ANALYTICAL UEAN
3.08 5.57
44.79 11.42
516 632 615
DATA FOR 1979 NOT AVAILABLE **
IN THAT UNDERGRADUATE MJDR
81

TABLE 4.3
TRENDS TABLE FOR U.S. CITIZENS UITH SAME UGRAD. & GRAD. MAJOR: ENGINEERING
~~~~~~_~~~~~~~~~~_~_~~--~~~~~~~~~~~~~~~~~~~~ 1978 1980 mm-- m---
NUMBER OF EXAMINEES 6021 5661 X OF TOTAL EXAMINEES ** 79.28 76.89 X YHO ARE FEMALE 11.38 8.18 % UHO ARE BLACK 2.42 2.33 X UHO ARE HISPANIC 3.60 3.44 % UHO ARE ASIAN AUERICAN 5.65 5.19 X PURSUING DOCTDRATE 26.86 28.23 X OLDER THAN 30 4.63 12.06 GRE GRE GRE
-__--__ 1981 w-w-
6114 80.69 11.79
3.19 3.45
2z 7109
UALES AND FEUALES --______________________
YEAR OF GRE *
-~~~~~~~~~~_~~~~~~~~~~-~~~~~~~~~~~~~~~~~~~~ 1982 1983 1984 1985 ---m -w-m
---- ---- ay9: 13167
82.09 7217 82.07 7852 ai?: 15.19 15.13 15138
3.30 2.65 3.65 3.64 ::z f-zt 7.11 6.15 7124
28.58 28.85 2tii 29.16 7.33 7.46 a:90 a.33
1986 w-w-
10084 82.22 16.63
2.80 4.07 8.31
28.24 9.09
I_____
1987 -e-w
10652 81.34 16.44 3.55 4.20 9.45
28.36 9.54
VERBAL MEAN 515 516 514 513 525 522 516 517 513 QUANTITATIVE UEAN ANALYT I CAL UEAN zi it: t: :: z 613 z it!; it!
-~~~~~-~~-~~~~~~~~-~~~~~-~~-~~~~~~~. 1978 m--w
NIMBER OF EXAWNEES 5304 % OF TOTAL EXAMINEES * 79.02 % UHO ARE BLACK 2.11 X UHO ARE HISPANIC 3.70 % UHO ARE ASIAN AMERICAN 5.37 X PURSUING DOCTORATE 26.49 % OLDER THAN 30 5.03 GRE VERBAL MAN 512 GRE QUANTITATIVE MEAN GRE ANALYTICAL MEAN
-__--_______________---~----~--~~~~~ 1978 _---
NUMBER OF EXAMINEES X OF TOTAL EXAUINEES ** B16$ X UHO ARE BLACK 4196 X UHO ARE HISPANIC 2.92 % UHO ARE ASIAN AMERICAN 7.88 % PURSUING DOCTORATE 29.78 % OLDER’ THAN 30 GRE VERBAL BEAN li:; GRE QUANTITATIVE BEAN 676 GRE ANALYTICAL UEAN 612
I_______
1980 ----
5170 77.28
2.15 3.48 5.15
28.05 12.79
512
st
---_m--___-________
1981 1982 ---- w-w-
5351 5471 80.56 82.77 3.06 3.03 3.61 3.75 5.29
27.96 2::: 7.80 8.14
511 510
tz iii
m m _ _______m_________
1983 1984 _-we m---
6105 6626 81.89 82.36
$:Z i-z 6.01 6:85
28.40 29.97 a.23 9.72
521 519
tii z
____-____ 19aD _--w
n4i 4154 3.02
305-z 3:w
561 679 613
_____________________~~~_~~~~~ 1981 1982 1983 w-w_ w__m _B_W
8E 4:20 3.28
2s"z lb2
2:-z 2143
539 532 673 671 676 617 631 634
1984 m--w
1188 80.38
5.89 4.04
+:; . 539 671 637
1985 1986 -___ -_-w
7498 8387 82.32 83.15
2.41 2.36 3.77 3.86 7.03
28.90 2~-~ 9.13 9:90
513 516
iti 689
__ --___- 1987 -m-w
8859 81.92
t-z 9:20
20.49 10.34
511
tit
---_----__-_________-~~~~~~~ 1985 1986 1987 --a- m_-- -_--
1369 1677 1751 81.34 77.89 78.87
5.41 4.95 6.05
4.31 5.13 8.55 1i:E 30.17 2'7~it
_ 5:09 27.41
3.83 5.50 530 522 521 676 676 672 635 634 633
* DATA FOR 1979 NOT AVAILABLE
H
IN THAT UNDERGRADUATE MAJOR
82

TABLE 4.4
TRENDS TABLE FOR U.S. CITIZENS WITH SAME lJGRAD..& GRAD. MJDR: BIOLOGICAL SCIENCES
BALES AND FEUALES ________________________
YEAR OF GRE *
NUMBER OF EXAUINEES X OF TOTAL EXAMINEES - X UHO ARE FEMALE X UHO ARE BLACK X UHO ARE HISPANIC X UHO ARE ASIAN AMERICAN X PURSUING DOCTORATE X OLDER THAN 30 GRE VERBAL BEAN GRE QUANTITATIVE BEAN GRE ANALYTICAL BEAN
1978 _-me
9329 56.05 45.30
3.64 2.80 2.32
55.80 3.97
522 571 560
1980 m_--
11352 59.40 40.28
3.49 2.61 2.07
58.02 8.20
524 574 552
1981 _w_-
8351 55.88 46.82
3.74 3.14 2.36
55.79 6.18
521
z
1982 -M-m
5% 48191
4.13 3.85
s52-: 7104
520
z
1983 _-we
5536 52.67 47.72
4.06 3.92
ski! 7143
521 581 566
MALES ONLY ____________________
YEAR OF GRE *
1984 --_w
5320 51.47 50.7s
t-z 3112
58.83 8.89
518 574 569
1985 -m-m
s:az 48194
4.35 3.83 3.20
59.68 8.56
519 581 577
1986 w--w
4tz 49.69
3.89 4.67 3.89
6i*:z 622 580 578
1987 w-w_
6306 49.89 50.10
3.71 4.71 4.12
z-150 518 578 577
NUMBER OF EXAUINEES X OF TOTAL EXAUI NEES - X UHO ARE BLACK X UHO ARE HISPANIC % UHO ARE ASIAN AMERICAN % PURSUING DOCTORATE X OLDER THAN 30 GRE VERBAL MEAN GRE QUANTITATIVE MEAN GRE ARALYTICAL MEAN
1978 --_w
5052 58.07
2.67 2.69 2.10
59.68 3.10
518 587 557
1980 ____
6:%
;-it 2115
61.11 7.92
518 587 548
1981 1982 _-mm w-w_
4397 3677 58.69 59.67 2.84 3.05 2.84 3.64 2.30 2.20
60.63 60.81 5.50 6.54
520 518 588 589 556 547
1983 -w-w
2% 3:19 3.7s
6% 7137
519 594 556
FEBALES ONLY ___m______e______m__
YEAR OF GRE l
1984 -w-w
sag 3.23 4.26
65:; 9.21
519 590 569
1985 1986 w--w Mm__
2977 3029 54.72 53.43
3.19 3.33 3.53 4.42 3.39 4.03
63.69 65.60 7.70
517
z;
9.41 521 592 573
1987 w-e-
3119 55.09
2.85 4.55 4.07
65.37 9.92
520 594 57s
NUUBER OF EXAMINEES X OF TOTAL EXAMINEES ** X UHO ARE BLACK X UHO ARE HISPANIC X UHO ARE ASIAN AUERICAN X PURSUING DOCTORATE X OLDER THAN 30 GRE VERBAL MEAN GRE QUANTITATIVE UEAN GRE ANALYTICAL WEAN
1978 w___
4220 53.51 4.81 2.87 2.56
51.18 4.91
526 552 564
1980 -_w-
4573 57.10 4.94 2.84
sz 8157
534 555 557
1981 -me_
3910 53.17 4.76 3.48 2.40
so.41 6.87
522 555 561
1982 w--w
3578 54.16
5.03 4.00 2.32
51.62 7.53
523 555 565
1983 -__w
2642 49.68
:.(p3 2199
55.49 7.38
523 567 576
1984 m-e_
2700 49.97
z-z 3137
54.19 8.58
518 559 568
1985 1986 w--m w_--
2872 3013 48.20 46.35
5.50 4.48 4.18 4.95 3.03 3.72
55.57 58.98 9.40 9.19
521 522 565 569 581 583
1987 _w--
3158 45.68
4.59
t-Fi 57150 - 10.61
516
;ti
DATA FOR 1979 NOT AVAILABLE +*
IN THAT UNDERGRADUATE MAJOR
83

TABLE 4.5
TRENDS TABLE FOR U.S. CITIZENS UIfH SAME UCRAD. & GRAD. MAJOR: APPLIED BIOLDGICAL/ENVIRONMEWfAL SCIENCE
UALES AND FEMALES __________-____--_------
YEAR OF GRE l
NUUBER OF EXAMINEES X OF TOTAL EXAMINEES - X UHO ARE FEMALE X UHO ARE BLACK X Vii0 ARE HISPANIC X UHO ARE ASIAN AMERICAN X PURSUING DOCTORATE % OLDER THAN 30
E GRE
1978 1980 -w_- _w--
1944 61.06 6Z 28.09 221%
1.65 2.11 :-; 0.62 1:05
27.31 27.56 4.97 12.60
1981 w--m
1792 61.20 30.52
1.79 2.73 0.84
28.01 7.84
1982 aa--
1629 61.01 28.30
1.90 2.33
1983 w--m
1824 59.76
7-z 2:74
2:.z 8157
MALES ONLY ________________-__
YEAR OF GRE *
1984 m-m-
1763 60.03 33.92
2.21 2.33 0.74
30.01 10.00
491 554 549
1985 --_a
1856 58.73 32.49
1.45 2.86
2x 11:71
482 546 545
1986 ___w
1915 59.34 30.81
1.62
:-: 29:14 14.50
480 543 544
1987 em-_
1751 57.45
3f-z .
ii-z 29175 13.24
482
z
NUMBER OF EXAMINEES X OF TOTAL EXAMINEES +* % UHO ARE BLACK % UHO ARE HISPANIC X UHO ARE ASIAN AMERICAN % PURSUING DOCTORATE % OLDER THAN 30 GRE VERBAL WEAN GRE GIJANTITATIVE MEAN GRE ANALYTICAL MEAN
1978 _w__
1385 63.16
6.03
551 524
1980 __-a
1526 63.64
2.03 2.49
$:Z
15iz: 547 508
1981 m--w
1232 63.83
2.19 3.00 0.81
27.68 9.70
466
z;
1982 w-e-
1147 64-n
2.01 2.27 O-61
27.03 9.71
553 518
1983 a_-_
1204 62.84
1.41 3.32 0.50
27.82 11.25
475 558 528
FEMALES DNLY _____________----__-
YEAR OF GRE l
1984 w___
1160 62.74
2.33 2.67
3;:: 11.37
562 543
1985 w-m_
1246 62.08
1.61 3.37 0.56
31.22 13.82
4n 552 536
1986 _a__
1317 64.43
2.20 2.13
2z 11124
472
zi!
1987 -w-m
1186 62.03
2.02
;*: 30144 14.43
476 552 539
NLMBER OF EKAWNEES X OF TOTAL EXAUINEES - X UHO ARE BLACK X UHO ARE HISPANIC % UHO ARE ASIAN AMERICAN X PURSUING DOCTORATE X OLDER THAN 30 GRE VERBAL WEAN GRE QUANTITATIVE MEAN GRE ANALYTICAL UEAN
1978 --me
56'ii 1128 1.47 1.10
24191 2.22
511 540 554
1980 w--w
459 55.57
0.87 0.44 1.31
24.62 3.30
504
zz
1901 ___w
547 55.65
0.91 2.19 0.91
28.88 3.14
497 537 548
1982 m-w-
53% 1152 2.39 1.30
23-: . 503 547 561
1983 _a_*
616 54.56
1.95 1.62 1.46
22.56 3.43
503
zz
1984 1985 _a_- --mm
555g 2101
52% 1116
1.67 1.82 1.00 1.00
25.08 27.20 7.42 7.49
501 502
;z ;z
1986 w-w_
590 so.64
0.34 1.53 1.36
27.29 8.49
499 533 567
1987 -m*-
495: 3:02 3.02 1.25
28.29 10.63
4% 533 559
* DATA FOR 1979 NOT AVAILABLE
w
IN THAT UNDERGRADUATE NAJOR
84

TABLE 4.6
TRENDS TABLE FOR U.S. CITIZENS WITH SAME UGRAD. & GRAD. MAJOR: SOCIAL SCIENCES
MALES AND FEUALES _-__________________----
YEAR OF GRE *
NLMBER OF EXAMINEES X OF TOTAL EXAMINEES - % UHO ARE FEMALE % WI0 ARE BLACK X UHO ARE HISPANIC X UHO ARE ASIAN AUERICAN X PURSUING DOCTORATE X OLDER THAN 30 GRE GRE GRE
24125 57.73 so.87
7.22 3.16 1.21
62.96 10.08
1980 we_-
26707 57.44 46.88
7.25 3.40 1.24
63.13 17.41
1981 m--e
22349 59.18 53.44
i:;
62176 14.68
1982 w-w-
:?? 54.85
7.00 3.80
62-g 15:50
1983 -v-w
16763 61.13 54.83
7.16 3.78 1.71
64.13 16.03
VERBAL MEAN 519 525 517 512 519 QUANTITATIVE MEAN 508 511 510 516 ANALYTICAL HEAN 532 526 522 531
____-___---_______-________________ 1978 _w--
NUMBER OF EXAMINEES 11712 X OF TOTAL EXAMINEES ** 60.67 X UHO ARE BLACK 5.25 % UHO ARE HISPANIC 3.44 X UHO ARE ASIAN AMERICAN 1.26 X PURSUINGDOCTDRATE 64.65 X OLDER THAN 30 a.46 GRE VERBAL MEAN 523 GRE QUANTITATIVE MAN 532 GRE ANALYTICAL WAN 534
UALES DNLY _--___-___---__-___-
YEAR OF GRE *
_____________-____-_---------------. 1978 w-w_
NWBER OF EXANINEES 12272 X OF TOTAL EXAM NEES ** 55.20 X UHO ARE BLACK 9.09 X UHO ARE HISPANIC X UHO ARE ASIAN AMERICAN to: X PURSUING DOCTORATE 61137 X OLDER THAN 30 11.55 GRE VERBAL UEAN GRE QUANTITATIVE MAN iit GRE ANALYTICAL UEAN 530
_--____________________________ 1980 1981 1982 e-w- -_-e -w-w
14022 10285 8858 60.69 62.21 62.85
5:: ;=z xi 1.21 1:55 1:54
64.42 63.55 64.56 17.95 13.74 14.60
525 523 517 530 535 526 537 zi
____m_____
1983 _e__
7518 62.94
5.71 3.94
6i-z 15157
526 543 531
FEUALES DNLY ~~~~~~~_~_~~~~~~~~~~
YEAR OF GRE *
.~~~~~~~~~~~~~~~~~~~~~~~~~~ 1980 1981 1982 -w-w -m-w mm__
12520 11943 10969 54.20 56.83 59.98
i:: 3'38 a 01 3.74 7.97
6:-z
16174
62.10 1150 63.85 1.71
15.08 16.15 526 513
iii z!; ifi 524
1984 1985 1986 -__w w-w- -w-m
ln42 19284 20365 62.58 62.20 61.43 55.22 55.82 55.89
6.34 5.67 5.17 4.12 4.01 3.86
6:-E 16163
6-C 16k
6:-g la110
519 516 522 514 513 519 538 541 546
m____m____
1984 mm-w
E 4:52 4.49 1.57
65.52 16.47
530 540 545
______a__.
1985 w-w-
EC: 4145 3.88 1.67
62.79 16.7B
525 540
1987 w-m_
22310 62.29 55.87
5.20 3.80 1.87
65.95 18.28
521 517 545
I-_-_---_--____-
1986 1987 _w-- ____
8928 9751 64.18 65.20
4.19 4.37 4.16 3.80
6z
18164
65.11 1.76
la.39 533 532
zz 542 549
______________________________I_________--------
1983 1984 1985 1986 1987 w-w_ m-m_
----
M-w- ---w
9191 9576 10765 11381 12465 59.79 60.95 60.52 59.48 60.19
a.32 5 a5 3.67 T:iZ f:Z z:zt 3179 1.57
65.05 6:-g 6:=: 6:-g 6z 16.33 16168 16:86 17166 lah
513 511 509 514 512 494 492 492 500 498 531 531 537 544 543
DATA FOR 1979 NOT AVAILABLE **
IN THAT UNDERGRADUATE MAJOR
85

TABLE 4.7
TRENDS TABLE FOR U.S. CITIZENS UITH SAME UGRAD..& GRAD. UAJOR: APPLIED SOCIAL SCIENCES
MALES AND FEMALES ~~~~~I~~~~~~~-~~~~~~~-~~
YEAR OF GRE *
NUMBER OF EXAUINEES X OF TOTAL EXAMINEES l * X UHO ARE FEMALE X WHO ARE BLACK X UHO ARE HISPANIC X UHO ARE ASIAN AMERICAN X PURSUING DOCTORATE X OLDER THAN 30 GRE GRE GRE
1978 1980 m-w_ ____
3814 3702
R-Z 13:03
Z-R 12:37
3.17 2.81 1.05 1.03
15.65 17.91 9.74 17.40
1981 1982 w-w_ mw__
3522 3144 61.44 62.80 73.00 71.41 12.29 12.60 3.21 3.91 0.99 1.02
15.39 16.89 15.40 15.80
1983 _w--
2709 61.23
~=~ 3165 0.89
16.24 16.69
MALES ONLY ________-____e__m-_-
YEAR OF GRE *
NWBER OF EXAMINEES X OF TOTAL EXAUINEES ** % UHO ARE BLACK I UHO ARE HISPANIC X UHO ARE ASIAN AUERICAN X PURSUING DOCTORATE % OLDER THAN 30 GRE VERBAL MAN GRE GUANTITATIVE MEAN GRE ANALYTICAL UEAN
,________ 1978 m-w_
1063 58.18 11.38 3.86 1.32
20.60 8.29
477
z
________- __--_-e-
1980 1981 m--w -a_-
1124 939 60.20 55.89 10.14 11.18
3.38 3.73
230.; 19103
:-ii 15148
485 482
2; 1z
_- _______ 1982 _a--
598E 9:97 4.35 0.92
23.94 16.37
479
z
w-w _____L____
1983 w--w
547z 12:37
2.96
2E! 13151
485
iit
FEMALES ONLY __~___~--~-_-~_--_~-
YEAR OF GRE *
1984 a___
2751 62.52 72.26 12.80 4.62 1.24
16.90 17.95
458 436 480
1985 w-s_
3055 60.28 71.33 10.41
4.58 0.98
16.63 19.74
iti 490
_______-__~~-__~- 1984 1985 --_w _w__
582: 55% 9.14 6194 4.11 3.59
21:: d-ii 17.91 19184
481 487
476 500 ii!i
1986 w-m-
3193 59.40 71.41 11.02
:-;7 17179 20.69
_______--___________~~~~-~~~~~~~~~--~~--~~~-~. 1978 1980 MN__ --m_
NUMBER OF EXARINEES 2721 2551 X OF TOTAL EXAMINEES ** 66.24 67.08 X UHO ARE BLACK 13.71 13.29 X UHO ARE HISPANIC 2.90 2.59 X UHO ARE ASIAN AMERICAN 0.96 1.25 X PURSUING DOCTORATE 13.71 15.29 X OLDER THAN 30 10.14 16.62 GRE VERBAL MEAN 461 466 GRE GUANTITATIVE MEAN 429 434 GRE ANALYTICAL MAN 476 470
,_________ 1981 __a_ 2571
E-Z 3:03
12"-z 15137
427 477
I~~~~~~-L-~-~~l-~~~-~~~~-~~-~~~~~~~~~~~-~~~~~~~~~~
1982 1983 1984 1985 1986 mm-- m--a w-w_ -ww- _-mm
2245 1963
6E
2179 2280
64.18 64.11 62.49 13.54 14.26 14:19 11.75 :;-i; 3.74 3.92 4.78 5.00 3199 1.07 0.82 1.16
l:.Mw 1.32
14.16 13.75 15.24 16.01 15.57 17.92 17.93 19:68 20.00
453 453 450 455 458 427 424 421 427 478 475 473 z 483
1987 w--_
3513 58.17 71.16 10.28
4.44 1.57
18.36 21.43
-_m---
1987 w--w
54%
46.z 1171
23.22 23.94
iii 505
me-m--
1987 -w-M
5z ilk
4.44 1.52
16.52 20.39
454 428
* DATA FOR 1979 NOT AVAILABLE
m
IN THAT UNDERGRADUATE MAJOR
86

TABLE 4.8
TRENDS TABLE FOR U.S. CITIZENS UITH SAME UGRAD. 8 GRAD. MAJOR: HEALTH SCIENCES/SERVICE
UALES AND FEUALES __________________------
YEAR OF GRE *
NUMBER OF EXAMINEES X OF TOTAL EKAUINEES l * X WHO ARE FEUALE X WHO ARE BLACK X UHO ARE HISPANIC X UHO ARE ASIAN AMERICAN X PURSUING DOCTORATE X OLDER THAN 30 GRE GRE GRE
1978 N-w_
10149 75.55 87.58 4.76 1.35 1.29
22.92 la.70
1980 e--m 9651
z-z 4147 1.16
2z 28:20
1981 m-w_
7z 8817s 4.53 1.58
:-: 25 137
1982 w-B_ a796
87Z 4122 1.58 1.27
23.01 28.68
1983 -w-w 767a
76.25 88.81
4.39 1.55 1.16
22.40 32.51
_________--_________________________ 1978 w--w
NUMBER OF EXAMINEES 1204 X OF TOTAL EKAUINEES ** 72.75 X b/HO ARE BLACK 3.49 X UHO ARE HISPARIC 2.99 X UHO ARE ASIAN AUERICAN 1.99 X PURSUING DOCTORATE 50.00 % OLDER THAN 30 11.85 GRE VERBAL UEAN 488 GRE GLMNTITATIVE UEAN 547 GRE ANALYTICAL UEAN 521
__________ 1980 __m_ 1285
75.06 2.88 1.68 2.41
54.32 20.72
551 514
19a4 -m-m
7512 76.37 90.00
4.25 1.98
2:-g 34142
480 484 SD7
1985 w-w- 86%
G-87 4:30
:-ii 2o:n 36.70
z 515
1986 w--w
a438
1987 e-w_ a701
73.74 89.23
4.15 1.59 1.47
ii::
iii 512
:-iii 22189 42.04
2 509
_______-- 1981 -v-w
1022 71 .a2
2.15 2.35 1.57
55.68 la.83
487 558 527
_______ 1982 w---
1001 75.49
2.50 3.20 2.30
52.85 21.76
4%
,~~~~~~~~~~~_~~~____~~~~~~~~~~~~~~~~~~~~~~~~~~ 1983 1986 was 1986 1987 -e-v w-v- _---
a31 -iii!
w-m-
72% 719
2153 71.90 69.19 1.93 M.06 709t 2132 3.01 f :Z 4.33 ;:ii 2.65 1.45 1.67 1.93 1.04 3.09
68.67 47.43 z 44.82 43.93 23.82 26.71 32.68 31.56
689 490 491 486 562 548 551 543 526 531 539 529 z:
____________________-~---~~---~---~~------------------- 1978 1980 1981 -me- -e-- -mm-
NUMBER OF EXAUINEES a519 X OF TOTAL EXAUINEES * 7!z 7t3; 76.83 X UHO ARE BLACK 4195 4171 4.81 X UHO ARE HISPANIC 1.14 1.11 1.49 X UHO ARE ASIAN AMERICAN 1.19 1.31 1.43 X PURSUING DOCTORATE 19.17 la.22 19.10 X OLDER THAN 30 19.57 29.31 26.11 GRE VERBAL UEAN 486 4aa 481 GRE GLJANTITATIVE UEAN 474 476 GRE ANALYTICAL MEAN so6 49s
___m___---
1982 w-m-
z 4:41 1.38 1.12
19.11 29.62
479 479 503
1983 --e_
6819 76.76
4.59 1.38 1.13
19. la 33.57
477
z
1984 -mm- 6761
76.91 4.42 1.85 1.45
17.88 35.22
478 477 505
___m___mm-
1985 -w-w
7630 76.51
4.56 1.52 1.17
la.14 37.59
481 478 512
,___e_______emw-__-
1986 1987 -w-- w_m-
7539 7764 74.06 74.21
4.15 4.37 1.43 1.82 1.53 1.65
20.60 20.52 40.82 43.17
479 474 478 473 510 so7
DATA FOR 1979 NOT AVAILABLE +*
IN THAT UNDERGRADUATE MAJOR
87

TABLE 4.9
.
TRENDS TABLE FOR U.S. CITIZENS UfTH SAUE UGRAD. & GRAD. MAJOR: EDUCATION
MALES AND FEMALES ________________________
YEAR OF GRE *
NWBER OF EXAMINEES % OF TOTAL EXAMINEES ** X UHO ARE FEUALE X WHO ARE BLACK X UBO ARE HISPANIC X WI0 ARE ASIAN AMERICAN X PURSUING DOCTORATE % OLDER THAN 30 GRE GRE GRE
1978 ._.w
21047 03.42 77.07
8.45 3.00
1Ki 2S:42
1980 _a__
22453
fzi 9147 2.93 0.57
19.11 36.43
1981 1982 1983 .-.. . . . . ____
17935 14819 13993 82.29 81.55 81.44 77.65 77.38 79.73
3% 4.10 8.28 3.50 7.12
34110 18.: 36156 2X.E
0.68
k9:h7
UALES ONLY _-___a______________
YEAR OF GRE *
NUUBER OF EXAMINEES X OF TOTAL EXAMINEES ** X UHO ARE BLACK X UHO ARE HISPANIC % UHO ARE ASIAN AMERICAN % PURSUING DOCTORATE XOLDERfHAN30 GRE VERBAL UEAN GRE QUANTITATIVE MEAN GRE ANALYTICAL MEAN
I_______
1978 M-m.
4670 79.57
5.z 0156
31.41 25.91
420 459 442
____________________--------------- 1978 m--w
NUUBER OF EXAMINEES 16221 X OF TOTAL EXAMINEES - 84.58 X UHO ARE BLACK 8.66 X WI0 ARE HISPANIC 2.81 X UHO ARE ASIAN AUERICAN 0.81 X PURSUING DOCTORATE 15.71 X OLDER THAN 30 25.27 GRE VERBAL MEAN 431 GRE QUANTITATIVE MEAN 429 GRE ANALYTICAL MEAN 455
----______ 1980 -__a
5255 80.24 8.51 3.77
3f.S 44136
421 458 434
----_me_-.
1980 -w-w
17047 85.00
9.75 2.67
lE! 33:83
433 428 451
1984 ..M.
14594 82.16 79.11
E
1E 36148
432 439
1985 _..w
16734 81.88 80.64
6.54 3.92 0.75
18.11 39.87
431 437 469
-----__-______--_ 1981 1982 ..m. ..w.
3871 3175 78.68 78.51
6.82 4.49 I% 0.41 0157
31.21 32.63 37.90 40.26
422 424
z z
_~~~~~~~~__~~_~~~~~~~~~~~~~~~~ 1983 1984 1985
. . . . . . . . ---- 2790 2979 3143 77.26 78.50 75.25 6.34 5.57 5.35 4.12 3.86 4.04 0.65 0.81 0.89
30.39 30.85 29.14 41.14 44.16 46.41
425 429 427
z: z tit
FENALES ONLY _~~~~~______~_~_-~-~
YEAR OF GRE l
---_w_____
1981 .-we
13926 83.31 7.88 2.96 0.69
16.24 32.93
433
:z
____I_____
1982 m--m
11467 82.41 8.55 3.94
l?E 35140
430
:Ei
e-v
____________________---------- 1983 1984 1985 W.-m .-mm w.--
11157 11546 134% 82.58 83.19 83.56
37.z 0169
3-34 6 57 Ok
0% oh3
16.72 17.11 15.52 33.40 34.40 38.29
432 433 432 :z iii 471 431
1986 _...
Pii 79:82
6.22 3.26 0.81
19.69 42.48
z 474
3294 77.73
::E!
3i.z 50115
433
2:
1987 .e--
17154 81.94 79.96
6.16 3.38 1.00
19.30 43.71
iit 473
a_______-
1986 W.-w
13286 82.94
6.37 3.18 0.80
16.71 40.53
439 439 476
______ 1987 W.-m
13716 83.27
6.20 3.39 0.93
16.48 41.90
437 439 475
l
DATA FOR 1979 NOT AVAILABLE **
IN THAT UNDERGRADUATE MAJOR
88

TABLE 4.10
TRENDS TABLE FOR U.S. CITIZENS WITH SAME UGRAD. P GRAD. MAJOR: BUSINESS/PUBLIC ADMINISTRAfION
UALES AND FEMALES ___________________-----
YEAR OF GRE *
NLMBER OF EXAUINEES % OF TOTAL EXAMINEES * X WI0 ARE FEUALE X UHO ARE BLACK % UHO ARE HISPANIC % UHO ARE ASIAN AMERICAN X PURSUINGDOCTORATE X OLDER THAN 30 GRE GRE GRE
1978 ___a
6?z 37.03 13.53
i.45 1.28
16.46 16.18
1980 1981 -_w- m--m
4371 65.39 *i4z 32.35 41135 13.57 14.27 3.18 2.96 1.30 1.39
18.74 17.02 26.99 24.17
1982 ___a
5:Bz 41:BB 14.77 4.36 1.37
15.75 24.36
1983 -w-w
2406 52.13 44.01 16.33 3.87
1i=z 25135
VERBAL MEAN -449 452 450 444 442 QUANTITATIVE UEAN 4% 502 494 489 ANALYTICAL WEAN 484 401 485 483 z
UALES ONLY
--~_~~~~~~_~~~~~~~~~~~~~~~~~~~~~~~~~~~~~~~~~. 1978 1980 m-w_ we_-
NUMBER OF EXAUINEES X OF TOTAL EXAMINEES - 6?z 6:::; XUHOARE BLACK 9.99 10.24 % WHO ARE HISPANIC 3.67 3.13 % UHO ARE ASIAN AMERICAN 1.18 1.09 % PURSUING DOCTORATE 17.54 19.56 % OLDER THAN 30 18.18 29.71 GRE VERBAL MEAN 450 453 GRE QUANTITATIVE WAN 515 517 GRE ANALYTICAL MEAN 487 484
____________-______- YEAR OF GRE l
1984 ____
2161 49.12 46.74 14.58 4.72 1.43
17.26 28.44
451
::
1985 __-w
2381
x 13182 4.58 1.47
16.17 28.33
iit 492
________________________________________---------. 1981 1982 1983 1984 1985 w-w_ -mm_ ____ w-w_ w-w_
2003 58.67 5:6z
1331 1142 51.61 46.88 4z
11.23 10135 11.57 11.21 lo:90 3.64 4.44 4.36 4.90 4.52 1.50
i:-: 1.13
1kZ 1.05
17.32 26.68 28:00 ii-ii
i48 32160
17.69 29.39
453 455 453 515 489 45iz z :iz :z
FEMALES ONLY _____~~_~_~_~_______
YEAR OF GRE *
1986 -w-w
4?z 48165 14.22 3.90 1.24
17.52 29.70
iii 497
1987 mw__
2510 43.04 49.72 16.29 4.98 1.67
16.41 30.96
z 491
.__-____-_--__-- 1986 1987 --_w ____
1187 1248 45.17 42.45 10.61 12.34 4.13 5.37
1z 32:%
1;-: 35:10
452 450 507 500 t;
NUUBER OF EXAMINEES X OF TOTAL EXAMINEES ** X UHO ARE BLACK X UHO ARE HISPANIC X UHO ARE ASIAN AMERICAN X PURSUING DOCTORATE X OLDER ‘THAN 30 GRE VERBAL MEAN GRE QUANTITATIVE MEAN GRE ANALYTICAL UEAN
1978 e-w_
1415 60.89 19.65
3.04 1.34
14.70 12.79
447 465 479
1980 1981 -mm- wm__
1414 1426 64.65 60.12 20.65 18.44
3.32 1.77
16.90 21.36
450 472 474
2.03 1.26
16.48 20.48
447
z
1982 __w_
1191 57.43 20.74
4.37 1.26
15.45 19.14
443
iti
1983 w--w
1059 52.61 22.19
3.31 1.42
13.60 19.47
435 454 484
1984 m--m
1010 52.04 18.42 4.55
1:-z 23:63
447
z
1985 __-m
1134 48.84 17.11
4.67 1.94
14.37 27.22
436 453 485
1986 w-m-
1136 45.75 18.05 3.61
150-ii 26133
444 457 494
1987 m-mm
1248 43.58 20.43
4.57 1.68
13.70 26.77
437 453 484
l
DATA FOR 1979 NOT AVAILABLE +*
IN THAT UNDERGRADUATE UAJOR
89

Table 5.1: The relationship of GENDER to the decision to change from each of ten undergraduate fields to another graduate field for
GRE examinees in 1987
Undergraduate Field
Arts and Humanities
Physical Science and Mathematics
Engineering
Biological Sciences
Applied Biological Environ. Sci.
Social Sciences
Applied Social Sci.
Health Sciences
Education
Business and Public Administration
Change or Not? Base N % Female. Each Group Sinnif.
Changer 8,258 Nonchanger 15,259
Changer 4,124 Nonchanger 11,854
Changer 2,424 Nonchanger 10,610
Changer 6,298 Nonchanger 6,277
Changer 1,289 Nonchanger 1,748
Changer 13,449 Nonchanger 22,216
Changer 2,518 Nonchanger 3,495
Changer 3,083 Nonchanger 8,670
Changer 3,762 Nonchanger 17,076
Changer 3,308 Nonchanger 2,496
68.4% 54.2%
41.5% 29.1%
19.3% 16.5%
59.6% 50.3%
43.7% 32.2%
61.3% 56.1%
67.3% 71.5%
87.5% 89.6%
73.3% 80.3%
48.9% 50.0%
. 000
. 000
.OOl
.ooo
.ooo
.ooo
.ooo
.002
.ooo
.386
90

Table 5.2: The relationship of ETHNICITY to the decision to change from each of ten undergraduate fields to another graduate field for
GRE examinees in 1987
N Base % Non-White, Each Grn Signif.
.077
Undergraduate Field
Arts and Humanities
Physical Science and Mathematics
Engineering
Biological Sciences
Applied Biological & Environ. Sci.
Applied Social Sciences
Social Sciences
Education
Business and Public Administration
Change or Not?
Changer Nonchanger
8,106 15,013
11.4% 10.7%
Changer 4,074 Nonchanger 11,693
15.7% 13.3%
Changer 2,402 16.0% Nonchanger 10,489 19.0%
Changer 6,231 Nonchanger 6,211
15.7% 14.4%
Changer Nonchanger
1,275 8.9% 1,723 7.3%
Changer Nonchanger
2,481 16.1% 3,457 18.6%
Changer Nonchanger
13,216 16.0% 21,897 18.6%
Changer 3,707 Nonchanger 16,849
10.5% 12.2%
Changer Nonchanger
3,254 14.9% 2,469 25.0%
. 000
. 000
-035
,092
.012
.ooo
.003
. 000
91

Table 5.3: The relationship of BEING STILL IN OR ALREADY OUT OF COLLEGE to the decision to change from each of ten undergraduate
fields to another graduate field for GRE examinees in 1987
Undergraduate Field
Arts and Humanities
Physical Science and Mathematics
Engineering
Biological Sciences
Applied Biological Changer 1,290 and Environ. Science Nonchanger 1,736
Social Sciences Changer 13,356 Nonchanger 22,154
Applied Social Sci.
Health Sciences
, Education
Business and Public Administration
* Significant at the
NS Not Sienificant
Change or Not? Base N
Changer 8,233 Nonchanger 15,216
Changer 4,095 Nonchanger 11,814
Changer 2,424 Nonchanger 10,608
Changer 6,280 Nonchanger 6,267
Changer 2,501 Nonchanger 3,485
Changer 3,060 Nonchanger 8,598
Changer 3,733 Nonchanger 16,977
Changer 3,206 Nonchanger 2,487
.Ol level
% Already Out of College Sinnif.
80.3% * 57.4%
65.3% * 44.7%
75.8% * 53.1%
57.9% *
43.3%
70.5% * 54.2%
70.9% *
47.0%
78.9% *
55.7%
87.6% * 74.0%
78.7% NS 77.4%
84.7% * 58.0%
92

Table 5.4: The relationship of DEGREE OBJECTIVE to the decision to change from each of ten undergraduate fields to another
graduate field for GRE examinees in 1987
Undergraduate Field
Arts and Humanities
Chawe or Not? Base N % Female, Each Grow Sifznif.
Changer 8,263 33.3% Nonchanger 15,254 46.9%
Physical Science and Mathematics
Engineering
Changer 4,119 41.2% Nonchanger 11,852 51.7%
Changer 2,430 31.1% Nonchanger 10,614 28.5%
Biological Sciences Changer 6,277 47.2% Nonchanger 6,277 61.8%
Applied Biological and Environ. Science
Social Sciences
Changer 1,290 40.5% Nonchanger 1,742 29.9%
Changer 13,456 30.7% Nonchanger 22,256 66.1%
Applied Social Sci. Changer Nonchanger
2,519 25.6% 3,507 18.4%
Health Sciences Changer 3,088 31.3% Nonchanger 8,662 23.0%
Education Changer 3,769 29.3% Nonchanger 17,102 19.4%
Business and Public Changer 3,317 28.6% Administration Nonchanger 2,508 16.4%
* Significant at the .Ol level
NS Not significant
*
*
*
*
*
*
*
*
*
*
93

Table 5.5: The relationship of UNDERGRADUATE GPA IN MAJOR on the decision to change from each of ten undergraduate fields
Undergraduate Field
Arts and Humanities
Physical Science and Mathematics
Engineering
Biological Sciences
Applied Biological and Environ. Science
Social Sciences
Applied Social Sci.
Health Sciences
Education
Business and Public Administration
_ to another graduate field for
. GRE examinees in 1987
Change or Not? Base N % A or A- GPA, Each Gro Signif.
Changer 8,137 Nonchanger 15,140
Changer 4,084 Nonchanger 11,767
Changer 2,398 Nonchanger 10,517
Changer 6,269 Nonchanger 6,247
Changer 1,278 Nonchanger 1,736
Changer 13,321 Nonchanger 22,099
Changer 2,498 Nonchanger 3,470
Changer 3,063 Nonchanger 8,608
Changer 3,730 Nonchanger 16,944
Changer 3,295 Nonchanger 2,484
47.4% * 63.7%
37.2% * 51.6%
34.2% * 46.2%
34.4% * 39.9%
36.9% *
42.6%
40.8% * 56.5%
40.4% * 48.3%
37.9% *
41.6%
43.7% NS 41.7%
34.1% NS 33.9%
* Significant at the .Ol level
NS Not Significant
94

Table 5.6: The relationship of FATHER'S EDUCATION to the decision to change from each of ten undergraduate fields to another graduate field for
GRE examinees in 1987
Undergraduate Field
Arts and Humanities
Physical Science and Mathematics
Engineering
Biological Sciences
Applied Biological and Environ. Science
Social Sciences
Applied Social Sci.
Health Sciences
Education
Business and Public Administration
* Significant at the
NS Not Sienificant
Change or Not? Base N % Fathers B.A. or above
Changer Nonchanger
8,186 15,133
49.1% 55.0%
Changer Nonchanger
4,077 50.1% 11,747 52.6%
Changer 2,402 54.7% Nonchanger 10,472 55.6%
Changer 6,260 51.2% Nonchanger 6,238 52.5%
Changer Nonchanger
1,290 49.2% 1,737 43.8%
Changer 13,316 46.8% Nonchanger 22,086 50.1%
Changer 2,505 44.3% Nonchanger 3,472 43.2%
Changer 3,060 39.9% Nonchanger 8,611 37.2%
Changer Nonchanger
Changer Nonchanger
3,740 38.8% 16,931 33.1%
3,288 42.8% 2,475 35.3%
.Ol level
SiPnif.
*
*
NS
NS
*
*
NS
*
*
*
95

Table 5.7: The relationship of HOURS OF COMMUNITY SERVICE to the decision to change from each of ten undergraduate fields to another graduate field for
GRE examinees in 1987
Undergraduate Field
Arts and Humanities
Physical Science and Mathematics
Engineering
Biological Sciences
Applied Biological and Environ. Science
Social Sciences
Applied Social Sci.
Health Sciences
Education
Business and Public Administration
* Significant at the
NS Not Siznificant
Channe or Not? Base N
Changer 8,099 Nonchanger 15,088
Changer 4,062 Nonchanger 11,727
Changer 2,387 Nonchanger 10,464
Changer 6,230 Nonchanger 6,238
Changer Nonchanger
1,279 59.2% 1,734 56.7%
mnif.
*
% Some Communitv Serv.
63.0% 55.2%
54.4% 43.9%
*
47.5% 45.1%
NS
61.4% 51.3%
*
NS
Changer 13,264 Nonchanger 22,043
Changer Nonchanger
2,491 69.7% 3,477 70.5%
Changer 3,034 Nonchanger 8,566
Changer Nonchanger
Changer Nonchanger
3,703 68.5% 16,827 71.7%
3,279 62.1% 2,484 64.5%
.Ol level
66.7% 61.5%
*
NS
66.9% 65.6%
NS
*
NS
96

Table 5.8: The relationship of GRE SCORES to the decision to change from each of ten undergraduate fields to another graduate field for
GRE examinees in 1987
Undergraduate Field
Arts and Humanities
Physical Science and Mathematics
Engineering
Biological Sciences
Applied Biological and Environ. Science
Social Sciences
Applied Social Sci.
Health Sciences
Education
Business and Public Administration
Charwe or Not? Base N
Changer 8,298 Nonchanger 15,322
Changer 4,138 Nonchanger 11,894
Changer 2,443 Nonchanger 10,652
Changer Nonchanger
6,331 515 (NS) 6,304 517
Changer Nonchanger
1,297 504 (*) 1,751 482
Changer 13,504 Nonchanger 22,310
Changer Nonchanger
2,526 489 (*) 3,513 463
Changer Nonchanger
3,099 486 (*) 8,701 475
Changer 3,781 Nonchanger 17,154
Changer Nonchanger
3,322 478 (*) 2,510 443
GREV(si.n) GRE0ki.g) GREAkig)
548 (NS) 499 (*) 548 512
527 (NS) 634 (*) 530 654
535 (*) 669 (*) 512 684
565 (*) 578
544 (NS) 546
509 (*) 521
493 (*) 517
461 (*) 442
478 (NS) 481
478 (*) 435
475 (-k) 444
511 (*) 476
529 (*) 547
590 (-k) 615
603 (*) 611
562 (*) 577
547 (NS) 546
520 (*) 545
503 (-k) 491
505 (NS) 509
500 (*) 473
518 (*) 491
* Significant at the .Ol level
NS Not Significant
97

Appendix A
Data Set Record Layout for Individual Examinee Data Base

DATA SET NAME:
RECORD LENGTH:
BLOCKING FACTOR:
START END -_-w-- ---
1 1
2 2
3 4
5 7
8 10
11 13
14 14
15 15
16 16
17 17
18 19
20 22
23 23
24 26
27 27
28 28
29 29
30 30
31 31
32 32
33 33
34 39
SIZE w--w
1
1
2
3
3
3
1
1
1
1
2
3'
1
3
1
1
1
1
1
1
1
6
DATA SET RECORD LAYOUT
TJJ66OO.GREDBASE.DATA_
39
800
FIELD NAME ~~~~~~~~~~~~~--~~~~~~~~~~~~~~
Sex
Education Level
Testing Year
GRE Verbal Score
GRE Quantitative Score
GRE Analytical Score
Previous GRE
U.S. Citizenship
Ethnicity
English Best Language
Year of Bachelor% Degree
Undergraduate Major
Degree Objective
Graduate Major
Undergraduate Major GPA
Last 2 years GPA
Hours Worked for Pay
Hours of Community Service
Most Important Honor
Father's Education Level
Mother's Education Level
Date of Birth
101
VALUE RANGE COMMENTS
1,2
1-8
78-87
200-800
200-800
200-800
l-3
1,2
l-8
1,2
00-99
00-99
1-5
00-99
l-7
l-7
1-5
l-5
l-8
l-6
1-6
MMDDYY
l=Male
BQA
BQBl
BQD
BQEl
BQH
BQI
BQJ
BQK
BQO
BQP
BQR
BQS
BQT
BQU
BQV


Revised Major Field Code Numbers
1 Mathematics 2 Applied Mathematics 3 Statistics 4 Physics 5 Astronomy 6 Geology 7 Oceanography 8 Chemistry 9 Computer Science
10 Metallurgy 11 Other Phys Science 12 Engineering, Aerospace 13 Engineering, Chemical 14 Engineering, Civil 15 Engineering, Electrical 16 Engineering, Industrial 17 Engineering, Mechanical 18 Engineering, Other 19 Biology 20 Biochemistry 21 Biophysics 22 Botany 23 Genetics 24 zoology 25 Entomology 26 Anatomy 27 Microbiology 28 Parasitology 29 Physiology 30 Molecular/Cell Biology 31 Bacteriology 32 Agriculture 33 Mining 34 Forestry 35 Environmental Science 36 Audiology 37 Physical Therapy 38 Occupational Therapy 39 Nutrition 40 Home Economics 41 Dentistry 42 Medicine 43 Optometry 44 Osteopathy 45 Nursing 46 Pathology 47 Pharmacology 48 Pharmacy 49 Veterinary Medicine 50 Other Biol Science
51 Public Health 52 Hospital/Health Administration 53 Public Administration 54 Urban Development 55 Geography 56 GovtjPolitical Science 57 History 58 International Relations 59 Law 60 Industrial Relations/Personnel 61 Business/Commerce 62 Economics 63 American Studies 64 Anthropology 65 Sociology 66 Social Work 67 Educational Psychology 68 Psychology 69 Social Psychology 70 Communications 71 Journalism 72 Library Science 73 Other Social Science 74 Education 75 Education Administration 76 Physical Education 77 Guidance/Counseling 78 Speech 79 English 80 Italian 81 French 82 German 83 Russian 84 Slavic Studies 85 Spanish 86 Far Eastern Languages 87 Near Eastern Languages 88 Classical Languages 89 Other Foreign Languages 90 Linguistics 91 Comparative Literature 92 Religious Studies 93 Philosophy 94 Art History 95 Architecture 96 Archaeology 97 Fine Arts/Design 98 Dramatic Arts 99 Music
100 Other Humanities 101 Other Field
105

Appendix C
Sample of the Matrix of Detailed Major Fields: Of Those Examinees Planning to Earn a Doctorate,
the Percentage in 1987 Who Were Female

_. . . __ _ .
t9# ti eJt-A”&-. q 1,s. ;kl . \ .


STUDENT FLOW FROM UNDERGRADUATE MAJORS CCOLUMNS) TO GRADUATE FIELD OF INTEREST (ROWS) (CONTINUED FROM PREVIOUS PAGE) .
.- ---_--- _-_-I_~- PERCENT OFl;;:ALE STUDENTS -._.__._-__ ___ ._.. _ . . ‘,
UNDERGRADUATE MAJORS ARE NUMBERED &“~~RREsPDND +o GRADUATE FIELDS ON LEFT ’ . ._._. __ ._.. _ . . .._ 26-f -27 i8 ._ .29 I.-- 30 _ -31._..-. 32__...33__ 34_..: 35._36__.37__38___3.9-_40_~1_4~43_4~45-46_4~48__49.__...50..._._..__._.. _.
~~~~~~~-~~~~-~-----------------~~~~~~~~r~~~~”~~~~~~~~~~~~”~~~~~~~~~~“~~~~~~~~~~~~~~~~~~~~~~~~~~~~~~~~~~~~~“~~~~~~-~~~~~~~~~~~
INTERNATIONAL KELAT. _. SP-LAW- .._. _ ._....
60 INDUST. REL/PERSDNHEL -..---. _ ai BUSINESS %CDI?MERCE 0 0
62 ECONOMICS : 63 AMERICAN .STUDIES . _ . . 0 . . . :. . : 64 ANTHROPOLOGY 100 0 0
I. -0. : .o_ _.:___...t..__L._X . _A. _lOo” . __L_. 0 ._D_._o_1oo._.__~_ ii -~___._~__ o- 100 -0 loo -- ._.i. ..-. . __.. _ 0 0 0” 6; 0” : 10: t : t 100 50 : 100 -8 : 78 P : ! ! :
: . . . . . : : 0’
_::. . ..: . : :.. --i .._i~i__.i;j_..__.:..___.~ _. ._-: _ _: 1_-: _: -11 __._._:__.: :. .__ : 0 0 0 0 0 75 75 0 0 II-- 0 0 100 100 0 0 0 0
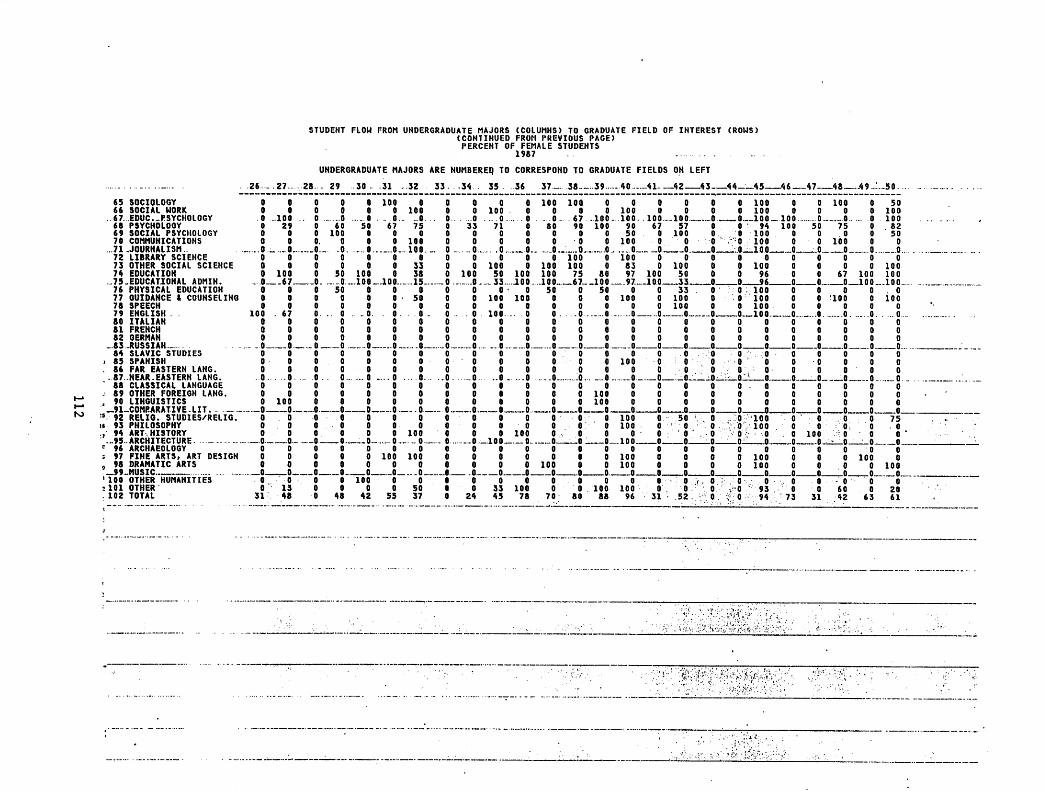
STUDENT FLOW FROM UNDERGRADUATE MAJORS (COLUMNS) TO GRADUATE FIELD OF INTEREST (ROWS) (CONTINUED FRGPl PREVIOUS PAGE)
PERCENT OF1;F;ALE STUDENTS . . .
UNDERGRADUATE MAJORS ARE NUMBEREQ TO CORRESPOND TO GRADUATE FIELDS ON LEFT

: ._._8_ . . . _.__. -.
0
1:: 100. _ 100
0 __._“.X _ _. ___..
t 100 * 100 .
i 67 57 .-_ __._..
100 50
li$
33
:
6:
0” ibo .’
.

% aV&oMLbaU’~+C1
+-+=437~ * J---vtaL STUDENT FLOW FROM UNDERGRADUATE MAJORS (COLUMNS) TO GRADUATE FIELD OF INTEREST (ROWS1
(CONTINUED FROM PREVIOUS PAGE) 67% GCLCC PERCENT 0FlF;lALE STUDENTS
.
UNDERGRADUATE MAJORS ARE NUMBERED TO CORRESPOND TO GRADUATE FIELDS ON LEFT
’ 51 52 53 54 55 56 57 58 59 60 61 62. 63 .64. 65 66 67.. . 68-.. /---’ 69 ..-70 71 72 73 74 75 76.
_ .._.. _ _.. . . . _ . . ._ _ -._. . _.-.... _ ..__. . . . -.__ ..-. -_-_.I___. -_- --_-_ ._... -_.. ._ . . .- ______ _
._.__ ._.__ --_-_-._.. _. . .__-. - - -. . -- .-. . _ .-.. _.. -. _ -. - ._ ..--. _- - -..._.__...... _ __.__. ___I__ ____ ______ -- - .___ - ___. .____ -_ .___


STUDENT FLOW FROM UNDERGRADUATE MAJORS (COLUMNS) TO GRADUATE FIELD OF INTEREST (ROWS) (CONTINUED FROM PREVIOUS PAGE) ’
f> . ,_--_-_. .- __,___. we-_-a-_.____- -_-
PERCENT OF1;FyALE STUDENTS .“\
. ,
m- __-_. .__._ . _.-._ _. _.._.‘.__ I1 . . ._
1 UNDERGRADUATE MAJORS ARE NUilBERED’TO CdRRESPOND TO GRADUATE FIELDS ON LEFT : 1
7;‘
.I
30
.I :_>
x 25 1':.
;'8 ,
@ I; ,’ .
..__. _-. . ..-
!‘3 Ii -___ - _--._-.. . . I . . _ . _ . . _
4 .- 3
. . . .

Appendix D
File Names of Matrices

File Name and File Location Population Included Variables
TJJ6600.GREDBASE.DATA78 TJJ66OO.GREDBASE.DATA80 TJJ66OO.GREDBASE.DATA81 to . . . . . .DATA87
On K36891 (exp. Dec. 1994)
U.S. citizen GRE-takers with ugrad. and grad. majors. A stripped-down, 39character file for each year. These are the raw data used to create tables.
TJJ6600.GREDBASE.AGEADV78 U.S. citizen GRE-takers with ugrad. TJJ66OO.GREDBASE.AGEADV80 and grad. majors. Matrices are TJJ66OO.GREDBASE.AGEADV81 102 x 102 for each of the specific majors
to . . . . .AGEADV87 plus marginals. Populations are total On K16992 (exp. July 1996) and male, female and doctorate.
NJT6600.BIGTAB.Y78T087
Cn KO5318 (exp. July 1996)
All U.S. citizens with GRE scores and specified graduate and under- graduate majors. Data are arranged by years 1978 to 1987 within variable. A 102 x 102 matrix.
NJT66UO.SHORTTAB.Y78T087 All U.S. citizens with GRE scores and specified graduate and under-
Cn KO5318 (exp. July 1996) graduate majors. Data are arranged by year 1978 to 1987 within variable. An 11 x 11 table of broad major categories.
All of the following files also reside on KO5318 and are prefaced by NJT6600.
SHORTFEM.Y78T087 Females with above characteristics for years 1978 to 1987.
SHORTMALY78T087 Mates with above characteristics for years 1978 to 1987.
SHORTABD.Y78T087 Doctoral candidates with above characteristics for 1978 to 1987.
SHORTFEM.Y78T087D Female doctoral candidates.
GRE scores and B.Q. responses
Mean age N over 30
N aspire to doctorate
Counts GRE-Verbal mean GRE-Quant. mean GRE-Anaiyt. mean Oh Black Oh Hispanic Oh Asiin American
Counts GRE-V mean GRE-Q mean GRE-A mean N Black N Hispanic N Asian N Mate N Female % Black Oh Hispanic % A&n % Male Oh Female
Each year within same 14 variables.
Each year within same 14 variables.
Each year within same 14 variables.
Each year within same 14 variables.
119

SHORTMAL.Y78T087 Male doctoral candidates.
MOMTABLEY78T087 All U.S. citizens with GRE scores and specified graduate and under- graduate majors, 1978 to 1987.
MOMFEM.Y78T087
MOMMALY78T087
TOTALMAT.Y78T087
TOTALFEMY78T087
TOTALMALY78T087
Females with above characteristics.
Males with above characteristics.
All U.S. citizens with above characteristics. (Used for trend tables)
Each year within same 14 variables.
N fathers B.A. N fathers grad. N mothers B.A. N mothers grad. N examinees > 30 % fathers B.A. % fathers grad. % mothers B.A. % mothers grad. Oh examinees > 30 Mean GPA in major Mean GPA last 2 yr Same 13 variables.
Same 13 variables.
Counts % of total % female % Black % Hispanic % Asian American % pursuing Ph.D. % older than 30 GRE Verbal Mean GRE Quant. Mean GRE Analyt. Mean
Females with above characteristics. (Used for trend tables).
Above 11 variables.
Males with above characteristics. (Used for trend tables).
Above 11 variables.
120

Appendix E
Broad Major Field Definitions

Broad Major Field Definitions
I. Arts/Humanities
II Physical Sciences/Mathematics
1 Mathematics 2 Applied Mathematics 3 Statistics 4 Physics 5 Astronomy 6 Geology
III Engineering
79 English 90 Linguistics 80 Italian 91 Comparative Literature 81 French 92 Religious Studies 82 German 93 Philosophy 83 Russian 94 Art History 84 Slavic Studies 95 Architecture 85 Spanish 96 Archaeology 86 Far Eastern Languages 97 Fine Arts/Design 87 Near Eastern Languages 98 Dramatic Arts 88 Classical Languages 99 Music 89 Other Foreign Languages 100 Other Humanities
12 Engineering, Aerospace 13 Engineering, Chemical 14 Engineering, Civil 15 Engineering, Electrical
IV. Biological Sciences
19 Biology 20 Biochemistry 21 Biophysics 22 Botany 23 Genetics 24 Zoology
7 Oceanography 8 Chemistry 9 Computer Science
10 Metallurgy 11 Other Phys Science
16 Engineering, Industrial 17 Engineering, Mechanical 18 Engineering, Other
27 Microbiology 28 Parasitology 29 Physiology 30 Molecular/Cell Biology 50 Other Biological Science
V. Applied Biological/Environmental Sciences
25 Entomology . 34 Forestry 32 Agriculture 35 Environmental Science 33 Mining
123

VI.
VII.
Social Sciences
54 Urban Development 55 Geography 56 Govt/Political Science 57 History 58 International Relations 62 Economics
Applied Social Sciences
66 Social Work 70 Communications
VIII. Health Sciences/Services
IX
X
26 Anatomy 31 Bacteriology 36 Audiology 37 Physical Therapy 38 Occupational Therapy 39 Nutrition 40 Home Economics 41 Dentistry
Education
67 .Educational Psychology 74 Education 75 Education Administration
63 American Studies 64 Anthropology 65 Sociology 68 Psychology 69 Social Psychology 73 Other Social Science
71 Journalism 72 Library Science
42 Medicine 43 Optometry 44 Osteopathy 45 Nursing 46 Pathology 47 Pharmacology 48 Pharmacy 49 Veterinary Medicine
76 Physical Education 77 Guidance/Counseling 78 Speech
Business/Public Administration
51 Public Health 59 Law 52 Hospital/Health Admin 60 Industrial Relations/Personnel 53 Public Administration 61 Business/Commerce
124

REFERENCES
Adelman, C. (1985). l’he Standardized Test Scores of College Graduates: 1964-1982. Washington, DC: National Institute of Education and the American Association for Higher Education.
Astin, A. (1990). m American Freshman National Norms for Fall 19%. Los Angeles: Higher Education Research Institute, University of California.
Astin, A., & Green, K. C. (1987). l%e American Freshman Twenty Year Trends, 1966-1985. Los Angeles: Higher Education Research Institute, University of California.
Baird, L. L. (1982). An Ekamination of the Graduate Study Application and Enrollment Decisions of GRE Candidates (GREB No. 79-l lR, ETS Research Rep. 82-53). Princeton, NJ: Educational Testing Service.
Educational Testing Service (1988). A Summary of Data ColIectedfiom Graduate Record Examinations Test T&rs during 1986-87 (Data Summary Rep. #12). Princeton, NJ: Author.
Grandy, J. (1984a). Profiles of Prospective Humanities Majors: 1975-1983. Final report to the National Endowment for the Humanities, Grant No. OP-20119-83. Princeton, NJ: Educational Testing Service.
Grandy, J. (1984b) A Comparison of Trends in Test Scores and Grades of GRE Examinees Having Science Degrees and Planning Graduate Study in the Sciences and in Education: 1976 to 1983. Final report to the National Science Foundation.
Grandy, J. (1985). Factors contributing to the changing Characteristics of Prospective Humanities Majors: 1975 - 1984. Final report to the National Endowment for the Humanities, Grant No. OP-20193-84. Princeton, NJ: Educational Testing Service
Grandy, J. (1987). Trends in the Selection of Science, Mathematics, or Engineering as Major Fields of Study among Top-Scoring SAT Takers (ETS Research Rep. RR-87-39). Princeton, NJ: Educational Testing Service.
Grandy, J. (1989). Trends in SAT Scores and Other Characteristics of Examinees Planning to Major in Mathematics, Science, or Engineering (ETS Research Rep. RR-89-24). Princeton, NJ: Educational Testing Service.
Grandy, J. (199Oa). In search of the next generation of scientists: A new challenge for teachers. The College Board Review, 156, 2-9, 28.
Grandy, J. (199Ob). Comparison of expected with actual field of graduate study: An analysis of GRE survey data (GRE Board Professional Rep. No. 87-02P). Princeton, NJ: Educational Testing Service.
Grandy, J. (1992). Graduate enrollment decisions of undergraduate science and engineering majors: A survey of GRE test takers. Manuscript submitted for publication.
125

Grandy, J. and Courtney, R. (1985). Factors Contributing to the Changing characteristics of Prospective Humanities Majors: 1975-1984. Final report to the National Endowment for the Humanities. Princeton, NJ: Educational Testing Service.
Grandy, J., and Greiner, M. (1990). Academic preparation of master of divinity candidates. Ministry Research Notes. Princeton, NJ: Educational Testing Service.
Hilton, T. L., Hsia, J., Solorzano, D. G., Benton, N. L. (1989). Persistence in science of high-ability minority students (ETS Research Rep. RR-89-28). Princeton, NJ: Educational Testing Service.
Hilton, T. L. & Pollack, J. (1989). Talent Flow in Higher Education: A Longitudinal Study of 1980 High School Graduates and the Subgroup Taking the GRE (GRE No. 86-16). Princeton, NJ: Educational Testing Service.
Hilton, T. L.; & Schrader, W. B. (1986). Pathways to graduate school: An empirical study based on national longitudinal data (Final Report, GRE No. 82-21). Princeton, NJ: Educational Testing Service.
Kuh, C. (1987). l7re flow of talent to graduate education: A research framework. GRE proposal No. 87-7.
National Research Council (annually). Doctorate Recipients from United States Universities. Washington, DC: National Academy Press.
National Research Council (1986). Humanities doctorates in the United States: 1985 profile. .
Washington, D.C.: National Academy Press.
National Science Board (1983). Science Indicators: 1982. Washington, D. C. : National Science Foundation.
Wild, C. (1979). A Summary of Data Collected porn Graduate Record -inations Test Takers during 1977-78 (Data Summary Rep. #3). Princeton, NJ: Educational Testing Service.
126