change in biological traits and community structure of macroinvertebrates through primary succession...
TRANSCRIPT
BioOne sees sustainable scholarly publishing as an inherently collaborative enterprise connecting authors, nonprofit publishers, academic institutions, researchlibraries, and research funders in the common goal of maximizing access to critical research.
Change in biological traits and community structure of macroinvertebratesthrough primary succession in a man-made Swedish wetlandAuthor(s): Albert Ruhí, Jan Herrmann, Stéphanie Gascón, Jordi Sala, Joja Geijer, and Dani BoixSource: Freshwater Science, 31(1):22-37. 2012.Published By: The Society for Freshwater ScienceDOI: http://dx.doi.org/10.1899/11-018.1URL: http://www.bioone.org/doi/full/10.1899/11-018.1
BioOne (www.bioone.org) is a nonprofit, online aggregation of core research in the biological, ecological, andenvironmental sciences. BioOne provides a sustainable online platform for over 170 journals and books publishedby nonprofit societies, associations, museums, institutions, and presses.
Your use of this PDF, the BioOne Web site, and all posted and associated content indicates your acceptance ofBioOne’s Terms of Use, available at www.bioone.org/page/terms_of_use.
Usage of BioOne content is strictly limited to personal, educational, and non-commercial use. Commercial inquiriesor rights and permissions requests should be directed to the individual publisher as copyright holder.

Change in biological traits and community structure ofmacroinvertebrates through primary succession in a man-made
Swedish wetland
Albert Ruhı1,3, Jan Herrmann2,4, Stephanie Gascon1,5, Jordi Sala1,6,Joja Geijer2,7, AND Dani Boix1,8
1 Institute of Aquatic Ecology, University of Girona, Girona, Catalonia, Spain2 School of Natural Sciences, Linnaeus University, Kalmar, Sweden
Abstract. We investigated the successional development of a benthic macrofaunal community in KalmarDamme, a man-made wetland in southeastern Sweden, over a 13-y period after construction (1997–2009).We assessed primary succession by monitoring changes in species composition, biological traits, andcommunity structure. Predictable successional changes occurred, and the structure of the community wascomplex at the advanced phase. Three successional phases were observed, each with typifying species. Atthe advanced phase, dominant biological traits shifted to favor animals with longer life-cycle durations,aerial dispersal strategies, and certain feeding types (i.e., filter-feeders, fine sediment collectors, predators,and parasites). We selected the Coleoptera assemblage to represent the macroinvertebrate community inan evaluation of the extent to which man-made wetlands in different age classes (,3 y and §10 y) weresimilar to natural wetlands (.50 y). No significant differences in Coleoptera assemblages werefound between natural wetlands and man-made wetlands §10 y. However, man-made wetlands §10 yhad significantly higher coleopteran species richness than natural and man-made wetlands ,3 y becauseof the convergence of pioneering species persisting from early successional stages with representativespecialized taxa from natural wetlands. Our results suggest that 10 y may be sufficient time for themacrofaunal communities of man-made wetlands to resemble those of natural wetlands.
Key words: colonization, succession, man-made, wetlands, invertebrates, aquatic Coleoptera.
Succession can involve large numbers of speciesand important changes in community structure(Smith 1928, Odum 1960, Gutierrez and Fey 1980).These changes usually are associated with differentsuccessional phases, each with its own stable point,moving in a particular direction (Allen et al. 1977,Niell 1981, Legendre et al. 1985). Succession has beenstudied during the process of recovery after majordisturbances, such as fires, hurricanes, or droughts(Force 1981, Smith 1982, Kaufman 1983). However,newly created aquatic habitats also are optimalsystems in which to study and test successionaldynamics. Research on man-made aquatic systemshas expanded over the last decade (Oertli et al. 2005)
because they tend to be easy to monitor and regulate.Nevertheless, most studies done in newly createdwetlands are short-term (,3 y), which is a criticallimitation when assessing ecological functioning(Zedler and Callaway 1999). For example, studiesfocused on the mitigation of wetland loss to conserveamphibians have shown that detailed, qualitative,and long-term observations are essential for correctevaluation of their conservation value (Pechmannet al. 2001, Petranka et al. 2003, 2007). Furthermore,short-term approaches are restrictive when studyinginvertebrate communities in these systems becausethe initial years are dominated by pioneer assem-blages (Bloechl et al. 2010). Hence, these studies mayassess initial colonization successfully, but usually donot detect later changes in assemblage structure andorganization (Barnes 1983, Friday 1987). A smallnumber of pioneer colonizers may explain the maindifferences between assemblages in created vs naturalwater bodies (Ruhı et al. 2009). Moreover, for someparticularly species-rich taxa with specialized feeding
3 E-mail addresses: [email protected] [email protected] [email protected] [email protected] [email protected] [email protected]
Freshwater Science, 2012, 31(1):22–37’ 2012 by Society for Freshwater ScienceDOI: 10.1899/11-018.1Published online: 6 December 2011
22
structures (e.g., Coleoptera; Lundkvist et al. 2001,Thiere et al. 2009), succession may continue for .10 y(Fairchild et al. 2000).
Increases in biomass and diversity during succes-sion were hypothesized in earlier general ecologypapers (Margalef 1968, Odum 1971, Gutierrez and Fey1980, Legendre et al. 1985), but unimodal (hump-shaped) changes in biomass and diversity over timehave been described when the scale of measurementwas long enough to include several stages ofsuccession (Guo 2003). In freshwater systems, abun-dance/density and taxonomic richness of macroin-vertebrates tend to increase during the first years ofsuccession (e.g., in new reservoirs; Voshell andSimmons 1984, Bass 1992), but asymptotic patternstend to appear when studies are longer (e.g., 20-ystudy of a deglaciated stream; Milner and Robertson2010). Despite the paucity of published research innewly created wetlands, available studies suggest thatnew taxonomic groups tend to arrive in a directionalsuccessional process (Barnes 1983, Herrmann et al.2000, Solimini et al. 2003, Ruhı et al. 2009). Thus,changes in community structure should be reflectedby measures of taxonomic distinctness (Clarke andWarwick 2001a). Successional changes usually havebeen described taxonomically, but they also shouldbe apparent in analyses of functional characteristics ofthe organisms (Hooper et al. 2005, Verberk et al. 2008).Batzer and Wissinger (1996) pointed out that changesin species composition of establishing communitiescould be a consequence of the favored life-historystrategies (i.e., dispersal capacity, desiccation resis-tance, trophic specialization). The hypotheses andrationale proposed by Townsend and Hildrew (1994)and Bonada et al. (2007) relating the presence of traitsfavoring resistance/resilience to ecological distur-bance in streams also could be relevant to under-standing succession in new wetlands.
Our study goal was to describe the main changes ofa macrofaunal community in a man-made wetlandand to analyze whether the community eventuallyresembled that of a natural one. The biological traitsand community structure of the macroinvertebratecommunity of a newly created wetland were moni-tored for 13 y. We predicted that: 1) taxa with shortlife cycles and active dispersal mechanisms woulddominate immediately after flooding and during theinitial phases of succession, whereas taxa with longlife cycles and passive dispersal mechanisms wouldincrease in importance during the later phases; 2) thedominant feeding type would shift during successionfrom taxa that consume suspended matter andprimary production to those feeding on prey, hosts,and abundant fine particulate organic matter; 3)
species richness and evenness would increase duringearly successional stages; 4) species richness andevenness would decrease and cumulative richnessand numerical abundance would reach asymptotesduring later successional stages; and 5) averagetaxonomic distinctness would be higher and variationin taxonomic distinctness would be lower in late thanearly stages during succession (Table 1).
We also compared the macroinvertebrate commu-nity in the study wetland with those in other man-made (,3 y and §10 y old) and natural wetlands. Weused aquatic Coleoptera as a surrogate for the entireinsect community because coleopterans have beenidentified as a potential biodiversity indicator incontinental European aquatic ecosystems (Fosteret al. 1989, Sanchez-Fernandez et al. 2006). Weexpected the composition of the Coleoptera in oldman-made wetlands to converge on composition innatural wetlands subsequent to the arrival of late-colonist specialist taxa to old man-made wetlands. Incontrast, we expected the community in young man-made wetlands to be dominated by pioneeringgeneralist taxa and, therefore, different from thecommunity in old man-made wetlands. Thus, wepredicted higher species richness in natural and oldman-made wetlands than in young ones.
Methods
Study area
Macroinvertebrate study.—The macroinvertebratestudy was carried out at Kalmar Damme (Fig. 1A,B), which is on the southeastern coast of Sweden. Thissite consists of a man-made freshwater wetland thatwas constructed (i.e., excavated and flooded) in late1996. This freshwater system is fed by the Tornebystream and is situated 2 km from the stream outletinto the Baltic Sea (Fig. 1C). The drainage basin(48 km2) of the wetland is mainly agricultural, butalso includes large forested areas, a few urban areas,and the regional Kalmar Airport. The wetland consistsof several connected elongated waterbodies ,2 m indepth that are vegetated with belts of common reed(Phragmites australis), bulrush (Typha latifolia), commonwater plantain (Alisma plantago-aquatica), and branchedbur-reed (Sparganium erectum). Some submergedplants were planted immediately after constructionof the wetland. Initially, the most abundant sub-merged species were the Canadian waterweed (Elodeacanadensis) and the spiked Eurasian water milfoil(Myriophyllum spicatum). However, both species be-came less abundant in later years. In addition, severalspecies of fish were present from the time of the initialflooding.
2012] PRIMARY SUCCESSION IN MAN-MADE WETLANDS 23

TA
BL
E1.
Hy
po
thes
esan
dra
tio
nal
efo
rco
mm
un
ity
stru
ctu
rean
db
iolo
gic
altr
aits
con
sid
ered
inth
em
acro
inv
erte
bra
test
ud
y.
+an
d2
ind
icat
eex
pec
ted
hig
han
dlo
wv
alu
es,
resp
ecti
vel
y.
Her
b=
her
biv
oro
us.
Tra
itT
rait
stat
eS
ucc
essi
on
earl
yR
adv
ance
dR
atio
nal
eR
efer
ence
s
Bio
log
ical
trai
t
No
.re
pro
du
ctiv
ecy
cles
/y
.1
+2
Stab
leen
vir
onm
ents
shou
ldfa
vor
spec
ies
wit
hlo
ng
erlif
ecy
cle,
lon
glif
esp
ans,
and
late
mat
uri
tyT
ow
nse
nd
and
Hil
dre
w19
94,
Bo
nad
aet
al.
2007
ƒ1
2+
Dis
per
sal
stra
teg
ies
Aq
uat
ic2
+A
rriv
alp
rob
abil
itie
so
faq
uat
icd
isp
erse
rssh
ou
ldin
crea
sew
ith
tim
e;ae
rial
acti
ve
dis
per
sal
stra
teg
ies
fav
ore
dd
uri
ng
the
1stp
has
eso
fa
hy
dro
per
iod
;aer
ial
pas
siv
est
rate
gie
sre
qu
ire
mo
reti
me
Dan
ell
and
Sjo
ber
g19
82,
Bas
s19
92,
Bat
zer
and
Wis
sin
ger
1996
,B
on
ada
etal
.20
07A
eria
lac
tiv
e+
2A
eria
lp
assi
ve
2+
Fee
din
gst
rate
gie
sP
lan
tea
ters
(scr
aper
s+
her
b.
pie
rcer
s)+
2R
esp
on
seto
earl
yav
aila
bil
ity
of
per
iph
yto
nan
dm
acro
ph
yte
sB
on
ada
etal
.20
07,
Ru
hı
etal
.20
09F
ilte
r-fe
eder
s+
2R
esp
on
seto
earl
yav
aila
bil
ity
of
sest
on
and
pla
nk
ton
Vo
shel
lan
dS
imm
on
s19
84
Sh
red
der
s+
2R
esp
on
seto
earl
yav
aila
bil
ity
of
mac
rop
hy
tes
and
larg
ete
rres
tria
lli
tter
Vo
shel
lan
dS
imm
on
s19
84
Fin
ese
dim
ent
coll
ecto
rs2
+R
esp
on
seto
the
incr
ease
of
fin
ep
arti
cula
teo
rgan
icm
atte
rin
the
sed
imen
tsB
on
ada
etal
.20
07
Pre
dat
ors
(en
gu
lfer
s+
anim
alp
ierc
ers)
2+
Res
po
nse
toin
crea
sed
abu
nd
ance
of
pre
y;
mo
reim
po
rtan
tth
anth
ein
itia
ld
om
inan
ceo
fae
rial
colo
niz
ing
pre
dat
ors
(e.g
.,d
ivin
gb
eetl
esan
dh
emip
tera
ns)
Bat
zer
and
Wis
sin
ger
1996
,S
chn
eid
eran
dF
rost
1996
,B
loec
hl
etal
.20
10
Par
asit
es2
+R
esp
on
seto
the
incr
ease
of
the
abu
nd
ance
of
po
ten
tial
ho
sts
Co
mm
un
ity
par
amet
er
Nu
mer
ical
abu
nd
ance
2+
Pro
du
ctio
no
fth
esy
stem
resu
lts
inin
crea
sed
nu
mer
ical
abu
nd
ance
of
mac
roin
ver
teb
rate
sw
ith
am
axim
um
du
rin
gad
van
ced
succ
essi
on
alp
has
e
Mar
gal
ef19
68,
Od
um
1971
,G
uti
erre
zan
dF
ey19
80,
Leg
end
reet
al.
1985
,G
uo
2003
Av
erag
eta
xo
no
mic
dis
tin
ctn
ess
2+
Incr
ease
dta
xon
omic
div
ersi
tyan
dev
enn
ess
assu
cces
sion
pro
ceed
s;ar
riv
alof
new
and
taxo
nom
ical
lyd
iver
sesp
ecie
ssh
ould
be
spre
adac
ross
sev
eral
taxo
nom
icg
rou
ps
and
rich
nes
sof
afe
wsp
ecie
s-ri
chp
ion
eer
gro
up
ssh
ould
dec
reas
eov
erti
me
Infe
rred
fro
mp
ub
lish
edfa
un
alli
sts
in:
Bar
nes
1983
,C
hri
stm
anan
dV
osh
ell
1993
,H
errm
ann
etal
.20
00,
Ho
van
dW
alse
ng
2003
,So
lim
ini
etal
.20
03,
Lan
cast
eret
al.
2004
,R
uh
ıet
al.
2009
Var
iati
on
inta
xo
no
mic
dis
tin
ctn
ess
+2
Pie
lou
’sev
enn
ess
ind
ex2
+2
Ev
enn
ess
and
rare
fied
spec
ies
rich
nes
ssh
ould
atta
inm
axim
um
val
ues
du
rin
gth
ein
term
edia
tep
has
esof
succ
essi
on;a
rriv
alof
new
spec
ies
shou
ldbe
limite
dto
war
dan
asym
pto
tein
am
atu
reco
mm
un
ity,
wh
ere
ah
igh
pro
por
tion
ofth
eec
olog
ical
nic
hes
are
alre
ady
occu
pie
d
Mar
gal
ef19
68,
Bat
zer
and
Wis
sin
ger
1996
,G
uo
2003
,M
iln
eran
dR
ob
erts
on
2010
Rar
efie
dsp
ecie
sri
chn
ess
2+
2
Cu
mu
lati
ve
spec
ies
rich
nes
s2
+
24 A. RUHI ET AL. [Volume 31
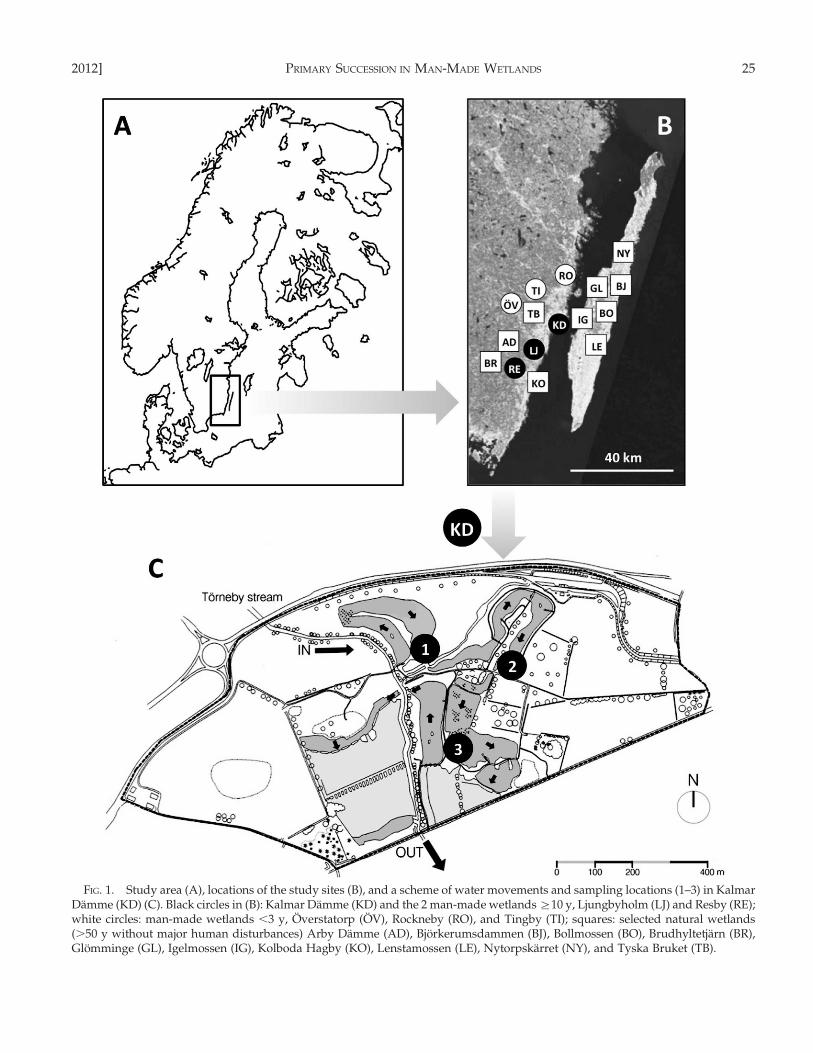
FIG. 1. Study area (A), locations of the study sites (B), and a scheme of water movements and sampling locations (1–3) in KalmarDamme (KD) (C). Black circles in (B): Kalmar Damme (KD) and the 2 man-made wetlands §10 y, Ljungbyholm (LJ) and Resby (RE);white circles: man-made wetlands ,3 y, Overstatorp (OV), Rockneby (RO), and Tingby (TI); squares: selected natural wetlands(.50 y without major human disturbances) Arby Damme (AD), Bjorkerumsdammen (BJ), Bollmossen (BO), Brudhyltetjarn (BR),Glomminge (GL), Igelmossen (IG), Kolboda Hagby (KO), Lenstamossen (LE), Nytorpskarret (NY), and Tyska Bruket (TB).
2012] PRIMARY SUCCESSION IN MAN-MADE WETLANDS 25

The system was designed and built to reduce Nlevels to 50% of the annual amount of urea-Ndischarged at the airport. This objective was met bythe 2nd y (1998) after construction (based on monthlydata from a wetland monitoring program run by theKalmar Airport Authority). A 2nd design objectivewas to promote aquatic biodiversity (Herrmann et al.2000).
Coleoptera study.—We did the Coleoptera study in 6man-made and 10 natural wetlands, which wereselected as reference sites (Fig. 1B). To the best ofour knowledge, all wetlands were permanent. Threeman-made wetlands (Kalmar Damme, Ljungbyholm,and Resby) were §10 y old and 3 (Overstatorp,Rockneby, and Tingby) were 1 to 3 y old at the time ofsampling. We chose 10 natural wetlands with differ-ent levels of vegetation structure and substratum typefrom the mainland and the adjacent island of Oland toencompass a broad range of natural variability. The 10natural wetlands were Arby Damme, Bjorkerums-dammen, Bollmossen, Brudhyltetjarn, Glomminge,Igelmossen, Kolboda Hagby, Lenstamossen, Nytorps-karret, and Tyska Bruket. Six of these wetlands weredefinitely natural in origin, but the origin of Bjorker-umsdammen, Bollmossen, Igelmossen, and TyskaBruket was unknown. However, none of the 10wetlands had been affected by human activity for§50 y. See Table 2 for information about the creationof the man-made systems and the characteristics of all16 study sites.
Sampling and sample processing
Macroinvertebrate study.—We visited KalmarDamme during 5 periods from early 1997 to late2009. Period I was the 1st y (1997), period II the 2nd y(1998), period III the 3rd y (1999), period IV the 7th y(2003), and period V the 13th y (2009) after construc-tion. These 5 periods were intended to represent theprogressive development of the changing macroin-vertebrate community. In each period, we visited thewetland in spring (March–April), summer (June–July), and autumn (September–October) and sampledmacroinvertebrates at 3 fixed sites (Fig. 1B). Duringeach period, personnel from the Kalmar AirportAuthority did monthly analyses of dissolved inor-ganic N (DIN = NH4
+ + NO22 + NO32), and soluble
reactive P (SRP = PO432). Monthly meteorological
variables were obtained from the Swedish Meteoro-logical and Hydrological Institute.
We sampled aquatic macrofauna with a Surbersampler (33 3 33 cm) equipped with an extra 15-cm-high front metal frame and 0.5-mm mesh on bothparts. We collected 5 subsamples at each site over a
TA
BL
E2.
Ch
arac
teri
stic
so
fw
etla
nd
ssa
mp
led
du
rin
gth
eC
ole
op
tera
stu
dy
.M
ax=
max
imu
m.
Ty
pe
Sit
e(a
bb
rev
iati
on
)C
reat
edS
amp
led
Max
area
(m2)
Max
dep
th(m
)
Em
erg
edv
eget
atio
nco
ver
Su
bm
erg
edv
eget
atio
nco
ver
Su
bst
rate
typ
eF
ish
Man
-mad
e§
10y
Kal
mar
Dam
me
(KD
)19
9620
06–2
008
180,
000
1.8
50%
80%
Det
ritu
sP
rese
nt
Lju
ng
by
ho
lm(L
J)19
9820
08–2
009
300
2.0
20%
20%
Co
arse
gra
vel
Ab
sen
tR
esb
y(R
E)
1998
2008
–200
950
001.
515
%50
%C
lay
,d
etri
tus
Un
kn
ow
nM
an-m
ade
,3
yO
ver
stat
orp
(OV
)20
0520
06–2
008
20,0
00.
3.0
25%
25%
San
dP
rese
nt
Ro
ckn
eby
(RO
)20
0220
03–2
005
160
1.0
70%
70%
Cla
y,
san
dA
bse
nt
Tin
gb
y(T
I)20
0320
04–2
006
1000
.2.
510
%10
%S
and
,d
etri
tus
Pre
sen
tN
atu
ral
.50
yA
rby
Dam
me
(AD
)–
2004
–200
580
2.0
10%
0%C
lay
Ab
sen
tB
jork
eru
msd
amm
en(B
J)–
2006
–200
810
01.
510
%50
%S
and
,cl
ayP
rese
nt
Bo
llm
oss
en(B
O)
–20
05–2
006
5000
2.0
70%
50%
Det
ritu
sP
rese
nt
Bru
dh
ylt
etja
rn(B
R)
–20
07–2
009
3000
.2.
015
%15
%P
eat
Pre
sen
tG
lom
min
ge
(GL
)–
2007
–200
912
00.
550
%0%
Cla
yA
bse
nt
Igel
mo
ssen
(IG
)–
2006
–200
810
,000
1.5
10%
20%
San
d,
gra
vel
Pre
sen
tK
olb
od
aH
agb
y(K
O)
–20
06–2
008
2500
0.5
50%
0%D
etri
tus
Ab
sen
tL
enst
amo
ssen
(LE
)–
2004
–200
510
,000
2.0
70%
20%
Det
ritu
sP
rese
nt
Ny
torp
skar
ret
(NY
)–
2007
–200
924
000.
570
%0%
Pea
tA
bse
nt
Ty
ska
Bru
ket
(TB
)–
2004
–200
572
0.5
50%
0%D
etri
tus
Ab
sen
t
26 A. RUHI ET AL. [Volume 31

range of depths (10–40 cm). We preserved samples insitu in 70% ethanol. We sorted samples and identifiedmacroinvertebrates in the laboratory. Identificationwas carried out mostly to species level, except forOligochaeta and Chironomidae.
Coleoptera study.—We visited each of the 16 wet-lands 4 times with §1 spring and §1 autumnsampling visit over 2–3 consecutive years between2003 and 2009. We designed the sampling procedureto capture the maximum number of aquatic Coleop-tera. We sampled with a dip net (0.5-mm mesh size).The maximum sampling depth was 1 m and samplescovered all microhabitats. We applied a basic sam-pling effort of 10 min with a sampling rationale towork the site until no new morphospecies werefound. We devoted equal effort to recording commonand rarer species (Eyre et al. 1986). We passedsamples through a 0.5-mm mesh, transferred themto 70% ethanol, and sorted and identified coleopter-ans to species level in the laboratory.
Data analysis
Macroinvertebrate study.—We assessed taxonomicchanges over time with analysis of similarities(ANOSIM). This test operates on a resemblancematrix and is similar to a standard univariate analysisof variance (ANOVA), but requires neither normalitynor homoscedasticity of data. We compared speciesabundance matrices among years. The analysisreturns a global R and a p-value expressed as apercentage. When R is negative or close to 0,similarities within groups (samples within the sameperiod) and among groups (samples in differentperiods) are equivalent. In contrast, when R valuesapproach 1, samples are more similar within thanamong groups, and groups of samples from differentperiods are differentiated (Clarke and Warwick2001b). We built the distance matrix with the Bray–Curtis similarity measure, based on a sample 3
species matrix of abundance data, originally stan-dardized and 4!(x)-transformed. We used similarity ofpercentages analysis (SIMPER) to identify the speciesthat characterized the community of each period. Weordered species from more to less contribution to thetotal within-period similarity and established a cut-offfor a global contribution of 70%. Within the selectedspecies, we considered as typifying those thatcontributed a large proportion to the total within-period similarity and were found at consistentabundance among samples in that period (criterion:mean contribution/SD . 2). A full description ofSIMPER analysis is provided by Clarke (1993). Weused 2-dimensional nonparametric multidimensional
scaling (MDS) to visualize community patterns (99restarts, 0.01 minimum stress, Kruskal fit scheme 1).We standardized and 4!(x)-transformed abundancesand used Bray–Curtis distances. Groups of sampleswith several thresholds of similarity (12.5%, 25%,50%) were calculated by means of clustering (com-plete linkage), and the best threshold was representedover the MDS diagram.
We analyzed 3 categories of biological traits fromthose put forward by Tachet et al. (2002): reproductivecycles/y, type of dispersion, and feeding strategy. Weused affinity scores (Tachet et al. 2002) for each genusto evaluate 11 traits within these categories. Affinityscores ranged from 0 (i.e., no affinity) to 5 (i.e., highaffinity). This fuzzy coding technique (Chevenet et al.1994) allowed us to build a biological traits abundancematrix. We tested for changes in biological traits overtime with generalized linear mixed models (GLMMs).We used GLMM to overcome autocorrelation be-tween observations (more similarity is expectedamong sites within a visit than among different visits)and nested data structures (each period encompassed3 visits). We built a model in which the responsevariable was the modality of each biological trait(abundance/sample), the fixed explanatory variablewas a nested structure (period factor [year] was fixedand visit factor [visits within each period] was nestedwithin the period), and sampling site was random toovercome spatial pseudoreplication. In mixed models,random effects account for pseudoreplication bymodelling the covariance structure introduced in therandom part of the model (Crawley 2002). We startedwith a model without interactions. Validation of themodel showed no significant patterns in the residuals,so we followed the current consensus (Zuur et al.2009) and decided not to include interactions thatwould have improved the model at the expense ofincreasing the difficulty of biological interpretation ofthe results. We applied the Bonferroni procedure tocompensate for the effects of multiple tests on Type Ierrors (adjusted p = 0.0045). We used post hoc Scheffetests to examine pairwise differences among periods.
In addition, we selected 6 measures of communitystructure for analysis: numerical abundance (N),average taxonomic distinctness (D+), variation intaxonomic distinctness (L+), Pielou’s evenness index(J’), rarefied species richness (S1), and cumulativespecies richness (S2). Biodiversity analyses are oftenbased on species richness alone, but taxonomicrelatedness also should be considered because assem-blages composed only of taxonomically relatedspecies should be regarded as less diverse than thosethat host more distantly related species (Warwick andClarke 1995, Abellan et al. 2006). Average taxonomic
2012] PRIMARY SUCCESSION IN MAN-MADE WETLANDS 27
distinctness (D+) represents the average path length inthe phylogenetic tree connecting 2 random species ofthose collected, whereas variation in taxonomicdistinctness (L+) measures the variance in pairwiselengths between each pair of species and reflects theunevenness of the taxonomic tree (Clarke and War-wick 2001a, Clarke and Gorley 2006). We took intoaccount species, genus, family, order, class, subphy-lum, and phylum and used the same branch length toweight each taxonomic level. Abundance was variableamong samples, so we calculated richness using ararefaction procedure with the function rarefy deriv-ing from the vegan library (Oksanen et al. 2010). Thisfunction, which was inspired by Heck et al. (1975),calculates the estimated species richness for a numberof individuals by simulating random draws of a fixednumber of individuals based on the least abundantsample. S1 is not an estimate of the total communityrichness, but it permits an unbiased comparisonbetween samples of unequal abundance. Thus, it canbe regarded as a measure of diversity because, for agiven number of taxa, it will increase with theevenness of species abundance (Lods-Crozet andCastella 2009). We calculated S2 by considering allspecies present at least once within each period andaccumulating species from one period to the next. Wetested community variables for changes over timewith GLMM and used the same model design as forbiological traits. We explored but did not test S2statistically because of the lack of replicates. Welog(x)-transformed N to ensure a better fit of errors toa normal distribution. For each variable, we usedScheffe post hoc tests to compare values among the 5periods. We used general linear models (GLMs) withperiod as a fixed factor to examine differences inenvironmental variables (air temperature, precipita-tion, and water-chemistry variables) among periods.Because of the poor taxonomical resolution ofOligochaeta and Chironomidae, we took these groupsinto account only when their inclusion did not createa bias caused by taxonomic lumping. In the case ofbiological traits, we included these groups only in theanalyses of reproductive cycles per year and dispers-al. In the case of community variables, we includedthese groups only in determination of N.
Coleoptera study.—We analyzed coleopteran assem-blages based on a single matrix of 186 species(variables) and 64 samples (16 sites 3 4 visits/site).We analyzed 2 factors: 1) wetland type (man-madewetlands ,3 y, man-made wetlands §10 y, andnatural wetlands) and 2) wetland site (each of the 16wetlands). We used ANOSIM to test for differences inColeoptera composition across wetland types and sites.We used a 2-way nested layout in which the 2 factors
were hierarchic (site factor nested within type factor).We built a rectangular matrix based on originallystandardized and posteriorly 4!(x)-transformed datausing the Bray–Curtis similarity measure. We usedSIMPER with wetland type as factor to detect whichspecies contributed .1% to the similarity of eachwetland type. We calculated Coleoptera richness (Sc)by summing all recorded species for each wetland in agiven visit. We examined varability in Sc with a GLMwith type as a fixed factor. To assess the statisticalconsequences of the unbalanced design, we ran 5GLMs in which we selected 3 natural-wetland sites atrandom. The results of these GLMs were similar tothose obtained with the unbalanced design. Therefore,we report the results for the unbalanced modelsbecause they included data from more wetlands thanthe balanced GLMs. We used post hoc Scheffe tests toexamine pairwise differences among wetland types.Last, we used 2-dimensional MDS to visualize patternsin coleopteran assemblages among wetland types (99restarts, 0.01 minimum stress, Kruskal fit scheme 1).
We used PRIMER (version 6.0 for Windows;PRIMER-E, Plymouth, UK) for cluster analysis,ANOSIM, SIMPER, MDS, and calculations of allcommunity variables except for S1 richness. We usedPASW (version 18; SPSS, Chicago, Illinois) to runGLMMs, GLMs, and Scheffe post hoc tests.
Results
Macroinvertebrate study
Overview.—No environmental or water-chemistryvariables varied significantly among the 5 periods.Across the study, annual mean air temperature variedbetween 7.3 and 8.2uC (F4,55 = 0.324, p = 0.861),annual mean precipitation between 36.8 and 46.6 mm/mo (F4,55 = 0.187, p = 0.944), water pH between 7.1and 7.6 (F4,55 = 1.725, p = 0.158), DIN concentrationbetween 4.75 and 6.46 mg/L (F4,55 = 0.562, p = 0.691),and SRP concentration between 0.037 and 0.057 mg/L(F4,55 = 1.307, p = 0.279).
One hundred taxa were found at Kalmar Damme.The groups with the highest species richness were:Coleoptera (23), Trichoptera (15), and Heteroptera(14). Six taxonomic groups dominated the communityacross the 5 periods spanning 13 y (Chironomidae,Asellidae, Corixidae, Baetidae, Oligochaeta, andPlanorbidae) and always contributed .80% of theabundance. The relative composition of taxonomicgroups was different for each period. For example,periods I and V were dominated by Chironomidae(with secondary groups being Corixidae in period Iand Oligochaeta in period V). However, duringperiods II, III, and IV Baetidae were abundant, the
28 A. RUHI ET AL. [Volume 31
numbers of Asellidae increased, and the numbers ofCorixidae declined (Fig. 2A). Eighteen families werepresent in period I. Eleven new families arrived inperiod II, 5 in period III, and 2 in period IV, whereasno new families appeared in period V.
Species composition.—Each of the 5 periods wascharacterized by a significantly different speciescomposition (ANOSIM global R = 0.778, p = 0.001;all pairwise R . 0.600, p , 0.05). MDS and clusteranalysis showed that the samples were different ineach period and that the samples were distributedalong a gradient related to time. The threshold of12.5% similarity was selected for grouping samplescorresponding to: 1) an early phase (period I), 2) anintermediate phase (periods II, III and IV), and 3) anadvanced phase (period V) (Fig. 3).
Changes in community composition were furtherconfirmed by SIMPER. Of the 17 species selected bythis method, only 8 were categorized as typifyingspecies (Table 3). These typifying species distin-guished one period from the next. However, periodsII, III, and IV shared the same main species. Thus, theearly phase was mainly represented by Sigara striata,the intermediate phase by Asellus aquaticus, and theadvanced phase by Sialis lutaria. Period III presented 6different species that typified the community (insteadof a range of 1–3 obtained in the other periods). Also,the mean similarity in composition of each periodgrew from the lowest level in the early phase (39.98%)to the highest level in the advanced phase (56.43%),with a mean of 51.69% during the intermediate phase.
Biological traits.—Most biological traits presentedsignificant differences across periods, but the rela-tionship between these trends and our hypotheseswas not always clear (Table 4). Species with short lifecycles did not differ significantly among periods,whereas species with long life cycles increased overtime (i.e., during periods III, IV, and V) until theybecame dominant (as expected). Species with aquaticdispersal did not differ significantly among periods.Species with active aerial dispersal were significantlymore abundant in period V than in earlier periods (theinverse trend to that expected), and the abundance ofpassive aerial species increased over time (as expect-ed). The abundance of herbivores did not differamong periods, and filter-feeders were most abun-dant in period V (the inverse trend to that expected).Shredders decreased over time (as expected), whereasthe remaining feeding types (fine sediment collectors,predators, and parasites) presented low values duringthe early periods and became more common overtime with high values in period V.
Community variables.—Most community variableschanged as hypothesized. GLMMs and post hoc tests
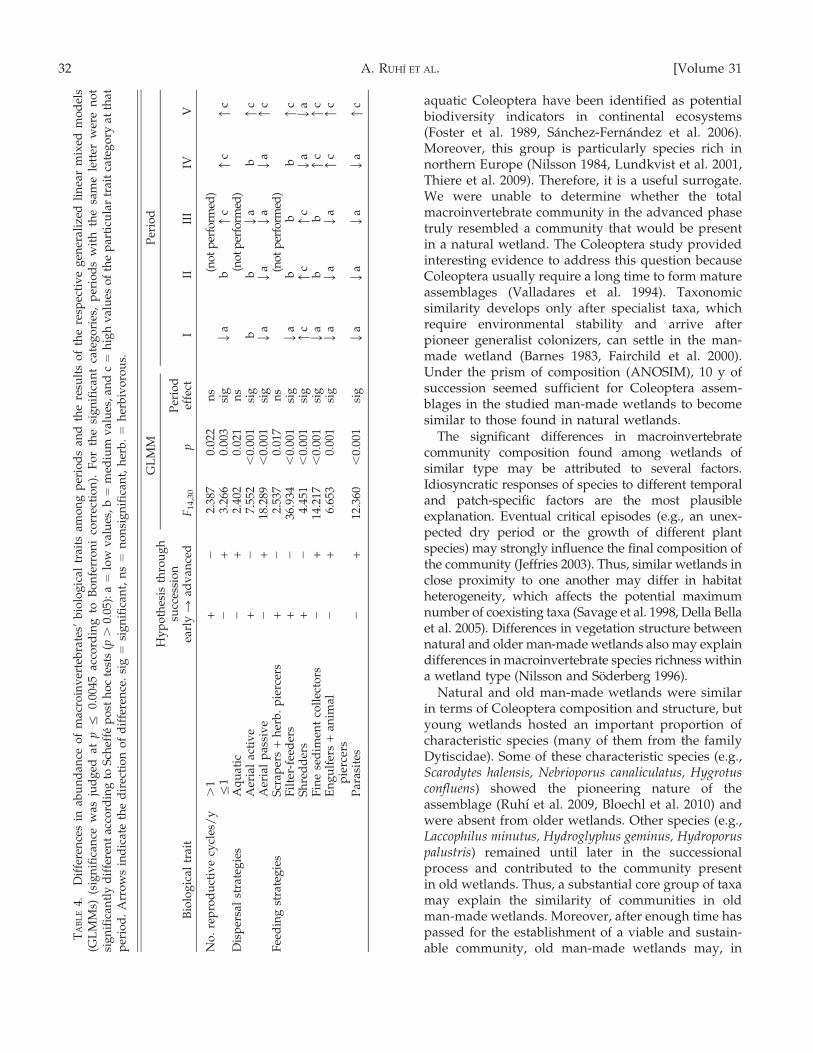
showed that N was low during periods I, II, III, andIV, and was significantly higher in period V (Fig. 2B).D+ and L+ showed that period V contained moretaxonomically unrelated taxa than earlier periods, andthe tree composition was more even than duringpreceding periods (Fig. 4A, B). J’ was significantlyhigher in period I than in period III (inverse trend tothat expected; Fig. 4C). The highest values for S1occurred during the intermediate phase and S2tended toward an asymptote (as expected) thatapproached 100 species (Fig. 4D).
Coleoptera study
The composition of each wetland was distinctive,regardless of wetland type (ANOSIM, R = 0.912, p =
0.001). Significant compositional differences wereobtained when comparing young (,3 y) and old(§10 y) man-made wetlands (R = 0.518, p = 0.001)and young man-made wetlands with natural wet-lands (R = 0.324, p = 0.001). In contrast, compositiondid not differ between old and natural wetlands (R =
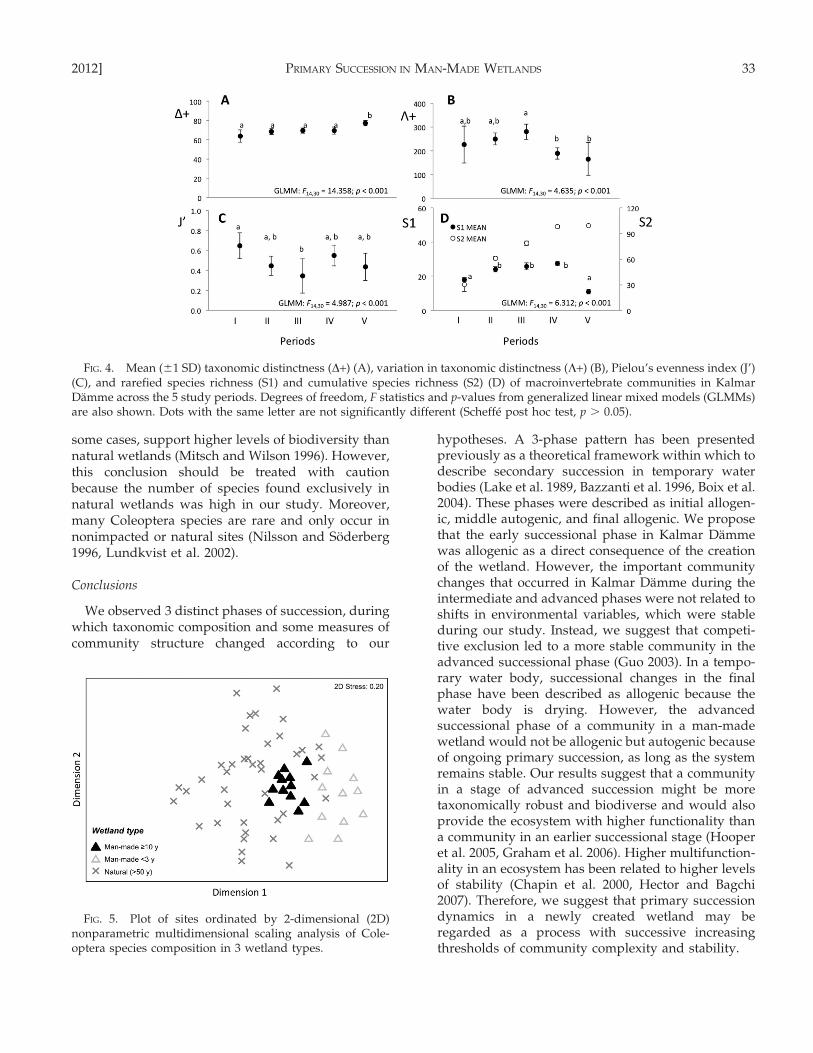
20.150, p = 0.986). In the MDS plot, samples obtainedfrom old man-made wetlands were intermediatebetween samples from young man-made wetlandsand from natural wetlands (Fig. 5). Furthermore, oldman-made wetlands shared the highest number of the45 species selected by SIMPER (56% of total species)with other wetland types, i.e., 17.7% of the 45 specieswere shared with young man-made wetlands, 23.6%
were shared with natural wetlands, and 14.7% wereshared with both types of wetlands. Moreover, allspecies that were common to young man-madewetlands and natural wetlands also were present inold man-made wetlands. Exclusive species occurredmore often (48% of species) in natural wetlands thanin other wetland types (Table 5).
Sc differed significantly among wetland types (F2,61
= 14.356, p , 0.001). Old man-made wetlands hadsignificantly higher Sc than young man-made ornatural wetlands, but Sc did not differ between youngman-made and natural wetlands (Fig. 6).
Discussion
Succession of biological traits
The biological traits and method used (based onfuzzy coding) in our study provided meaningfulinformation about the ecological functioning of thisnewly created freshwater system despite the unavoid-able arbitrariness of assigning species to multipletraits groups (Hooper et al. 2002, Wright et al. 2006).In the macroinvertebrate study, both taxonomiccomposition and biological traits analyses displayed
2012] PRIMARY SUCCESSION IN MAN-MADE WETLANDS 29

a 3-phase pattern, and certain life-history strategieswere characteristic of the early, intermediate, andadvanced phases of succession. As expected, thenumber of individuals with long life spans and latematurities increased over time. These features areassociated with ecological stability rather than envi-ronmental stress (Townsend and Hildrew 1994,Bonada et al. 2007). Also as expected (Batzer andWissinger 1996), aerial passive dispersal was more
common in advanced rather than at early phases ofsuccession. Contrary to expectations, active dispersersalso dominated in the advanced successional phase.Initial dominance of this strategy is expected whendispersal distances can be covered efficiently by flight(Barnes 1983, Velasco et al. 1993, Bloechl et al. 2010).The high abundance of chironomids (active dispers-ers) in the advanced successional phase in our studywetlands might explain the lack of support for thishypothesis.
The abundances of most functional feeding groupsincreased over time. The results supported ourpredictions for fine sediment collectors, predators,and parasites, but contradicted our predictions forfilter-feeders, which were expected to decrease.Hydrological conditions of man-made wetlandsstrongly affect the resultant communities (Mitschand Wilson 1996). The unexpectedly high abundanceof filter-feeders in the late successional phase mighthave been a consequence of the continuous inputof nutrient-rich water, which may have sustainedindividuals in this guild throughout the study period(Gallardo et al. 2009). As expected based on theirdependence on macrophytes and large terrestrial litter(Voshell and Simmons 1984), shredders dominated atthe early rather than at the advanced successionalphase. Plant cover strongly influences macroinverte-brate communities (de Szalay and Resh 2000), andsubmerged macrophytes (mainly Elodea) covered
FIG. 2. Dominant taxonomic groups (A) and mean (61 SD) numerical abundance (B) of macroinvertebrates in Kalmar Dammefor each of the 5 study periods. Bars with the same letter are not significantly different (Scheffe post hoc test, p . 0.05).
FIG. 3. Plot of sites ordinated by 2-dimensional (2D)nonparametric multidimensional scaling analysis ofmacroinvertebrate species composition. Circles enclosegroups of sites with similarity .12.5% (similaritypercentages analysis).
30 A. RUHI ET AL. [Volume 31
large areas of the wetland during the early succes-sional stage and into the intermediate stage butdeclined mid-way through our study. Predators arean important component of macroinvertebrate com-munities in the initial phases of succession in bothtemporary and newly created water bodies (e.g.,Layton and Voshell 1991, Boix et al. 2006). Moreover,predator abundance increases over time as wetlandsundergo succession (Batzer and Wissinger 1996).Thus, predation is an important mechanism increating community structure in freshwater habitats(reviewed by Wellborn et al. 1996).
Community structure
In the macroinvertebrate study, maximum N wasrecorded at the advanced phase, as expected (Gutier-rez and Fey 1980, Legendre et al. 1985). However, thisincrease was mainly explained by the dominance ofchironomids. Thus, the hypothesized accompanyingincrease in evenness was not supported. Communitystructure was clearer under the prism of taxonomicdistinctness indices than when viewed in terms ofdiversity. On the one hand, the initial low values ofD+ and L+ showed that only a few taxonomic groupscolonized the wetland, a pattern that has beenobserved frequently in other systems (Velasco et al.1993, Heino et al. 2005, Ruhı et al. 2009). On the otherhand, despite a decline in S1, the increase in D+ near
the end of the study showed that the accumulation ofspecies during succession (S2) contributed to a moretaxonomically diverse community at the advancedphase. Moreover, the decrease in L+ demonstratedthat the taxonomic structure of the communitybecame more complex and more even in the advancedsuccessional phase. The arrival of new and taxonom-ically unrelated species took place in several taxo-nomic groups and largely compensated for the loss ofspecies from the few species-rich pioneer groups.Overall, the uneven community structure with lowtaxonomic distinction in the early phase developedprogressively into a richer, more even, and regularstructure. Maximum S1 was attained during theintermediate period, and increases in S2 showed thatnew species continued to colonize the area, trendsthat were expected (Margalef 1968, Batzer and Wis-singer 1996, Guo 2003, Milner and Robertson 2010).However, the rate of colonization declined over timeuntil it was almost negligible between periods IV andV, .10 y after creation of the wetland.
Man-made wetlands vs natural wetlands
Use of surrogate or model groups with biodiversitymetrics often has raised the criticism that thesurrogate group might not be representative of othergroups within the community of interest (Bonn andGaston 2005, Rodrigues and Brooks 2007). However,
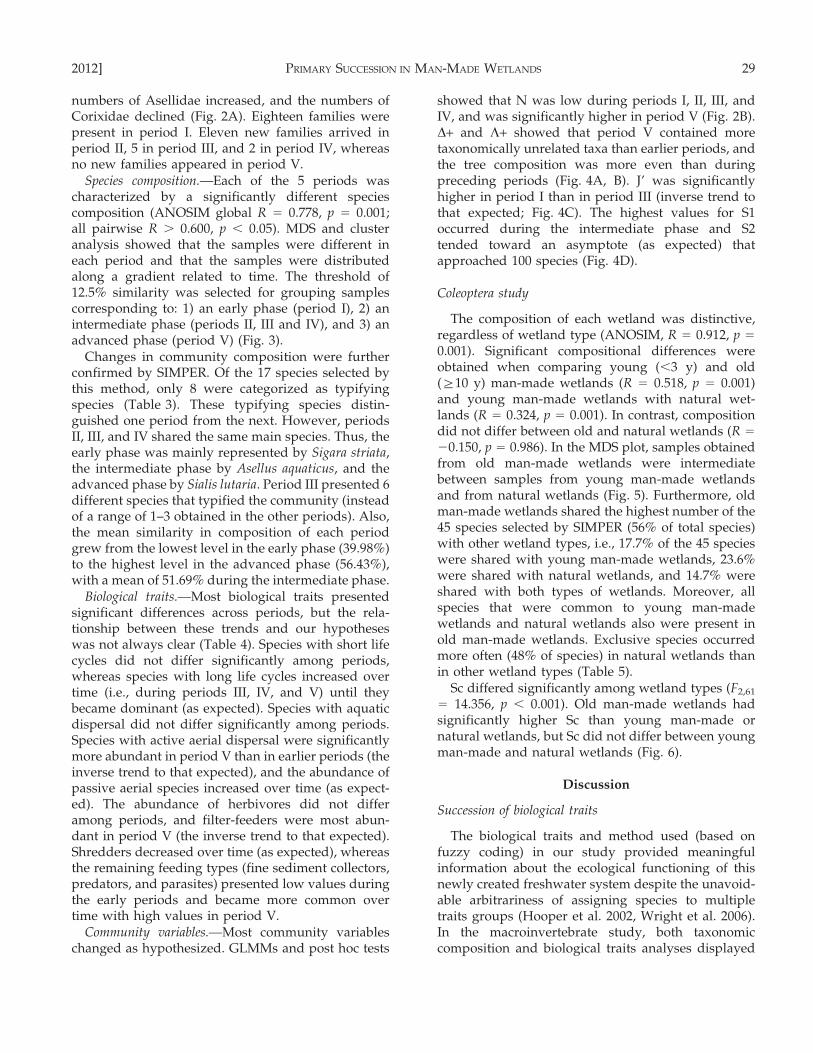
TABLE 3. Similarity of percentages (SIMPER) analysis of macroinvertebrate community composition in Kalmar Damme. Valuesrepresent the percentage contribution of each species to the within-period similarity (only the most important species contributingglobally up to 70% of the within-period similarity are shown). Bold indicates species that consistently typified the community bycontributing a large proportion to total within-period similarity and being found at consistent abundance among samples in thatperiod (criterion: mean contribution/SD . 2).
Species
Period
I II III IV V
Average similarity (%) 39.98 50.38 58.00 46.71 56.43
Sigara striata 38.63* 8.83* 5.95Asellus aquaticus 18.88 27.11* 25.29* 24.20*Callicorixa praeusta 13.93Cloeon inscriptum 16.72* 9.09* 15.81Planorbis sp. 9.02 7.96*Erpobdella octoculata 7.73*Glyphotaelius pellucidus 7.17*Ischnura elegans 5.09*Gyraulus sp. 4.83 10.47Helobdella stagnalis 4.63 3.65Phryganea bipunctata 5.56Coenagrion puella/pulchellum 5.59Brachytron pratense 3.49Notonecta glauca 3.37Sialis lutaria 30.71*Pisidium sp. 15.39Agrypnia sp. 14.72
2012] PRIMARY SUCCESSION IN MAN-MADE WETLANDS 31
aquatic Coleoptera have been identified as potentialbiodiversity indicators in continental ecosystems(Foster et al. 1989, Sanchez-Fernandez et al. 2006).Moreover, this group is particularly species rich innorthern Europe (Nilsson 1984, Lundkvist et al. 2001,Thiere et al. 2009). Therefore, it is a useful surrogate.We were unable to determine whether the totalmacroinvertebrate community in the advanced phasetruly resembled a community that would be presentin a natural wetland. The Coleoptera study providedinteresting evidence to address this question becauseColeoptera usually require a long time to form matureassemblages (Valladares et al. 1994). Taxonomicsimilarity develops only after specialist taxa, whichrequire environmental stability and arrive afterpioneer generalist colonizers, can settle in the man-made wetland (Barnes 1983, Fairchild et al. 2000).Under the prism of composition (ANOSIM), 10 y ofsuccession seemed sufficient for Coleoptera assem-blages in the studied man-made wetlands to becomesimilar to those found in natural wetlands.
The significant differences in macroinvertebratecommunity composition found among wetlands ofsimilar type may be attributed to several factors.Idiosyncratic responses of species to different temporaland patch-specific factors are the most plausibleexplanation. Eventual critical episodes (e.g., an unex-pected dry period or the growth of different plantspecies) may strongly influence the final composition ofthe community (Jeffries 2003). Thus, similar wetlands inclose proximity to one another may differ in habitatheterogeneity, which affects the potential maximumnumber of coexisting taxa (Savage et al. 1998, Della Bellaet al. 2005). Differences in vegetation structure betweennatural and older man-made wetlands also may explaindifferences in macroinvertebrate species richness withina wetland type (Nilsson and Soderberg 1996).
Natural and old man-made wetlands were similarin terms of Coleoptera composition and structure, butyoung wetlands hosted an important proportion ofcharacteristic species (many of them from the familyDytiscidae). Some of these characteristic species (e.g.,Scarodytes halensis, Nebrioporus canaliculatus, Hygrotusconfluens) showed the pioneering nature of theassemblage (Ruhı et al. 2009, Bloechl et al. 2010) andwere absent from older wetlands. Other species (e.g.,Laccophilus minutus, Hydroglyphus geminus, Hydroporuspalustris) remained until later in the successionalprocess and contributed to the community presentin old wetlands. Thus, a substantial core group of taxamay explain the similarity of communities in oldman-made wetlands. Moreover, after enough time haspassed for the establishment of a viable and sustain-able community, old man-made wetlands may, in
TA
BL
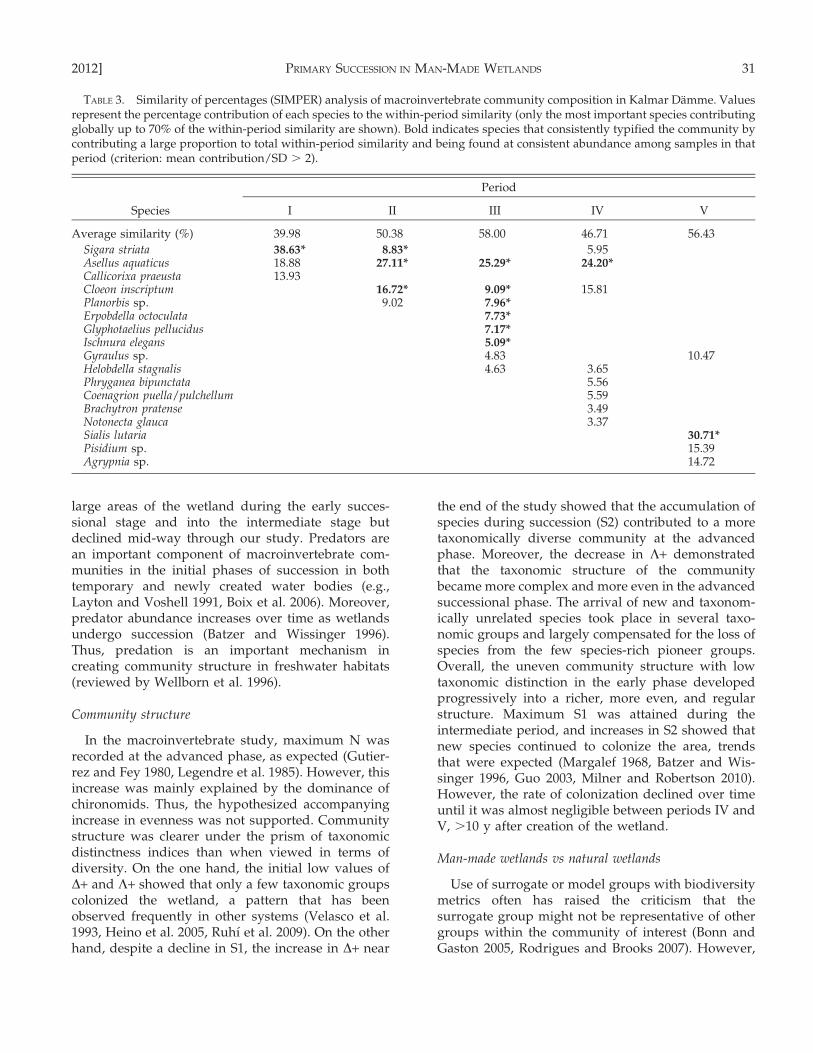
E4.
Dif
fere
nce
sin
abu
nd
ance
of
mac
roin
ver
teb
rate
s’b
iolo
gic
altr
aits
amo
ng
per
iod
san
dth
ere
sult
so
fth
ere
spec
tiv
eg
ener
aliz
edli
nea
rm
ixed
mo
del
s(G
LM
Ms)
(sig
nif
ican
cew
asju
dg
edat
pƒ
0.00
45ac
cord
ing
toB
on
ferr
on
ico
rrec
tio
n).
Fo
rth
esi
gn
ific
ant
cate
go
ries
,p
erio
ds
wit
hth
esa
me
lett
erw
ere
no
tsi
gn
ific
antl
yd
iffe
ren
tac
cord
ing
toS
chef
fep
ost
ho
cte
sts
(p.
0.05
):a
=lo
wv
alu
es,
b=
med
ium
val
ues
,an
dc
=h
igh
val
ues
of
the
par
ticu
lar
trai
tca
teg
ory
atth
atp
erio
d.
Arr
ow
sin
dic
ate
the
dir
ecti
on
of
dif
fere
nce
.si
g=
sig
nif
ican
t,n
s=
no
nsi
gn
ific
ant,
her
b.
=h
erb
ivo
rou
s.
Bio
log
ical
trai
t
Hy
po
thes
isth
rou
gh
succ
essi
on
earl
yR
adv
ance
d
GL
MM
Per
iod
F1
4,3
0p
Per
iod
effe
ctI
IIII
IIV
V
No
.re
pro
du
ctiv
ecy
cles
/y
.1
+2
2.38
70.
022
ns
(no
tp
erfo
rmed
)ƒ
12
+3.
266
0.00
3si
gQ
ab
qc
qc
qc
Dis
per
sal
stra
teg
ies
Aq
uat
ic2
+2.
402
0.02
1n
s(n
ot
per
form
ed)
Aer
ial
acti
ve
+2
7.55
2,
0.00
1si
gb
bQ
ab
qc
Aer
ial
pas
siv
e2
+18
.289
,0.
001
sig
Qa
Qa
Qa
Qa
qc
Fee
din
gst
rate
gie
sS
crap
ers
+h
erb
.p
ierc
ers
+2
2.53
70.
017
ns
(no
tp
erfo
rmed
)F
ilte
r-fe
eder
s+
236
.934
,0.
001
sig
Qa
bb
bq
cS
hre
dd
ers
+2
4.45
1,
0.00
1si
gq
cq
cq
cQ
aQ
aF
ine
sed
imen
tco
llec
tors
2+
14.2
17,
0.00
1si
gQ
ab
bq
cq
cE
ng
ulf
ers
+an
imal
pie
rcer
s2
+6.
653
0.00
1si
gQ
aQ
aQ
aq
cq
c
Par
asit
es2
+12
.360
,0.
001
sig
Qa
Qa
Qa
Qa
qc
32 A. RUHI ET AL. [Volume 31
some cases, support higher levels of biodiversity thannatural wetlands (Mitsch and Wilson 1996). However,this conclusion should be treated with cautionbecause the number of species found exclusively innatural wetlands was high in our study. Moreover,many Coleoptera species are rare and only occur innonimpacted or natural sites (Nilsson and Soderberg1996, Lundkvist et al. 2002).
Conclusions
We observed 3 distinct phases of succession, duringwhich taxonomic composition and some measures ofcommunity structure changed according to our
hypotheses. A 3-phase pattern has been presentedpreviously as a theoretical framework within which todescribe secondary succession in temporary waterbodies (Lake et al. 1989, Bazzanti et al. 1996, Boix et al.2004). These phases were described as initial allogen-ic, middle autogenic, and final allogenic. We proposethat the early successional phase in Kalmar Dammewas allogenic as a direct consequence of the creationof the wetland. However, the important communitychanges that occurred in Kalmar Damme during theintermediate and advanced phases were not related toshifts in environmental variables, which were stableduring our study. Instead, we suggest that competi-tive exclusion led to a more stable community in theadvanced successional phase (Guo 2003). In a tempo-rary water body, successional changes in the finalphase have been described as allogenic because thewater body is drying. However, the advancedsuccessional phase of a community in a man-madewetland would not be allogenic but autogenic becauseof ongoing primary succession, as long as the systemremains stable. Our results suggest that a communityin a stage of advanced succession might be moretaxonomically robust and biodiverse and would alsoprovide the ecosystem with higher functionality thana community in an earlier successional stage (Hooperet al. 2005, Graham et al. 2006). Higher multifunction-ality in an ecosystem has been related to higher levelsof stability (Chapin et al. 2000, Hector and Bagchi2007). Therefore, we suggest that primary successiondynamics in a newly created wetland may beregarded as a process with successive increasingthresholds of community complexity and stability.
FIG. 4. Mean (61 SD) taxonomic distinctness (D+) (A), variation in taxonomic distinctness (L+) (B), Pielou’s evenness index (J’)(C), and rarefied species richness (S1) and cumulative species richness (S2) (D) of macroinvertebrate communities in KalmarDamme across the 5 study periods. Degrees of freedom, F statistics and p-values from generalized linear mixed models (GLMMs)are also shown. Dots with the same letter are not significantly different (Scheffe post hoc test, p . 0.05).
FIG. 5. Plot of sites ordinated by 2-dimensional (2D)nonparametric multidimensional scaling analysis of Cole-optera species composition in 3 wetland types.
2012] PRIMARY SUCCESSION IN MAN-MADE WETLANDS 33

Acknowledgements
This work was supported by a PhD grant and aScientific Research grant (CGL2008 05778/BOS) fromthe Ministerio de Ciencia y Tecnologıa of the SpanishGovernment. The authors thank Anders Bostrom andIsabell Petersson for assistance with sampling, sort-ing, and identification of samples from 1997–2003;Claes Kungberg for chemistry data; Nuria Pla for herwork on Fig. 1; David Estany-Tigerstrom for helpwith the GLMM models; Darold P. Batzer for generalcomments; David Butterfield, Gail Schofield, andJeffrey Garnett for English revision; and anonymousreviewers and associate editor Heikki Mykra forcomments that improved the initial manuscript.
Literature Cited
ABELLAN, P., D. T. BILTON, A. MILLAN, D. SANCHEZ-FERNANDEZ,AND P. M. RAMSAY. 2006. Can taxonomic distinctnessassess anthropogenic impacts in inland waters? A casestudy from a Mediterranean river basin. FreshwaterBiology 51:1744–1756.
ALLEN, T. F. H., S. M. BARTELL, AND J. F. KOONCE. 1977. Multiplestable configurations in ordination of phytoplanktoncommunity change rates. Ecology 58:1076–1084.
BARNES, L. E. 1983. The colonization of ball-clay ponds bymacroinvertebrates and macrophytes. Freshwater Biol-ogy 13:561–578.
BASS, D. 1992. Colonization and succession of benthicmacroinvertebrates in Arcadia Lake, a South-CentralUSA reservoir. Hydrobiologia 242:123–131.
BATZER, D. P., AND S. A. WISSINGER. 1996. Ecology of insectcommunities in nontidal wetlands. Annual Review ofEntomology 41:75–100.
TA
BL
E5.
Sim
ilar
ity
of
per
cen
tag
es(S
IMP
ER
)an
aly
sis
of
Co
leo
pte
rasp
ecie
sco
mp
osi
tio
nin
3w
etla
nd
typ
es.
Val
ues
rep
rese
nt
per
cen
tag
eco
ntr
ibu
tio
ns
of
spec
ies
toea
chw
etla
nd
typ
e(o
nly
spec
ies
wit
h.
1%co
ntr
ibu
tio
nto
each
wit
hin
-wet
lan
d-t
yp
esi
mil
arit
yar
esh
ow
n).
MM
=m
an-m
ade
wet
lan
d,
Nat
=
nat
ura
lw
etla
nd
.
Sp
ecie
sM
M,
3y
MM
§10
yN
at.
50y
Sp
ecie
sM
M,
3y
MM
§10
yN
at.
50y
Sp
ecie
sM
M,
3y
MM
§10
yN
at.
50y
Lac
cop
hil
us
min
utu
s13
.01.
3–
Hal
iplu
sh
eyd
eni
1.7
5.1
–H
elop
hor
us
min
utu
s–
2.0
2.6
Sca
rod
yte
sh
alen
sis
12.9
––
Lac
cobi
us
min
utu
s1.
71.
3–
Hy
dro
por
us
ery
thro
cep
hal
us
–2.
05.
4N
ebri
opor
us
can
alic
ula
tus
10.6
––
Aci
liu
sca
nal
icu
latu
s1.
5–
–E
noc
hru
ste
stac
eus
–1.
7–
Hy
dro
gly
ph
us
gem
inu
s7.
22.
9–
Rh
antu
ssu
tura
lis
1.2
3.2
2.0
Gra
pto
dy
tes
bili
nea
tus
––
6.3
Hy
dro
por
us
pal
ust
ris
5.2
2.0
2.3
Hal
iplu
sru
fico
llis
–1.
6–
Och
theb
ius
min
imu
s–
–4.
4H
yg
rotu
sco
nfl
uen
s4.
8–
–N
oter
us
clav
icor
nis
–6.
92.
0G
rap
tod
yte
sg
ran
ula
ris
––
4.2
Hy
gro
tus
inae
qual
is3.
84.
93.
2H
elop
hor
us
brev
ipal
pis
–5.
13.
0H
yg
rotu
sd
ecor
atu
s–
–4.
2A
nac
aen
alu
tesc
ens
3.3
8.6
5.2
Hyg
rotu
sim
pres
sopu
nct
atu
s–
4.5
–D
ryop
sau
ricu
latu
s–
–4.
1
Gy
rin
us
nat
ator
2.6
––
Lac
cobi
us
bip
un
ctat
us
–4.
0–
Dry
ops
sim
ilar
is–
–3.
8L
imn
ebiu
str
un
cate
llu
s2.
6–
–H
yd
rop
oru
su
mbr
osu
s–
3.6
1.0
Hal
iplu
sv
arie
gat
us
––
3.7
Ily
biu
sfu
lig
inos
us
2.3
3.6
–H
yd
robi
us
fusc
ipes
–3.
63.
1B
eros
us
luri
du
s–
–3.
6A
gab
us
bip
ust
ula
tus
2.2
3.7
2.4
Hy
dro
por
us
tris
tis
–3.
54.
4H
yd
rop
oru
sg
yll
enh
alii
––
3.1
Ag
abu
sn
ebu
losu
s2.
1–
–H
eloc
har
esob
scu
rus
–2.
32.
9Il
ybi
us
chal
con
atu
s–
–2.
3A
gab
us
stu
rmii
1.9
4.9
–N
oter
us
cras
sico
rnis
–2.
2–
Cy
mbi
ody
tam
arg
inel
la–
–1.
7A
cili
us
sulc
atu
s1.
9–
–H
yd
rop
oru
sst
riol
a–
2.9
–C
opel
atu
sh
aem
orrh
odal
is–
–1.
5FIG. 6. Box-and-whisker plots of Coleoptera richness (Sc)
in 3 wetland types. Bars with the same letter are notsignificantly different (Scheffe post hoc test, p . 0.05). Linesin boxes show medians, box ends show quartiles, whiskersshow 95% confidence intervals, circles show outliers.
34 A. RUHI ET AL. [Volume 31

BAZZANTI, M., S. BALDONI, AND M. SEMINARA. 1996. Inverte-brate macrofauna of a temporary pond in Central Italy:composition, community parameters and temporalsuccession. Archiv fur Hydrobiologie 137:77–94.
BLOECHL, A., S. KOENEMANN, B. PHILIPPI, AND A. MELBER. 2010.Abundance, diversity and succession of aquatic Cole-optera and Heteroptera in a cluster of artificial ponds inthe North German Lowlands. Limnologica 40:215–225.
BOIX, D., J. SALA, S. GASCON, AND S. BRUCET. 2006. Predation ina temporary pond with special attention to the trophicrole of Triops cancriformis (Crustacea: Branchiopoda:Notostraca). Hydrobiologia 571:341–353.
BOIX, D., J. SALA, X. D. QUINTANA, AND R. MORENO-AMICH.2004. Succession of the animal community in aMediterranean temporary pond. Journal of the NorthAmerican Benthological Society 23:29–49.
BONADA, N., S. DOLEDEC, AND B. STATZNER. 2007. Taxonomicand biological trait differences of stream macroinverte-brate communities between mediterranean and temper-ate regions: implications for future climatic scenarios.Global Change Biology 13:1658–1671.
BONN, A., AND K. J. GASTON. 2005. Capturing biodiversity:selecting priority areas for conservation using differentcriteria. Biodiversity and Conservation 14:1083–1100.
CHAPIN, F. S., E. S. ZAVALETA, V. T. EVINER, R. L. NAYLOR, P. M.VITOUSEK, H. L. REYNOLDS, D. U. HOOPER, S. LAVOREL, O. E.SALA, S. E. HOBBIE, M. C. MACK, AND S. DIAZ. 2000.Consequences of changing biodiversity. Nature 405:234–242.
CHEVENET, F., S. DOLEDEC, AND D. CHESSEL. 1994. A fuzzycoding approach for the analysis of long-term ecologicaldata. Freshwater Biology 31:295–309.
CHRISTMAN, V. D., AND J. R. VOSHELL. 1993. Changes in thebenthic macroinvertebrate community in two years ofcolonization of new experimental ponds. InternationaleRevue der gesamten Hydrobiologie und Hydrographie78:481–491.
CLARKE, K. R. 1993. Non-parametric multivariate analyses ofchanges in community structure. Australian Journal ofEcology 18:117–143.
CLARKE, K. R., AND R. N. GORLEY. 2006. PRIMER v6: usermanual/tutorial. PRIMER-E, Plymouth, UK.
CLARKE, K. R., AND R. M. WARWICK. 2001a. A furtherbiodiversity index applicable to species lists: variationin taxonomic distinctness. Marine Ecology ProgressSeries 216:265–278.
CLARKE, K. R., AND R. M. WARWICK. 2001b. Changes in marinecommunities: an approach to statistical analysis andinterpretation. 2nd edition. PRIMER-E, Plymouth, UK.
CRAWLEY, M. 2002. Statistical computing. An introduction todata analysis using S-Plus. John Wiley and Sons Ltd.,Chichester, UK.
DANELL, K., AND K. SJOBERG. 1982. Successional patterns ofplants, invertebrates and ducks in a man-made lake.Journal of Applied Ecology 19:395–409.
DE SZALAY, F. A., AND V. H. RESH. 2000. Factors influencingmacroinvertebrate colonization of seasonal wetlands:responses to emergent plant cover. Freshwater Biology45:295–308.
DELLA BELLA, V., M. BAZZANTI, AND F. CHIAROTTI. 2005.Macroinvertebrate diversity and conservation status ofMediterranean ponds in Italy: water permanence andmesohabitat influence. Aquatic Conservation: Marineand Freshwater Ecosystems 15:583–600.
EYRE, M. D., S. G. BALL, AND G. N. FOSTER. 1986. An initialclassification of the habitats of aquatic Coleoptera innorth-east England. Journal of Applied Ecology 23:841–852.
FAIRCHILD, G. W., A. M. FAULDS, AND J. F. MATTA. 2000. Beetleassemblages in ponds: effects of habitat and site age.Freshwater Biology 44:523–534.
FORCE, D. C. 1981. Postfire insect succession in SouthernCalifornia chaparral. American Naturalist 117:575–582.
FOSTER, G. N., A. P. FOSTER, M. D. EYRE, AND D. T. BILTON.1989. Classification of water beetle assemblages inarable fenland and ranking of sites in relation toconservation value. Freshwater Biology 22:343–354.
FRIDAY, L. E. 1987. The diversity of macro invertebrate andmacrophyte communities in ponds. Freshwater Biology18:87–104.
GALLARDO, B., S. GASCON, M. GARCIA, AND F. A. COMIN. 2009.Testing the response of macroinvertebrate functionalstructure and biodiversity to flooding and confinement.Journal of Limnology 62:315–326.
GRAHAM, N. J., S. K. WILSON, S. JENNINGS, N. V. C. POLUNIN,J. P. BIJOUX, AND J. ROBINSON. 2006. Dynamic fragility ofoceanic coral reef ecosystems. Proceedings of theNational Academy of Sciences of the United States ofAmerica 103:8425–8429.
GUO, Q. 2003. Temporal species richness-biomass relation-ships along successional gradients. Journal of Vegeta-tion Science 14:121–128.
GUTIERREZ, L. T., AND W. R. FEY. 1980. Ecosystemsuccession: a general hypothesis and a test modelof a grassland. MIT Press, Cambridge, Massachusetts.
HECK, K. L., G. VAN BELLE, AND D. SIMBERLOFF. 1975. Explicitcalculation of the rarefaction diversity measurementand the determination of sufficient sample size. Ecology56:1459–1461.
HECTOR, A., AND R. BAGCHI. 2007. Biodiversity and ecosystemmultifunctionality. Nature 448:188–190.
HEINO, J., J. SOININEN, J. LAPPALAINEN, AND R. VIRTANEN. 2005.The relationship between species richness and taxo-nomic distinctness in freshwater organisms. Limnologyand Oceanography 50:978–986.
HERRMANN, J., A. BOSTROM, AND I. BOHMAN. 2000. Invertebratecolonisation into the man-made Kalmar Damme wet-land dam system. Verhandlungen der InternationalenVereinigung fur theoretische und angewandte Lim-nologie 27:1653–1656.
HOOPER, D. U., F. S. CHAPIN, J. J. EWEL, A. HECTOR,P. INCHAUSTI, S. LAVOREL, J. H. LAWTON, D. M. LODGE,M. LOREAU, S. NAEEM, B. SCHMID, H. SETALA, A. J. SYMSTAD,J. VANDERMEER, AND D. A. WARDLE. 2005. Effects ofbiodiversity on ecosystem functioning: a consensus ofcurrent knowledge. Ecological Monographs 75:3–35.
HOOPER, D. U., M. SOLAN, A. SYMSTAD, S. DıAZ, M. O. GESSNER,N. BUCHMANN, V. DEGRANGE, P. GRIME, F. HULOT,
2012] PRIMARY SUCCESSION IN MAN-MADE WETLANDS 35
F. MERMILLOD-BLONDIN, J. ROY, E. SPEHN, AND L. VAN PEER.2002. Species diversity, functional diversity and ecosys-tem functioning. Oxford University Press, Oxford, UK.
HOV, A. M., AND B. WALSENG. 2003. Suksesjon av ferskvann-sinvertebrater i et nyetablert damsystem i Trogstadkommune. Norsk Institutt for Naturforskning (NINA),Oslo, Norway.
JEFFRIES, M. 2003. Idiosyncratic relationships between pondinvertebrates and environmental, temporal and patch-specific predictors of incidence. Ecography 26:311–324.
KAUFMAN, L. S. 1983. Effects of Hurricane Allen on reef fishassemblages near Discovery Bay, Jamaica. Coral Reefs 2:43–47.
LAKE, P. S., I. A. E. BAYLY, AND D. W. MORTON. 1989. Thephenology of a temporary pond in western Victoria,Australia, with special reference to invertebrate succes-sion. Archiv fur Hydrobiologie 115:171–202.
LANCASTER, J., F. EDWARDS, K. HALL, A. HOGAN, N. TOWERS, AND
S. TOWNSEND. 2004. Duloch Park remediation pondsbiomonitoring 1999–2003. Institute of Cell, Animal andPopulation Biology, University of Edinburgh, Edin-burgh, UK.
LAYTON, R. J., AND J. R. VOSHELL. 1991. Colonization of newexperimental ponds by benthic macroinvertebrates.Environmental Entomology 20:110–117.
LEGENDRE, P., S. DALLOT, AND L. LEGENDRE. 1985. Succession ofspecies within a community: chronological clustering,with applications to marine and freshwater zooplank-ton. American Naturalist 125:257–288.
LODS-CROZET, B., AND E. CASTELLA. 2009. Colonisation bymidges (Chironomidae, Diptera) of recently-createdshallow ponds: implications for the restoration oflacustrine fringing wetlands. Annales de Limnologie45:257–266.
LUNDKVIST, E., J. LANDIN, AND F. KARLSSON. 2002. Dispersingdiving beetles (Dytiscidae) in agricultural and urbanlandscapes in south-eastern Sweden. Annales ZoologiciFennici 39:109–123.
LUNDKVIST, E., J. LANDIN, AND P. MILBERG. 2001. Diving beetle(Dytiscidae) assemblages along environmental gradi-ents in an agricultural landscape in southeasternSweden. Wetlands 21:48–58.
MARGALEF, R. 1968. Perspectives in ecological theory.University of Chicago Press, Chicago, Illinois.
MILNER, A. M., AND A. L. ROBERTSON. 2010. Colonization andsuccession of stream communities in Glacier Bay,Alaska. What has it contributed to general successionaltheory? River Research and Applications 26:26–35.
MITSCH, W. J., AND R. F. WILSON. 1996. Improving the successof wetland creation and restoration with know-how,time, and self-design. Ecological Applications 6:77–83.
NIELL, F. X. 1981. Estructuras disipativas en la organizacion delos sistemas bentonicos. Oecologia Aquatica 5:239–245.
NILSSON, A. N. 1984. Species richness and succession ofaquatic beetles in some kettle-hole ponds in northernSweden. Ecography 7:149–156.
NILSSON, A. N., AND H. SODERBERG. 1996. Abundance andspecies richness patterns of diving beetles (Coleoptera,
Dytiscidae) from exposed and protected sites in 98northern Swedish lakes. Hydrobiologia 321:83–88.
ODUM, E. P. 1960. Organic production and turnover in oldfield succession. Ecology 41:34–49.
ODUM, E. P. 1971. Fundamentals of ecology. Saunders,Philadelphia, Pennsylvania.
OERTLI, B., J. BIGGS, R. CEREGHINO, P. GRILLAS, P. JOLY, AND J.-B.LACHAVANNE. 2005. Conservation and monitoring ofpond biodiversity: introduction. Aquatic Conservation:Marine and Freshwater Ecosystems 15:535–540.
OKSANEN, J., F. G. BLANCHET, R. KINDT, P. LEGENDRE, R. B.O’HARA, G. L. SIMPSON, P. SOLYMOS, M. H. H. STEVENS, AND
H. WAGNER. 2010. Vegan package v. 1.17-3. R Project forStatistical Computing, Vienna, Austria. (Available from:http://cc.oulu.fi/,jarioksa/softhelp/vegan.html)
PECHMANN, J., R. ESTES, D. SCOTT, AND J. GIBBONS. 2001.Amphibian colonization and use of ponds created fortrial mitigation of wetland loss. Wetlands 21:93–111.
PETRANKA, J. W., E. M. HARP, C. T. HOLBROOK, AND J. A.HAMEL. 2007. Long-term persistence of amphibianpopulations in a restored wetland complex. BiologicalConservation 138:371–380.
PETRANKA, J., C. KENNEDY, AND S. MURRAY. 2003. Response ofamphibians to restoration of a southern Appalachianwetland: a long-term analysis of community dynamics.Wetlands 23:1030–1042.
RODRIGUES, A. S. L., AND T. M. BROOKS. 2007. Shortcuts forbiodiversity conservation planning: the effectiveness ofsurrogates. Annual Review of Ecology, Evolution, andSystematics 38:713–737.
RUHI, A., D. BOIX, J. SALA, S. GASCON, AND X. D. QUINTANA.2009. Spatial and temporal patterns of pioneer macro-fauna in recently created ponds: taxonomic and func-tional approaches. Hydrobiologia 634:137–151.
SANCHEZ-FERNANDEZ, D., P. ABELLAN, A. MELLADO, J. VELASCO,AND A. MILLAN. 2006. Are water beetles good indicatorsof biodiversity in Mediterranean aquatic ecosystems?The case of the Segura river basin (SE Spain). Biodiver-sity and Conservation 15:4507–4520.
SAVAGE, A. A., J. H. MATHEWS, AND D. L. BEAUMONT. 1998.Community development in the benthic macroinverte-brate fauna of a Lowland Lake, Oak Mere, from 1994 to1996. Archiv fur Hydrobiologie 143:295–305.
SCHNEIDER, D. W., AND T. M. FROST. 1996. Habitat durationand community structure in temporary ponds. Journalof the North American Benthological Society 15:64–86.
SMITH, K. G. 1982. Drought-induced changes in aviancommunity structure along a montane sere. Ecology63:952–961.
SMITH, V. G. 1928. Animal communities of a deciduous forestsuccession. Ecology 9:479–500.
SOLIMINI, A. G., A. RUGGIERO, V. BERNARDINI, AND G. CARCHINI.2003. Temporal pattern of macroinvertebrate diversityand production in a new man made shallow lake.Hydrobiologia 506–509:373–379.
TACHET, H., P. RICHOUX, M. BOURNAUD, AND P. USSEGLIO-POLATERA. 2002. Invertebres d’Eau Douce (2nd correctededition). CNRS editions, Paris, France.
36 A. RUHI ET AL. [Volume 31

THIERE, G., S. MILENKOVSKI, P.-E. LINDGREN, G. SAHLEN,O. BERGLUND, AND S. E. B. WEISNER. 2009. Wetland creationin agricultural landscapes: biodiversity benefits on localand regional scales. Biological Conservation 142:964–973.
TOWNSEND, C. R., AND A. G. HILDREW. 1994. Species traits inrelation to a habitat templet for river systems. Fresh-water Biology 31:265–275.
VALLADARES, L. F., J. GARRIDO, AND B. HERRERO. 1994. The annualcycle of the community of aquatic Coleoptera (Adephagaand Polyphaga) in a rehabilitated wetland pond: theLaguna de La Nava (Palencia, Spain). Annales de Limno-logie – International Journal of Limnology 30:209–220.
VELASCO, J., A. MILLAN, AND L. RAMIREZ-DIAZ. 1993. Coloniza-cion y sucesion de nuevos medios acuaticos I. Composi-cion y estructura de las comunidades de insectos.Limnetica 9:73–85.
VERBERK, W. C. E. P., H. SIEPEL, AND H. ESSELINK. 2008. Life-history strategies in freshwater macroinvertebrates.Freshwater Biology 53:1722–1738.
VOSHELL, J. R., AND G. SIMMONS. 1984. Colonization andsuccession of benthic macroinvertebrates in a newreservoir. Hydrobiologia 112:27–39.
WARWICK, R. M., AND K. R. CLARKE. 1995. New ‘biodiversity’measures reveal a decrease in taxonomic distinctnesswith increasing stress. Marine Ecology Progress Series129:301–305.
WELLBORN, G. A., D. K. SKELLY, AND E. E. WERNER. 1996.Mechanisms creating community structure across afreshwater habitat gradient. Annual Review of Ecologyand Systematics 27:337–363.
WRIGHT, J. P., S. NAEEM, A. HECTOR, C. LEHMAN, P. B. REICH,B. SCHMID, AND D. TILMAN. 2006. Conventional functionalclassification schemes underestimate the relationshipwith ecosystem functioning. Ecology Letters 9:111–120.
ZEDLER, J. B., AND J. C. CALLAWAY. 1999. Tracking wetlandrestoration: do mitigation sites follow desired trajecto-ries? Restoration Ecology 7:69–73.
ZUUR, A. F., E. N. IENO, N. J. WALKER, A. A. SAVELIEV, AND
G. M. SMITH. 2009. Mixed effects models and extensionsin ecology with R. Springer, New York.
Received: 2 March 2011Accepted: 7 September 2011
2012] PRIMARY SUCCESSION IN MAN-MADE WETLANDS 37