change detection of land cover in lushan based on tm...
TRANSCRIPT

Change detection of land cover in Lushan
Based on TM remote sensing
Wen Zhang, Qun Zhang, Manchun Li, Lihua Tong, Yanming Chen, Liang Cheng* Department of Geographical Information Science, Nanjing University,
Nanj ing, Jiangsu, 2 1 0093 , China *Liang Chen, e-mail : [email protected]
Abstract-In this paper three images of Landsat TM data of 1983,
1999 and 2010 in winter being used to analyze the land cover
changes in Lushan and surrounding areas. This paper classified
the land cover types into 7 classes as cultivated land, grass land,
forest land, sand, water, construction land and unused land by
maximum likelihood classification, then analyses the land cover
change. The results show that during 1983 to 2010, construction
land increases every year, and the change is obvious; local area in
the image contrast analysis showed the expansion of water area;
forest land and cultivated land area decreased after increasing,
while grass land area decreased year after year, but the change is
much smaller from 1999 to 2010 compare with 1983 to 1999. Due
to manual control, the sand of Poyang Lake, from 1983 to 2010
basically unchanged. The analysis could offer help for the
regional land planning and land use.
Keywords-change detection; TM image; remote sensing; land
cover; Lushan
I . INTRODUCTION
Remote sensing change detection is one of the important applications in remote sensing, and also a hot research of remote sensing method currently. It is a new growth point after the Cross-integration by remote sensing information science, earth system science, computer technology and statistics, which represents the current direction of remote sensing data processing techniques development.
Land cover is a combination of natural and artificial materials that make the surface covered by many complex factors, including vegetation, soils, glaciers, rivers, lakes, wetlands and various buildings, describing the Earth's surface natural attributes with a specific time and space characteristics.
As the rapid global economic and cultural development, the changes also affect the environment and human society's sustainable development. In nineties, researchers of global change have become increasingly aware of the importance of land use and land cover change research because ahnost all aspects about global change including global climate change, global change in the biosphere, hydrosphere change, change in ocean biogeochemistry research, etc . are closely related to land cover.
Therefore, studies of land cover change become an important branch in the field of Earth's surface science, as a new hot issue in Earth sciences and global change research [ 1 ] .
Supported by the National Natural Science Foundation of China (Grant No. 4 1 00 123 8), and Research and Innovation Project for College Graduates of Jiangsu Province (No. CXLXl l_ 0025)
978-1-4673-1 104-5/12/$31.00 ©2012 IEEE
Monitor land cover dynamic to study the land development , future trends and to provide the rational of surface strategies . Studying land cover change has to obtain information about the land cover change and types of change. The specific research method is to compare individual objects in different periods and analyze simultaneous multi-temporal data [2, 3 ] . Remote sensing change detection represents for identifying an object or the differences in the state of the phenomenon by means of remote sensing data at different times [4] . Change detection of land cover is the use of the same area image but captured in different years which is different in spectral characteristics of the principle, to determine the status of land cover change in the process or phenomenon [5] .
In the early days, remote sensing change detected studied by artificial interpretation and evaluated from large-scale aerial photographs . With the appearance of digital multi-spectral remote sensing data and the development of digital image processing technology, comparing multi-temporal remote sensing data sets automatically by computers and providing its changes and spatial position to the solution translator of digital change detection techniques have emerged, which is the dynamic environment of remote sensing monitoring ' s advantages as resource-efficient, accurate and provided technical support for the operation [6] .
Lushan and the surrounding areas in Jiuj iang, Jiangxi, as a well-known tourist destination, has beautiful natural scenes and geographical landscape, which attract lots of tourists in the world, so detect the change of land cover by remote sensing technology is very necessary. The analysis could offer help for the regional land planning and land use.
II. STUDY AREA AND SOURCE
A. Study Area
Lushan is located in the central plain of the Yangtze River, which is the intersection part of Anhui, Hubei, Jiangxi provinces, and Jiangxi north, longitude between 1 1 5 0 52 'to 1 1 6 0 1 0', north latitude 29 0 24 'to 29 0 46', including the city of Jiuj iang, Lushan and most part of Xingzi and Jiuj iang town. Lushan just beside east of Poyang Lake, South Tengwangge, west Beij ing-Kowloon line, across North Yangtze River. The vast region mainly make up by the mountain, piedmont plains and riparian plains.
In this paper, the study area make Lushan as the center including the Sai Lake, Bali Lake, the edge of the Yangtze River Poyang Lake, shoes Lake, and Meixi Lake.
B. Survey of stuy area
According to records, Lushan has a history of more than 2,000 years. Lushan abounds in historic and cultural relics . It has unique evidence of glaciation during the Quaternary Period and is the birthplace of China's glaciological theory.
Though complicated, the geological structure can be clearly traced. Lushan is a Fault Mountain formed in the Quaternary Period. When it rose, the surrounding land sank, and the Poyang Basin eventually developed into the Poyang Lake. The many grotesque rocks, towering peaks and cascading waterfalls constitute a spectacular Mountain landscape. With frequent fog and mist, Lushan has cool summers . It also has typical flora.
Now Lushan was elected to the "World Heritage List" in 1 996. Owing to its congenial climate, it is also a popular summer resort in China.
C. Data source
Selected satellite remote sensing data from U.S . LAND SET -4 equipped with sensors MSS and LANDSET -7 ETM+ sensor. Data were downloaded from International Science Data Services Platform (http://datamirror.csdb.cn/index.j sp ) .
In this paper three images of Landsat TM data of 1 983 , 1 999 and 20 1 0 in winter being used to analyze the land cover changes in Lushan and surrounding areas . The number of TM data band is 1 2 1 , line 40. The map projection is UTM-WGS-84 Antarctic polar projection. The time among the three images across 27 years, which can basically reflect the land cover change of Lushan and the surrounding area.
In order to detect the surface coverage of Lushan correctly and effectively, the study selected remote sensing image captured in winter. At this time, the biological condition is almost similar, and less fog in Lushan, the cloud distribution of the image is all less than 1 %, at the same time, because of the dry season ,the Poyang Lake ' s water level is low, the characteristics of sand is obvious, which will benefit in the classification analyses . The details of three remote sensing data selected please see Table 1 .
TABLE /, SELECTED REMOTE SENSING DATA
NO. Plaiform Sensor Receive Time Spalial Resolution Da/aQ;ta/ifJ:. 1 LANDSET4 MSS 1983-11-28 80m Better 2 LANDSET-7 ETM+ 1999-12-10 30m Better 3 LANDSET-7 ETM+ 2010-11.()6 30m Part data loss
D. Data Processing Software
Use software ENVI 4.6 to make analyses and Arc GIS 9.3 to layout the map.
III. TM IMAGE PROCESSING AND EXTRACTION OF LAND COVER INFORMATION
A. Data Preparation
Since 2003 , Landset-7 out of order, causing the acquired image data overlap and about 25% of data loss, so the study
use the International Science Data Services Platform ( http://datamirror.csdb.cnlindex.j sp ) which provide the model of multiple images of Adaptive regression analysis, using other remote sensing data of different time by partial regression analysis, to recover the images of 20 1 0- 1 1 -06. The change in the regional area is parameter, selecting the local area of the smallest and the largest regional correlation to make regression analysis . This approach recovers the quality of image mostly.
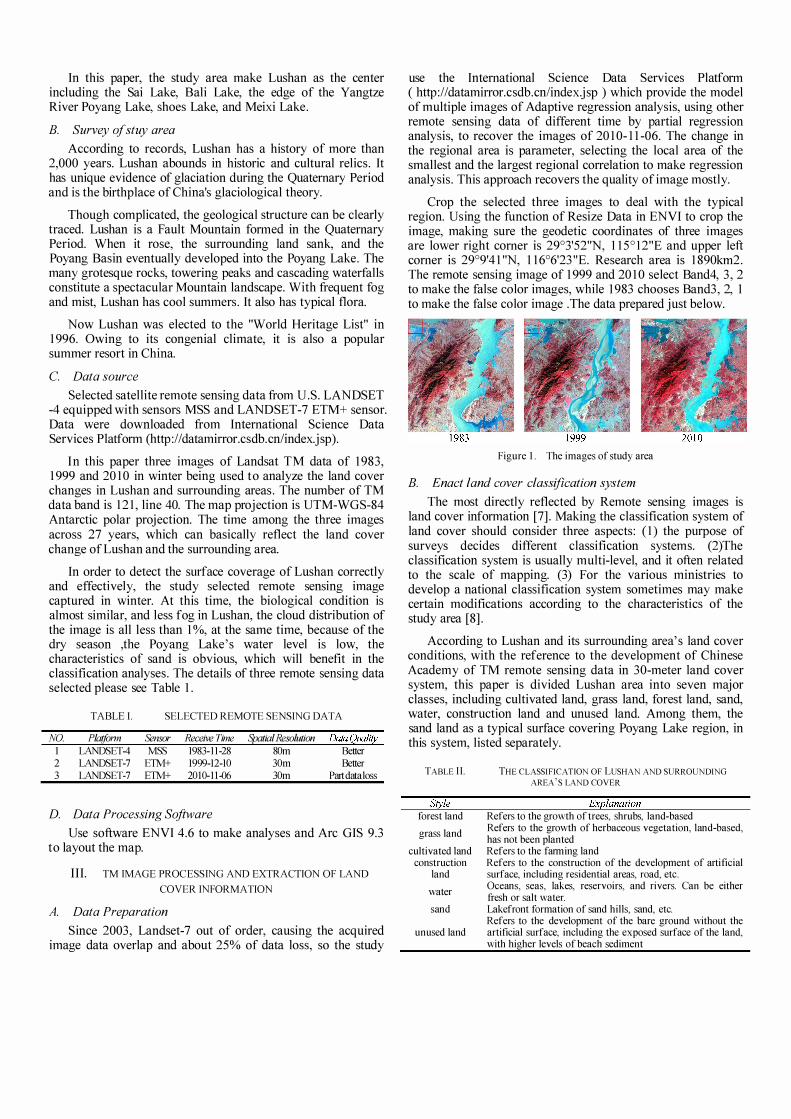
Crop the selected three images to deal with the typical region. Using the function of Resize Data in ENVI to crop the image, making sure the geodetic coordinates of three images are lower right corner is 29°3'52"N, 1 1 5 ° 12"E and upper left corner is 29°9'4 1 "N, 1 1 6°6'23 "E. Research area is 1 890km2. The remote sensing image of 1 999 and 20 1 0 select Band4, 3 , 2 to make the false color images, while 1 983 chooses Band3 , 2, 1 to make the false color image .The data prepared just below.
Figure I . The images of study area
B. Enact land cover classification system
The most directly reflected by Remote sensing images is land cover information [7] . Making the classification system of land cover should consider three aspects : ( 1 ) the purpose of surveys decides different classification systems. (2)The classification system is usually multi-level, and it often related to the scale of mapping. (3) For the various ministries to develop a national classification system sometimes may make certain modifications according to the characteristics of the study area [8] .
According to Lushan and its surrounding area' s land cover conditions, with the reference to the development of Chinese Academy of TM remote sensing data in 30-meter land cover system, this paper is divided Lushan area into seven major classes, including cultivated land, grass land, forest land, sand, water, construction land and unused land. Among them, the sand land as a typical surface covering Poyang Lake region, in this system, listed separately.
TABLE ll.
Style forest land
grass land
cultivated land construction
land
water
sand
unused land
THE CLASSIFICA nON OF LUSHAN AND SURROUNDING AREA' S LAND COVER
Explanation Refers to the growth of trees, shrubs, land-based Refers to the growth of herbaceous vegetation, land-based, has not been planted Refers to the farming land Refers to the construction of the development of artificial surface, including residential areas, road, etc . Oceans, seas, lakes, reservoirs, and rivers. Can be either fresh or salt water. Lakefront formation of sand hills, sand, etc. Refers to the development of the bare ground without the artificial surface, including the exposed surface of the land, with higher levels of beach sediment

C. Signs of interpretation
For the form of human-computer interaction, interpret the image from shape, color, pattern, position, resolution, size, shadow, texture and other aspects of the relationship, making the image features associated with the attribute information, based on the target features of characteristics, analysis, interpretation, understanding and recognition of remote sensing images to required remote sensing information as need. With reference to the color, shape, position, Lushan and the surrounding area of administrative zoning map, choose the seven major categories of training samples by interactive way.
TABLE III.
Surface type forest land grass land cultivated land construction land water sand
VISUAL INTERPRET A nON SIGNS OF LAND COVER
Scarlet Light Red Light Red Gray
Color
Navy blue or bright blue White
Texture No obvious No obvious No obvious Obvious outline Obvious outline Distributed in the Lake area Irregularly
unused land Blue and white No obvious
Use ENVI 4 .6 remote sensing image processing software, according to Lushan and the surrounding area land cover classification system, select the grassland, woodland, farmland, water, construction land, unused land and sand samples ,and the training sample reparability should reach greater than 1 . 8 (between 0-2).
� - � . .
II!"'- . t." • . .
cultivated land
water
D. Classification
sand
forest land
construction land
Figure 2. Training Samples
.' � """ , r ' .4 t .- "., ' ,.i
.,..l .i , . ", grass land
unused land
Maximum Likelihood Classification has a rigorous theoretical basis [91 , so this paper classified the land cover types into 7 classes as cultivated land, grass land, forest land, sand, water, construction land and unused land by the Supervise classification method.
After classification, according to Lushan high-resolution image from Google Earth, examine the classification by artificial visual interpretation respectively; modify part of the class attribute value. Develop color for each category, with reference to the expression of standards of township land use and land mapping specification of legend of China in 2009.Then get three land cover classification map of 1 983 , 1 999 and 20 lO about Lushan by Arc GIS 9 . 3 . The map of the distribution of land cover types can reflect the various land cover types, and their spatial relationship between the
distribution patterns of thematic maps. The land cover classification map of Lushan and the surrounding area performance the Lushan and the surrounding area land cover types and their percentage of area, which represent land cover condition in the year of 1 983, 1 999 and 20 10 . Classification maps are shown in Figure 3 .
Legend
1983
_ 'g • .-I land w.t ... bod.,.
1 999
arus l.nd . conslruClion l"nd C\llIiv.,ed l"n.d _ "nd
2010
Figure 3 . Map of LuSh an and surrounding area Land cover
classification
E. Classification accuracy assessment
According to Lushan and its surrounding areas with Google Earth images and Chinese Academy of Sciences, the scale of 1 : 1 000000 land use data sets of 2000, evaluate the supervised classification accuracy by visual interpretation.
As the ETM + image resolution is only 30 meters, and the MSS resolution is 80 meters that belong to low-resolution images, at the same time, the image of 20 1 0 has been repaired, its classification accuracy is lower. Therefore, the classification of three types, water, construction land and sand has a better classification quality, and the surface has a clear character and boundaries . And the type of cultivated land, woodland and grassland categories, the higher classification accuracy is woodland, while the different between grassland and arable land is small because of biological vegetation' S condition in winter was not significant. Unused land includes undeveloped bare land and some reefs above the surface of lakes in the winter of dry season, etc . , as lots factors that affect the unused land, so in the three classification images, the visual solution of unused land differ greatly, so in this paper, no further discussion.
IV. ANAL YSIS LAND COVER AND CHANGE
The use of remote sensing images for dynamic detecting land cover change is an effective means of acknowledge the land of its quantity, quality, the patterns of spatial changes and trends [ 101 . Studying the dynamic changes in land cover will help us understand the causes and mechanisms of land cover change, and by adjusting the human social and economic activities, it can promote the use of land tending to be more reasonable, so as to achieve the purpose of sustainable use of land resources.
A. Macro analysis of land covers change
Calculate the three map of land cover classification, we could see that woodland, grassland and arable land cover the most of study area, the sum accounted for about 60%. In 20 10 , Lushan had the share of each class size category for the vegetation coverage> water> construction sites> sand, while in 1 999 and 1 983 the share of each category remained same.
construction land sand 61 unused land
water 21 �I forest land
m __ _ 1111 grisslind
291 1 983
construttion land wat,,11 sand unused land
� 1�
m 1WIj • .,
forest land cult;"ted land grail land
311
161 1 999
constluaion land sand unused land wat" l2'l 2'l 4' forest land
!8'l .--,.._ ..... cuh;"ledland grail land
!8'l I�
2010
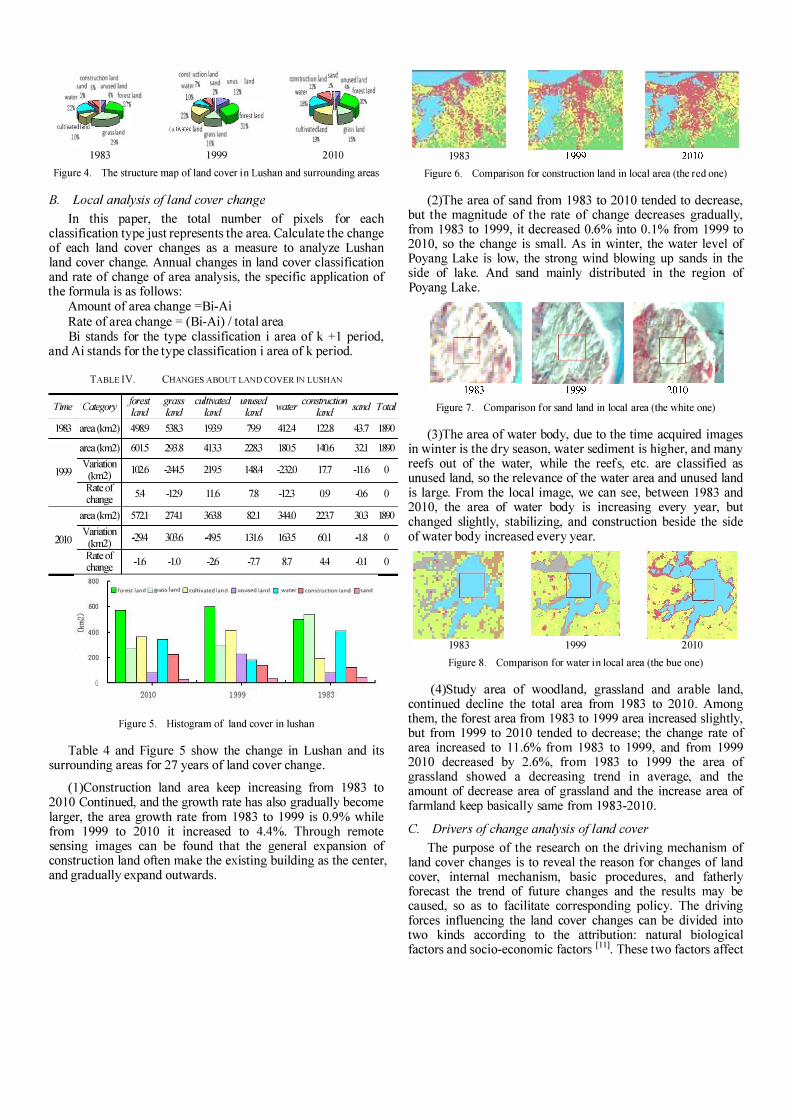
Figure 4 . The structure map of land cover in Lushan and surrounding areas
B. Local analysis of land cover change
In this paper, the total number of pixels for each classification type just represents the area. Calculate the change of each land cover changes as a measure to analyze Lushan land cover change. Annual changes in land cover classification and rate of change of area analysis, the specific application of the formula is as follows :
Amount of area change =Bi-Ai Rate of area change = (Bi-Ai) / total area Bi stands for the type classification i area of k + 1 period,
and Ai stands for the type classification i area of k period.
TABLE IV. CHANGES ABOUT LAND COVER IN LUSHAN
Time Category forest grass cultivated unused water consfniction
sand Total land land land land land
1983 area (km2) 4989 5383 1939 1)9 4124 1228 43.7 IlW area (km2) ffil5 293.8 4133 2283 IID5 140.6 321 IlW Variation 102.6 -2445 2195 148.4 -2320 17.7 -11.6 0 1m (km2) Rate of 5.4 -129 11.6 7.8 -123 09 .o.6 0 change
area (km2) 5721 274.1 363.8 82.1 344.0 223.7 303 IlW Variation -29.4 :lffi.6 495 131.6 1635 ffi.I -1.8 0 :rHO (km2) Rate of -1.6 -1.0 -26 -7.7 8.7 4.4 .oJ 0 change 800
o forest land 0 8'�SS land o cultivated land 0 unused land 0 .water 0 construction land Osand
600 � 0 400
200
2010 1 999 1983
Figure 5 . Histogram of land cover in lushan
Table 4 and Figure 5 show the change in Lushan and its surrounding areas for 27 years of land cover change .
( 1 )Construction land area keep increasing from 1 983 to 20 1 0 Continued, and the growth rate has also gradually become larger, the area growth rate from 1 983 to 1 999 is 0.9% while from 1 999 to 20 1 0 it increased to 4.4%. Through remote sensing images can be found that the general expansion of construction land often make the existing building as the center, and gradually expand outwards .
1983
Figure 6 . Comparison for construction land in local area (the red one)
(2)The area of sand from 1 983 to 20 1 0 tended to decrease, but the magnitude of the rate of change decreases gradually, from 1 983 to 1 999, it decreased 0.6% into 0 . 1 % from 1 999 to 20 1 0, so the change is small. As in winter, the water level of Poyang Lake is low, the strong wind blowing up sands in the side of lake. And sand mainly distributed in the region of Poyang Lake.
Figure 7. Comparison for sand land in local area (the white one)
(3)The area of water body, due to the time acquired images in winter is the dry season, water sediment is higher, and many reefs out of the water, while the reefs, etc . are classified as unused land, so the relevance of the water area and unused land is large. From the local image, we can see, between 1 983 and 20 1 0, the area of water body is increasing every year, but changed slightly, stabilizing, and construction beside the side of water body increased every year.
1983 1 999 2010
Figure 8 . Comparison for water in local area (the bue one)
(4)Study area of woodland, grassland and arable land, continued decline the total area from 1 983 to 20 10 . Among them, the forest area from 1 983 to 1 999 area increased slightly, but from 1 999 to 20 1 0 tended to decrease; the change rate of area increased to 1 1 .6% from 1 983 to 1 999, and from 1 999 20 1 0 decreased by 2 .6%, from 1 983 to 1 999 the area of grassland showed a decreasing trend in average, and the amount of decrease area of grassland and the increase area of farmland keep basically same from 1983-20 10 .
C. Drivers of change analysis of land cover
The purpose of the research on the driving mechanism of land cover changes is to reveal the reason for changes of land cover, internal mechanism, basic procedures, and fatherly forecast the trend of future changes and the results may be caused, so as to facilitate corresponding policy. The driving forces influencing the land cover changes can be divided into two kinds according to the attribution: natural biological factors and socio-economic factors [ I I ] . These two factors affect

each other complexly in various spatial scale and time scale, leading to the changes of land cover. This paper tries to analysis the main factor causing the changes of land cover in Lushan and surrounding area and initially research on the relationship between land cover change and the development of . . SOClO-economlC.
Since the reform and opening up, Jiuj iang City has long regard the following policy as their developing strategy: Building an open city, stabilizing the city relying on agriculture, strengthening the city relying on industry, flourishing the city relying on travelling and trading, integrating the urban and rural area thus building Jiuj iang City into a port city with fmancial, trade, tourism, logistics center and modernization in the middle of Jingjiu railway and downstream of Yangtze River.
Lushan, as a tourism shrine, develops fast. Tourism has greatly promoted the development of socio-economic nearby Lushan. A lot of restaurants and other service facilities and transportation facilities have been built and the demand for land has been increasing since 1983 .
The water used in Lushan area comes mainly from natural rainfall. Accompanying with the increasing number of travelers, the demand for domestic water is increasing. Considering the amount of natural resources and the demand caused by increasing number of travelers, Local government has built many artificial dam, such as Lulin Lake, Dayueshan Lake and etc. While on the other hand the continuous expansion of building land has led to the increasingly exploit on the vegetation covered land, causing the reducing of woodland and grassland, thus destroy the natural ecosystems.
After stepping into the twentieth century, the state proposed the sustainable development strategy and the protection of natural ecological resources has attracted more and more attention, which to some extent leading to some changes : the trend the reducing of vegetation covered land is slowing down.
There are some small hills composed of loose sand near the Poyang Lake which are called "Sand hill" . Their heights maintain 40 to 50 meters and some can even reach 70m. The main reason for the forming of the sand hills is that the entrance of the Poyang Lake is just like a bottleneck which is north-northeast in aligmnent and this aligmnent can speed up the speed of winds; At the same time the friction coefficient of lakes is small which fatherly strengthen the winds, so during the dry season the sand and soil exposed on the lake is blowed by strong winds and accumulates slowly fmally forming the sand hills.
In recent years, in order to prevent the desertification of the land, desert plants have been planted which effectively controls the sand area and the area of sand land remains unchanged since 1983 .
V . CONCLUSIONS
( l )In this paper, the research area is l 890km2• We could see
that woodland, grassland and arable land cover the most of study area, the sum accounted for about 60%. In 20 1 0, Lushan and its surrounding areas share each class size category as
vegetation coverage > water > construction land > sand, while in 1 999 and 1 983 the share of each category remained same.
(2)According to statistics of 7 classes as cultivated land, grass land, forest land, sand, water body, construction land and unused land, it could fmd that during 1 983 to 20 1 0,Lushan and its surrounding area construction land increases every year, and the change is obvious; local area in the image contrast analysis showed the expansion of water area; forest land and cultivated land area decreased after increasing, while grass land area decreased year after year, but the change is much smaller from 1 999 to 20 1 0 compare with 1 983 to 1 999.
(3)Sand land as a typical surface covering of Poyang Lake region, due to manual control, the sand of Poyang Lake from 1 983 to 20 1 0 basically unchanged.
From 1 983 to 20 10 , Lushan and its surrounding area develop rapidly in economic, and land cover changing in the constantly . Through remote sensing, we could acknowledge the macro change of land cover. The analysis could offer help for the regional land planning and land use.
REFERENCES
[ 1 ] Welch and Ehlers, 1987 R. Welch and W. Ehlers, Merging Multiresolution SPOT HRV and Landsat TM Data. Photogrammetric Engineering and Remote Sensing, 53 3 (1 987), pp. 30 1-303 .
[2] YunLong Cai. Innovation perspective o f Physical Geography [1] . Journal of Beijing University(Nature), 2000, 34(4) : 576-582.
[3] Hua Zhang, BoZhang. International land use/cover change model Research [J] .1oumalofNatural resources, 2005, 20(3) : 422-43 1 .
[4] XinWei Liu, BaiMing Chen, XueZheng Shi. LUCC research development in Chian[J] . Soils, 2004, 36(2) : 132- 135 .
[5] YunLong Cai. Land use/land cover change research: to find a new integrated approach [1] . Geography, 200 1 , 20(6) : 645-652.
[6] MENG Bin, WANG Jingfeng. A review on the methodology of scaling with geo-data[J] . Acta Geographic Sinica, 2005, 60(2) : 277-288 .
[7] Erie F Lambin, Tluner B L, Helmut J Geist. Global environmental change : moving beyond the myths. Global Environment Change, 200 1 , 1 1 : 263 -268 .
[ 8 ] ShuPeng Chen. Mechanism of remote sensing[M] . Beijing: Science Press, 1998.
[9] Ying Wang, ManQuan Yu, ShengTao Li, Bin Wang, ZhiHua YU. JavaScript engine in the acquisition of dynamic web applications [1] . Computer, 2004, 24(2) : 33-36.
[ 1 0] Fiseher G, Ermolier Y, Keyzer M A, et al . Simulating the socioeconomic and biogeo-Physical Driving forces of Land-use and Landover change: the II ASA Land-use Change Model, WP-96-0 1O . Laxenburg. II ASA, 1996.
[ 1 1 ] ZhiGang Tang. Research about land use changes in southern Jiangsu[D] . Nanling: NanJing University, 200 1 .
[ 12] Wardlow et al . , 2007 B.D. Wardlow, S .L . Egbert and J.H. Kastens, Analysis of time-series MODIS 250 m vegetation index data for crop classification in the U.S . Central Great Plains. Remote Sensing of Environment, 1 08 3 (2007), pp. 290-3 10 .
[ 13 ] Joel e t al . , 1 997 G. Joel, J.A. Gamma and C.B. Field, Production efficiency in sunflower: the role of water and nitrogen stress. Remote Sensing of Environment, 62 2 ( 1997), pp. 1 76-1 88 .
[ 14] Houborg and Boegh, 2008 R. Houborg and E. Boegh, Mapping leaf chlorophyll and leaf area index using inverse and forward canopy reflectance modeling and SPOT reflectance data. Remote Sensing of Environment, 1 12 1 (2008), pp. 1 86-202.
[ 1 5] FAO (2003) . Food and Agriculture Organization of the United Nations. State of the World's Forests . Food and Agriculture Organization of the United Nations, Rome.