challenges of integrating solar and wind into the...
TRANSCRIPT

94
9 CHALLENGES OF INTEGRATING SOLAR AND WIND INTO THE ELECTRICITY GRIDDavid Steen Joel Goop Lisa Göransson Shemsedin Nursbo Department of energy and environment, Chalmers University of Technology*
Magnus Brolin SP Technical Research Institute of Sweden
* Division of Electrical power engineering (D. Steen, S. Nursbo), Division of Energy Technology (J. Goop, L. Göransson) Chapter reviewers: Steven Sarasini, Tomas Kåberger
INTRODUCTIONThe main purpose of the electricity grid is to transport electricity from generation sites to consumption sites. As discussed in Chapter 2 and 5, the electricity grid is commonly designed for large centralised production units, connected to a high voltage transmission grid that enables transmission of large quantities of power with low losses. High voltages are, however, impractical and dangerous to use close to consumers and the voltage is transformed to lower levels and distributed to the customers through a distribution grid.
The main challenge when operating the power system is to keep the system in balance, i.e. to keep the energy supplied in balance with electricity demand. Different balancing challenges appear on different timescales as shown in Figure 9.1. On short time scales (milliseconds to minutes), the challenges relate to power quality issues, such as stability of voltage and frequency. On medium time scales (minutes to hours), the scheduled production must meet the planned demand and the electricity produced needs to reach the load. On longer time scales (weeks to seasons), the production and transmission capacity should be able meet demand in all parts of the system over the whole year, otherwise loads must be curtailed in order to keep the system in balance.
Sys
tem
s P
ersp
ectiv
es o
n R
enew
able
Pow
er 2
014
, IS
BN
978
-91-
98
097
4-0
-5

95
Energy availability
Forecast error
Congestion
Voltage rise
Voltage stability
Frequency stability
Inertia of the power system
ms sec min weekshours seasonTemporal level
Figure 9.1 Examples of grid related challenges on different timescales.
The challenges also vary between different levels of the power system, e.g. between the local and national level. Small-scale electricity production, such as solar photovoltaic (PV), is usually connected to the low voltage distribution grid while wind turbines are connected to the medium voltage distribution grid or regional transmission grid.
When connecting new generation to the electricity grid, the grid needs to adapt to the new generation. This is valid both for traditional thermal generation units and for renewable sources, such as wind and solar. For traditional large-scale genera-tion sites usually the grid is reinforced to cope with the new generation while small-scale generation to a large extent is integrated into the current electricity grid.
As discussed in Chapter 5, there are several advantages of connecting the generation close to the end user, e.g. reduced losses. However, since electricity produced from solar and wind varies over the day, other challenges arise, both technical and economic. Additional challenges arise from the fact that the localisa-tion of generation units are limited to certain areas, i.e. wind turbines are usually placed in windy areas and not where it is most suitable for the electricity grid, resulting in need for new transmission lines.1
There are no major technical limitations on the amount of wind and solar power that could be connected to the grid. However, there might be challenges that need to be considered depending on the characteristics of the energy source and the local conditions at the site where it is connected. At most sites, integration of small shares of wind and solar power require little adaptation of the electricity grid. As the shares increase, the need for adaptation increases and the integration costs may rise.
Rather than trying to provide an exact number of the maximum amount of renew-able electricity generation that could be integrated, this chapter aims at highlight-ing the possible technical and economic challenges that may arise from integration of wind and solar power and how these challenges could be met.
1 For example, this has created large problems in China over the last years, with extensive curtailment, since the grid has not been able to transmit enough electricity from windy areas to demand centres.

96
Following sections will discuss the challenges related to integration of renewable energy production from different geographical perspectives. In the final section, integration of renewables is discussed from market and policy perspectives.
DISTRIBUTION SYSTEM In distribution systems the most prominent challenges relates to voltage rise and overloading of system components.2 While also other issues may arise from fluctuation in electricity production due to gusty winds or cloud movements, this section focuses on these two challenges.
Voltage rise issues emerge when the electricity generated exceeds the local demand, causing the electricity to flow in opposite direction compared to normal operation. This reversed power flow may also affect the protection system and cause overload in system components. There are different approaches to address these problems, e.g. reinforcement in the distribution grid, demand side manage-ment (DSM, see Chapter 10), energy storage (see Chapter 5 and 12), energy curtailment, reactive power compensation and coordinated on-load tap changer (OLTC) control. Below, we present the results of case studies on the impact of increasing wind and solar PV penetration levels in two Swedish residential distri-bution systems.
Both wind power and solar PV will affect the distribution system in similar ways; however there are some major differences. Firstly, the time variation of production differs and secondly the location where they are installed may vary. It is likely that a large share of the solar PV units will be connected to the low voltage distribu-tion system due to its modular properties, allowing for integration in buildings and economic performance independent of scale. In Germany, about 70 % of the solar PV is connected to the low voltage distribution system.3 Although there are small scale wind turbines that, like solar PV, could be installed within the low voltage distribution system, wind turbines are more likely to be connected to the regional transmission system or to the medium voltage distribution system.
The amount of wind and solar PV that can be installed in a distribution system without violating the reliability and performance of the system depends on the design of the distribution system and on the load profile. Systems with a high mismatch between the electricity generation and demand will have more difficul-ties to cope with large penetration levels while systems with better load matching can facilitate larger shares. Similarly, systems designed for high peak demand can facilitate more PV and wind power than systems designed for a low peak demand since the system is designed to cope with higher power levels. Other concerns relate to the length of the distribution grid where long distances between the customer and the substation will likely experience increased voltage fluctuations and voltage rises during the day compared to a grid with shorter distances.
Electricity generated from solar PV is rather predictable and, on an aggregated level, it correlates with the demand on a daily basis. For countries with warm
2 Katiraei, F. and Agüero, J. R. (2011) Solar PV integration challenges, Power and Energy Magazine, IEEE , 9(3):62-71. 3 Appen, J. V. et. al. (2013) Time in the Sun: The Challenge of High PV Penetration in the German Electric Grid, IEEE Power and Energy Magazine, 11(2):55-64.
97
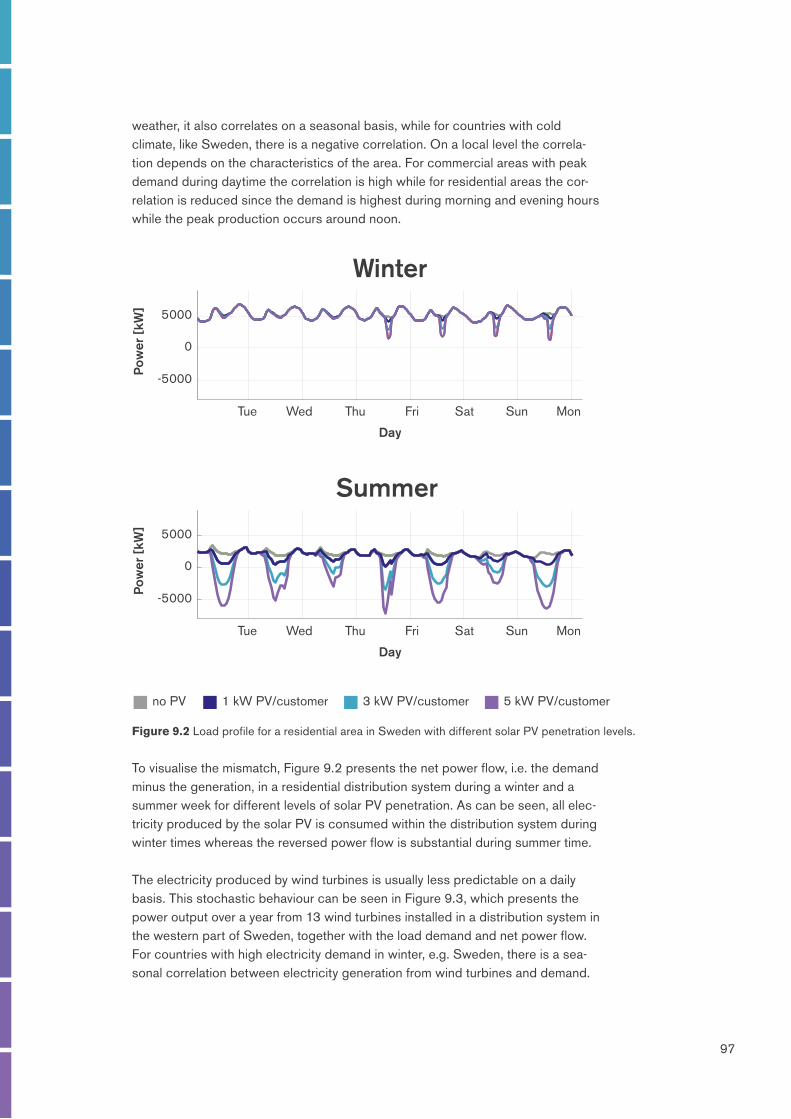
weather, it also correlates on a seasonal basis, while for countries with cold climate, like Sweden, there is a negative correlation. On a local level the correla-tion depends on the characteristics of the area. For commercial areas with peak demand during daytime the correlation is high while for residential areas the cor-relation is reduced since the demand is highest during morning and evening hours while the peak production occurs around noon.
no PV 1 kW PV/customer 3 kW PV/customer 5 kW PV/customer
Summer
Day
Tue Wed Thu Fri Sat Sun Mon
-5000
0
5000
Pow
er [
kW]
Day
Tue Wed Thu Fri Sat Sun Mon
-5000
0
5000
Pow
er [
kW]
Winter
Figure 9.2 Load profile for a residential area in Sweden with different solar PV penetration levels.
To visualise the mismatch, Figure 9.2 presents the net power flow, i.e. the demand minus the generation, in a residential distribution system during a winter and a summer week for different levels of solar PV penetration. As can be seen, all elec-tricity produced by the solar PV is consumed within the distribution system during winter times whereas the reversed power flow is substantial during summer time.
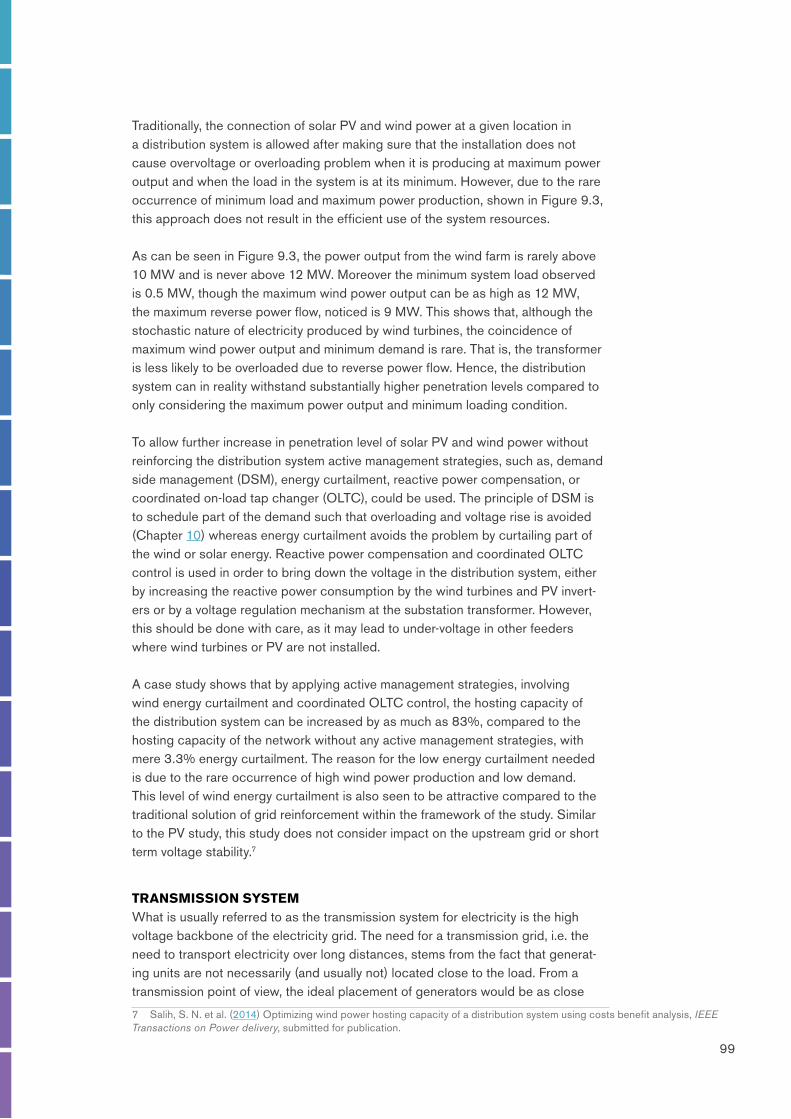
The electricity produced by wind turbines is usually less predictable on a daily basis. This stochastic behaviour can be seen in Figure 9.3, which presents the power output over a year from 13 wind turbines installed in a distribution system in the western part of Sweden, together with the load demand and net power flow. For countries with high electricity demand in winter, e.g. Sweden, there is a sea-sonal correlation between electricity generation from wind turbines and demand.

98
Time [Hours]
Wind power output Net power flow Total load demand
1000
Transmission system or regional grid
10 MVA Substation transformer
12 MW windpower plant
Load
(b)
(a)
PL PW
PT = PL - PW
2000 3000 4000 5000 6000 7000 8000
-10
-5
0
5
10
Pow
er [
MW
]
Figure 9.3 (a) A simplified representation of a rural distribution system at the western part of Sweden (b) The total load (PL), wind power in the system (PW), and the total (net) power flow (PT) measured at the substation.4
In a PhD project at Chalmers a real residential distribution system in Gothenburg was simulated to assess the technical limit of PV installations.5 The result shows that PV can supply more than 30% of the annual demand without causing voltage rise or overloading issues. The maximum PV capacity was limited by the conditions on a summer day with low load and high solar insolation, resulting in high reversed power flow, i.e. power flows from the customer to the upstream grid. The limiting factor was a transformer in the medium voltage distribution grid, whereas the low voltage distribution grid could cope with much higher penetration levels. However, since there is a large diversity in how distribution grids are designed these results should be interpreted with care. The maximal penetration level will vary between distribution systems and countries.6
4 Negative values here indicate that the power flow is in opposite direction to what is indicated by the arrow (usually expressed as reverse power flow)5 The model developed includes power flow calculations to set the voltage and current levels within the distribution grid.6 Other aspects that will affect the result are how the PV capacity is distributed within the system, how the reversed power flow would affect the system at higher voltage levels and short term stability issues.
99
Traditionally, the connection of solar PV and wind power at a given location in a distribution system is allowed after making sure that the installation does not cause overvoltage or overloading problem when it is producing at maximum power output and when the load in the system is at its minimum. However, due to the rare occurrence of minimum load and maximum power production, shown in Figure 9.3, this approach does not result in the efficient use of the system resources.
As can be seen in Figure 9.3, the power output from the wind farm is rarely above 10 MW and is never above 12 MW. Moreover the minimum system load observed is 0.5 MW, though the maximum wind power output can be as high as 12 MW, the maximum reverse power flow, noticed is 9 MW. This shows that, although the stochastic nature of electricity produced by wind turbines, the coincidence of maximum wind power output and minimum demand is rare. That is, the transformer is less likely to be overloaded due to reverse power flow. Hence, the distribution system can in reality withstand substantially higher penetration levels compared to only considering the maximum power output and minimum loading condition.
To allow further increase in penetration level of solar PV and wind power without reinforcing the distribution system active management strategies, such as, demand side management (DSM), energy curtailment, reactive power compensation, or coordinated on-load tap changer (OLTC), could be used. The principle of DSM is to schedule part of the demand such that overloading and voltage rise is avoided (Chapter 10) whereas energy curtailment avoids the problem by curtailing part of the wind or solar energy. Reactive power compensation and coordinated OLTC control is used in order to bring down the voltage in the distribution system, either by increasing the reactive power consumption by the wind turbines and PV invert-ers or by a voltage regulation mechanism at the substation transformer. However, this should be done with care, as it may lead to under-voltage in other feeders where wind turbines or PV are not installed.
A case study shows that by applying active management strategies, involving wind energy curtailment and coordinated OLTC control, the hosting capacity of the distribution system can be increased by as much as 83%, compared to the hosting capacity of the network without any active management strategies, with mere 3.3% energy curtailment. The reason for the low energy curtailment needed is due to the rare occurrence of high wind power production and low demand. This level of wind energy curtailment is also seen to be attractive compared to the traditional solution of grid reinforcement within the framework of the study. Similar to the PV study, this study does not consider impact on the upstream grid or short term voltage stability.7
TRANSMISSION SYSTEMWhat is usually referred to as the transmission system for electricity is the high voltage backbone of the electricity grid. The need for a transmission grid, i.e. the need to transport electricity over long distances, stems from the fact that generat-ing units are not necessarily (and usually not) located close to the load. From a transmission point of view, the ideal placement of generators would be as close
7 Salih, S. N. et al. (2014) Optimizing wind power hosting capacity of a distribution system using costs benefit analysis, IEEE Transactions on Power delivery, submitted for publication.

100
to the load as possible, but the locations of power plants are determined by a number of factors. For example, it can be economically beneficial to concentrate production to large facilities supplying a large geographical area, because of economies of scale. Other circumstances such as proximity to harbours and other infrastructure, or availability of certain natural resources such as coal mines, rivers or sea water used for cooling in thermal power plants, may also influence where a plant is built.
In general, large-scale integration of solar and wind power can cause three major changes in the way the transmission system is utilised. First, the optimal locations of power plants may change, since the optimal sites for wind and solar power plants are often not the sites where power plants have traditionally been placed. Second, increasing the transmission capacity can be used for smoothing variations in the production patterns from wind and solar power. This is possible since the correlation between wind and solar patterns generally decreases with geographical distance. With a large transmission capacity, electricity can be col-lected from a large geographical area, resulting in smaller variations in aggregated production.8 Third, an expansion of transmission capacity may be needed to better utilise resources, such as hydropower, that are capable of managing supply and demand imbalances in the system.
As previously discussed, one of the main challenges with operating the power system is to keep the demand and supply in balance to avoid frequency deviations. Traditionally, flexible generation units have been used to reduce or increase the production to keep the power balance. As the amount of intermittent electricity generation increases the need for balance power may increase at the same time as old flexible generation units are being replaced by renewable generation units.
In this new situation curtailing can be used if generation needs to be reduced (down-regulation). Increasing the production (up-regulation) from the intermittent energy sources is more difficult since they cannot increase their production if they already utilise all available energy. Instead other measures, such as DSM and energy storage could be applied. These techniques are further discussed in e.g. Chapter 5, 10 and 12. There is also ongoing research, investigating the possibility to use the inertia of wind turbines to provide frequency support by controlling the turbines in a novel way.9
Decommissioning of existing power plants may cause other challenges within the power system. As one example, nuclear power plants in Sweden are not only providing active power to the customer but also reactive power. Reactive power is consumed both by customer equipment, e.g. electrical machines, and by the power system itself, e.g. due to inductance in overhead lines. By reducing the reactive power injection in one part of the system, the reactive power consumed must be transferred from other parts of the system. This in turn will limit the ability to transfer active power in the system since the current, which limits the transmis-sion capacity, is affected by both the active and reactive power. However, wind
8 Reichenberg, L. et al (2014) Dampening variations in wind power generation - the effect of optimizing geographic location of generating sites, Wind Energy, submitted for publication.9 Persson, M. et al. (2013) Frequency Support by Wind Farms in Islanded Power Systems with High Wind Power Penetration, IEEE PowerTech2013 Conference, Grenoble, France, Jun. 16-20..
101
turbines and solar PV have the ability to provide reactive power, and in many countries it is required for new plants.10
Limitations in the transmission grid may hinder an economically efficient operation of the system, e.g. by hindering the most desirable generation units from satisfying the demand.11 This is commonly referred to as congestion in the electricity grid. The grid is congested if the system would benefit from transferring more power from a generator at point A to a load at point B, while that is not possible because of the limited capacity of a transmission line, safety limits, or other constraints. In the presence of congestion, the demand at point B can still be met (otherwise there would be a blackout), but less desirable generating units will have to be used.
When there is congestion in the grid, the marginal cost of electricity, i.e. the increase in costs to satisfy an additional unit of demand, will vary between loca-tions. The marginal cost difference is an indicator of congestion. If the cost of gen-erating an additional unit of electricity is lower at point A than at point B, it would be preferable from the system’s perspective to reduce the production of the most expensive generator at point B and instead buy electricity from point A. Therefore, if the trade between A and B is not limited, i.e. there is no congestion, the marginal costs at A and B will be equal, because an additional unit of demand at either of the points can be satisfied by the same generator. A difference in marginal cost will only persist if there is some constraint on the trade between A and B. The total generation cost in the system will therefore also be higher in the presence of congestion. However, there is a trade-off between the additional generation costs incurred by congestion and the costs of increasing the transfer capacity of the grid. Therefore, there may still be congestion when the total costs, including costs for generation and grids, are minimised.
Expanding electricity production from solar and wind in Europe will most likely impact the congestion patterns in the transmission grid. As solar and wind provide electricity with low marginal cost of production, they will lower the electricity price in the area where such generation occurs. This will result in demand for this low cost power from other parts of the system.
The congestion patterns can be studied using computer models of the European generation and transmission system.12 Typically, such models determine how the power plants in each region should be run to minimise total system costs. Conges-tion is revealed by remaining regional differences in electricity prices.
10 Singh, B. and Singh, S.N. (2009) Wind Power Interconnection into the Power System: A Review of Grid Code Requirements, The Electricity Journal, 22(5):24-63.11 When the goal is a system with lowest possible cost, as is most often the case with the electricity supply system, the genera-tion cost usually determines which units are the most desirable.12 Göransson, L. et al (2014) Linkages between demand-side management and congestion in the European electricity transmis-sion system, Energy, 69:860-872.

102
1.05
0.9
0.75
0.60
0.45
0.30
0.15
0.00Pe
netr
atio
n le
vel o
f win
d an
d so
lar
pow
er
Figure 9.4 The energy penetration level of wind and solar power in a scenario for the European electricity system in 2020. The penetration level is calculated as the total electricity production from wind and solar power in one year in each of the 50 regions shown on the map, divided by the total consumption of electricity in that region during the same time period.
Figure 9.4 shows the penetration levels of wind and solar power in the European electricity system in 2020 given a scenario of rapid expansion. Europe is here subdivided into 50 regions. The penetration level is calculated as the total electric-ity production from wind and solar power in each region in one year, divided by the total consumption of electricity in that region during the same time period.
In such a scenario, congestion in the transmission system is strongly affected by the production of wind and solar power. To illustrate the effects, Figure 9.5 and Figure 9.6 show marginal generation costs in Europe in two different situations. In Figure 9.5, wind power production is high, while load (demand) is relatively low. This results in very low marginal costs in the regions in northern Germany, while neighbouring regions to the east and south have much higher marginal costs. This indicates that the cheap wind power cannot be transmitted to these regions because of limitations in the grid.

103
64
56
48
40
32
24
16
8
Mar
gina
l cos
t, t=
487
[EU
R/M
Wh]
Congestion Desired electricity flows
Figure 9.5 An example of marginal generation costs in the 50 regions in one time step in the simulated European electricity system, where the wind power output is high in northern Germany. This situation causes congestion, which can be seen through the differences in marginal costs between the brighter coloured regions in northern Germany, and the darker coloured regions in the south-eastern parts of Europe. The congestion is illustrated by the yellow curve in the figure and is an example of a congestion pattern strongly affected by wind power production.
Figure 9.6 shows a completely different situation, where marginal costs are very high in the central parts of Europe, due to high load, and lower in the Iberian Peninsula, southern Italy, and Scandinavia. Congestion arises, since the transmis-sion system does not allow for the cheap solar power in southern Europe and the cheap hydropower in northern Europe to be sufficiently distributed to the central regions.
The examples explained above demonstrate that extensive deployment of wind and solar power may have a large impact on congestion in the European transmis-sion system. The new congestion situations that arise with large amounts of wind and solar power in the system do so due to the fact that the present transmission system was not designed with these conditions in mind. Therefore, the planning of the future transmission expansion will have to be made taking into account the locations and properties of the variable renewable resources that will become increasingly important in the future.

104
64
56
48
40
32
24
16
8
Mar
gina
l cos
t, t=
487
[EU
R/M
Wh]
Congestion Desired electricity flows
Figure 9.6 An example of the marginal generation costs in the 50 regions in one time step in the simulated Euro-pean electricity system, where load is high in the entire system and where solar power production is high in southern Italy and in the Iberian Peninsula. In this case congestion arises between the central parts of Europe where marginal costs are high due to the high load and the southern parts where cheap solar power is available. There is also congestion between Scandinavia, where there is cheap hydropower, and continental Europe. The congestion is illustrated by the yellow curves in the figure.
This will give the opportunity to lower the electricity prices as well as increase the value of the electricity produced by new power plants by investments in the grid. These investments will be economically profitable and small compared to the investments in the new power plants.
MARKET DESIGN AND POLICY IMPLICATIONSThis section briefly discusses some market design issues and possible solutions related to challenges arising from large-scale integration of wind and solar power. The role of the market is to facilitate an efficient operation of the power system, but also to provide long-term incentives for investments in e.g. transmission and production capacity. Even though the physical laws of electricity are the same all over the world, market organisation and policy concerning electricity trade differ significantly between regions. Here, we mainly apply a European perspective on the power market.

105
One major factor concerning investments in wind and solar power is the actors’ expectations concerning market prices and possible revenues. An important question related to pricing is the method to handle congestion in the transmission system, since this will heavily affect the resulting market prices in different parts of the system. Area pricing is one such method commonly applied in Europe, and which also is used in the Nordic countries. The method implies that there are dif-ferent prices in different parts of the system. One of the reasons for the introduc-tion of such price areas is to provide incentives to locate new production, such as wind and solar power plants, closer to load centres.
In order to promote investments in renewable energy, different economical instru-ments can be introduced. One example is feed-in tariffs, where producers of renewable energy are guaranteed a certain price for the energy they deliver to the grid. This is applied in for example Germany. Another example is green certificates, which was introduced in Sweden in 2003. Production resources being classified as renewable then also produce a financial instrument, a green certificate, for each MWh of production. The consumers are mandated to buy green certificates rep-resenting a specified share of their electricity consumption. The green certificates are traded on a market and the owners of renewable power plants get revenues also for the green certificates. Thereby they get an increased economic incentive to invest in renewable energy production.13
Concerning market design and incentives for investments in wind and solar power, the balance settlement process and the possibility to adjust traded volumes according to updated production forecasts are important issues. The most com-mon way of trading electricity is through a day-ahead spot market,14 which means that production forecast for 12-36 hours are required in the trading process. This is of course a great challenge for wind and solar power owners. In the imbalance settlement, performed after the actual hour has occurred, the deviation between traded volumes and actual volumes for that hour is managed economically. Such deviations can induce significant imbalance costs for owners of intermittent wind and solar power producers due to forecast errors. One way of managing this is to act on the adjustment market,15 where the traded volumes on the spot market can be adjusted according to forecast updates. This is a market place which is fore-seen to play a more central role in systems with large amounts of wind and solar power, and which facilitates risk mitigation for owners of such power plants.
As the amounts of production capacity increases in the system, the units having the highest marginal costs will be used less hours during the year. This means that at some point the generating companies will take these units out of operation since they will not any longer carry their own costs (Chapter 11). However, even though the plant owners interests in keeping generation capacity would decrease there could still be a need to keep capacity in the system in order to maintain the reliability of the power system, e.g. in situations with low wind power production and high loads.
13 Factors that limit the impact on investments in renewable power of the green certificate scheme are discussed in Chapter 15, and some aspects of the political context of the German and Swedish systems are discussed in Chapters 13-14.14 Day-ahead spot markets exist all over Europe. In the Nordic case, the spot market is owned and operated by Nord Pool.15 In the Nordic system, the adjustment market is called Elbas and is operated by Nord Pool.

106
One way of creating incentives to keep capacity is to introduce capacity markets or capacity credits,16 where producers (and possibly consumers) can get eco-nomic compensation for keeping generation capacity. The owners of production resources on the capacity market are free to use their capacity for generation and trading on the energy market. The point of capacity markets it to encourage reten-tion of existing resources, as well as for investing in new generation, so these can be used on the market providing electricity when needed.17
Investment in transmission capacity is a question of great importance in order to benefit from renewable power sources being localised in different parts in the system. Transmission network expansion is a responsibility of the transmission system operator (TSO), which in many systems and countries is a public utility. The economic incentive to increase transmission capacity depends on several factors: one is the owner directives, in which the owner (i.e. the government) states targets for the TSO and relate this to economic instruments; another is the choice of con-gestion management scheme defining how bottlenecks in the transmission should be handled financially. As previously stated, area pricing is commonly applied in Europe. One drawback of area pricing is that the TSO benefits from price differ-ences18, resulting in a lack of incentive to invest in transmission. This can however be handled by strong owner directives creating sufficient economic incentives by relating to the number of congested hours or similar.
The distribution networks are in many systems operated by companies having monopoly of the distribution of electricity in a certain geographical area. In order to make sure these actors don’t abuse their monopolistic position, they are regulated and monitored by the authorities. The regulation design defines the economic incentives for the distribution system operators (DSOs) to invest in the grid, and also imposes restrictions on the DSOs operation of their grid. In terms of integration of wind and solar power in the distribution grid, it is important that the regulation allows investments facilitating an efficient operation of the network in areas with large amounts of distributed production. The possibility for DSOs to use energy storage in the distribution network is one such issue that needs to be addressed.
The unforeseen production variations of wind and solar power will increase the need for balancing power and frequency control measures. Frequency control is usually performed in several steps: primary, secondary and tertiary control. The two first are usually performed by technical systems installed at certain production units, reacting automatically to deviations from the nominal frequency level. The tertiary control is often market based, where the TSO can trade power in order to release capacity for primary and secondary control. Such markets are sometimes referred to as real-time balancing markets.
16 Brunekreeft, G. et al. (2011), A Raw Model for a North European Capacity Market - A Discussion Paper. Stockholm, Sweden: Elforsk (Repport 11:30). 17 See also Chapters 2 and 13 for a discussion on capacity markets and similar arrangements as a way for incumbent utilities to protect the value of their assets.18 The economic transaction related to transmission consists of the TSO trading electricity between the connected areas. Elec-tricity is bought in the exporting area and is sold in the importing area. Congestion implies different prices in the different areas, where the exporting area will have a lower price than the importing area. The resulting trade thereby results in revenue for the TSO which can be calculated as the price difference multiplied with the transmitted electricity.

107
In the Nordic case, the main resource for balancing the power system is the hydro-power system which is very flexible in terms of changing the generation level. How-ever, most parts of Europe lack such flexible production resources. When intro-ducing large amounts wind and solar power, it might also be efficient to further explore the possibilities to use the load as a balancing resource (DSM is further discussed in Chapter 10). In some systems, large industrial consumers already act to some extent on the real-time balancing market providing tertiary control capac-ity. However, it can also be efficient to use more distributed resources consisting of for example household heating systems through aggregators to provide system services. This might require new market designs allowing and facilitating these kinds of market actors to be a part of the frequency control.
CONCLUDING REMARKSIn this chapter different aspects and challenges related to integration of electricity production from wind and solar in existing electricity grids have been discussed. The main challenge with integrating wind and solar is due to the fluctuations in the power generated from these sources. From a technical point of view there are no major limitations to the amount of wind and solar that could be integrated into the power system. However, it results in new conditions that the electricity grid needs to be adapted to.
Integrating wind and solar production in a distribution system could cause volt-age rise and overloading of system components. On the other hand it could also reduce losses within the system. For the transmission grid, the challenges can be visualised as congestion between areas. Although there is congestion between areas already today, the congestion patterns change with increased wind and solar production. This shows that the demand for new transmission capacity between areas may also change with increased electricity production from wind and solar. Other alternatives, such as storage (Chapter 5), production of electro-fuels (Chapter 12), and demand side management including demand response (Chapter 10) could be used to reduce the demand for transmission capacity.
Market will play an important role, both to create incentives for investments in renewable generation technologies but also to maintain the balance between demand and supply of electricity over different time scales and to ensure invest-ments in transmission and distribution capacity. As a consequence, increased wind and solar power production will require new institutional arrangements.19
19 The importance of institutional arrangements is further discussed in Chapters 2 and 13-16.