challenges and strategies - dot
TRANSCRIPT

DRAFT –8/19/13
III. SAFETY
Improve public health and safety by reducing transportation-related fatalities and injuries.
CHALLENGES AND STRATEGIES
Our top priority is to make the U.S. transportation system the safest in the world. As illustrated in Figure 2, we have made good progress in reducing overall transportation-related fatalities and injuries during the past two decades. This downward trend occurred while the U.S. population and travel increased significantly. However, we must continue to promote safer behaviors, vehicle designs, and infrastructure that will further reduce risks and minimize injury for all travelers.
We will work with our stakeholders - transportation agencies, elected officials, law enforcement, industry, safety advocates, drivers, the disability and older adult communities, and the public - to keep the transportation system safe. We will use our safety regulatory authority over automobiles, aviation, rail, trucks, motorcoaches, pipelines, and hazardous materials as cost-effectively as possible to reduce crashes and injuries, and implement our expanded regulatory authority for public transit. We will continue to direct federal resources to the highest safety risks and bring program reforms that will advance our safety mission. We will address these challenges through cross-modal as well as modal specific strategies targeted toward specific safety risks.
Figure 2. Transportation-related Fatalities and Injuries, 1990 to 2011.
(Source: U.S. Department of Transportation, National Transportation Statistics).
10
0
10,000
20,000
30,000
40,000
50,000
60,000
70,000
80,000
0
500,000
1,000,000
1,500,000
2,000,000
2,500,000
3,000,000
3,500,000
4,000,000
1990 1992 1994 1996 1998 2000 2002 2004 2006 2008 2010
Fata
litie
s
Inju
red
Pers
ons
Year
Injuries Fatalities

DRAFT –8/19/13
11
The U.S. DOT Safety Council provides a forum for information exchange, discussion and collaboration to enable coordinated, cross-modal approaches to advancing the safety goal. The Safety Council leverages the Departmental expertise and leadership of the Chief Safety Officers, Associate Administrators of Safety and other senior safety leaders to identify, prioritize, and coordinate cross-modal safety challenges and emerging issues with the operating administrations. The Safety Council provides both advice and technical support to the Secretary and Operating Administrations on the most important Departmental safety issues.
DOT SAFETY COUNCIL
Our strategic objective is presented below:
In the following paragraphs, we describe our approach to addressing these challenges, beginning with motor vehicles - passenger cars, motorcycles, and light, medium, and heavy duty trucks – and continuing with pedestrians and cyclists. Because motor vehicles are the largest contributor to transportation-related fatalities and injuries as well as the predominant mode of travel in the U.S., we discuss this challenge in some detail. Our programs use a data driven approach to address a combination of driver, vehicle, and roadway factors in order to prevent or minimize the impact of a traffic crash, or hinder post-crash responses. Next, we discuss aviation, rail, transit, pipeline and hazardous liquids safety. The emphasis in these modes of travel is also on data-driven prevention methods such as voluntary reporting and risk management, e.g., minimizing pilot or operator error. Finally, we describe efforts to minimize drug use and alcohol misuse among safety-sensitive transportation workers.
STRATEGIES FOR REDUCING MOTOR VEHICLE FATALITIES AND INJURIES
Fatalities in motor vehicle traffic crashes accounted for 94 percent of a total of 34,362 transportation-related fatalities in 2011, as shown in Table B. The resulting costs of motor vehicle crashes drain more than $230 billion, in 2000 dollars, from the economy annually.6
FY 2014-2018 STRATEGIC OBJECTIVE
v Improve the safety of the transportation system by addressing behavioral, vehicle, and infrastructure safety issues through prevention, mitigation, and response using innovative and effective partnerships, programs, and resources (SA1).

DRAFT –8/19/13
Table B. Transportation Fatalities by Mode, 2011.
.(Source: National Transportation Statistics, Table 2-1, U.S. DOT, 2013)
12
In 2011, 32,367 people lost their lives and an estimated 2.22 million people were injured in motor vehicle crashes, even as roadway fatalities and injuries fell to their lowest rates ever. In 2011, the rate of fatalities was 1.10 per hundred million vehicle miles of travel (VMT). The declines in motor vehicle fatalities and injuries that we’ve seen during the past two decades are the result of successful efforts in these major areas:
v Drivers are exhibiting safer behaviors, buckling their seatbelts at record rates, and choosing not to get behind the wheel after drinking;7
v Vehicle designs are much safer, as crash avoidance technologies such as electronic stability control and crashworthiness technologies such as advanced air bags continue to improve and are more widely deployed in the fleet;
v Highway infrastructure designs are safer due to safer intersections, better signs and lighting, improved pavement technologies, and more effective crash barriers;
v States and municipalities significantly improved their ability to analyze data and more effectively target resources on their largest safety challenges and
v Traffic operations strategies and Intelligent Transportation Systems (ITS) are preventing crashes by informing travelers and enabling proactive management of the surface transportation system.
To continue this downward trend in motor vehicle fatalities and injuries, DOT will:
Ø Expand efforts to increase seat belt use through increased enforcement and communications, and complete a regulation requiring lap shoulder seat belts for motor coaches;
Transportation Mode Number of Fatalities
Percent of Total
Highway 32,367 94.2
Waterborne* 820 2.4
Railroad 570 1.7
Air 485 1.4
Transit 106 0.3
Pipeline 14 <0.1
* Waterborne travel safety is the responsibility of the U.S. Coast Guard.

DRAFT –8/19/13
Ø Reinforce partnerships with Federal agencies, States, localities, and Tribal governments to address problems associated with alcohol-impaired driving, and continue to explore the potential for widespread use of in-vehicle technologies to prevent alcohol-impaired driving;
13
8
Ø Improve the roadway infrastructure through system-wide implementation of proven safety countermeasures, traffic calming measures such as roundabouts and innovative intersection design;
Ø Promote upgrades in State and local data systems and analytical capacity to further advance performance-based investment decisions and grant allocations;
Ø Complete and implement NHTSA’s Data Modernization, which will enhance the quality of crash data collection and improve the IT systems supporting NHTSA’s crash data bases, thereby ensuring that regulatory and safety program decisions continue to be based on sound data;
Ø Implement the performance-based safety programs in the MAP-21 legislation;
Ø Promote the integration of all federal safety programs working toward a common goal of reducing fatalities and serious injuries;
Ø Implement the DOT Blueprint for Ending Distracted Driving by encouraging all States to enact and enforce distracted driving laws, encouraging the auto industry and manufacturers of handheld electronic devices to adhere to guidelines for in-vehicle and nomadic technologies that reduce the potential for distraction, and educating novice drivers to the risks of driver distraction and its consequences.9
Ø Encourage the deployment of effective advanced vehicle automation technologies to enhance safety, including crash avoidance technologies such as advanced braking systems, warning systems relating to lane departure and blind spots, and pedestrian collision avoidance systems;
Ø Continue research and implementation of vehicle-to-vehicle and vehicle-to-infrastructure technologies that enable vehicles to communicate and potentially avoid collisions and offer additional mobility and environmental benefits; 10
Ø Continue strong enforcement of vehicle safety laws to ensure defective and noncompliant vehicles and equipment are identified and remedied;
Ø Carry out research and demonstration projects in operator safety to reduce fatalities and injuries in rail and bus operations; and
Ø Provide national leadership in promoting and developing effective emergency medical services systems to enhance survival of motor vehicle crash patients by improving post-crash care, including the triage of patients to the appropriate levels of medical care and reducing the elapsed time from the crash until the patient arrives at definitive care.
Although only 21 percent of the U.S. population lives in rural areas, rural crashes accounted for 55 percent of all traffic fatalities in 2010. 11However, fatalities in rural

DRAFT –8/19/13
areas have declined at twice the rate of fatalities in urban areas over the past decade. To further improve rural road safety, DOT will:
Ø Encourage State and local agencies to improve their data-driven, comprehensive safety strategies and collaborate with stakeholders such as Federal land management agencies, and local and Tribal governments, to improve safety levels; and
Ø Provide national leadership in delivering safety programs and products to Tribal communities, gateway communities, and local governments.
PEDESTRIANS, BICYCLISTS, AND ALL ROAD USERS
While we have achieved many safety gains through traditional roadway safety design practices, there are too many roadways, especially in highly populated areas, that inconsistently provide adequate safety for pedestrians, bicyclists, and people with disabilities. While the ten year trend in pedestrian and bicycle fatalities is consistent with the downward trend in overall fatalities, pedestrian fatalities increased 3 percent and bicycle fatalities were up by 9 percent, respectively, between 2010 and 2011. When this increase is looked at in conjunction with a greater demand for pedestrian and bicycling options and an increased emphasis in many urban areas for a more diversified transportation network that accommodates that demand, more attention needs to be placed on how pedestrian and bicycling options can be more effectively and safely integrated into existing transportation networks.
Roadway designs that accommodate all users, referred to as complete streets, help to reduce fatalities and injuries. These roadway designs include features such as sidewalks, raised medians, turning access controls, better bus stop placement, better lighting, traffic calming measures, accessible sidewalks, curb cuts, accessible signage for sensory and cognitive disabilities, and other advances for travelers with disabilities. A safety review found that designing streets with these users in mind improves pedestrian, bicyclist, and motorist safety.
14
12 Instituting policies that accommodate all roadway users ensures that every transportation project becomes a comprehensive safety project. These policies have the added benefit of making walking and biking more attractive options and of enhancing the aesthetic quality and commercial activity on local streets.
Older road users are particularly vulnerable. They are more likely to suffer life-threatening injuries even in minor crashes compared with younger people. In 2011, more than 5,400 people age 65 and older were killed and 185,000 were injured in traffic crashes. With the rising number of Americans reaching retirement age over the next 10 to 20 years, strategies to address their transportation safety needs more attention.
To reduce fatalities and injuries for pedestrians, bicyclists, and older drivers, DOT will:
Ø Establish a new clearinghouse of information on determining medical fitness to drive as a resource for State licensing agencies;
Ø Encourage States to adopt policies and programs that improve pedestrian, and bicyclist safety;13

DRAFT –8/19/13
Ø Work with State, local, and Tribal governments to provide more technical assistance such as the application of pedestrian and bicycle safety assessments to ensure that transportation systems are designed for optimum safety for all;
Ø Develop training programs for motorists, children, pedestrians and bicyclists and promote the use of these programs in schools and other venues;
Ø Work with stakeholders to increase accessible sidewalks, curb cuts and signage, to increase safety for people with disabilities, older adults, novice drivers, and young children;
Ø Distribute community-oriented material, including material in multiple languages, and in culturally competent and accessible formats for people with disabilities, that offers technical guidance on improving pedestrian and bicycle safety through engineering, outreach and enforcement activities;
Ø Consider adopting vehicle standards to reduce pedestrian deaths by making vehicles less likely to harm the pedestrian and by providing driver warnings or automatic braking to prevent a pedestrian crash;
Ø Collaborate with the U.S. Department of Justice, and with State and local law enforcement agencies to promote the adoption of integrated law enforcement and traffic safety strategies based on geographic analysis of crime and traffic safety data; and
Ø Provide national leadership on comprehensive, data-driven and evidence-based emergency medical services and Next Generation 911 systems.
MOTORCYCLISTS
There were 4,612 motorcycle fatalities in 2011. When compared to 2,897 fatalities in 2000, this represents an increase of 60 percent over this period. Since the late 1990s, the number of registered motorcyclists has doubled. As a result, we are seeing an increase in motorcycle crash fatalities, which has partially offset an overall reduction in highway fatalities.
15
14 In 2011, only 60 percent of motorcyclists nationwide were wearing motorcycle helmets, a decline from 2000 when 71 percent were helmeted.
We endorse efforts to encourage riders to wear DOT-certified motorcycle helmets on every trip. Additionally, we must increase awareness of motorcycle safety risks and identify best practices to improve the safety of motorcycle riding. In order to accomplish this, we need to identify factors that contribute to motorcycle crashes and identify strategies for reducing crash frequency and severity. To improve motorcycle safety, we will:
Ø Develop a set of voluntary national education standards for entry-level motorcycle rider training programs to promote more comprehensive and consistent programs nationwide, and best practices for States in implementing these programs;15
Ø Evaluate the benefits of improved motorcycle safety law enforcement and raising the number of licensed motorcyclists because unlicensed motorcyclists are overrepresented in crashes;

DRAFT –8/19/13
Ø Continue to encourage motorcyclists to use only DOT-certified helmets through educational and possibly regulatory actions;
Ø Work with States to implement new programs to reduce alcohol impairment levels among motorcyclists, and explore new technologies that could make motorcycles safer to operate; and
Ø Conclude the FHWA Motorcycle Crash Causation Study to identify contributing factors for motorcycle crashes and identify effective countermeasures based on evaluation and analysis of the study data.
COMMERCIAL MOTOR VEHICLES
In 2011, commercial motor vehicles (CMV), or large trucks and buses, represented 4.3 percent of all registered vehicles and 9.5 percent of total Vehicle Miles Traveled (VMT) on the Nation's roadways. In 2011, about 12 percent, or 3,568, of all motor vehicle fatalities in the U.S. involved crashes with CMVs. The fatality rate declined from 0.205 to 0.136 fatalities per hundred million VMT between 2000 and 2011.
We attribute some portion of the overall improvement to the steady implementation of the FMCSA Compliance, Safety, Accountability enforcement model, which is modernizing the effectiveness and efficiency of motor carrier enforcement activities through early contact with a greater number of motor carriers.
16
16 Targeted enforcement interventions, increased oversight of Commercial Drivers License programs, safety audits, and inspections of motor carriers and operators have contributed to reducing the fatality rate. The primary challenge in continuing to improve truck and bus safety is to make certain that a safety culture exists across the industry. To improve motor vehicle safety, we will:
Ø Implement a three-pronged strategy that raises the bar to enter the motor carrier industry, requires carriers to maintain high safety standards to remain in the industry, and removes high-risk carriers, drivers, and service providers from operation;
Ø Promote safe operations and best practices through partnerships and education;
Ø Improve operator medical qualifications, credentialing, and licensing systems;
Ø Improve safety information, research, and analysis to advance innovation, technical solutions, and operational effectiveness; and
Ø Consider regulatory actions to improve crashworthiness of motor coaches and other commercial vehicles and to require implementation of cost effective crash avoidance technologies to those vehicles.
STRATEGIC HIGHWAY RESEARCH PROGRAM SAFETY DATA
Researchers estimate that driver behavior causes or contributes to 90 percent of crashes. Yet, comparatively little is known about how drivers respond to the driving environment inside and outside their vehicles. To address this critical gap in our understanding of driver behavior, the second Strategic Highway Research Program

DRAFT –8/19/13
(SHRP2) safety program is developing the most comprehensive naturalistic driving study database in the world.
The study will capture a broad range of data on the behavior of approximately 3,100 volunteer drivers in real-world driving conditions at six sites in the continental United States. A complementary roadway information database will make it possible to relate driver behavior to roadway characteristics. These foundational databases along with improved data sets and analysis support tools are expected to be used by public, private, and academic researchers to improve safety for the next 30 years.
To improve our ability to use safety data to understand driver behavior and its contribution to crashes, we will:
Ø Establish policies and procedures for long-term stewardship of the SHRP2 safety data, including broad policies for data access, privacy, and information security;
Ø Ensure that the research community has broad access to the data in a useful, convenient, timely and affordable manner, while providing data and system security that meets all relevant standards;
Ø Provide technical assistance to users of secure data in the form of training, analysis support, and development of analytical tools;
Ø Promote the use of the data to study the interrelationship between the driver, vehicle, roadway, and the environment to further develop safety improvements; and
Ø Continue to work with stakeholders and partners to identify high-priority research needs that can be addressed using the data.
STRATEGIES TO REDUCE FATALITIES AND INJURIES IN AVIATION
There were 485 aviation-related fatalities in 2011, which represents about 1.4 percent of all transportation-related fatalities, as shown in Table A. Most of these fatalities were in general aviation and 80 percent of all fatal accidents were attributed to human factors. While past efforts have brought commercial aviation fatalities to historic lows, a shift in thinking will be necessary to drive additional safety improvements in the future. Looking forward, it will be essential to view aviation as a system of interacting elements, and to bring together all aviation stakeholders to achieve additional improvements.
Several government and industry initiatives are underway to shift from forensic, accident-based safety analysis with targeted mitigations to a more robust, integrated safety data and information driven environment with systemic safety solutions. The success of these initiatives requires the adoption of Safety Management Systems (SMS). We are working with domestic and international stakeholders, including airline carriers, to stimulate cooperation for, and protection of, open reporting of safety concerns. In our safety oversight capacity, FAA staff work with stakeholders to incorporate SMS principles throughout their operations.
We will continue to develop and deploy technologies to use U.S. airspace in safer, more efficient, and more environmentally sound ways.
17
17 The Next Generation Air

DRAFT –8/19/13
Transportation System (NextGen) is providing air traffic managers and pilots with the tools to proactively identify and mitigate weather and other potential flight conflicts. It will enable us to better meet our national security needs and ensure that travelers benefit from the highest levels of safety. To meet this challenge, we will:
Ø Leverage optimum use of existing aircraft navigation and communication capabilities. Accommodate new aircraft capabilities through improved airport, terminal and en-route operations, and flight information services in order to improve or ensure there is no degradation of safety as NextGen technologies and operations are introduced;
Ø Modernize the criteria related to pilot qualification, training, testing, and hiring, including for pilots flying for regional airlines;
Ø Work to develop competency of civil aviation authorities worldwide to meet international safety oversight standards;
Ø Continue vital partnership initiatives with key aviation stakeholders to encourage the implementation of voluntary safety reporting programs in a protected environment;
18
18 and
Ø Continue general aviation partnership efforts to develop safety strategies that will mitigate the root causes of accidents.
STRATEGIES TO REDUCE RAILROAD FATALITIES AND INJURIES
During FY 2012, rail-related accidents and incidents resulted in 684 fatalities and 7,481 injuries. The total rail-related accident and incident rate, which includes train accidents, highway rail grade crossing incidents, and other accidents and incidents, fell from 19.0 in FY 2004 accidents and incidents per million train-miles to 14.9 in FY 2012, which is the lowest since data collection began in the 1970s. The past 10 years were the safest ever for the railroad industry. From FY 2003 through FY 2012, the number of reportable rail-related events declined 23 percent to 11,068. Train accidents fell 39 percent to 1,815, highway rail grade crossing incidents decreased 31 percent to 2,037, and other accidents and injuries decreased 14 percent to 7,216.
To ensure the safety of the Nation’s rail operations and infrastructure, we enforce safety regulations, administer financial assistance programs, and conduct rail safety research and development. Field inspectors and specialists use data-driven, risk-based targeting to focus their activities, with particular attention on human error and track flaws, which are the two leading causes of train accidents. Moreover, we are committed to helping resolve technical and spectrum availability issues that could hinder implementation of positive train control systems.19 To achieve higher levels of safety performance, railroads must adopt system safety and risk reduction programs, as well as new technologies such as positive train control systems.
To promote further increases in rail safety, we will: Ø Continue working with the freight and passenger railroads to overcome technical and
programmatic obstacles to implementation of positive train control system;

DRAFT –8/19/13
Ø Oversee initiatives to discourage employee distraction while performing safety critical duties; and work with the Railroad Safety Advisory Committee to develop recommendations in conjunction with the Department’s effort to combat distracted driving across all modes; and
Ø Work with railroad management, labor and other stakeholders to implement Risk Reduction Program, including the Confidential Close Call reporting system, an FRA-led, industry wide initiative to build strong safety cultures by using predictive data to identify individual and systemic safety risks and developing innovative methods, processes, and technologies to correct problems and mitigate risks.
There are about 250 fatalities each year at approximately 216,000 public and private at-grade railroad-highway crossings in the U.S. About 94 percent of collisions and 87 percent of grade crossing fatalities are the result of risky motor vehicle driver behavior or poor judgment. To improve safety at these crossings, we will:
Ø Ensure that corridor plans for high-speed and intercity passenger rail operations address grade crossing safety;
Ø Use public awareness programs to help motor vehicle drivers learn to navigate grade crossings safely;
Ø Promote consistent enforcement of State and local traffic safety laws and sustained use of penalties on violators to deter motorists from making poor decisions at grade crossings; and
Ø Encourage installation of flashing lights and gates and traffic lane dividers that deter motorists from violating grade crossings and driving around lowered gates.
STRATEGIES TO REDUCE TRANSIT FATALITIES AND INJURIES
Transit, which provides more than 10 billion passenger trips each year, is one of the safest modes of travel. In 2011, 228 fatalities, of which only 36 were transit patrons, were associated with transit systems not regulated by the FRA. Despite this safe record, several significant transit accidents in recent years have raised important concerns about the safety practices at some of our Nation's largest transit agencies. The challenge confronting the transit sector is how to improve on the current transit safety record, even as the number of people using transit increases and as infrastructure and equipment age.
MAP-21 authorizes FTA to establish and enforce a new comprehensive safety oversight framework for all modes of public transportation, including heavy rail, light rail, buses, ferries, and streetcars. Among other activities, we will work with the DOT Transit Rail Advisory Committee to update and enhance the State safety oversight program for rail transit systems to ensure that these systems are meeting basic, common-sense safety requirements. The law also includes important new safety provisions for transit bus operators. To improve public transportation safety, we will:
Ø Establish requirements to approve and certify each State safety oversight agency to ensure that it assumes responsibility for safety oversight of rail transit systems and enforces federal law for rail transit safety;
19

DRAFT –8/19/13
Ø Develop safety performance criteria for all modes of public transportation; Ø Develop minimum safety performance standards for transit vehicles not
regulated by the FRA, FMCSA, or the U.S. Coast Guard; Ø Establish requirements for these safety performance criteria to be integrated
into the metropolitan planning process and the statewide (i.e., non-metropolitan) planning process; and
Ø Develop a public transportation safety certification program that applies to all modes of public transportation.
STRATEGIES TO REDUCE FATALITIES AND INJURIES IN HAZARDOUS MATERIALS TRANSPORTATION
We must also address the safety and economic impacts that transportation-related disruptions, such the release of hazardous materials or pipeline spills, have on communities. Hazmat transportation fatalities across all modes of transportation occur at the rate of one for every 21 billion ton-miles moved, which represents an average of 13 fatalities per year between 2001 and 2010. Some of the most serious risks from hazardous materials are due to infrequent accidents that have significant consequences, such as a freight car derailment that releases chemicals listed as hazardous materials into the surrounding environment.
During the past decade, there were 94 hazmat incidents in the U.S. involving one or more fatalities. At least three-fourths of these involved a truck rollover or crash. Key targeted areas of risk include fire aboard aircraft, release of bulk quantities of materials that are toxic-by-inhalation, and tank truck rollovers. To increase hazmat safety, we will:
Ø Enhance the review of applicants for special permits and approvals to ensure that they are fit to perform the required functions and adhere to the provisions of their permit or approval;
Ø Develop uniform standards for training hazmat inspectors and investigators; Ø Develop a risk management framework and improve hazmat data collection (i.e.,
incident, inspection, and investigation) to identify risk concentrations and target use of resources to manage the most serious risks;
Ø Advance research to develop technologies and procedures to better secure hazardous materials shipments and assess the risks of hazmat events;
Ø Develop software that systematically evaluates the risk of alternative rail routes for transporting hazardous material and provides respective scores for ranking purposes; and
Ø Under our Rail Accident Mitigation Project, conduct additional hazardous materials safety inspections in the Bakken Formation region.
20
20
STRATEGIES TO REDUCE PIPELINE FATALITIES AND INJURIES
Pipelines carry two-thirds of the Nation’s energy supplies. Over the past twenty years, pipeline incidents involving fatalities or major injuries have declined by 50 percent. Improvements in risk management, such as integrity management programs for each pipeline system and damage prevention programs in the States, have markedly reduced accidents due to corrosion and excavation damage. Advances in pipeline materials and technology have reduced the risks from material failure. The possibility of a pipeline

DRAFT –8/19/13
spill is small. But, the risks are significant to people and the surrounding environment. In addition to safety impacts, communities can be economically impacted when people are evacuated from their homes, business activity is curtailed, and transportation services interrupted.
Most fatal pipeline incidents occurred on gas distribution systems. To address pipeline safety issues, we will:
Ø Work with State pipeline safety programs and pipeline operators to ensure that the identification, repair, rehabilitation, requalification, or replacement of the highest risk pipelines are accelerated;
Ø Investigate new technologies for improving the assessment, detection and control of pipeline risks;
Ø Enhance the 811-Call Before You Dig program at the State and local levels to prevent pipeline damage from excavation;
21
21
Ø Promote awareness and use of recommended practices for land use planning and development near transmission pipelines;22
Ø Integrate, target, and expand safety inspections based on the most serious risks;
Ø Increase our focus on safety beyond compliance with standards, with particular attention to developing a strong safety culture in the companies that we regulate; and
Ø Improve leak detection and the use of product control systems such as excess flow valves, remote control valves, and automatic shutoff valves on gas and liquid pipelines.
STRATEGIES TO REDUCE FATALITIES AND INJURIES FROM ILLEGAL DRUG USE AND ALCOHOL MISUSE
For more than two decades, DOT has been the world leader in regulated drug and alcohol testing and our program is the largest of its kind worldwide. Our mission is to ensure the safety and security of the traveling public by requiring drug and alcohol testing of transportation industry employees. Employees who violate drug and alcohol testing rules are removed from performing safety-sensitive duties immediately. They must submit to an evaluation and successfully comply with treatment recommendations before returning to duty. We require employers subject to these regulations to report drug and alcohol data annually and laboratories to report drug positive test results on a semi-annual basis. DOT operating administrations - FAA, FMCSA, FRA, FTA, and PHMSA - as well as the U.S. Coast Guard collaborate with the DOT Office of Drug and Alcohol Policy and Compliance to ensure that regulations and enforcement efforts are carried out consistently and effectively. Additionally, they work together to educate and inform employers, service agents, and employees in the transportation industry of the regulations that cover more than 8 million safety-sensitive employees in the U.S. To continue this work, we will:
Ø Collaborate internally and with the U.S. Coast Guard to detect and deter illicit drug use and alcohol misuse with respect to safety-sensitive transportation industry employees;23
DRAFT –8/19/13
Ø Ensure that DOT regulations are applied uniformly across the transportation modes to reduce the risks of fatalities and injuries;
Ø Work through high-level meetings and close coordination with the Office of National Drug Control Policy, the U.S. Department of Justice, and other Federal partners to ensure that our regulations and policies are efficient and effective in both drug interdiction work and reducing the demand for illegal drugs through prevention, education, and rehabilitation; and
Ø Work with NHTSA on issues related to drunk and drugged driving.
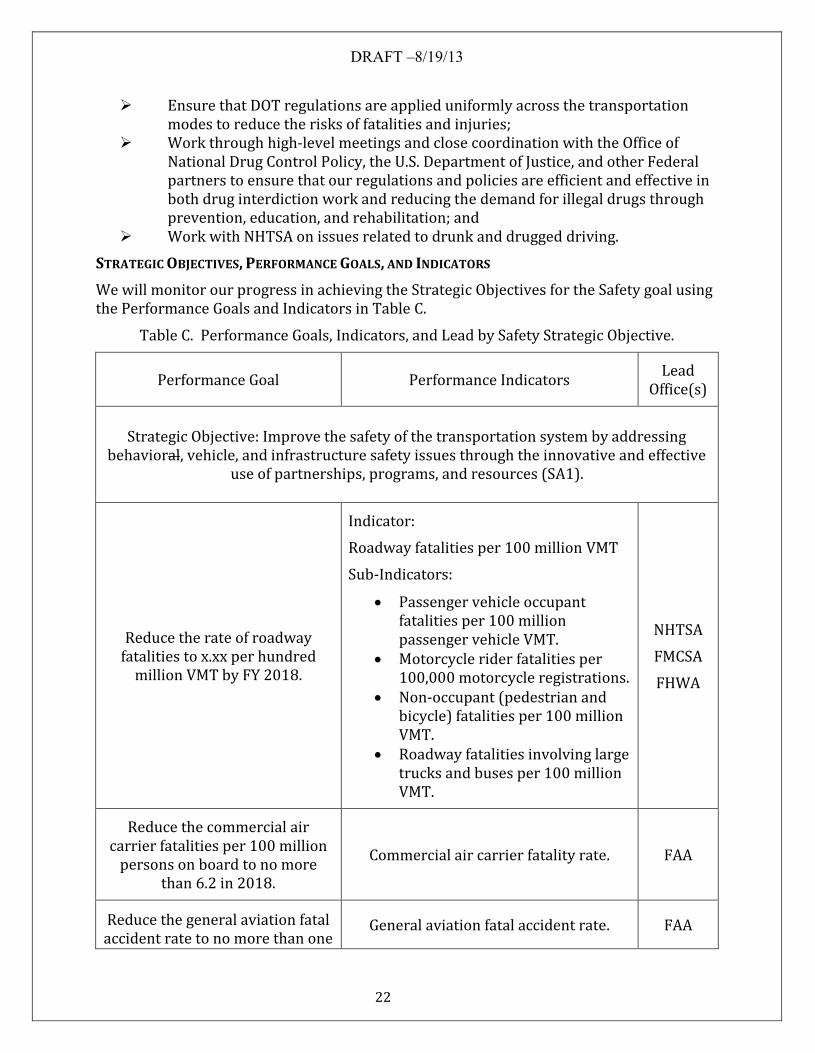
STRATEGIC OBJECTIVES, PERFORMANCE GOALS, AND INDICATORS
We will monitor our progress in achieving the Strategic Objectives for the Safety goal using the Performance Goals and Indicators in Table C.
Table C. Performance Goals, Indicators, and Lead by Safety Strategic Objective.
22
Performance Goal Performance Indicators Lead Office(s)
Strategic Objective: Improve the safety of the transportation system by addressing behavioral, vehicle, and infrastructure safety issues through the innovative and effective
use of partnerships, programs, and resources (SA1).
Reduce the rate of roadway fatalities to x.xx per hundred
million VMT by FY 2018.
Indicator:
Roadway fatalities per 100 million VMT
Sub-Indicators:
· Passenger vehicle occupant fatalities per 100 million passenger vehicle VMT.
· Motorcycle rider fatalities per 100,000 motorcycle registrations.
· Non-occupant (pedestrian and bicycle) fatalities per 100 million VMT.
· Roadway fatalities involving large trucks and buses per 100 million VMT.
NHTSA
FMCSA
FHWA
Reduce the commercial air carrier fatalities per 100 million
persons on board to no more than 6.2 in 2018.
Commercial air carrier fatality rate. FAA
Reduce the general aviation fatal accident rate to no more than one
General aviation fatal accident rate. FAA

DRAFT –8/19/13
23
Performance Goal Performance Indicators Lead Office(s)
fatal accident per 100,000 flight hours by 2018.
Reduce Category A & B (i.e., most serious) runway incursions to a rate of no more than 0.395 per
million operations and maintain or improve the rate through FY
2018.
Rate of runway incursions (category A&B). FAA
Implement 80 percent of approved interventions to mitigate the top 5 hazards
associated with airborne losses of separation.
Percentage of risk interventions implemented. FAA
Reduce total transit fatalities to no more than 220 by 2018. Total annual transit fatalities. FTA
Reduce total rail-related accidents and incidents to no
more than 15.3 per million train miles in FY 2018.
Total rail-related accident and incident rate.24 FRA
Reduce natural gas and hazardous liquid pipeline
incidents involving death or major injury to no more than xx
by FY 2018.
Number of natural gas and hazardous materials pipeline incidents involving
death or major injury. PHMSA
Reduce hazmat transportation incidents involving death or
major injury to no more than xx by FY 2018.
Number of hazmat transportation incidents involving death or major injury. PHMSA
EXTERNAL RISK FACTORS
Traffic fatalities on the Nation’s roadways declined 25 percent between 2006 and 2011. During this same period, vehicle miles of travel also declined by 2 percent after peaking in 2007. The decline in travel is likely associated with the downturn in economic activity following the 2008 recession. Since the U.S. economy has entered a period of stable growth that is forecast to continue for the next few years, we do not expect the same level of

DRAFT –8/19/13
decline in fatalities as was recently observed. Discretionary and recreational travel, which tends to increase in an economic rebound, is riskier than commuting to work and travel to meet family obligations. In these situations, drivers are behind the wheel for longer periods of time, during all hours of the day and night, and often in unfamiliar driving locations.
The troubling increase in fatalities among motorcyclists during the past few years is primarily due to increased exposure, but the risks are increased by the lack of universal helmet laws in a number of states. If all motorcyclists involved in crashes were to wear helmets, an estimated additional 700 lives could be saved each year.
24
25 Prescription and over-the-counter drug use is on the rise. From 2005 to 2009, the proportion of fatally injured drivers who tested positive for drugs (i.e., illicit, prescription, and over-the counter) rose from 13 to 18 percent.26 There is significant evidence that illegal drugs, over-the-counter and prescription medications are playing a greater role in crashes, but the effects of drug use on driving are not as well understood as alcohol, particularly when drugs may interact with each other.
While we do not yet have long term trend safety data, there were 3,331 fatalities in 2011 in which driver distraction was a contributing factor. This figure represents 10 percent of all fatalities during that year and indicates a growing traffic safety problem. More widespread adoption and use of mobile devices by Americans is a likely cause. By 2011, 87 percent of the U.S. population were mobile phone subscribers and 23 percent had used a mobile device to obtain traffic directions. 27 In a recent survey of drivers, 35 percent reported reading a text message or e-mail while driving, and 26 percent stated that they sent a text message. 28 Despite the potential for driver distraction, the adoption of these technologies may also increase transportation safety by providing additional information to drivers or operators, or even by taking control of a vehicle in imminently hazardous situations. However, the increased amount of information must be communicated to drivers and operators in ways that do not excessively divert their attention from the primary task of operating the vehicle. More widespread commercial deployment of driver assistance technologies, such as adaptive cruise control and lane departure warning systems, as well as crash avoidance and crash notification systems, could help reduce human error as a cause of crashes. Future growth in vehicle-to-vehicle communications could yield safety benefits if, for example, drivers receive timely warnings about other vehicles stopped in or crossing their path. Likewise, vehicle-to-infrastructure communications may enable drivers to get warnings of road conditions or speed restrictions. All of these trends are likely to reduce the probability of a crash occurring and spare more lives in the event of a crash. Continuing automated vehicle research addresses issues such as how to ensure an effective driver-vehicle interface to enhance the likelihood that warnings are heeded, how to develop useful performance standards for highly automated systems, and how to ensure that automated control systems fail safe. Active research is underway now to determine effective security and credential management systems that support the trust of all the vehicles, people, and systems in a connected vehicle environment. The successful adoption of connected vehicles will also depend on a number of factors including how the Federal Communications Commission determines the uses of the wireless spectrum and to what extent it will be available for various transportation

DRAFT –8/19/13
uses, such as vehicle-to-vehicle and vehicle-to-infrastructure communication, as well as the fees associated with wireless connections.
Demographic trends will also affect roadway safety over the coming decade including the increasing age of the general population and greater prevalence of older drivers with age-related medical conditions that affect safe driving. Although older drivers are generally involved in fewer crashes per mile traveled, those crashes are more likely to be fatal. In addition, older Americans seeking alternatives to driving are at greater risk if they cannot walk to crosswalks, are able to cross broad street intersections in short periods of time, or can easily board public transit buses.
According to the 2009 National Household Travel Survey, about 11.9 percent of all reported trips were made by walking or bicycling, which is an increase in reported trips by about 25 percent since 2001.
25
29 But approximately one-third of Americans live in communities without sidewalks or bike lanes.30 31 About one-third of Americans do not drive including young people, elderly people, people with mobility disabilities, people who cannot afford to drive and people who choose not to drive. Poor provision for pedestrian and bicycle traffic will continue to impact their safety.
Air travel is also expected to increase as the economy rebounds. The implementation of NextGen will provide air traffic controllers with new tools to reduce airport congestion, increase operational awareness among airport vehicle drivers, and give pilots better weather information for decision-making. Risks of runway incursions can be offset if the aviation industry continues to endorse training and outreach. A risk-based prevention approach that comes with more widespread adoption of SMS should also yield benefits particularly for the General Aviation sector. Approximately 80 percent of fatal General Aviation accidents are related to one or more human factors including individual acts such as skill-based or judgment errors, personnel factors such as self-imposed stress, or inadequate supervision. Widespread adoption by aircraft owners and operators of an open reporting culture and voluntary safety reporting processes will help reduce aviation-related risks.