challenges and best practice for identification and ... · • median nihss 9 vs 4 (out of...
TRANSCRIPT
Challenges and Best Practice for Identification and Management of the In-House Stroke Patient
October 25, 2019
Cynthia Kenmuir MD PhDDirector of Stroke Program, UPMC Altoona
Director of Neurointerventional Program, UPMC Altoona
Outline
• Streamlining of ED acute stroke triage
• In-Hospital Stroke (IHS) • Unique Risk Factors: Illness, Post-Operative, Sedation• In-Hospital Stroke Outcome Disparities
• Potential Interventions
Acute Stroke Triage through ED
• Prehospital Triage (scoring systems like RACE)• Delivery directly to CT scanners• Parallel Processing with prehospital notification of Stroke team
• IV tPA: available in scanner, trained nurse to mix, pharmacy mix• IAT: pre-hospital/early notification of angio team
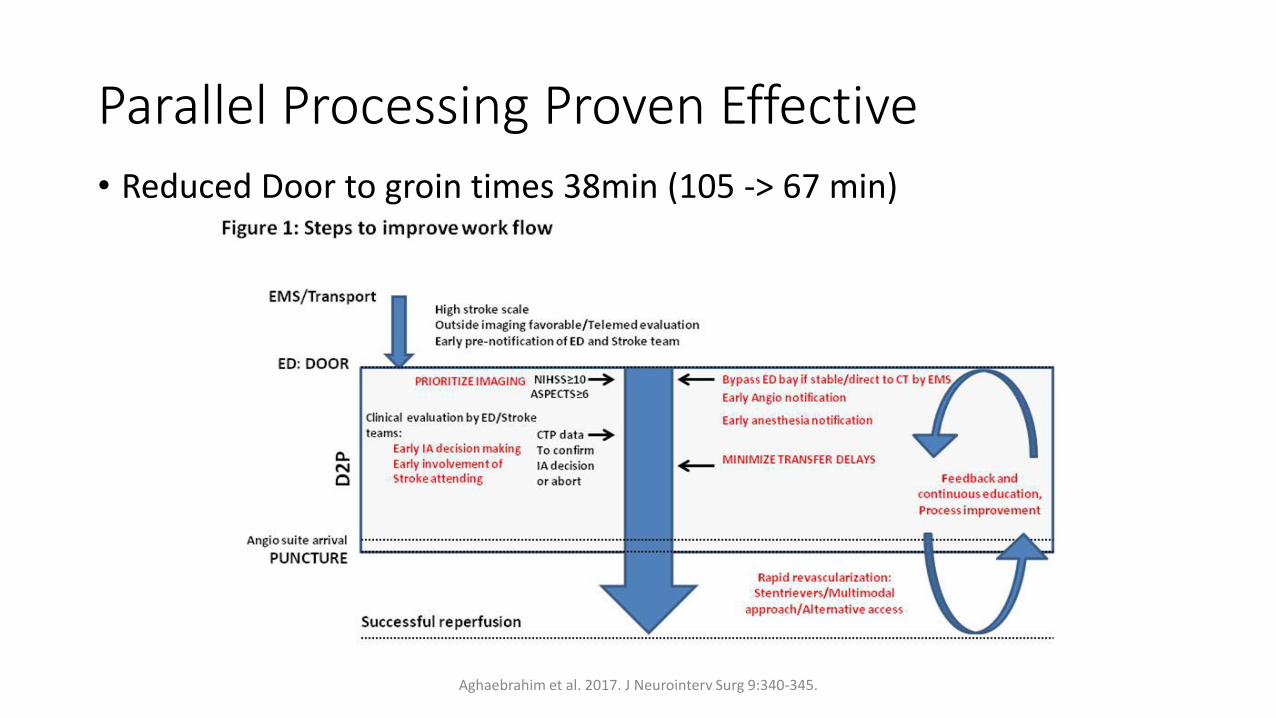
Parallel Processing Proven Effective• Reduced Door to groin times 38min (105 -> 67 min)
Aghaebrahim et al. 2017. J Neurointerv Surg 9:340-345.
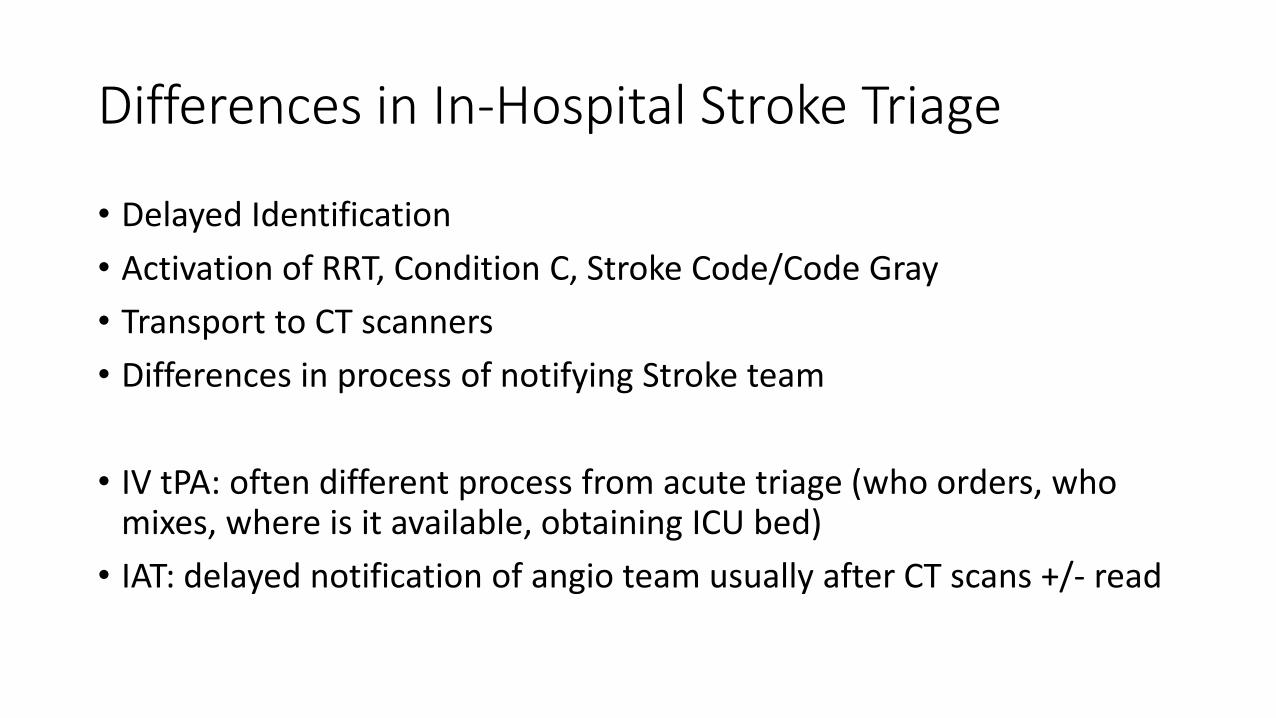
Differences in In-Hospital Stroke Triage
• Delayed Identification• Activation of RRT, Condition C, Stroke Code/Code Gray• Transport to CT scanners• Differences in process of notifying Stroke team
• IV tPA: often different process from acute triage (who orders, who mixes, where is it available, obtaining ICU bed)
• IAT: delayed notification of angio team usually after CT scans +/- read
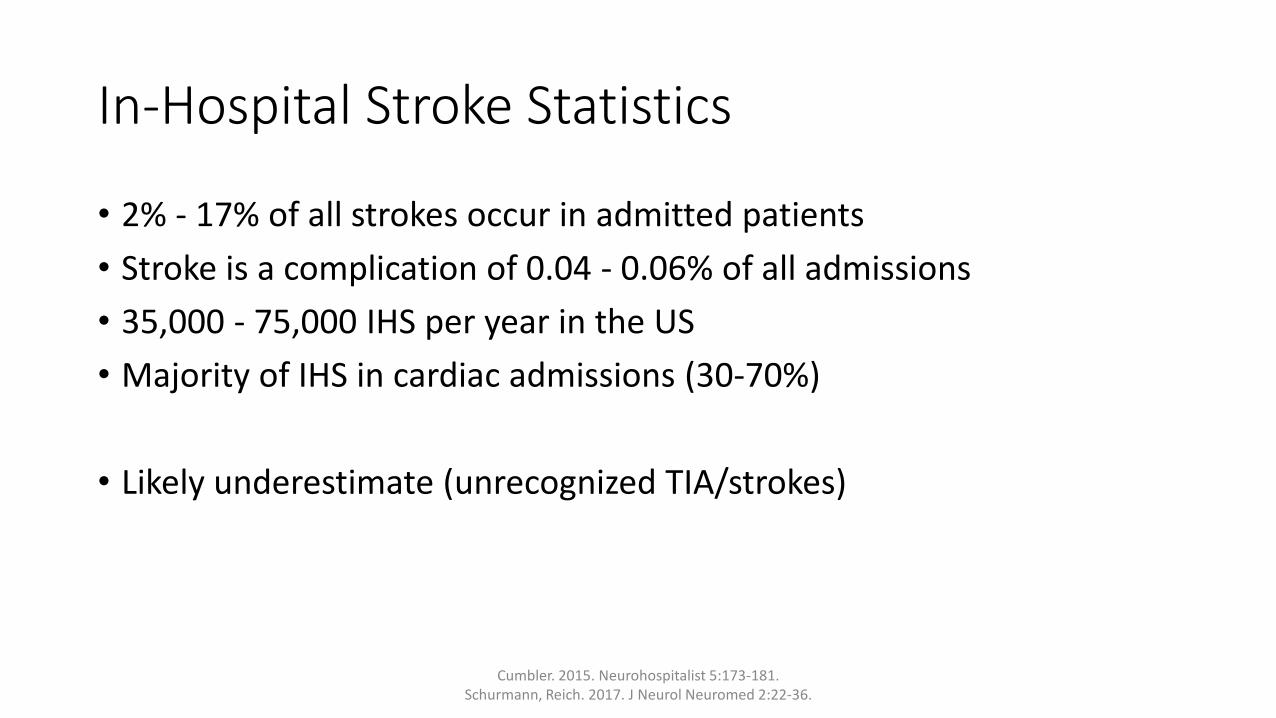
In-Hospital Stroke Statistics
• 2% - 17% of all strokes occur in admitted patients• Stroke is a complication of 0.04 - 0.06% of all admissions• 35,000 - 75,000 IHS per year in the US• Majority of IHS in cardiac admissions (30-70%)
• Likely underestimate (unrecognized TIA/strokes)
Cumbler. 2015. Neurohospitalist 5:173-181.Schurmann, Reich. 2017. J Neurol Neuromed 2:22-36.
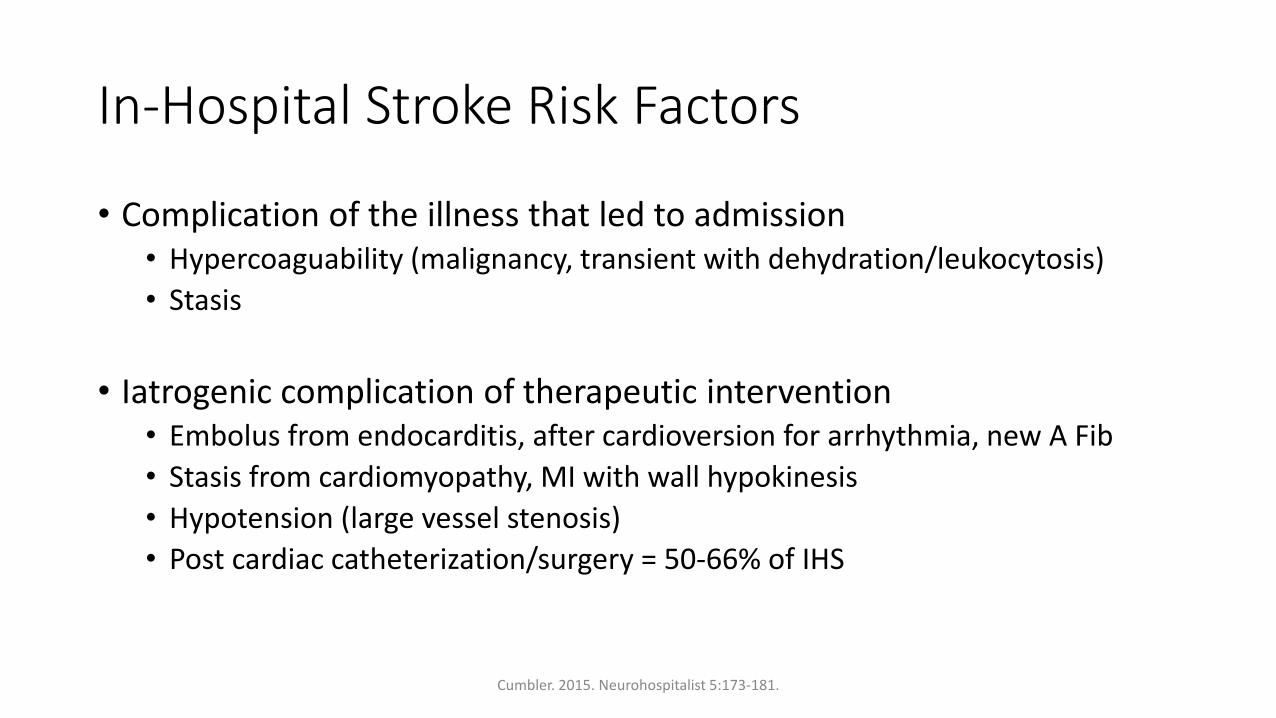
In-Hospital Stroke Risk Factors
• Complication of the illness that led to admission• Hypercoaguability (malignancy, transient with dehydration/leukocytosis)• Stasis
• Iatrogenic complication of therapeutic intervention• Embolus from endocarditis, after cardioversion for arrhythmia, new A Fib• Stasis from cardiomyopathy, MI with wall hypokinesis• Hypotension (large vessel stenosis)• Post cardiac catheterization/surgery = 50-66% of IHS
Cumbler. 2015. Neurohospitalist 5:173-181.
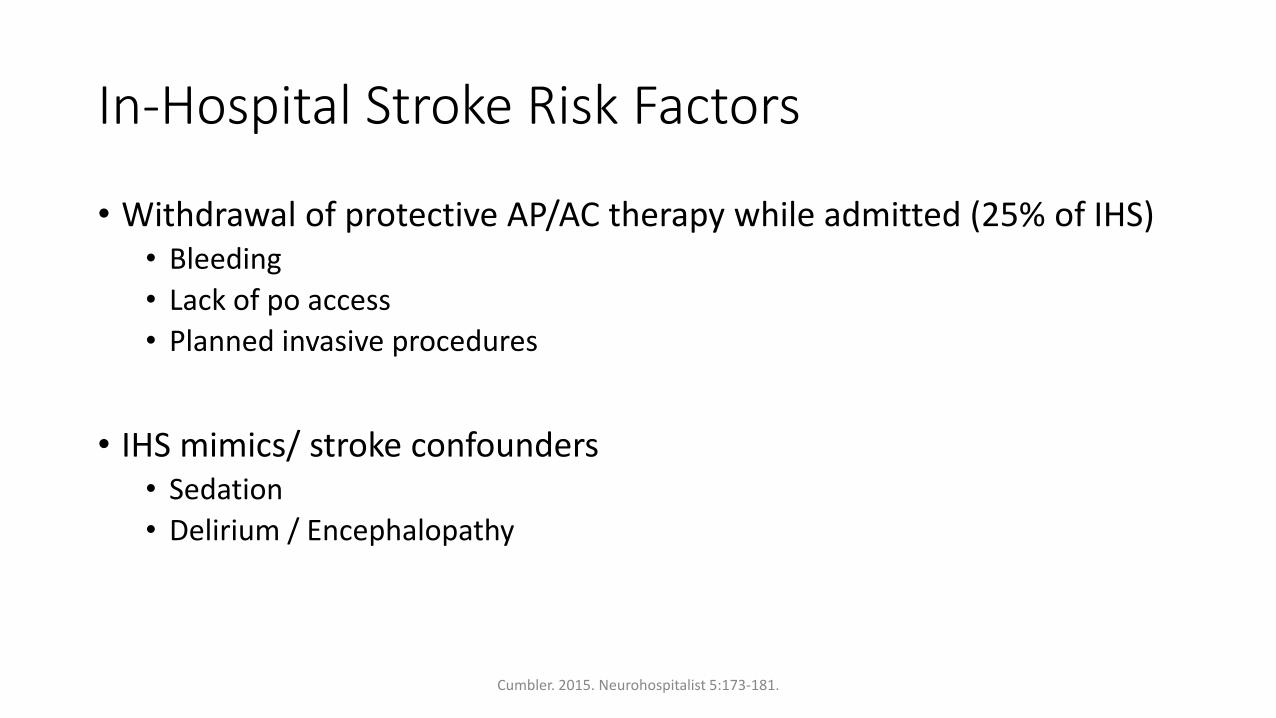
In-Hospital Stroke Risk Factors
• Withdrawal of protective AP/AC therapy while admitted (25% of IHS)• Bleeding• Lack of po access• Planned invasive procedures
• IHS mimics/ stroke confounders• Sedation• Delirium / Encephalopathy
Cumbler. 2015. Neurohospitalist 5:173-181.
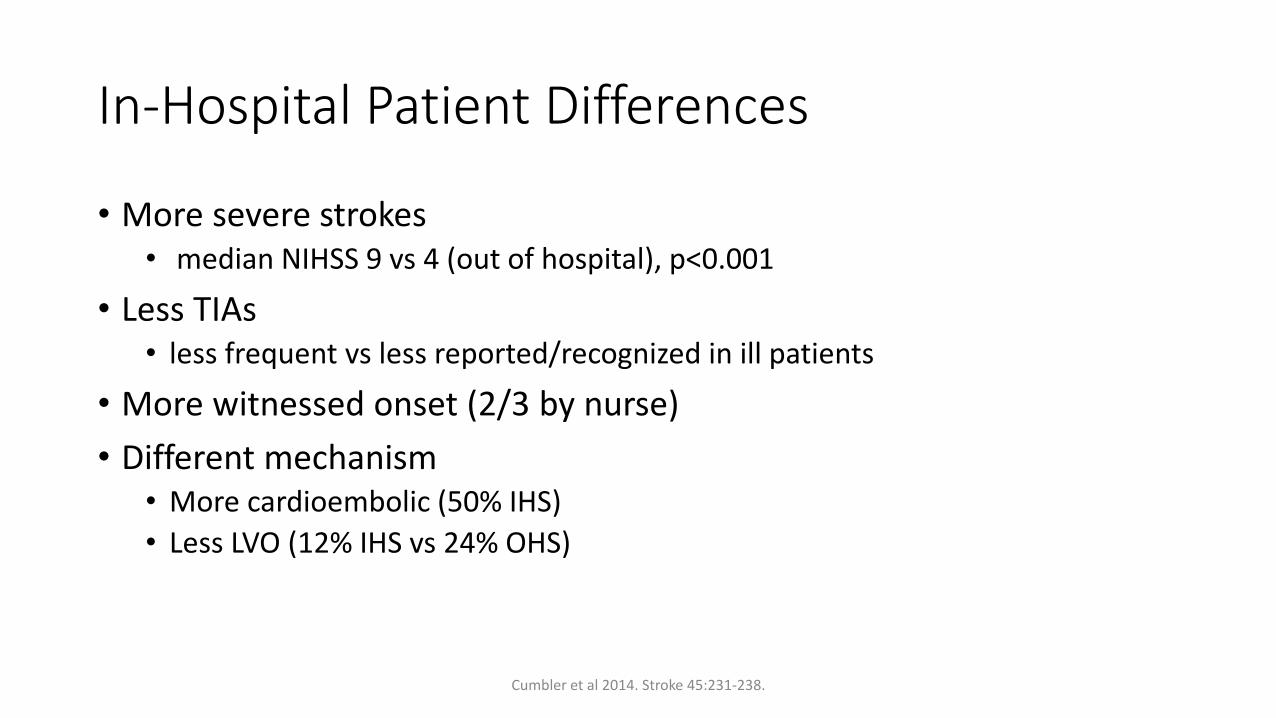
In-Hospital Patient Differences
• More severe strokes• median NIHSS 9 vs 4 (out of hospital), p<0.001
• Less TIAs • less frequent vs less reported/recognized in ill patients
• More witnessed onset (2/3 by nurse)• Different mechanism
• More cardioembolic (50% IHS)• Less LVO (12% IHS vs 24% OHS)
Cumbler et al 2014. Stroke 45:231-238.
In-Hospital Stroke Recognition
• Despite professional medical surrounding 20-35% IHS with unclear onset
• Community onset strokes 35% unclear onset (21% wakeup, 14% unknown onset)
Cumbler. 2015. Neurohospitalist 5:173-181.Schurmann, Reich. 2017. J Neurol Neuromed 2:22-36.
In-Hospital Stroke Acute Treatment
• IV tPA administered in 2.6-11% IHS
• IV tPA time from onset/LSW• GWTG: 100min average LSW to tPA, 20% received within 60 min• US National Stroke Registry: 32% IHS within 60 min (73% OHS)
• IV tPA similar safety (IHS vs OHS)• ICH 4.5 vs 5.3%• Serious bleeding 1.6 vs 1.2%
Cumbler. 2015. Neurohospitalist 5:173-181.
Delay in thrombolytic IHS
• Similar delay in thrombolytic tx for STEMI
• Delays in recognition of symptoms• Procedural sedation• Medical comorbidities, medication effects, mimics• Majority not on a neurology service/floor
• Delays in evaluation• Streamlined EMS to ED processing• Neurology access• Lack of practice/infrequency of IHS
Garberich et al. 2014. Circulation. 129:1225-1232.
In-Hospital Stroke Outcomes
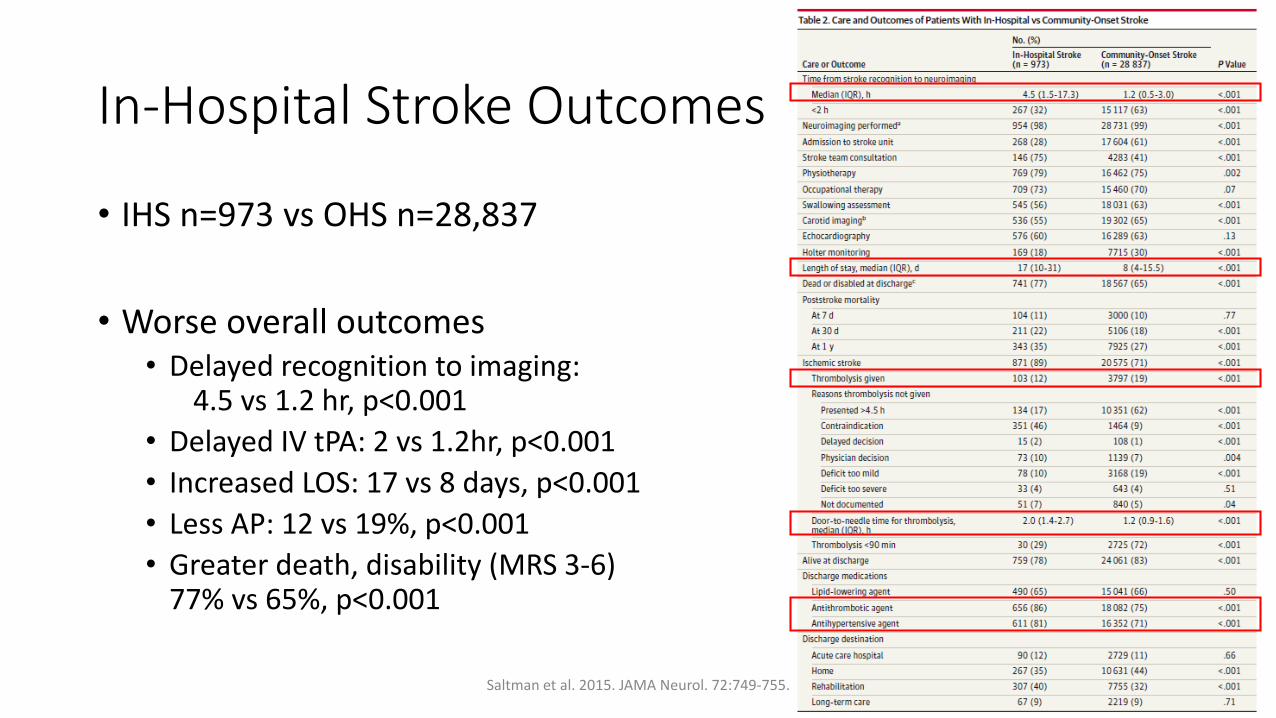
• IHS n=973 vs OHS n=28,837
• Worse overall outcomes• Delayed recognition to imaging:
4.5 vs 1.2 hr, p<0.001• Delayed IV tPA: 2 vs 1.2hr, p<0.001• Increased LOS: 17 vs 8 days, p<0.001• Less AP: 12 vs 19%, p<0.001• Greater death, disability (MRS 3-6)
77% vs 65%, p<0.001
Saltman et al. 2015. JAMA Neurol. 72:749-755.
In-Hospital Patient Outcomes
• Longer length of stay
• Greater disability on mRS
• Half as likely to return directly home
• Mortality 2-3x higher • absolute in-hospital mortality 14-19%
Cumbler. 2015. Neurohospitalist 5:173-181.
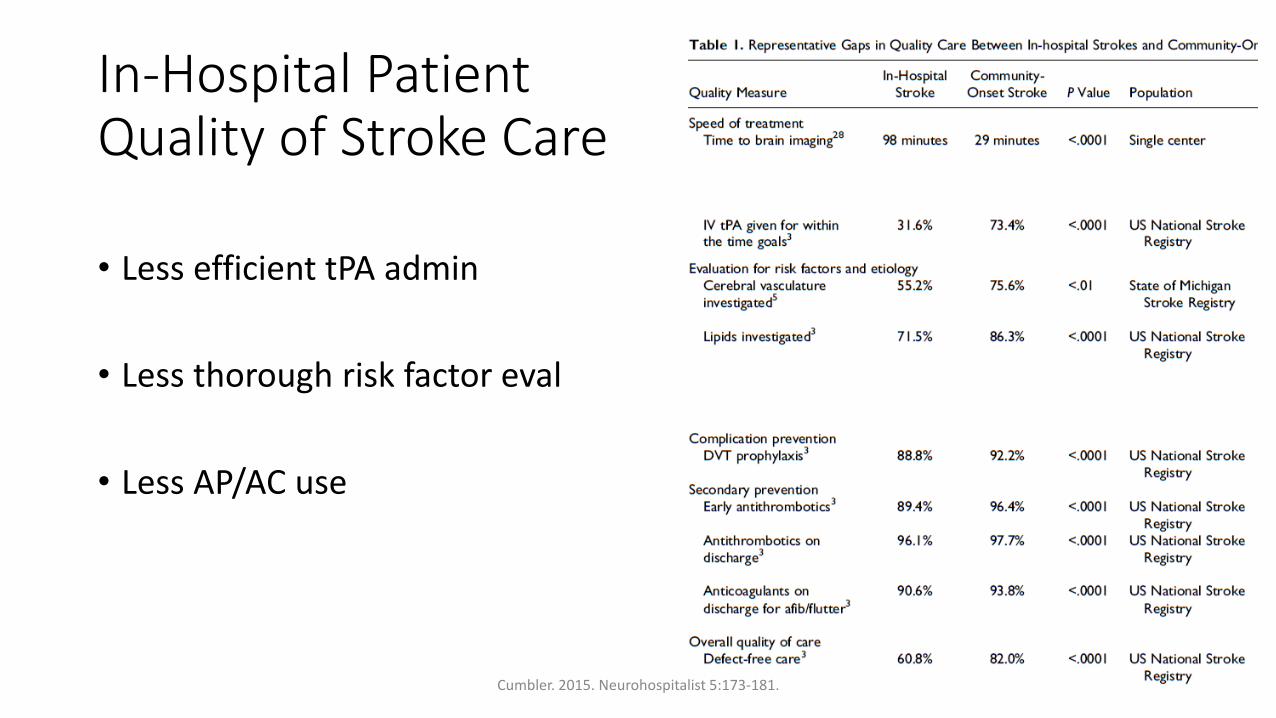
In-Hospital Patient Quality of Stroke Care
• Less efficient tPA admin
• Less thorough risk factor eval
• Less AP/AC use
Cumbler. 2015. Neurohospitalist 5:173-181.
In-Hospital Stroke Costs
• Estimated $17,500 for stroke care (average severity)
• Given yearly incidence, direct/indirect costs > $5 billion
Cumbler. 2015. Neurohospitalist 5:173-181.
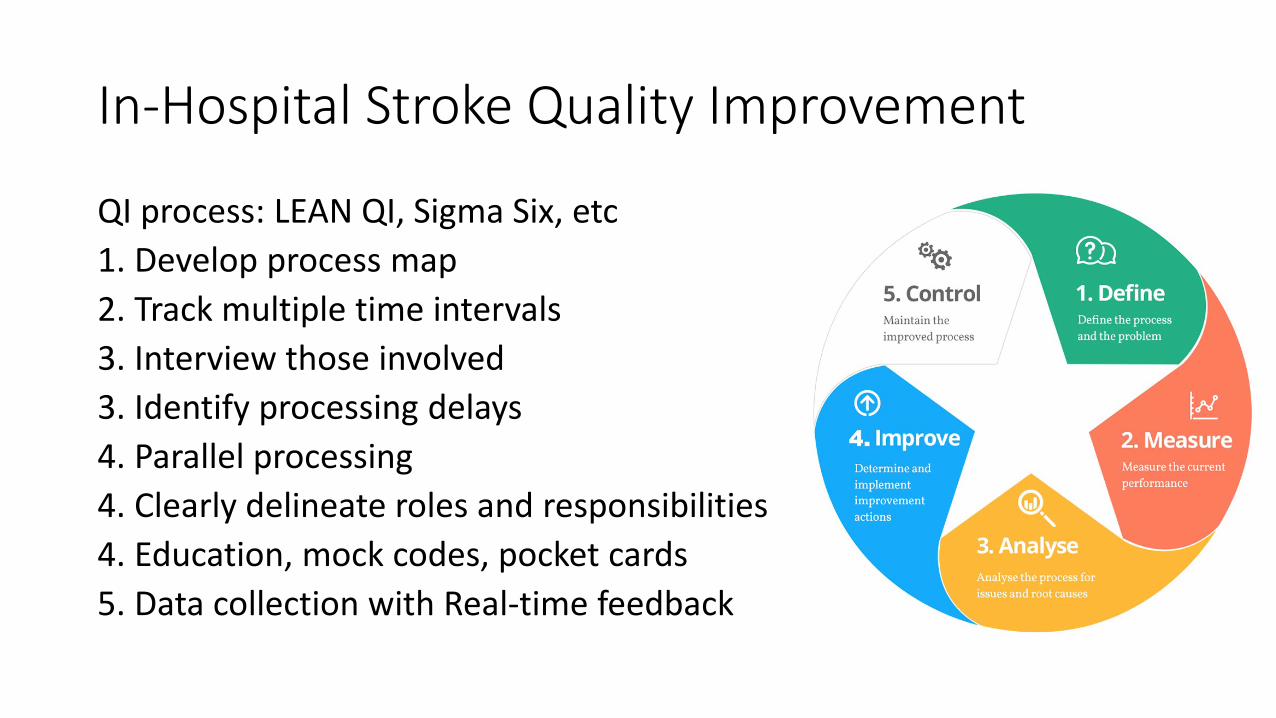
In-Hospital Stroke Quality Improvement
QI process: LEAN QI, Sigma Six, etc1. Develop process map2. Track multiple time intervals3. Interview those involved3. Identify processing delays4. Parallel processing4. Clearly delineate roles and responsibilities4. Education, mock codes, pocket cards5. Data collection with Real-time feedback
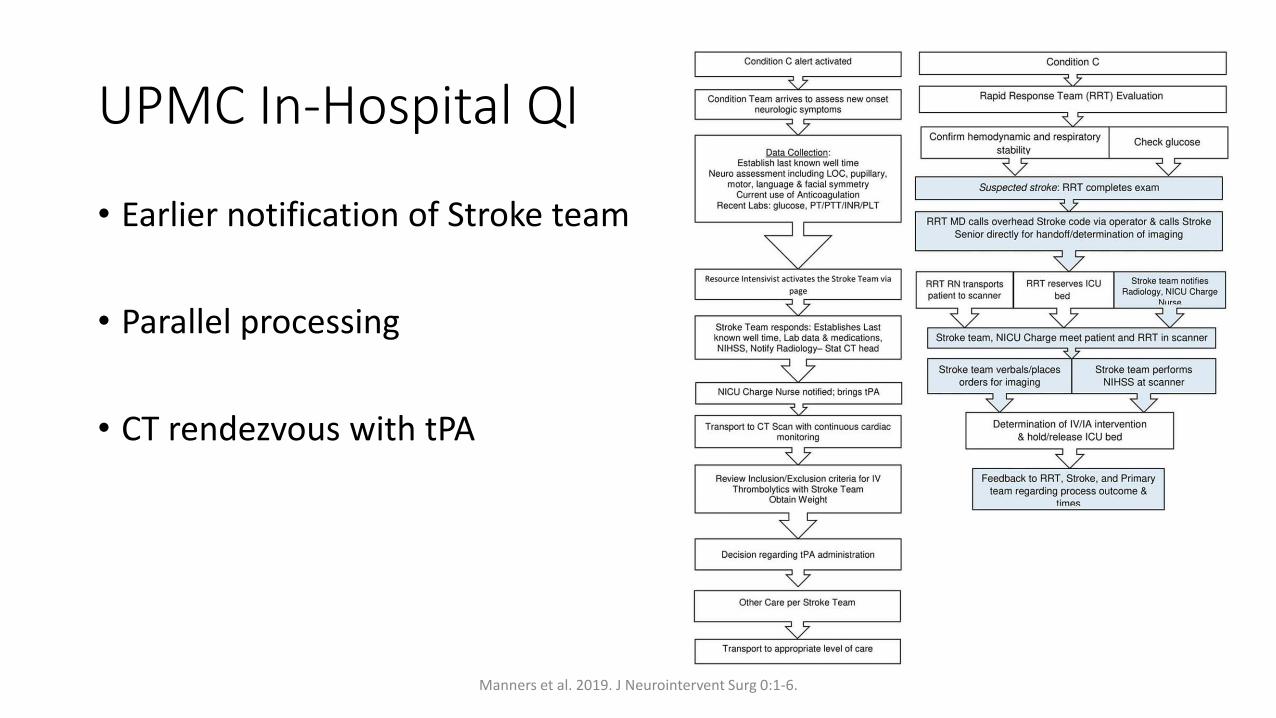
UPMC In-Hospital QI
• Earlier notification of Stroke team
• Parallel processing
• CT rendezvous with tPA
Manners et al. 2019. J Neurointervent Surg 0:1-6.
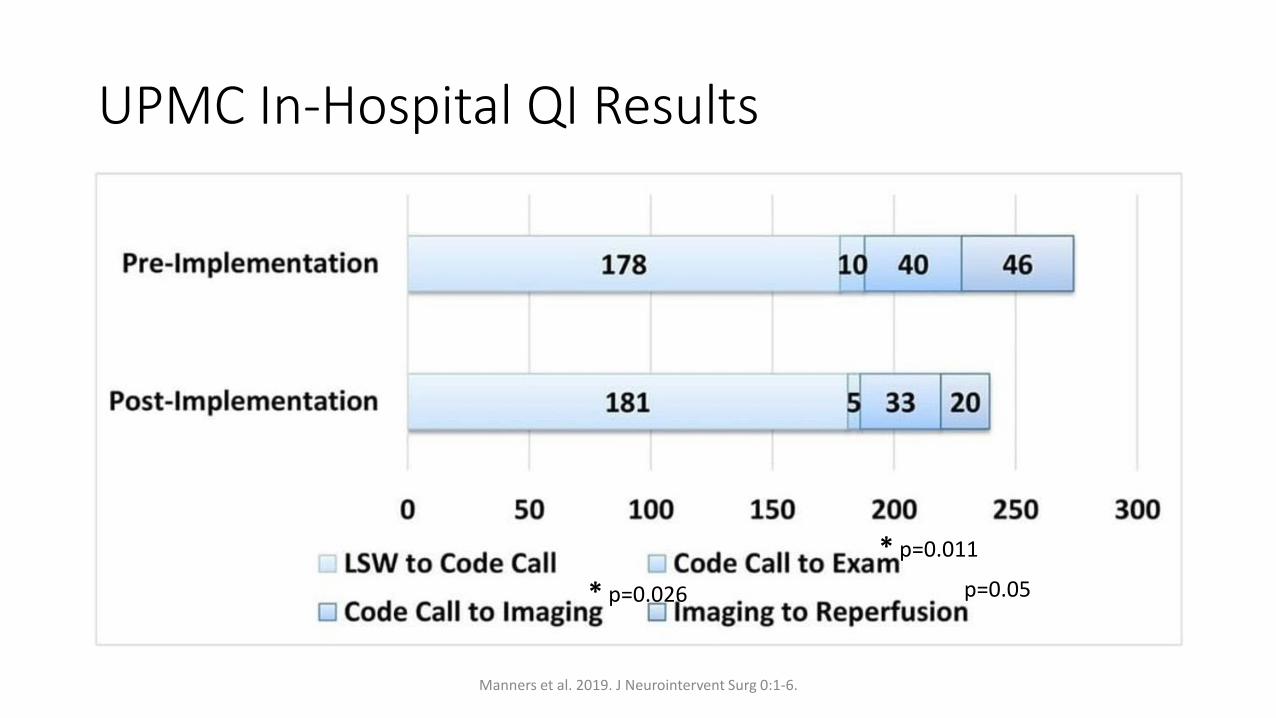
UPMC In-Hospital QI Results
Manners et al. 2019. J Neurointervent Surg 0:1-6.
* p=0.011
* p=0.026 p=0.05
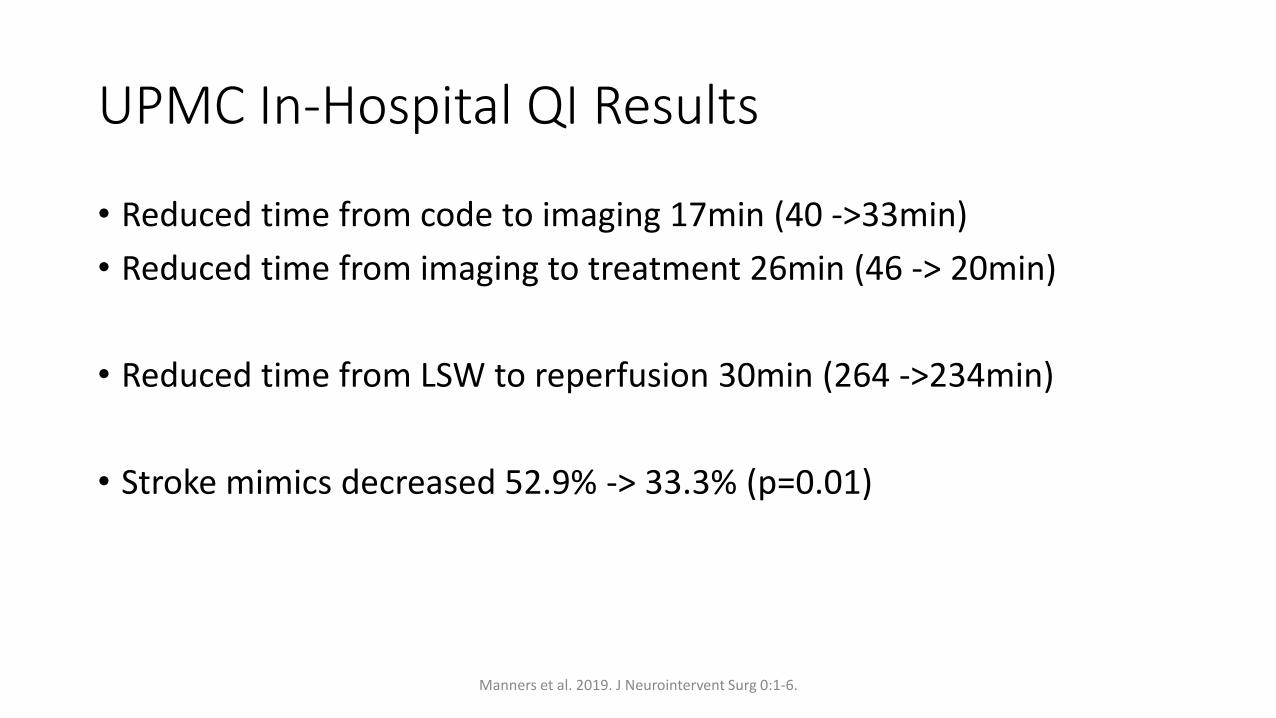
UPMC In-Hospital QI Results
• Reduced time from code to imaging 17min (40 ->33min)• Reduced time from imaging to treatment 26min (46 -> 20min)
• Reduced time from LSW to reperfusion 30min (264 ->234min)
• Stroke mimics decreased 52.9% -> 33.3% (p=0.01)
Manners et al. 2019. J Neurointervent Surg 0:1-6.
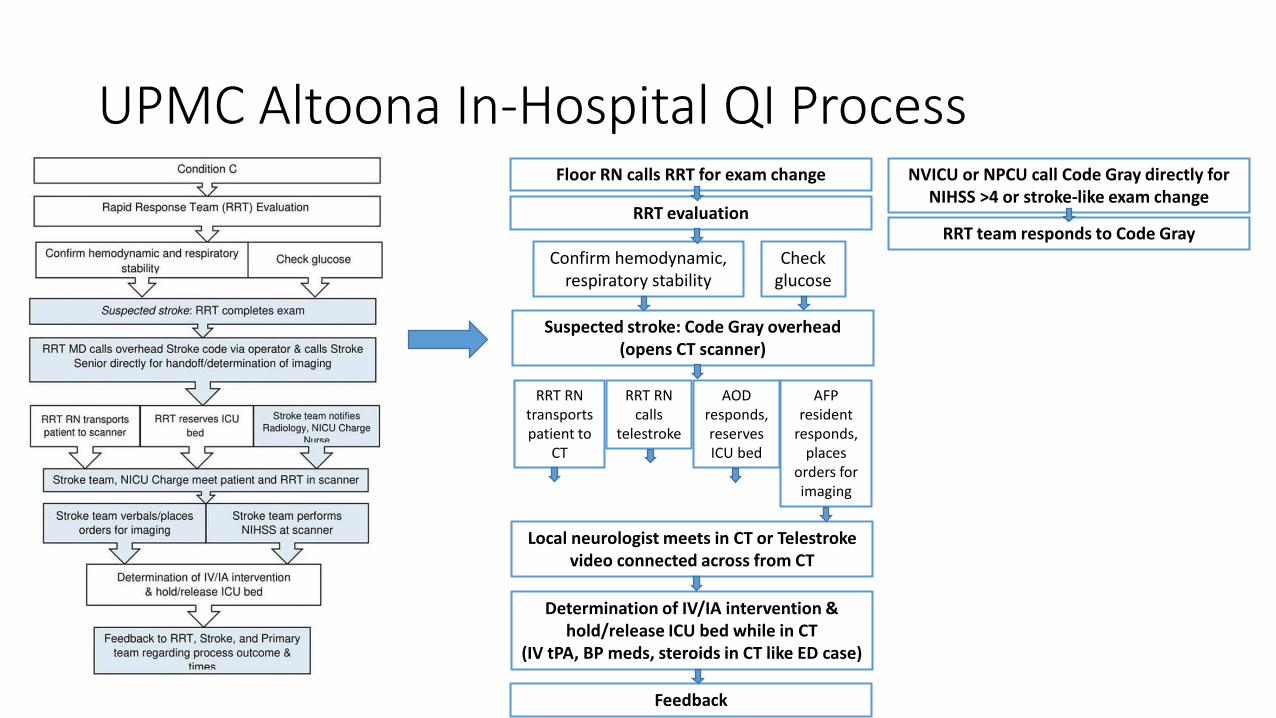
UPMC Altoona In-Hospital QI Process
RRT team responds to Code GrayConfirm hemodynamic,
respiratory stability
NVICU or NPCU call Code Gray directly for NIHSS >4 or stroke-like exam change
Check glucose
Floor RN calls RRT for exam change
RRT evaluation
Suspected stroke: Code Gray overhead (opens CT scanner)
RRT RN transports patient to
CT
RRT RN calls
telestroke
AFP resident
responds, places
orders for imaging
AOD responds, reserves ICU bed
Local neurologist meets in CT or Telestrokevideo connected across from CT
Determination of IV/IA intervention & hold/release ICU bed while in CT
(IV tPA, BP meds, steroids in CT like ED case)
Feedback
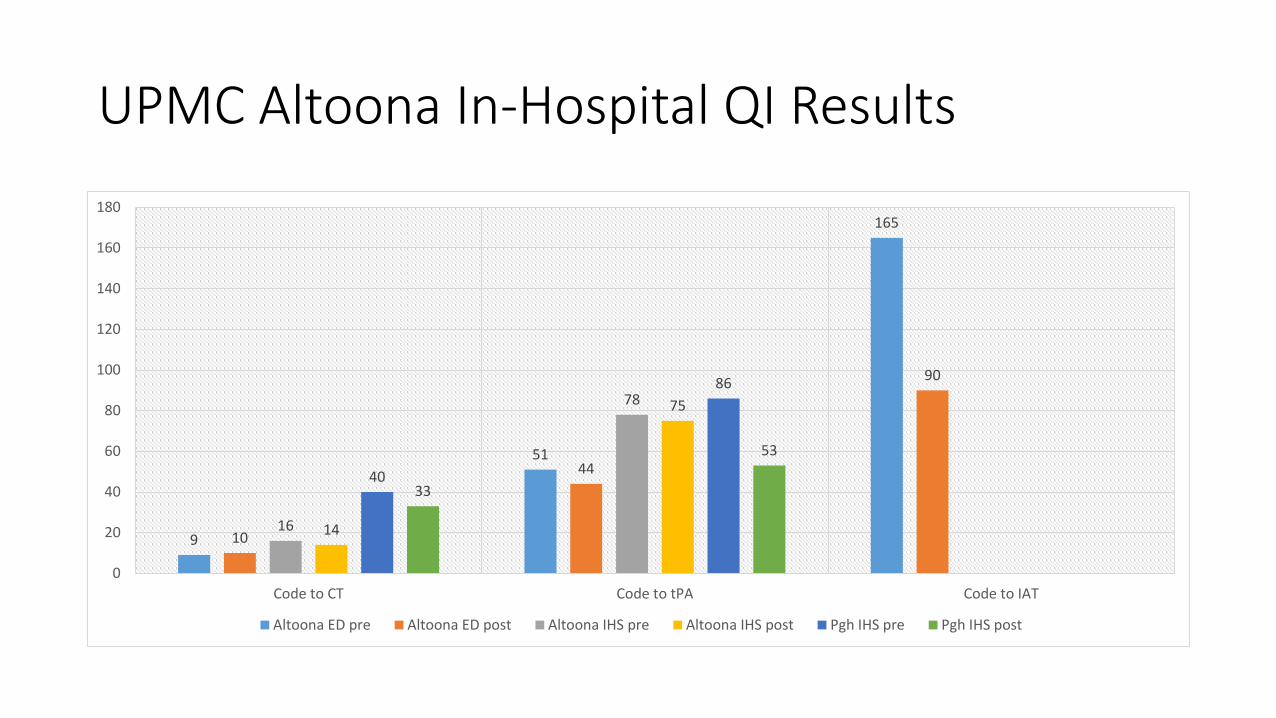
UPMC Altoona In-Hospital QI Results
9
51
165
10
44
90
16
78
14
75
40
86
33
53
0
20
40
60
80
100
120
140
160
180
Code to CT Code to tPA Code to IAT
Altoona ED pre Altoona ED post Altoona IHS pre Altoona IHS post Pgh IHS pre Pgh IHS post
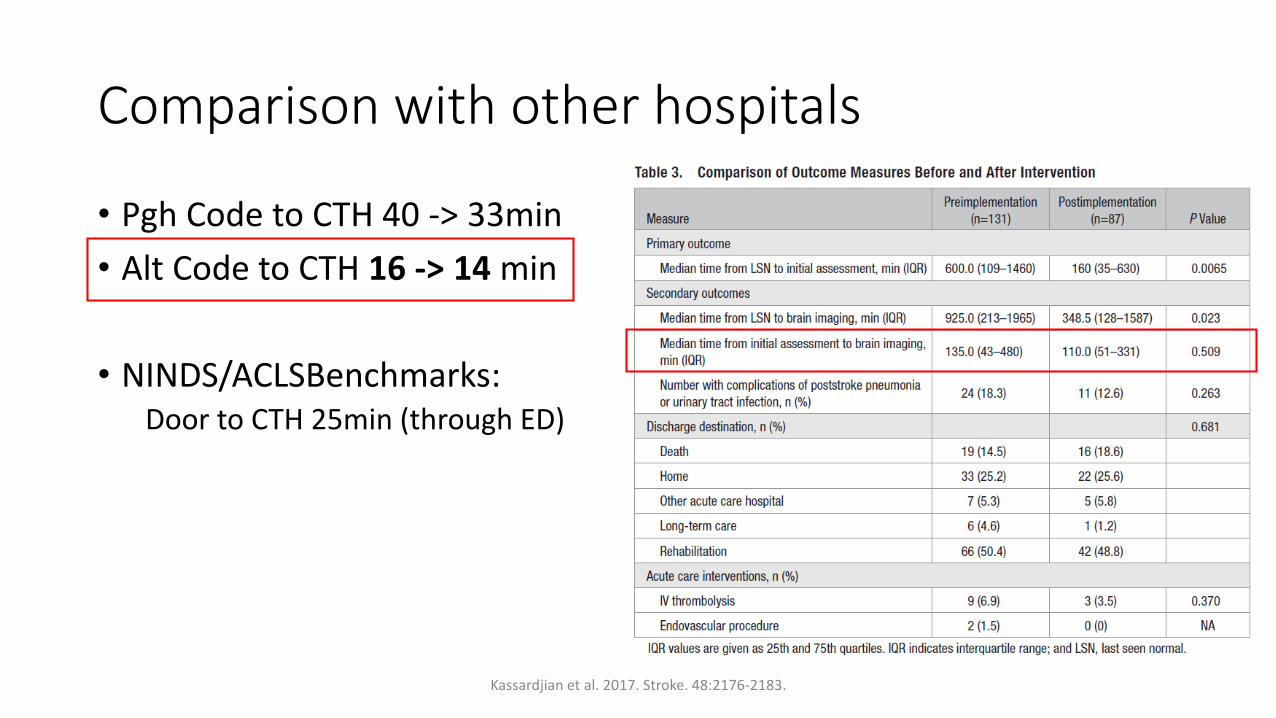
Comparison with other hospitals
• Pgh Code to CTH 40 -> 33min• Alt Code to CTH 16 -> 14 min
• NINDS/ACLSBenchmarks: Door to CTH 25min (through ED)
Kassardjian et al. 2017. Stroke. 48:2176-2183.
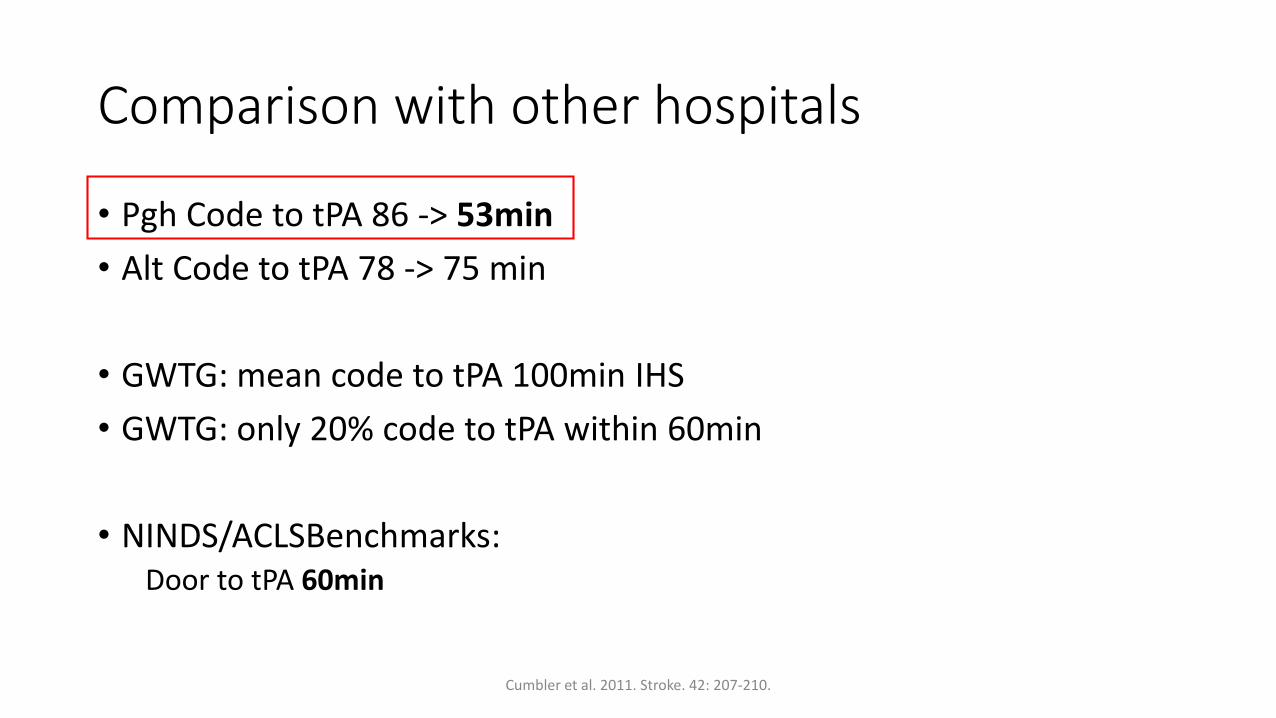
Comparison with other hospitals
• Pgh Code to tPA 86 -> 53min• Alt Code to tPA 78 -> 75 min
• GWTG: mean code to tPA 100min IHS• GWTG: only 20% code to tPA within 60min
• NINDS/ACLSBenchmarks: Door to tPA 60min
Cumbler et al. 2011. Stroke. 42: 207-210.
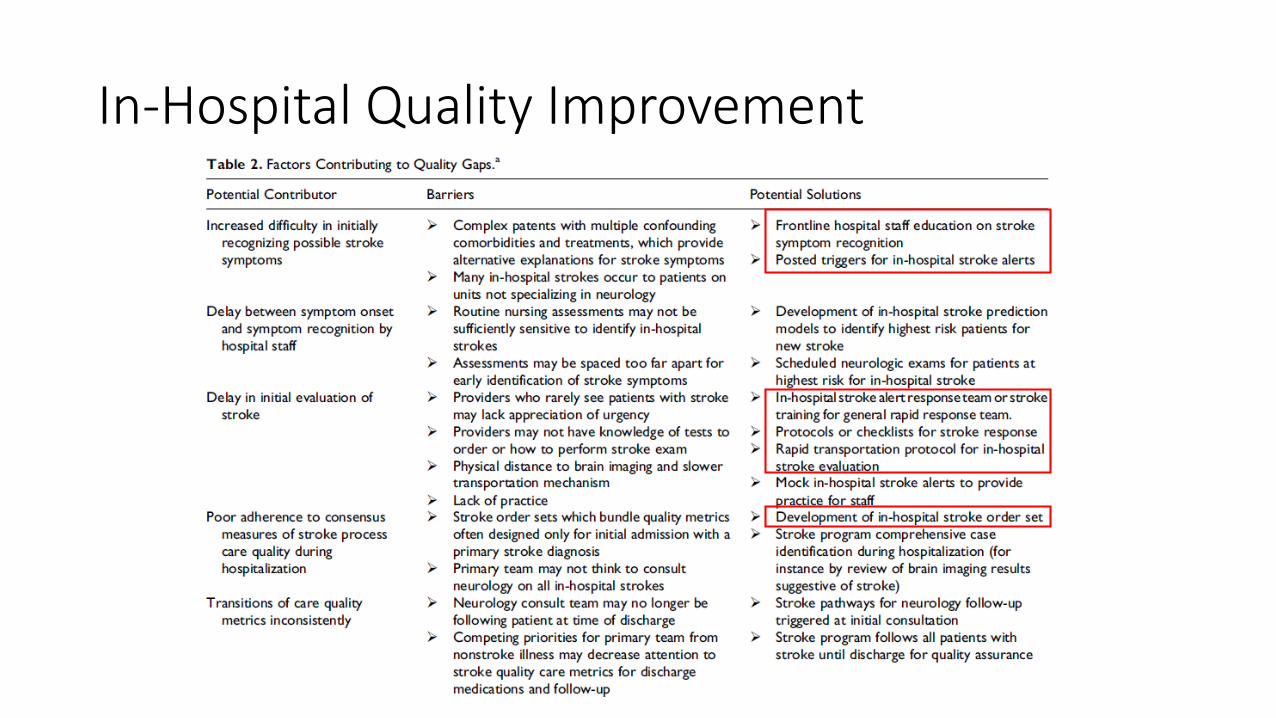
In-Hospital Quality Improvement
Cumbler. 2015. Neurohospitalist 5:173-181.
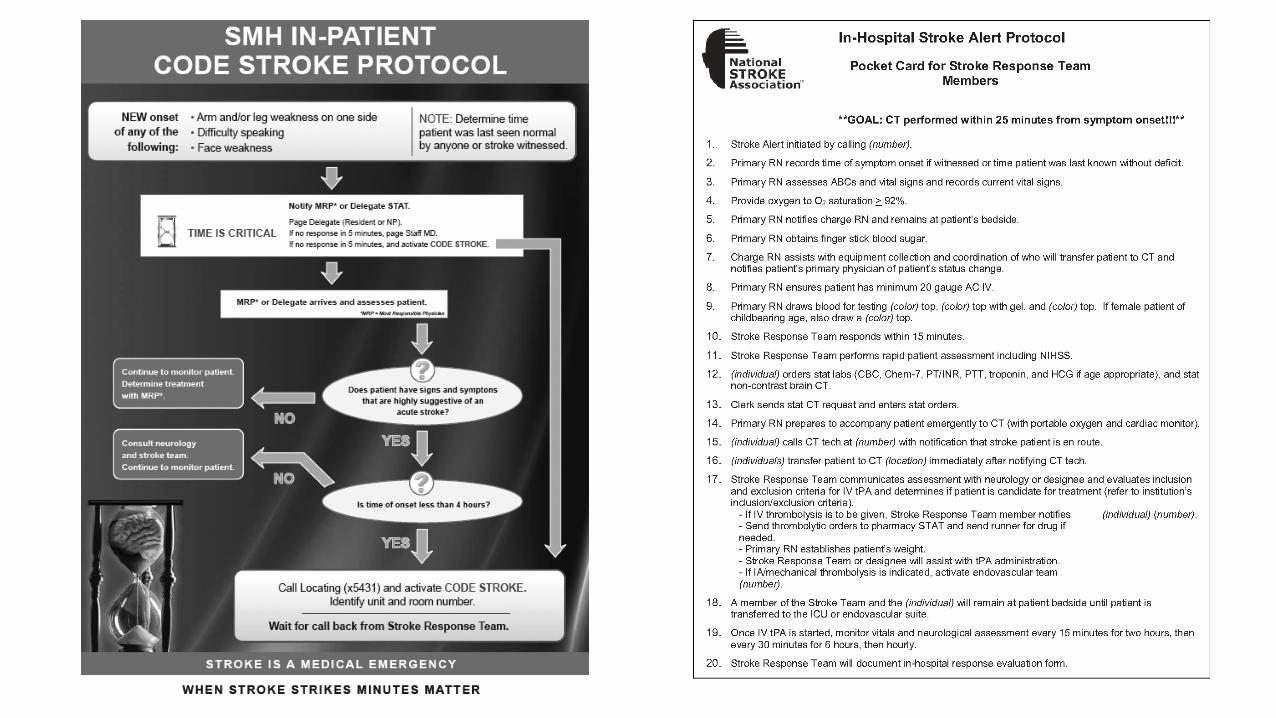
Samples
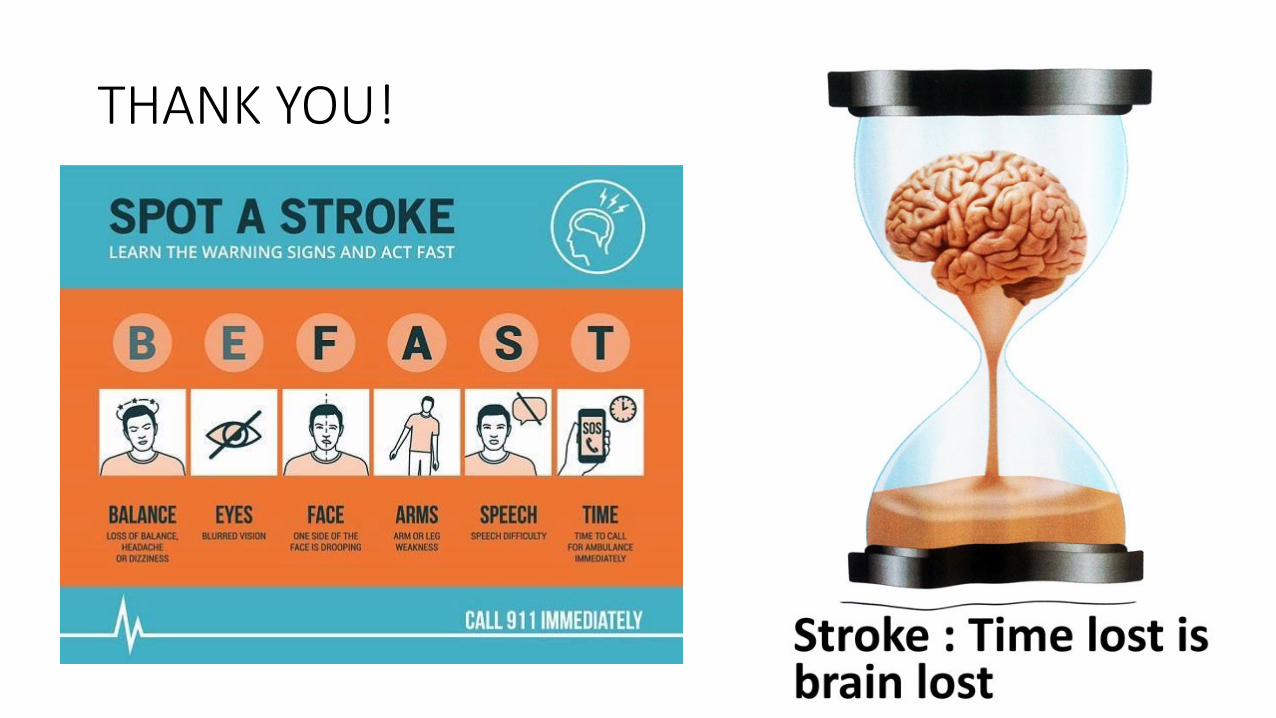
THANK YOU!
024681012141618
0
100
200
300
400
500
600
700
7AM 10AM 1PM 4PM 7PM 10PM 1AM 4AM
Num
ber o
f Str
oke
Code
s
Min
utes
Time of Day by Hour
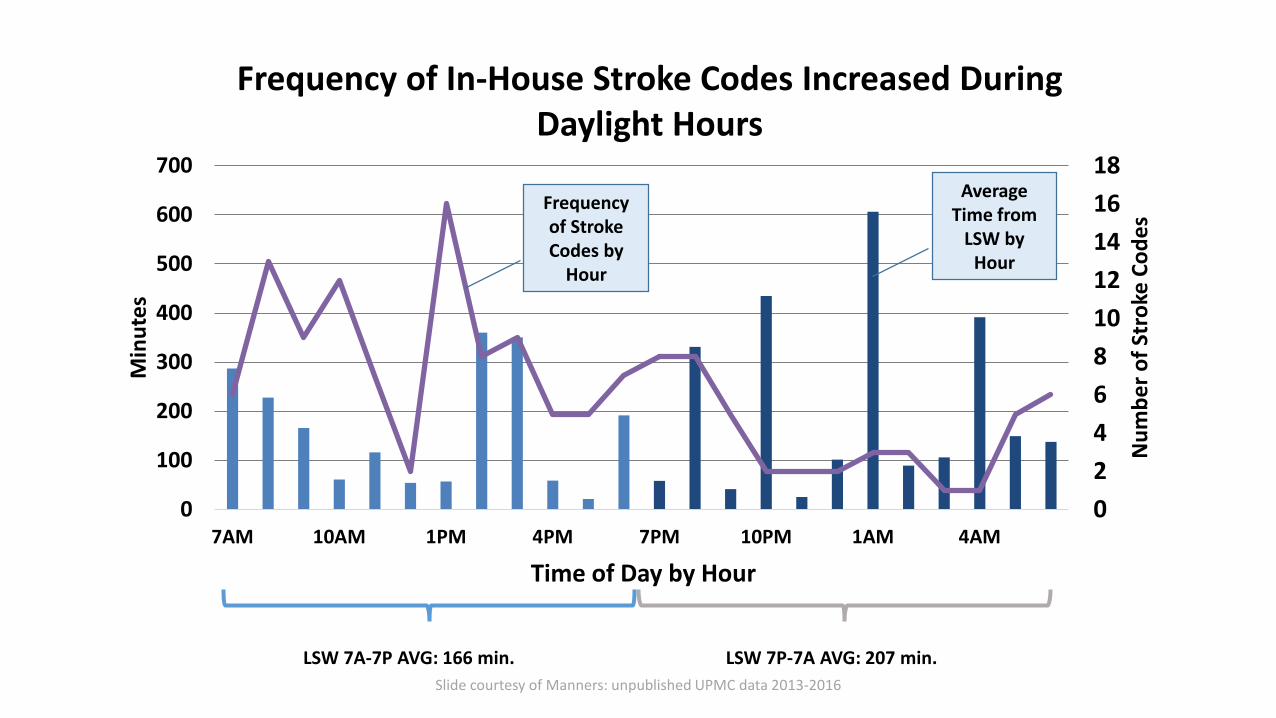
Frequency of In-House Stroke Codes Increased During Daylight Hours
LSW 7A-7P AVG: 166 min. LSW 7P-7A AVG: 207 min.
Frequency of Stroke Codes by
Hour
Average Time from
LSW by Hour
Slide courtesy of Manners: unpublished UPMC data 2013-2016