chairman unilever n.v. · daily hair care skin deodorants oral care ... - launch of rin...
TRANSCRIPT
0
Antony BurgmansAntony BurgmansChairman Unilever N.V.
3 November 2004
1
Safe harbour statement
This presentation may contain forward-looking statements, including ‘forward-looking statements’ within the meaning of the United States Private Securities Litigation Reform Act of 1995. These forward-looking statements are based upon current expectations and assumptions regarding anticipated developments and other factors affecting the Group. They are not historical facts, nor are they guarantees of future performance.Because these forward-looking statements involve risks and uncertainties, there are important factors that could cause actual results to differ materially from those expressed or implied by these forward-looking statements. Further details of potential risks and uncertainties affecting the Group are described in the Group’s filings with the London Stock Exchange, Euronext Amsterdam and the US Securities and Exchange Commission, including the Annual Report & Accounts on Form 20-F. These forward-looking statements speak only as of the date of this presentation.

2
Mission Statement
“Unilever’s mission is to add vitality to life. We meet the everyday needs for nutrition, hygiene and personal care with brands that help people feel good, look good and get more out of life.”
Agenda for today:
• Overview of Unilever• Recent performance and actions being taken• Bring this to life by featuring North America - a good, practical
illustration of:- long term strategic development- scale and portfolio reach- managing categories through brands
with some specific category and brand examples.

3
Global scale, category leadership
Savoury & DressingsSpreadsWeight managementTeaIce CreamFrozen FoodsLaundryHousehold CareDaily Hair CareSkinDeodorantsOral CarePrestige Fragrances
Western Europe
North America
Other Regions World
Source: Euromonitor, Unilever estimates
2003 Turnover €bn 16.9 9.9 16.1 42.9US$bn 19.1 11.1 18.2 48.4
Number 1
Number 2
Number 3 or less
Not present
Unsurpassed geographic presence, including:• strong, long established presence in Developing & Emerging markets:
- over a third of our total business• $ 11 billion business in North America
By category and region:• leader in more than half of the markets in which we operate• number one or two in almost 80% of them
In the Home and Personal Care categories our greatest strength is outside North America and Europe - about half of our HPC business is in the ‘developing world’.
4
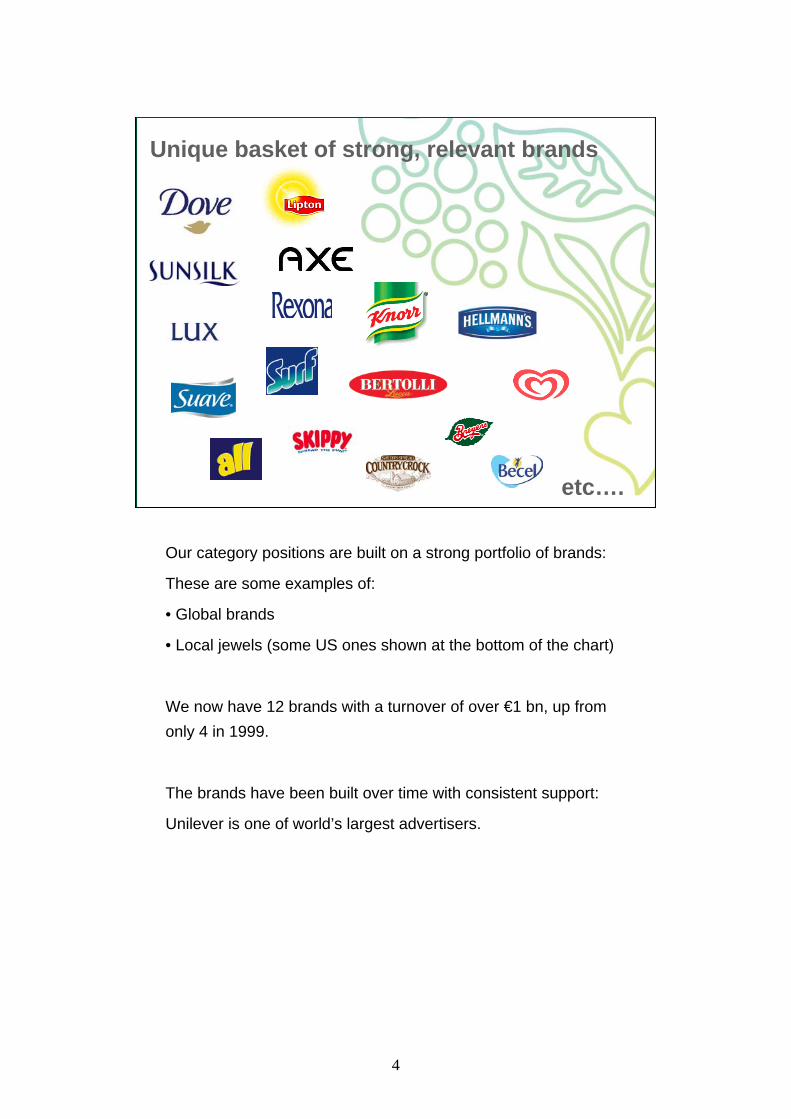
Unique basket of strong, relevant brands
etc….
Our category positions are built on a strong portfolio of brands:
These are some examples of:
• Global brands
• Local jewels (some US ones shown at the bottom of the chart)
We now have 12 brands with a turnover of over €1 bn, up from only 4 in 1999.
The brands have been built over time with consistent support:
Unilever is one of world’s largest advertisers.

5
2004 performance
Outlook now for low single digit growth in EPS
Disappointing sales
Commitment to restore top line growth
Actions being taken:
Stepping up market place aggression
Sustained innovation & activation behind focused portfolio of brands
In September, lowered 2004 outlook for EPS beia growth to low single digits:
• followed continuation of weak sales (ytd u.s.g. -0.6%) and pressure on some market positions
• included increased investment behind brands from Q4 2004
Unilever fully committed to driving shareholder value• number 1 priority is re-igniting top line growth
Action being taken:• adjusting price points where necessary• stepping up support behind key innovations• increasing media spend for a number of leading brands
6
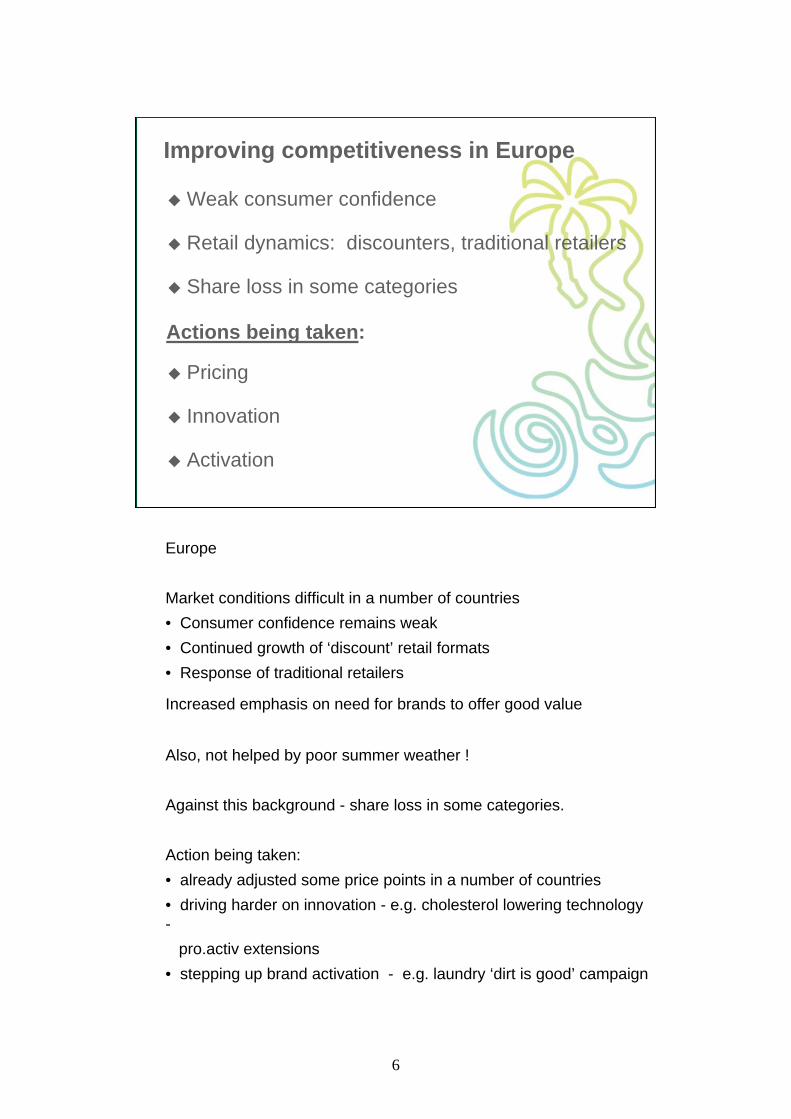
Improving competitiveness in Europe
Weak consumer confidence
Retail dynamics: discounters, traditional retailers
Share loss in some categories
Pricing
Innovation
Activation
Actions being taken:
Europe
Market conditions difficult in a number of countries• Consumer confidence remains weak• Continued growth of ‘discount’ retail formats• Response of traditional retailers
Increased emphasis on need for brands to offer good value
Also, not helped by poor summer weather !
Against this background - share loss in some categories.
Action being taken:• already adjusted some price points in a number of countries• driving harder on innovation - e.g. cholesterol lowering technology -
pro.activ extensions• stepping up brand activation - e.g. laundry ‘dirt is good’ campaign
7
Taking the initiative in Asia
India - robust defence of market positions
Japan - step up in innovation activity
Elsewhere - strong programme of innovation and activation
Asia
Large and growing market, strong positions
Step-up in activity from several competitors in laundry and hair care in a number of countries.
Actions being taken:
• In India:- price reductions already in place- launch of Rin ‘Advance’ laundry powder - superior whitening
• In Japan:- Lux Super Rich: improved formulation, packaging,
communication
• Innovations targeting large anti-dandruff shampoo segment in India, China and South East Asia
Confident that these and other initiatives will restore top-line momentum
8
Robust defence in South Latin America Laundry
1994-1996: • Competitor acquisitions
1999:• Competitor attack - pricing, innovation, A&P, etc.
Since 1999:• Unrivalled leadership maintained and secured across
the sub-region• Initial reduction in profitability, since reversed
An illustration of robust defence of a strong position
Since 1999:700 bps + increase in operating marginbusiness today has double digit operating marginscapital efficiency improved by 690 bps
A clear demonstration that this strategy creates long term value

9
North America
So now to a practical illustration - North America
A strong business built over many years

10
Unilever in North America 1993 - 2003
1993 2003Turnover
- Foods- Personal Care- Home Care
Total Foods, P Care & H Care
Professional Cleaning& Speciality Chemicals
Total turnover
Operating margin*
US$ billions
8.6
3.42.51.0
11.1
6.43.31.4
* before exceptional items and amortisation of goodwill
-
16.8%7.5%
6.9
1.7
11.1
Foods and Home and Personal Care has grown from under $7 billion to just over $11 billion.
Today:• somewhat over half is in Foods• 30% is in Personal Care• a little under 15% is in Home Care
Operating margins have more than doubled over this period to 16.8% last year - slightly more than the Unilever average
This has been achieved through strategic thrusts:• focus on categories and brands• strengthening the portfolio through acquisition• generating economies of scale• customer management as a competitive advantage

11
Focus on categories and brands -Portfolio strengthened by acquisitions
1993 1993 BreyersBreyers, Klondike, KlondikeLeadership in Ice Cream
1996 Helene Curtis1996 Helene CurtisCritical mass in Hair Care & Deo.
2000 Slim.Fast2000 Slim.FastLeadership in Weight Management
2000 Ben & Jerry’s2000 Ben & Jerry’sAdding Premium Ice Cream
2000 2000 BestfoodsBestfoodsScale in Foods, leadership in Dressings, strong Foodsolutions
Acquisitions targeted to strengthen Unilever categories or bring capabilities in fast growing adjacent categories
Most recently and by far the largest is Bestfoods.
Bestfoods transformed our Foods presence in North America and globally.
With half year results reviewed Bestfoods progress and confirmed meeting targets set out:• Cost synergy > € 1 billion• Foods momentum growth rate up by over 100 bps• Cash earnings accretive in year 1• ROIC / WACC cross-over achieved in 4th full year (mid 2004)• Bestfoods brands accretive to Unilever Foods growth• Debt paydown on plan
Bestfoods brands have grown by 3-4% on average since 2001.

12
1997 Chemicals1998 Canned meats 2001 Frozen Fish2001 Pregnancy testing2001 Prestige Cosmetics 2002 Professional Cleaning2003 Mass fragrances 2003 Oral Care2003 Dishwash
Number of brands
% of turnover in leading brands
2000 2004
113 59
78% 97%
Focus on categories and brands -Exit via disposals
Disposals have contributed to category and brand focus.
With Path to Growth, since 2000, focus on selected brands.
Number of brands down from over 100 to less than 60 in North America.
97% of the portfolio now in leading brands - compared with 78% at the start.
13
Van den BerghLiptonBestfoodsSlim.Fast
Good HumorBreyersBen & Jerry’s
* Fixed assets + working capital % turnover
LeverH. CurtisC. Ponds
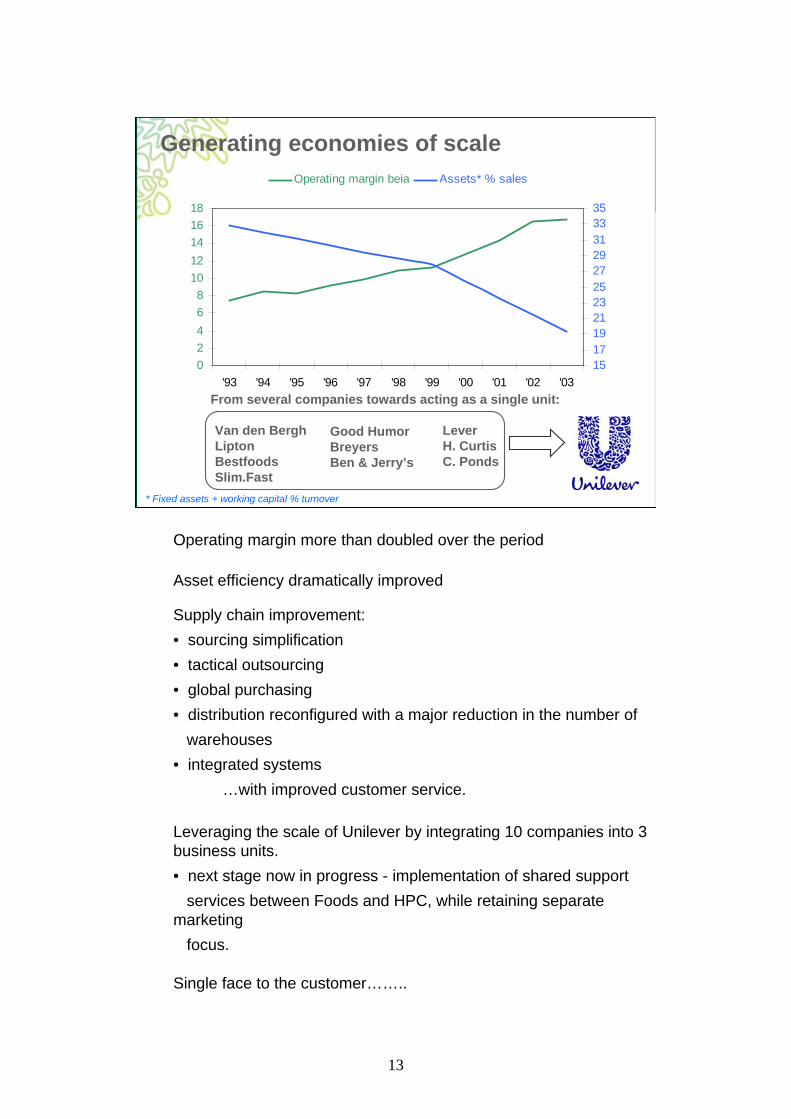
Generating economies of scale
02468
1012141618
'93 '94 '95 '96 '97 '98 '99 '00 '01 '02 '031517192123252729313335
Operating margin beia Assets* % sales
From several companies towards acting as a single unit:
Operating margin more than doubled over the period
Asset efficiency dramatically improved
Supply chain improvement: • sourcing simplification• tactical outsourcing• global purchasing• distribution reconfigured with a major reduction in the number of
warehouses• integrated systems
…with improved customer service.
Leveraging the scale of Unilever by integrating 10 companies into 3 business units. • next stage now in progress - implementation of shared support
services between Foods and HPC, while retaining separate marketing
focus.
Single face to the customer……..

14
Source: AC Nielsen
Unique store reach
Customer management as a competitive advantage
Common Agenda’s - Drive Profitable Growth
Building competitive advantage• Shopper Insight Research across the entire store• Category Vision, Category Mgmt, & Customer Marketing capabilities • Advanced Promotion Simulation and Evaluation Models• Consumption based Supply Chain models driven by CustomerPOS• Proprietary Customer Strategic Planning process & systems that
allows insight into future business conditions
Unilever can leverage this with it’s unique store reach, e.g.:- category captains in 9 categories with Wal.Mart across Foods and
HPC
• “One Unilever” face to the customer across North America• Consumer events capitalize on brand portfolio across categories• Unilever dedicated retail teams for retail excellence and execution

15
#2 # 2
Mass Home and Personal Care - USA
# 2# 1
Skin Deodorants Hair Laundry
Example of how we manage categories through leading brands in Home and Personal Care in the US.
‘Cornerstone’ brand in each category, supported by the other brands in the portfolio
The cornerstone brand:• has the consumer ‘pulling power’ with the retailer• can generate economies of scale in production, R&D, distribution
Enables the other brands to: • build on this by meeting specific consumer needs in the category• support the cornerstone brand bringing additional scale to the
category
In this way the brands combine to give leadership or #2 positions
Brands can extend across categories, provided they remain true to the brand essence - what the brand stands for.
16
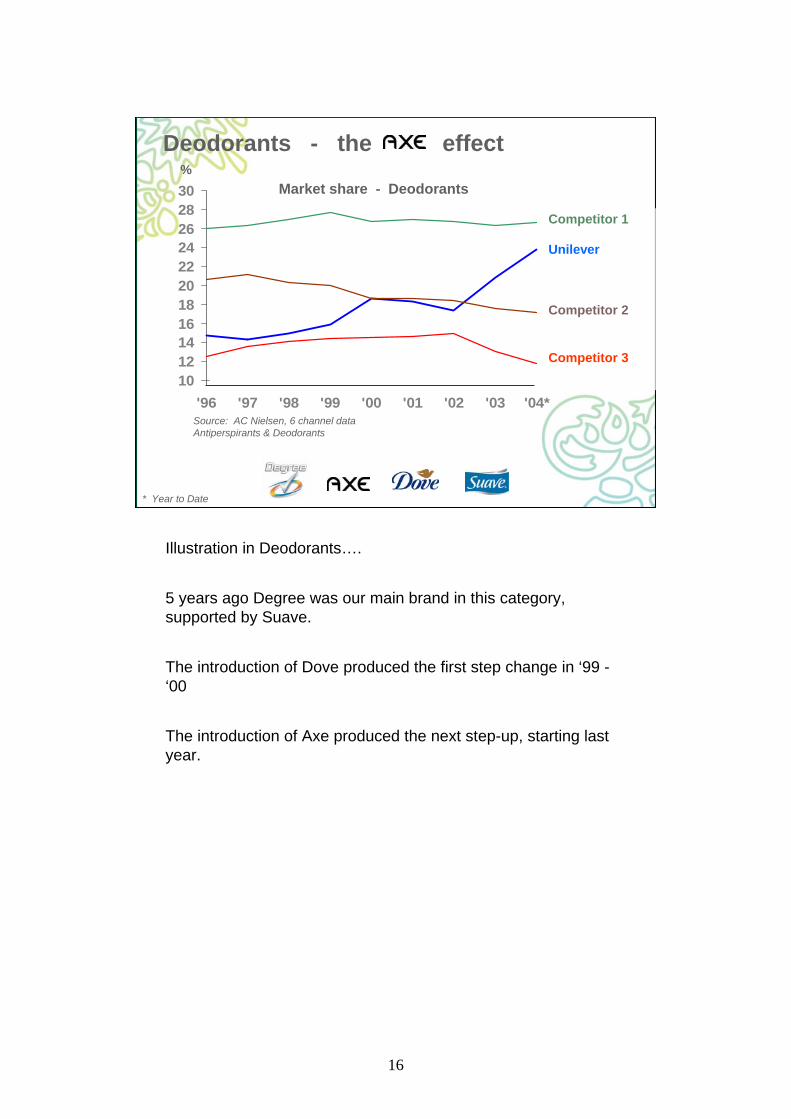
Deodorants - the effect
1012141618202224262830
'96 '97 '98 '99 '00 '01 '02 '03 '04*Source: AC Nielsen, 6 channel dataAntiperspirants & Deodorants
* Year to Date
Competitor 1
Competitor 2
Unilever
%
Competitor 3
Market share - Deodorants
Illustration in Deodorants….
5 years ago Degree was our main brand in this category, supported by Suave.
The introduction of Dove produced the first step change in ‘99 -‘00
The introduction of Axe produced the next step-up, starting last year.

17
Deodorants - the effect
AdvertisingAdvertising

18
Launched in 20034% share by value
Preeminent ‘value’ brand 21 % share by volume - #110% share by value
Hair Care - Portfolio in change
Supported by:
Total Unilever 29% share by volume - #118% share by value - # 2
Market shares of Daily Hair Care. Source: AC Nielsen 6 channel data
Different situation in Hair:
Suave is ‘cornerstone brand’: in a value positioning. 21% share by volume is almost twice the nearest brand
Dove:• proved credentials for hair in Asia then in Europe, now
strengthens category portfolio in N America • launched 2003 currently 4% share by value of daily hair care
Supported by: Thermasilk, Finesse, Salon Selectives, Aquanet.
2003/4 - a period of intense competitive activity
2003 Unilever focus was on Dove launch. Some share loss in Suave and the other, supporting brands.
2004 continue to build Dove, renewed emphasis on Suave. Shares stable for last 6 months
2005 & beyond - developing all segments with the full portfolio

19
#2# 1
Foods - USA
# 1# 1 # 1# 1 # 1Spreads Tea Ice Cream Weight
Mgmt Dressings OliveOil Savoury
…and a strong Foodsolutions business
Managing categories through brands - this time for Foods:
Shows leadership in all categories except for Savoury where we are still #2
Illustrates that:• for some categories, a single cornerstone brand can lead a
category on it’s own: e.g. Lipton in tea, Bertolli in Olive Oil• in other categories it may be necessary to have a range of brands;
e.g. Spreads.
Strong business in the Foodservice channel:• branded in it’s own right with a reputation for excellence in
providing solutions and technical support ‘back of house’• leverages the other brands (Hellmann’s, Lipton etc,) in the ‘front of
house’.
20
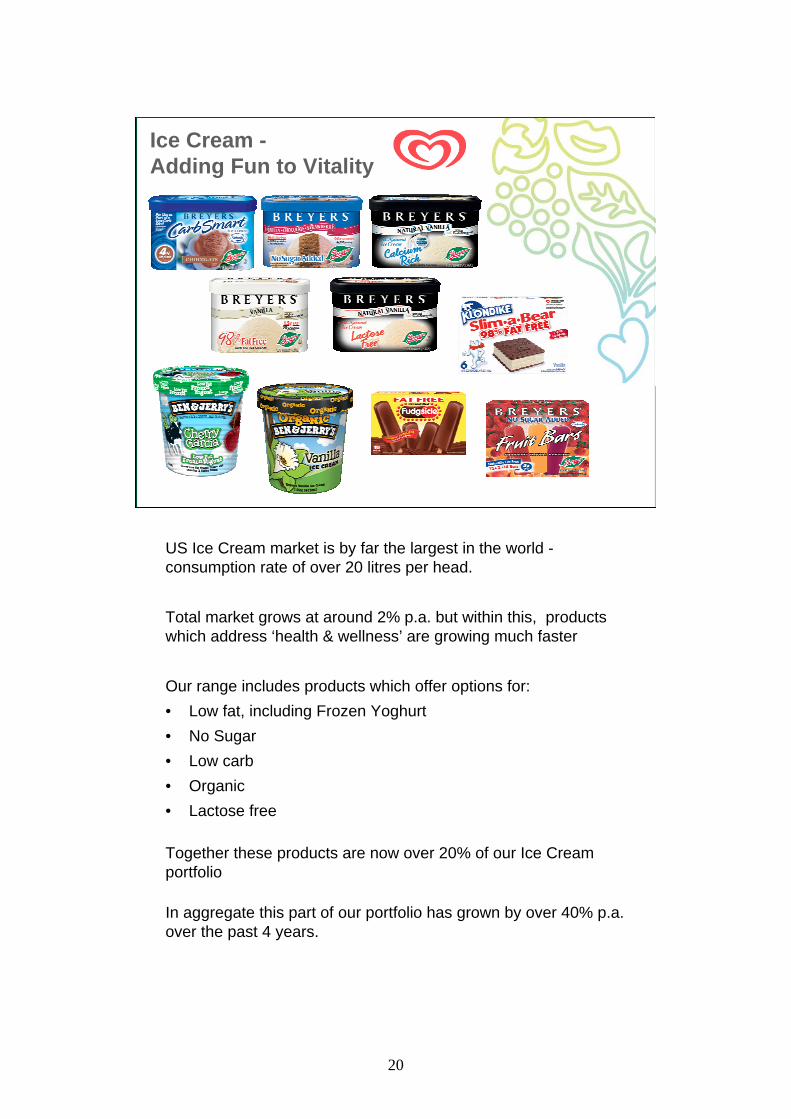
Ice Cream -Adding Fun to Vitality
US Ice Cream market is by far the largest in the world -consumption rate of over 20 litres per head.
Total market grows at around 2% p.a. but within this, products which address ‘health & wellness’ are growing much faster
Our range includes products which offer options for:• Low fat, including Frozen Yoghurt• No Sugar• Low carb• Organic • Lactose free
Together these products are now over 20% of our Ice Cream portfolio
In aggregate this part of our portfolio has grown by over 40% p.a. over the past 4 years.

21
1995 1996 1997 1998 1999 2000 2001 2002 2003 2004 Est
Sustained growth in NA Ice Cream
Underlying sales growthof 6%p.a. 1995 - 2004 ytd
Further market share gain in 2004 $0.9bn
$1.6bn
1995 2004
Annual sales
Acquisition of Ben & Jerry’s
…….this has helped our North American Ice Cream business sustain underlying sales growth averaging around 6% per year over the past 10 years, including this year.
Further market share gained in 2004 with sustained growth in profits.
22
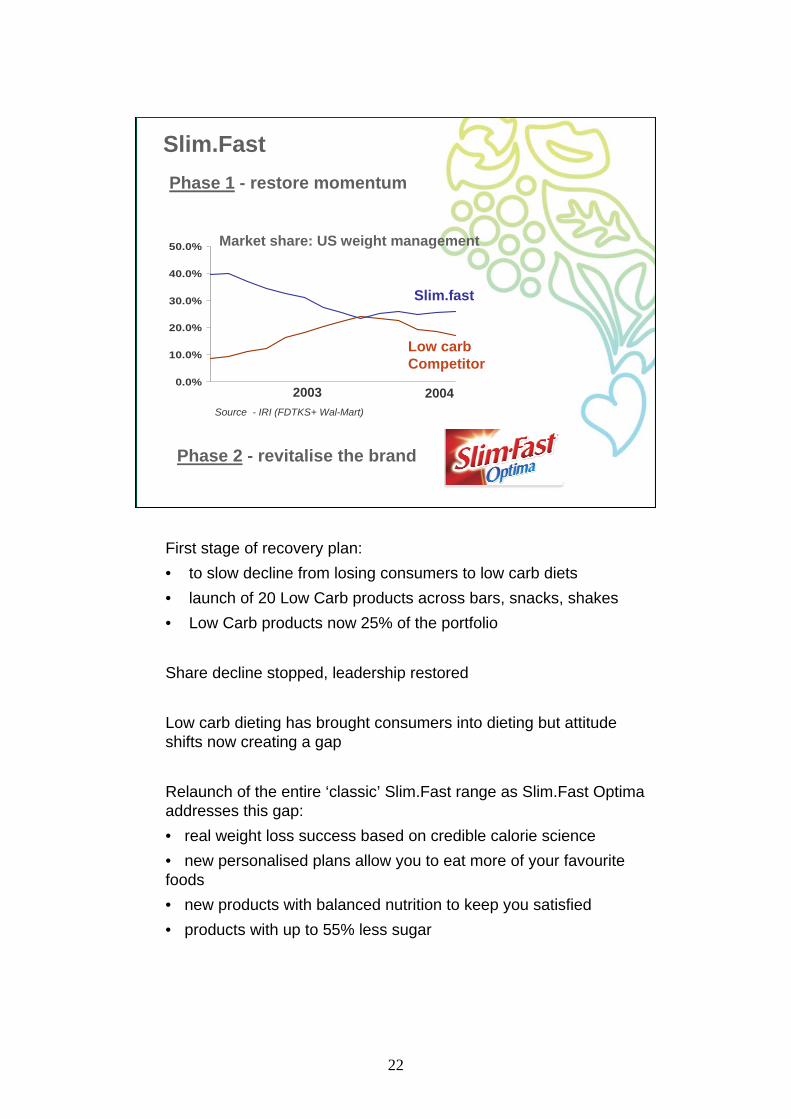
Slim.Fast
0.0%
10.0%
20.0%
30.0%
40.0%
50.0%
Phase 1 - restore momentum
Slim.fast
Low carbCompetitor
2003 2004
Market share: US weight management
Source - IRI (FDTKS+ Wal-Mart)
Phase 2 - revitalise the brand
First stage of recovery plan:• to slow decline from losing consumers to low carb diets• launch of 20 Low Carb products across bars, snacks, shakes• Low Carb products now 25% of the portfolio
Share decline stopped, leadership restored
Low carb dieting has brought consumers into dieting but attitude shifts now creating a gap
Relaunch of the entire ‘classic’ Slim.Fast range as Slim.Fast Optima addresses this gap:• real weight loss success based on credible calorie science• new personalised plans allow you to eat more of your favouritefoods• new products with balanced nutrition to keep you satisfied• products with up to 55% less sugar

23
First to market
Launch of Carb Options was about responding fast to the rising lowcarb wave:
• great tasting products at reasonable prices• where they normally shop• backed up by national brand endorsement• from a company with ‘food’ credentials
Low Carb market:• is large….estimated $3.2 billion sales for 2004• has stabilised and is actually slightly declining• is here to stay…..• Unilever has 9% share of low carb market (CarbSmart,CarbOptions,
Slim.fast low carb)
Recent research (NPD 2004 through August) shows:• 5% on Atkins / South Beach diet• 56% ‘trying to cut down on carbs’
Attention to calories, fat and sugar again on the rise
Think of them as the ‘carb savvy, multi-diet style’ consumer

24
AdvertisingAdvertising

25
88 89 90 91 92 93 94 95 96 97 98 99 00 01 02 030
5
10
15
20
25
30
35
40
45
Healthy Heart - CanadaMarket Share of margarine
AC Nielsen Markettrack
%
In the US we are clear number 1 in spreads...
… but here’s an example from Canada - Becel
• Sustained growth since launch in 1978
• #1 Margarine in Canada, 41% share
• Highest brand loyalty & penetration
• “Expert source on heart health”
- endorsement by consumers & health care professionals
• Equivalent of a $1billion brand in US

26
Summary
Business built with real scale and profitability
Strong brands driving leading category positions
Capabilities leveraged across Foods and HPC
Unilever North America
To summarise:
North America: • a strong business built over many years - $11bn turnover• clear strategic category and brand focus• lead in 7 categories, number 2 position in the other 4• exited from others via disposal • increasingly leveraging Unilever scale across categories - e.g.
customer management, supply management, finance, H.R.
27
Summary
Scale and geographic reach
Track record of control of costs and capital
Commitment to shareholder value
Determined to reDetermined to re--ignite profitable growthignite profitable growth
Unilever Global
Unilever:
Same principles extended globally…... • a business with real scale and unsurpassed geographic reach• strong portfolio of brands and categories • world class cadre of management• track record of control of costs (ca. €5 bn p.a savings vs 1999)
and capital (860 bps reduction since 1999)• commitment to shareholder value
Return to top line growth across the world is number one priority.

28
Antony BurgmansAntony BurgmansChairman Unilever N.V.
3 November 2004