ch br vmi-rempi studies in combination with mass resolved ... ·...
TRANSCRIPT

1
CH3Br VMI-REMPI studies in combination with Mass resolved REMPI;
Summary report (July, 2017) for experimental data from FORTH and analysis
from 2016.
NB: processed data and data analysis are to be found under
https://notendur.hi.is/~agust/rannsoknir/Crete/Crete-1.htm
Content list:
Topics: pages:
I. Mass Resolved (MR)-REMPI and VMI-REMPI….. 2 – 15
1) MR-REMPI……………………………………. 2 - 3
2) VMI-REMPI; one-color (CHn+, Br+, CBr+)….. 4 – 13
3) VMI-REMPI; one-color (e- detection)………… 14-18
4) VMI-REMPI; two-color (Br/Br* detection)…… 19-23
5) VMI-REMPI; two-color (CH3 detection)……. 24
Updated: 170809 / IN PROGRESS

2
I. Mass Resolved REMPI (MR-REMPI) and VMI-REMPI
1) MR-REMPI:
Results:
https://notendur.hi.is/~agust/rannsoknir/Crete16/PPT-160904-CH3Br(1).pptx
slides 7, 14-16
(see also: https://notendur.hi.is/~agust/rannsoknir/papers/jpcA114-9991-10.pdf ;
Fig. 1a):
Mass spectra and corresponding REMPI spectra have been recorded for the one-
color excitation corresponding to two-photon resonance excitation within the range
of 66000 – 80000 cm-1:
Fig 1a: Mass spectra vs. CH3
+-REMPI spectra. The mass spectra are normalized to
a common intensity for the CH3+ peaks.
Conclusions:
Strongest mass signals are observed for the CH3+ ion
(see Fig. 1a above and slides 15-16 in
https://notendur.hi.is/~agust/rannsoknir/Crete16/PPT-160904-CH3Br(1).pptx )
Relative signal contributions of other ions (I(M+)/I(CH3+)); M = CH2,CH, Br)
increases as the 2hv scale approaches the CH3+ + Br- threshold
(see Fig. 1a above and https://notendur.hi.is/~agust/rannsoknir/Crete16/PPT-160904-
CH3Br(1).pptx
slides 15-16)
82
80
78
76
74
72
70
68
66
x10
3
13 15 79 91
iBr+ (i=79,81) CBr+ (i=79,81)
CHn+
n=1,2,3
Intensity Mw / amu
E / cm-1
CH3+ + Br-
x 2.5

3
The CH3+-REMPI spectrum can be divided into two major contributions, depending
on the ion formation mechanisms (this is further supported by one-color VMI_REMPI
data below), i.e. i) „an underlying „continuum“ contribution“, gradually increasing
with 2h, which is due to one-photon photodissociation process (1hv excitation to
repulsive valence states) followed by three-photon (3hv) nonresonance ionization of
CH3 (marked as 1h) AND ii) „Rydberg state spectra contributions“ on top of (i),
which is due to initial two-photon resonance excitations to Rydberg states (marked as
2hr):
https://notendur.hi.is/~agust/rannsoknir/Crete16/PPT-160908-CH3Br(2).pptx; slide 52:
Fig. 1b
see also https://notendur.hi.is/~agust/rannsoknir/Crete16/PPT-160904-CH3Br(1).pptx
slide 5 (top)
8000078000760007400072000700006800066000
2h / [cm-1
]
[3/2]np;w
[1/2]np;w
[3/2]nd;w
[1/2]nd;w
5 6 7
0 0 02
n =
w =
5 6
02
02
0
02
02
02
02
4 6
4 5
3 2 1 3 2
3 2
3 2 1
3 2
66
01
9
68
68
4
68
46
1
72
65
5
72
97
7
75
41
87
56
86
75
90
5
78
22
5
78
37
0
78
19
3
78
40
1
79
61
0
80
64
0
80
75
8
80
67
4
80
88
12hvr:signals followingtwo-photonresonance excitation
1hv:Signals followingone-photon excitation

4
2) Results:
VMI-REMPI data were collected for one color excitation corresponding to two-
photon excitation to number of Rydberg states within the range of 66000 – 80000 cm-
1, for twelve wavenumber values in total:
https://notendur.hi.is/~agust/rannsoknir/Crete16/XLS-160912.xlsx; sheet: „Waves“:
https://notendur.hi.is/~agust/rannsoknir/Crete16/PPT-160904-CH3Br(1).pptx ; slide 17:
Fig. 2a
Images for CHn+; n = 3-0, Br+ and CBr+ ions were detected and recorded to a different
amount:
https://notendur.hi.is/~agust/rannsoknir/Crete16/XLS-160912.xlsx; sheet: „Waves“:
„Wave number“ entries in the table , below, represent measurements which were
performed (red shaded areas represent „nonexisting measurements“):
8000078000760007400072000700006800066000
2h / [cm-1
]
[3/2]np;w
[1/2]np;w
[3/2]nd;w
[1/2]nd;w
5 6 7
0 0 02
n =
w =
5 6
02
02
0
02
02
02
02
4 6
4 5
3 2 1 3 2
3 2
3 2 1
3 2
66
01
9
68
68
4
68
46
1
72
65
5
72
97
7
75
41
87
56
86
75
90
5
78
22
5
78
37
0
78
19
3
78
40
1
79
61
0
80
64
0
80
75
8
80
67
4
80
88
1
66
50
3
67
27
5
68
88
2
69
94
7
74
24
9
76
68
97
71
65

5
KER spectra and angular distributions were derived from the images:
KER spectra:
See processed data: https://notendur.hi.is/~agust/rannsoknir/Crete16/PPT-160908-
CH3Br(2).pptx; slides 2 - 64
See assignments/KER spectra predictions:
https://notendur.hi.is/~agust/rannsoknir/Crete16/PPT-160922-CH3Br(2).pptx;
Angular distributions: https://notendur.hi.is/~agust/rannsoknir/Crete16/PPT-160908-
CH3Br(2).pptx; slides 65-109
Conclusions concerning the strongest ion signals (i.e. CH3+):
CH3+ KERs (use xx KERs):
https://notendur.hi.is/~agust/rannsoknir/Crete16/PPT-160908-CH3Br(2).pptx; slide 10:
Fig. 2b
10
8
6
4
2
0
2.01.51.00.50.0
CH3+
eV
CH3++Br-
Ry(2hv/cm-1):
79610 (16.09.16)78370(12.9.16)77165(15.9.16)75905(14.9.16)74249815.9.16)72973(7.9.16)68684(14.9.16)67275(13.9.16))66503(8.9.16)
66019 (6.9.16)

6
Some of the KERs show two major contributions according to the two different ion
formation mechanisms (i) and (ii) (see (1); conclusion above) (ii) broad „underlying“
continuum feature corresponding to 2hr (ii) and (i) sharp peaks on top :
https://notendur.hi.is/~agust/rannsoknir/Crete16/PPT-160908-CH3Br(2).pptx; slide 64:
Fig 2c
2hr (ii) spectral contributions:
a) The lowest energy excitation KERs (2h = 66019– 68684 cm-1) show vibrational
structure in the 2hr spectra (ii). This is due to the following CH3+ ion formation:
https://notendur.hi.is/~agust/rannsoknir/Crete16/PPT-160908-CH3Br(2).pptx; slide 18:
Fig. 2d
i.e. two-photon resonance excitation to a Rydberg states (2hr) followed by one-
photon photodissociation via a superexcited state (1hpd) followed by one-photon
3.0
2.5
2.0
1.5
1.0
0.5
0.0
2.52.01.51.00.50.0
2hvr:signals followingtwo-photonresonance excitation
1hv:Signals followingone-photon excitation
77165 (15.09.16)
eV
Example of a1hv and 1hvr
signal contributions in a CH3 KER spectrum:
CH3Br
CH3Br** (Ry)
CH3**(v´+n) + Br/Br*:CH3**(v´) + Br/Br*
CH3+ + Br/Br*
Vibrational ladder for The OPLA vibrationalmode
Molecularexcitation
Dissoci-ation
Fragmentionization
KER
Intensity
2hvr
1hvpd
1hvi

7
ionization (1hi) of CH3**(3p2A2): (2hr+1hpd +1hi) REMPI. NB: The mechanism
involves three-photon excitation (3h = 2hr+1hpd ) prior to the dissociation.
b) The higher energy excitation KERs (2h > 68684 cm-1) involve analogous ion
formation mechanisms to that described in (a) including CH3** fragments of higher
energy than CH3**(3p2A2) as well.
(see: https://notendur.hi.is/~agust/rannsoknir/Crete16/PPT-160908-CH3Br(2).pptx;
slide 41 for the energetics AND https://notendur.hi.is/~agust/rannsoknir/Crete16/PPT-
160904-CH3Br(1).pptx ; slide 28 for CH3** states)
NB: This is further confirmed by PES (see below).
Since the two spectral contributions (i) and (ii) involve one-photon (1h) and three-
photon (3h) excitations prior to dissociation it is convenient to compare the KERs on
two different h scales, (i) where KERs, for excitation frequencies i, have been
shifted by h = h = h(0 – i) with respect to a reference spectrum (excitation
frequency 0) AND (ii) where the KERs have been shifted by 3h = 3h = 3h(0 –
i). This corresponds to a normalization of the spectra of same formation mechanism
((i) or (ii)) with respect to energy thresholds of fragment species.
(analogous comparison is performed in references
https://notendur.hi.is/~agust/rannsoknir/papers/jcp130-034304-09.pdf
(Fig6) and https://notendur.hi.is/~agust/rannsoknir/papers/pccp11-2234-09.pdf
(Fig.6)):
https://notendur.hi.is/~agust/rannsoknir/Crete16/PPT-160908-CH3Br(2).pptx;slide 53:
Thus:
Fig. 2e
https://notendur.hi.is/~agust/rannsoknir/Crete16/PPT-160908-CH3Br(2).pptx;slide 54:
Thus, for (ii):
Threshold (2)
Threshold (1)
nh
vex
cita
tio
ns
n =
1,2
,3,…
KER spectra
3
h
0
Relative intensity

8
Fig. 2f
1h (i) spectral contributions:
The highest energy excitation KERs (2h = 77165– 79610 cm-1) show sharp peaks,
particularely so for 2h = 77165 and 79610 cm-1, for which the 1h(i) ion formation
contribution is the major (2hvr(ii) minor) as can be seen from the CH3+ REMPI
spectrum (see Fig 2a above) These are due to the following ion formation:
https://notendur.hi.is/~agust/rannsoknir/Crete16/PPT-160908-CH3Br(2).pptx;slide 43:
Fig. 2g
15
1050
43
21
03
h
/eV
CH3(3p2A2)+Br
CH3(3d2E)+Br
CH3(3d2A1)+Br
CH3(4p2A2)+Br
CH3(4f2E)+Br
3h
v ex
cita
tio
ns
Thresholds
CH3(3p2A2)+Br*
CH3(3d2E)+Br*
CH3(3d2A1)+Br*
CH3(4p2A2)+Br*
CH3(4f2E)+Br*
79610 (16.09.16)78370(12.9.16)77165(15.9.16)75905(14.9.16)74249815.9.16)
72973(7.9.16)68684(14.9.16)67275(13.9.16))66503(8.9.16)66019 (6.9.16)
120
100
80
60
40
20
0
x1
03
16141210864
CH3Br
CH3 + Br/Br*
CH3
+ + Br
-
CH3Br+/CH3Br
+*
CH3** + Br/Br*
CH3
+ + Br/Br*
r/A
1h
3hi

9
i.e. one-photon photodissociation (1hph) to form CH3(v1,v2,v3,v4) + Br/Br* followed by
three-photon (two-photon for 2h = 79610 cm-1;NB) nonresonance ionization (3hi (2hi)) of
CH3(v1,v2,v3,v4): (1hpd + 3hi(2hi)) REMPI:
https://notendur.hi.is/~agust/rannsoknir/Crete16/PPT-160908-CH3Br(2).pptx;slide 55:
Fig. 2h
Vibrational analysis of the lowest energy excitation KERs (2h = 66019, 66503,
67275, 68684 cm-1) revealed vibrational spectroscopic parameters for the CH3** (3p 2A2) Rydberg state, vibrational mode 2 / OPLA:
https://notendur.hi.is/~agust/rannsoknir/Crete16/PPT-160908-CH3Br(2).pptx;slides
58, 65-68:
Fig, 2i
15
1050
2.5
2.0
1.5
1.0
0.5
0.0
h
/e
V
CH3(0000)+Br(1.5856)
CH3(0100)+Br(1.5224)(1.4394)CH3(0001)+Br
(1.2725)CH3(1000)+Br
(1.2562)CH3(0010)+Br
Thresholds
CH3(0000)+Br*(1.2016)
CH3(0100)+Br*(1.1384)CH3(0001)+Br*(1.0555)
CH3(1000)+Br*(0.8885)
CH3(0010)+Br*(0.8722)
79610 (16.09.16)78370(12.9.16)77165(15.9.16)75905(14.9.16)74249815.9.16)
72973(7.9.16)68684(14.9.16)67275(13.9.16))66503(8.9.16)66019 (6.9.16)
1h
v ex
cita
tio
ns
Hot bands, i.e. due toVibrationall „hot“ CH3Br#
D0 stands for CH3Br -> CH3 + Br
66503 cm-1
eV
10
The we parameter (1310 cm-1) is to be compared with corresponding values reported in
NIST(http://webbook.nist.gov/ ) for CH3**(3p 2A2), CH3+(X) of 1323 and 1359 +/- 7 cm-1
respectively. we for CH3(X) on the other hand is significantly lower (606 cm-1;
http://webbook.nist.gov/)
(see also: https://notendur.hi.is/~agust/rannsoknir/Crete16/PPT-160904-CH3Br(1).pptx slides
27, 28, 45)
Conclusions concerning the strongest ion signals (i.e. CH3+):
CH3+ angular distributions (xx signals):
https://notendur.hi.is/~agust/rannsoknir/Crete16/PPT-160908-CH3Br(2).pptx;slide 81:
The angular distributions of the CH3+ images, corresponding to the 2hr (ii) ion
formation mechanisms, display shapes corresponding to parallel to “neutral” (i.e.
equal parallel and perpendicular character) transitions.
https://notendur.hi.is/~agust/rannsoknir/Crete16/PPT-160908-CH3Br(2).pptx;slide 82:
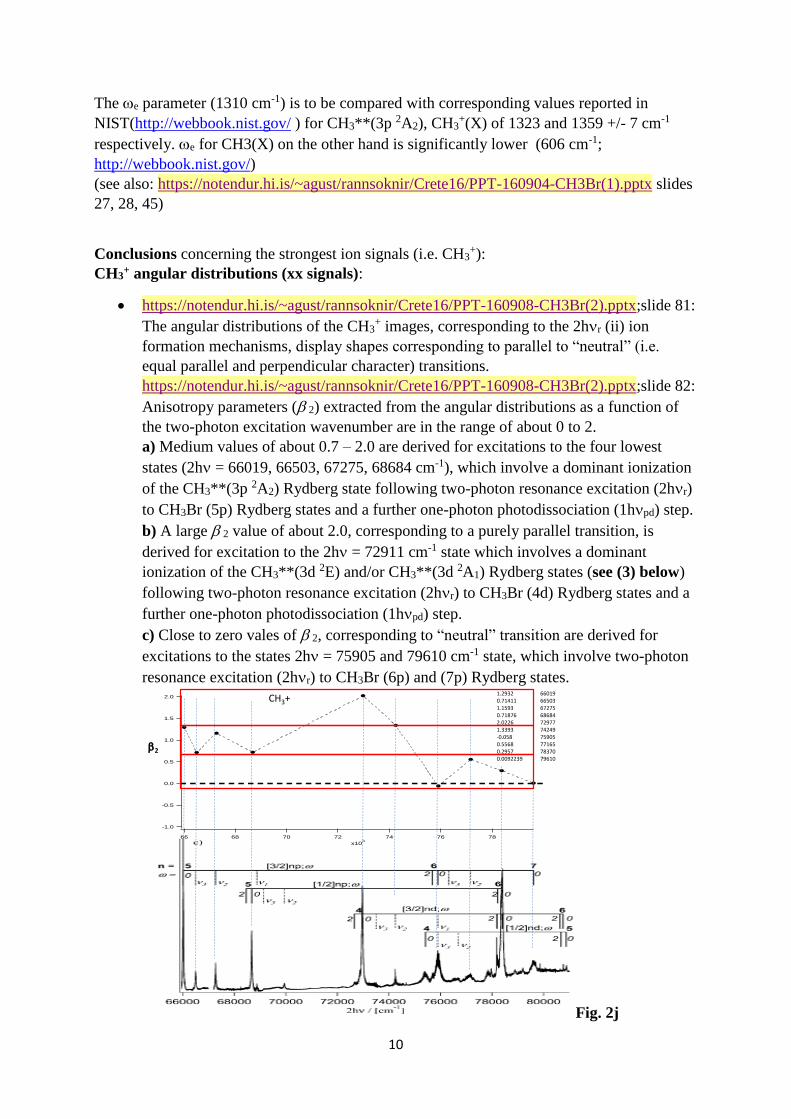
Anisotropy parameters ( 2) extracted from the angular distributions as a function of
the two-photon excitation wavenumber are in the range of about 0 to 2.
a) Medium values of about 0.7 – 2.0 are derived for excitations to the four lowest
states (2h = 66019, 66503, 67275, 68684 cm-1), which involve a dominant ionization
of the CH3**(3p 2A2) Rydberg state following two-photon resonance excitation (2hr)
to CH3Br (5p) Rydberg states and a further one-photon photodissociation (1hpd) step.
b) A large 2 value of about 2.0, corresponding to a purely parallel transition, is
derived for excitation to the 2h = 72911 cm-1 state which involves a dominant
ionization of the CH3**(3d 2E) and/or CH3**(3d 2A1) Rydberg states (see (3) below)
following two-photon resonance excitation (2hr) to CH3Br (4d) Rydberg states and a
further one-photon photodissociation (1hpd) step.
c) Close to zero vales of 2, corresponding to “neutral” transition are derived for
excitations to the states 2h = 75905 and 79610 cm-1 state, which involve two-photon
resonance excitation (2hr) to CH3Br (6p) and (7p) Rydberg states.
Fig. 2j
2.0
1.5
1.0
0.5
0.0
-0.5
-1.0
78767472706866
x103
2
1.2932 660190.71411 665031.1593 672750.71876 686842.0226 729771.3393 74249-0.058 759050.5568 771650.2957 783700.0092239 79610
CH3+

11
The sharp peaks due to the 1h(i) ion formation mechanism (see Fig. 2h) which
appear near h = 1.5 eV are due to formation of CH3(bending modes, n2,n4) + Br
(ground state) after 1hpd. Angular distributions of the CH3+ fragments are
perpendicular () in nature with 2 = -0.15 and -0.24 for 2h = 77165 cm-1 and 79610
cm-1, respectively:
https://notendur.hi.is/~agust/rannsoknir/Crete16/PPT-160908-CH3Br(2).pptx; slide 79,80:
Fig. 2k
Fig. 2l
This suggests that the major 1hpd transition corresponds to excitation of CH3Br to the
repulsive state 3Q1 and/or to the 1Q1 state (both of which are perpendicular transitions)
followed by a dissociation on the diabatic curves to form CH3(bending modes) + Br:
https://notendur.hi.is/agust/rannsoknir/papers/pccp1-747-00.pdf
3.5
3.0
2.5
2.0
1.5
1.0
0.5
150100500
3.0
2.5
2.0
1.5
1.0
0.5
0.0
2.52.01.51.00.50.0 eV
q
2 = 0.5568
2 = 0.89093
2 = -0.14974
2 = 1.0978
2 = 1.5678
Ry(2hv/cm-1):77165(15.9.16)
XZ
CH3+
3.5
3.0
2.5
2.0
1.5
1.0
150100500
8
6
4
2
0
2.52.01.51.00.50.0eV
q
2 = 0.0092239
2 = 1.8876
2 = 1.4666
2 = -0.23585
2 = 1.4741
Ry(2hv/cm-1):79610(16.9.16)
XZ
CH3+

12
The sharp peaks due to the 1h(i) ion formation mechanism (see Fig. 2h) which
appear near h = 1.26 eV are due to formation of CH3(stretching modes, 1,3) + Br
(ground state) after 1hpd. Angular distributions of the CH3+ fragments are parallel ()
in nature (see Figs, 2k and 2l above) with 2 = +0.89 and +1.47 for 2h = 77165 cm-1
and 79610 cm-1, respectively. This suggests that the major 1hpd transition
corresponds to excitation of CH3Br to the repulsive state 3Q0 followed by a
dissociation on the adiabatic curves to form CH3(stretch modes) + Br:
https://notendur.hi.is/agust/rannsoknir/papers/pccp1-747-00.pdf
The sharp peaks due to the 1h(i) ion formation mechanism (see Fig. 2h) which
appear near h = 1.14 eV are due to formation of CH3(bending modes, 2) + Br* (SO
excited state) after 1hpd. Angular distributions of the CH3+ fragments are almost
purely parallel () in nature (see Fig. 2l above) with 2 = +1..89 for 2h = 79610 cm-1.
This suggests that the major 1hpd transition corresponds to excitation of CH3Br to the
repulsive state 3Q0 followed by a dissociation on the diabatic curves to form
CH3(bending mode) + Br*:
https://notendur.hi.is/agust/rannsoknir/papers/pccp1-747-00.pdf
Conclusions concerning the Br+ ion signals
Br+ KERs (use xx KERs):
https://notendur.hi.is/~agust/rannsoknir/Crete16/PPT-160908-CH3Br(2).pptx; slide 28:
Fig. 2m
The KER of 2h = 79610 show two major contributions according to the two different
ion formation mechanisms (i) and (ii) (see (1); conclusion above) (ii) broad
„underlying“ continuum feature corresponding to 2hr (ii) and (i) sharp peak on top.
(Need to figure out what transition the sharp peak corresponds to)
https://notendur.hi.is/~agust/rannsoknir/Crete16/PPT-160921-CH3Br(3).pptx; slides 38-40
Likely formation mechanisms corresponding to 2hr (ii) are:
a) (2hr + 1hpd) to form CH3 + Br**(Rydberg states) followed by 1hi for Br**,
which requires 4 photons in total, (fewest number of h; MOST LIKELY)
4
3
2
1
0
2.52.01.51.00.50.0
79Br+ Ry(2hv/cm-1):
79610(16.9.16)
78370(12.9.16)
77165(15.9.16)
75905(14.9.16)
72977(7.9.16)
68684(14.9.16)67273 (13.9.16)
66019 (6.9.16)
CH3+
+ Br-

13
b) (2hr,pd) to form CH3 + Br/Br* followed by 3hi of Br/Br*, which requires 5
photons in total OR
c) (2hr + 1hpd) to form CH3** + Br/Br* followed by 3hi of Br/ Br*, which
requires 6 photons in total.
Fig. 2n
Clear two components, 1) low KER and 2) high KER are observed in the 2h =
77165, 78339 and 79610 cm-1 (see Fig.2m). Most likely the low KER component is
the ion formation channel (a) (Fig. 2n) whereas the high energy KER component is the
ion formation channel (b) (Arnar will check)
https://notendur.hi.is/~agust/rannsoknir/Crete16/PPT-160908-CH3Br(2).pptx; slide 115:
Fig. 2p
CH3 + Br*
CH3 + Br
b)
a & c) CH3** + Br*CH3** + Br
CH3** + Br**
CH3 + Br+/4 hv total
(CH3** + Br+/6hv total)
CH3 + Br+/5 hv total
b)
CH3 + Br**(Ry)
2hr
ion formationmechanisms
(CH3 + Br+/4hv total)
a)c)
1.0
0.8
0.6
0.4
0.2
0.0
2.52.01.51.00.50.0
Ry(2hv/cm-1):77165(15.9.16)
CH3+
+ Br-
eV
(a)2hr+1hpd
(b)2hr,pd
Ca. Threshold for (b)(?):Ca. Thresholdfor (a)(?):

14
3) Results:
VMI-REMPI data were collected for one color excitation corresponding to two-
photon excitation to number of Rydberg states within the range of 66000 – 80000 cm-1
and electron detection, for ten wavenumber values in total:
https://notendur.hi.is/~agust/rannsoknir/Crete16/XLS-160912.xlsx; sheet: „Waves“:
https://notendur.hi.is/~agust/rannsoknir/Crete16/PPT-160904-CH3Br(1).pptx ; slide 19:
Fig. 3a
PES spectra were derived from the images:
PES spectra:
See processed data: https://notendur.hi.is/~agust/rannsoknir/Crete16/PPT-161014-
CH3Br(4).pptx slides: 6-7
See assignments/PES spectra predictions:
https://notendur.hi.is/~agust/rannsoknir/Crete16/PPT-161014-CH3Br(4).pptx (AK & AH)
Slides: 10-13 AND
https://notendur.hi.is/~agust/rannsoknir/Crete16/PPT-161026-CH3Br(4).pptx (AH)
Slides: 2-4 AND
https://notendur.hi.is/~agust/rannsoknir/Crete16/WORD-161017PG.docx (Pavle)
8000078000760007400072000700006800066000
2h / [cm-1
]
[3/2]np;w
[1/2]np;w
[3/2]nd;w
[1/2]nd;w
5 6 7
0 0 02
n =
w =
5 6
02
02
0
02
02
02
02
4 6
4 5
3 2 1 3 2
3 2
3 2 1
3 2
66
01
9
68
68
4
68
46
1
72
65
5
72
97
7
75
41
87
56
86
75
90
5
78
22
5
78
37
0
78
19
3
78
40
1
79
61
0
80
64
0
80
75
8
80
67
4
80
88
1
66
50
3
67
27
5
68
88
2
69
94
7
74
24
9
76
68
97
71
65

15
Conclusions:
Since CH3+
are the major ions formed the major contribution to the PES´s also are
linked to the CH3+ formation, i.e. due to the two major mechanisms:
2hr(ii) (2hr + 1hpd): CH3** + 1h -> CH3+ + e-
1h(i) (i.e. 1hpd): CH3 + 3h -> CH3+ + e-
Since the former mechanism (ii) involves one-photon ionization and the latter
mechanism (i) involves three-photon ionization it is convenient to compare the PES´s
by h (ii) and 3h shifts (i), respectively (see (2) above).
NB: The latter mechanism (i) is only significant for the 2h = 77165 and 79610 cm-1
spectra (i.e. where significant sharp peaks in the one-color KERs are observed (see (2)
above)
2hr(ii) (2hr + 1hpd) mechanism (comparison of PES´s´for 1*h shifts):
https://notendur.hi.is/~agust/rannsoknir/Crete16/PPT-161014-CH3Br(4).pptx ; slide: 16:
Fig. 3b
shows,:
a) -(reasonably) good match of peaks corresponding to ionization (thresholds) of the
i) CH3**(3p2A2), ii) CH3**(3d2E) and/or CH3**(3d2A1), iii) CH3**(4p2A2) and iv)
CH3**(4f2E) for all PES´s
b) –peaks corresponding to CH3** = CH3**(3p2A2) only for the four lowest energy
excitation spectra (66019, 66503, 67275 and 68684 cm-1)
2hr(ii) (2hr + 1hpd) mechanism (comparison of PES´s´for 1*h shifts): The four
lowest energy excitation spectra (66019, 66503, 67275 and 68684 cm-1),
corresponding to resonance transitions to CH3Br**(5p) Rydberg states show
transitions for v´= -1, 0 and +1:
https://notendur.hi.is/~agust/rannsoknir/Crete16/PPT-161026-CH3Br(4).pptx; slide 2:
8
6
4
2
0
6420
5p (3/2)
5p (3/2)
5p (3/2)
4d (3/2)
5p (1/2)
4d (3/2)
6p; 5d (3/2)4d (1/2)
6p (1/2)5d (3/2)
6p (3/2)
7p (3/2)
1 hv
CH3(3p2A2)CH3(3d
2E,3d
2A1)CH3(4p
2A2)CH3(4f
2E)
h eV
CH3++Br-

16
Fig. 3c
1h (i) (1hpd) mechanism:
https://notendur.hi.is/~agust/rannsoknir/Crete16/PPT-161014-CH3Br(4).pptx ; slides: 16-
18:
The highest energy structure in the PES spectrum for 2h = 77165 cm-1 (see Fig. 3b
above) matches thresholds for thee-photon excitation of CH3(v1,v2,v3,v4), i.e. for
CH3(v1,v2,v3,v4) + 3h -> CH3+( v1,v2,v3,v4) + e-
1.0
0.8
0.6
0.4
0.2
0.0
Inte
nsity /
a.u
.
2.52.01.51.00.50.0KER (eV)
CH3*(0,0,0,0)
CH3+(0,1,0,0) + e-
CH3*(0,0,0,0)
CH3+(0,0,1,0) + e-
CH3*(0,0,0,0)
CH3+(0,0,0,0) + e-
CH3*(1,0,0,0)
CH3+(0,0,0,0) + e-
From NIST values for CH3(3p2A2) and CH3
+(X):(1, 2, 3, 4)
CH3*(0,0,0,0)
CH3+(0,0,3,0) + e-
CH3*(0,0,0,0)
CH3+(0,1,3,0) + e-
Electron KER for 68684 (291.231nm) v = 0
v = -1
v = 1
CH3*(0,0,0,0)
CH3+(0,0,2,0) + e-
CH3*(0,0,0,0)
CH3+(0,1,2,0) + e-
v = 2
v = 3
(be, str, str, be)
1.0
0.8
0.6
0.4
0.2
0.0
6420 eV
Red lines indicate 3 hvtransitions between vibrational states of the CH3 fragment
Forming CH3 in ground stateThen 3 hv photon ionization
PES for 77165 cm-1

17
Possible PES´s due to CH2** + 1h -> CH2
+ + e-:
Thresholds corresponding to one-photon ionization of CH2**suggest that “the low
energy side” of a broad peak at about 1.7 eV on a 1hv shift scale shown below is due
to CH2**(3p) + 1h -> CH2+ + e-:
https://notendur.hi.is/~agust/rannsoknir/Crete16/PPT-161014-CH3Br(4).pptx ; slides: 12:
0.6
0.5
0.4
0.3
0.2
0.1
0.0
5.04.84.64.44.24.0 eV
CH
3(1
,0,0
,0)
+ 3
h
-> C
H3+ (
0,0
,0,0
) +
e-
CH
3(0
,0,0
,0)
+ 3
h
-> C
H3+ (
0,0
,0,0
) +
e-(n
0)
CH
3(0
,0,0
,1)
+ 3
h
-> C
H3+ (
0,0
,0,1
) +
e-(d
ef.)
CH
3(0
,0,1
,0)
+ 3
h
-> C
H3+ (
0,0
,1,0
) +
e-(C
H s
tr.)
CH
3(0
,1,0
,0)
+ 3
h
-> C
H3+ (
0,1
,0,0
) +
e-;
OP
LA
CH
3(0
,2,0
,0)
+ 3
h
-> C
H3+ (
0,2
,0,0
) +
e-;
OP
LA
CH
3(0
,3,0
,0)
+ 3
h
-> C
H3+ (
0,3
,0,0
) +
e-;
OP
LA
CH
3(0
,4,0
,0)
+ 3
h
-> C
H3+ (
0,4
,0,0
) +
e-;
OP
LA
CH
3(0
,5,0
,0)
+ 3
h
-> C
H3+ (
0,5
,0,0
) +
e-;
OP
LA

18
Yet unassigned features in the PES´s could be due to various other ionization
channels, such as:
CH3 + 2h -> CH3+ + e- (low energy)
CH2** ->->-> CH2+ + e-
CH/CH** ->->-> CH+ + e-
Br/Br*/Br** ->->-> Br+ + e-
CBr** -> CBr+ + e-

19
4) Results:
VMI-REMPI data were collected for two color excitation corresponding to two-
photon excitation to number of Rydberg states within the range of 66000 – 80000 cm-
1 and Br and Br* detection -, for five wavenumber values in total:
https://notendur.hi.is/~agust/rannsoknir/Crete16/XLS-160912.xlsx; sheet: „Waves“:
https://notendur.hi.is/~agust/rannsoknir/Crete16/PPT-160904-CH3Br(1).pptx ; slide 18:
Fig. 4a
KER spectra and angular distributions were derived from the images:
KER spectra:
See processed data: https://notendur.hi.is/~agust/rannsoknir/Crete16/PPT-160921-
CH3Br(3).pptx; slides 2 -42
See assignments/KER spectra predictions:
https://notendur.hi.is/~agust/rannsoknir/Crete16/PPT-160928-CH3Br(3).pptx
Angular distributions: https://notendur.hi.is/~agust/rannsoknir/Crete16/PPT-160921-
CH3Br(3).pptx; slides 43-56
8000078000760007400072000700006800066000
2h / [cm-1
]
[3/2]np;w
[1/2]np;w
[3/2]nd;w
[1/2]nd;w
5 6 7
0 0 02
n =
w =
5 6
02
02
0
02
02
02
02
4 6
4 5
3 2 1 3 2
3 2
3 2 1
3 2
66
01
9
68
68
4
68
46
1
72
65
5
72
97
7
75
41
87
56
86
75
90
5
78
22
5
78
37
0
78
19
3
78
40
1
79
61
0
80
64
0
80
75
8
80
67
4
80
88
1
66
50
3
67
27
5
68
88
2
69
94
7
74
24
9
76
68
97
71
65

20
https://notendur.hi.is/~agust/rannsoknir/Crete16/PPT-160904-CH3Br(1).pptx, slides 38-39:
Br and Br* atoms were detected by (2r +1i) REMPI for the resonance transitions:
Br ->-> Br**(4P3/2); excitation = 266.6784 nm / 2h= 74996.6720 cm-1.
Br* ->-> Br**(2D3/2); excitation = 266.7420 nm / 2h= 74978.8185cm-1.
These excitations correspond to ion formation according to the 1h (i) mechanism (see
above)
Fig. 4b
Images / spectra were recorded,
a) –for both laser radiations; probe laser (Dye laser) delayed by about 10 ns with
respect to the pump laser (MOPO) beam, i.e. “two-color data”.
b) -for pump laser (MOPO) only
c) –for probe laser (Dye laser) only
Typical results were as the following (for 2h = 67275 cm-1):
see https://notendur.hi.is/~agust/rannsoknir/Crete16/PPT-160921-CH3Br(3).pptx, slide 11:
Fig. 4c
7700076000750007400073000
2h / [cm-1
]
BrBr**(4P3/2)
Br*Br**(2D3/2)
[3/2]nd;w
32 [1/2]nd;w
[3/2]np;w
[1/2]np;w
Dye lasers / probe transitions
75009.1374991.41
1.0
0.8
0.6
0.4
0.2
0.0
1.00.80.60.40.20.0
KERs (xx) / Br (533.358nm) detect.:
Ry(2hv/cm-1):
67275(21.9.16)
eV
FromMOPO
FromDye laser
Both lasers

21
https://notendur.hi.is/~agust/rannsoknir/Crete16/PPT-160921-CH3Br(3).pptx, slide 41-43:
Thus the “two-color KERs” are typically found to be made of three major
components:
a) medium KERs with a sharp peak, b) broad high KERs and c) broad low KERs:
a) The medium KERs (a) correspond to ion formation mechanism 1h(i) (which gives
sharp peaks) primarily due to the probe / dye laser, i.e.
1hpd of CH3Br by the probe radiation to form CH3 + Br/Br* followed by the
(2r+1i)REMPI (probe) of Br/Br*
b) The broad high KERs correspond to ion formation mechanism 2hr(ii) (which gives
broad peaks) by the pump and probe radiations, i.e.
2hr,pd of CH3Br by the probe radiation to form CH3 + Br/Br* followed by the
(2r+1i)REMPI (probe) of Br/Br*
c) The broad low KERs correspond to ion formation mechanism 2hr(ii) (which gives
broad peaks) by the pump and probe radiations, i.e.
(2hr + 1hpd) of CH3Br by the probe radiation to form CH3** + Br/Br* followed by
the (2r+1i)REMPI (probe) of Br/Br*:
Fig. 4d
CH3 + Br
a)
c)CH3* + Br
c)
CH3* + Br+/6hv total
CH3 + Br+/4-5 hv total
a-b)
CH3 + Br**
CH3* + Br**
b)

22
Fig. 4e
https://notendur.hi.is/~agust/rannsoknir/Crete16/PPT-160921-CH3Br(3).pptx,
slide 31:
Relevent thresholds corresponding to mechanisms (b) and (c) above are shown below:
b): for CH3 + Br formation after 2hr,pd (for 2h = 66019, 67275 and 72977 cm-1)
c): for CH3**(3p2A2) + Br formation after 2hr + 1hpd (2hr = 66019, 67275 and
68684 cm-1)
c) for CH3**(3d) + Br formation after 2hr + 1hpd (2hr = 72977 cm-1)
Fig. 4f
The angular distributions for (c)/”low KERs”/Br*(Br) detection, according to the two-
color detection and the CH3**(3p2A2) formation according to one-color detection (see
above, Fig. 2j) are found to be comparable. This suggest a common formation channel
1.2
1.0
0.8
0.6
0.4
0.2
0.0
1.00.80.60.40.20.0
(b)(c)
(a)
eV
Ry(2hv/cm-1):
72977(21.9.16)
2hr,pd
1hpd2hr+1hpd
1.0
0.8
0.6
0.4
0.2
0.0
1.00.80.60.40.20.0
KERs (xx) / Br (533.358nm) detect.:
eV
Both lasers„Total signal“
Ry(2hv/cm-1):75905(22.9.16)72977(21.9.16)68684(22.9.16)67275(21.9.16)66019(21.9.16)
Normalizationpoints
Thresholds for CH3+Brformation after 2hr
Thresholds for CH3**+Brformation after 2hr + 1hpd

23
of 2hr+1hpd followed by a formation of CH3**(3p2A2) + Br*(Br):
https://notendur.hi.is/~agust/rannsoknir/Crete16/PPT-160921-CH3Br(3).pptx,
slide 57:
Fig. 4g
VS.
2
Low KER
High KER
Medium KER
Two color, Br* detectionBr detection
Summary2.0
1.5
1.0
0.5
0.0
-0.5
-1.0
74727068
x103
2.0
1.5
1.0
0.5
0.0
-0.5
-1.0
78767472706866
x103
2
1.2932 660190.71411 665031.1593 672750.71876 686842.0226 729771.3393 74249-0.058 759050.5568 771650.2957 783700.0092239 79610
CH3+

24
5) Results:
VMI-REMPI data were collected for two color excitation corresponding to two-
photon excitation to a Rydberg state within the range of 66000 – 80000 cm-1 and CH3
detection -, for one wavenumber value (one Rydberg state) (72977 cm-1) :
https://notendur.hi.is/~agust/rannsoknir/Crete16/XLS-160912.xlsx; sheet: „Waves“:
https://notendur.hi.is/~agust/rannsoknir/Crete16/PPT-160904-CH3Br(1).pptx ; slide 20:
KER spectra were derived from the images:
KER spectra:
https://notendur.hi.is/~agust/rannsoknir/Crete16/PPT-161116-CH3Br(5).pptx
Slides 2, 4-6,
8000078000760007400072000700006800066000
2h / [cm-1
]
[3/2]np;w
[1/2]np;w
[3/2]nd;w
[1/2]nd;w
5 6 7
0 0 02
n =
w =
5 6
02
02
0
02
02
02
02
4 6
4 5
3 2 1 3 2
3 2
3 2 1
3 2
66
01
9
68
68
4
68
46
1
72
65
5
72
97
7
75
41
87
56
86
75
90
5
78
22
5
78
37
0
78
19
3
78
40
1
79
61
0
80
64
0
80
75
8
80
67
4
80
88
1
66
50
3
67
27
5
68
88
2
69
94
7
74
24
9
76
68
97
71
65