ch. 8 quality template 2006
TRANSCRIPT

8/8/2019 Ch. 8 Quality Template 2006
http://slidepdf.com/reader/full/ch-8-quality-template-2006 1/26
Notes on using the quality control template:
All values in blue cells are to be entered by the user, lighter blue cells can be entered but will be calculatedautomatically calculated, and do not need to be altered. Each quality control model has a sample value setproceeding with your own data.
Cells with red marks in the upper right corner have comments, let the mouse hover over these cells to readcontrol model.
This spreadsheet is locked/protected in order to keep the cells with equations from being changed. If a mofirst needs to be unlocked/unprotected. Do this by selecting the workbook you wish to unlock, click on "ToolSheet". The sheet will then be unlocked so alterations can be made.
Equations for models will be given when available.

8/8/2019 Ch. 8 Quality Template 2006
http://slidepdf.com/reader/full/ch-8-quality-template-2006 2/26
if not entered, all other values areentered, make sure to clear all values before
the comments to further explain the quality
el does need to be altered, the spreadsheetls", highlight "Protection", and select "Unprotect

8/8/2019 Ch. 8 Quality Template 2006
http://slidepdf.com/reader/full/ch-8-quality-template-2006 3/26
Mean Control Chart (σ known)
σ UCL #DIV/0!
z LCL #DIV/0!
Mean #DIV/0!
Sample Mean UCL Mean LCL
1 #DIV/0! #DIV/0! #DIV/0!
2 #DIV/0! #DIV/0! #DIV/0!
3 #DIV/0! #DIV/0! #DIV/0!
4 #DIV/0! #DIV/0! #DIV/0!
5 #DIV/0! #DIV/0! #DIV/0!
6 #DIV/0! #DIV/0! #DIV/0!
7 #DIV/0! #DIV/0! #DIV/0!
8 #DIV/0! #DIV/0! #DIV/0!9 #DIV/0! #DIV/0! #DIV/0!
10 #DIV/0! #DIV/0! #DIV/0!
11 #DIV/0! #DIV/0! #DIV/0!
12 #DIV/0! #DIV/0! #DIV/0!
13 #DIV/0! #DIV/0! #DIV/0!
14 #DIV/0! #DIV/0! #DIV/0!
15 #DIV/0! #DIV/0! #DIV/0!
16 #DIV/0! #DIV/0! #DIV/0!
17 #DIV/0! #DIV/0! #DIV/0!
18 #DIV/0! #DIV/0! #DIV/0!
19 #DIV/0! #DIV/0! #DIV/0!
20 #DIV/0! #DIV/0! #DIV/0!
21 #DIV/0! #DIV/0! #DIV/0!
22 #DIV/0! #DIV/0! #DIV/0!
23 #DIV/0! #DIV/0! #DIV/0!
24 #DIV/0! #DIV/0! #DIV/0!
25 #DIV/0! #DIV/0! #DIV/0!
26 #DIV/0! #DIV/0! #DIV/0!
27 #DIV/0! #DIV/0! #DIV/0!
28 #DIV/0! #DIV/0! #DIV/0!
29 #DIV/0! #DIV/0! #DIV/0!
30 #DIV/0! #DIV/0! #DIV/0!
31 #DIV/0! #DIV/0! #DIV/0!
32 #DIV/0! #DIV/0! #DIV/0!
33 #DIV/0! #DIV/0! #DIV/0!
34 #DIV/0! #DIV/0! #DIV/0!
35 #DIV/0! #DIV/0! #DIV/0!
36 #DIV/0! #DIV/0! #DIV/0!
37 #DIV/0! #DIV/0! #DIV/0!
38 #DIV/0! #DIV/0! #DIV/0!
39 #DIV/0! #DIV/0! #DIV/0!
40 #DIV/0! #DIV/0! #DIV/0!
n = number of observations/sample
0 5 10
0
2
4
6
8
10
12
Mean
Column B
M e a n
The Mean Control Chart (sigma k (n) for each sample versus periodobservations and the upper and loor σ is known. A sample mean o(would only happen 3 times out of variation that should be investigat
Equations:UCL = Upper Control LimitLCL = Lower Control Limit
μ = Mean of population or
z = Number of standard errr σ = Standard deviation of p
n = Number of observation
UCL= μz*σ
n
LCL= μ− z ∗σ
n

8/8/2019 Ch. 8 Quality Template 2006
http://slidepdf.com/reader/full/ch-8-quality-template-2006 4/26
#DIV/0! #DIV/0! #DIV/0!

8/8/2019 Ch. 8 Quality Template 2006
http://slidepdf.com/reader/full/ch-8-quality-template-2006 5/26
15 20 25 30 35 40
ontrol Chart (σ known)
olumn C Column D Column E
Period
own)plots the mean of a set number of observationsnumber on the same chart as the overall mean of allwer control limits based on 3 sigma. In this case sigmautside the upper or lower control limits is very unusual1000) and indicates assignable or non-random
ed and the cause eliminated or corrected.
verall mean
ors for confidence level=3 for 99. 7% confidenceopulation
per sample

8/8/2019 Ch. 8 Quality Template 2006
http://slidepdf.com/reader/full/ch-8-quality-template-2006 6/26

8/8/2019 Ch. 8 Quality Template 2006
http://slidepdf.com/reader/full/ch-8-quality-template-2006 7/26
Mean Control Chart (σ unknown)
Overall Mean #DIV/0!
Average Range 1.5
UCL #N/A
LCL #N/A
Sample Mean Range UCL Mean LCL
1 1.38 #DIV/0! #DIV/0! #DIV/0!
2 1.06 #DIV/0! #DIV/0! #DIV/0!
3 1 #DIV/0! #DIV/0! #DIV/0!
4 2.21 #DIV/0! #DIV/0! #DIV/0!
5 1.46 #DIV/0! #DIV/0! #DIV/0!
6 1.62 #DIV/0! #DIV/0! #DIV/0!
7 1.03 #DIV/0! #DIV/0! #DIV/0!8 2.09 #DIV/0! #DIV/0! #DIV/0!
9 0.77 #DIV/0! #DIV/0! #DIV/0!
10 1.01 #DIV/0! #DIV/0! #DIV/0!
11 1.1 #DIV/0! #DIV/0! #DIV/0!
12 2.49 #DIV/0! #DIV/0! #DIV/0!
13 1.68 #DIV/0! #DIV/0! #DIV/0!
14 2.29 #DIV/0! #DIV/0! #DIV/0!
15 1.34 #DIV/0! #DIV/0! #DIV/0!
16 #DIV/0! #DIV/0! #DIV/0!
17 #DIV/0! #DIV/0! #DIV/0!
18 #DIV/0! #DIV/0! #DIV/0!
19 #DIV/0! #DIV/0! #DIV/0!20 #DIV/0! #DIV/0! #DIV/0!
21 #DIV/0! #DIV/0! #DIV/0!
22 #DIV/0! #DIV/0! #DIV/0!
23 #DIV/0! #DIV/0! #DIV/0!
24 #DIV/0! #DIV/0! #DIV/0!
25 #DIV/0! #DIV/0! #DIV/0!
26 #DIV/0! #DIV/0! #DIV/0!
27 #DIV/0! #DIV/0! #DIV/0!
28 #DIV/0! #DIV/0! #DIV/0!
29 #DIV/0! #DIV/0! #DIV/0!
30 #DIV/0! #DIV/0! #DIV/0!
31 #DIV/0! #DIV/0! #DIV/0!32 #DIV/0! #DIV/0! #DIV/0!
33 #DIV/0! #DIV/0! #DIV/0!
34 #DIV/0! #DIV/0! #DIV/0!
35 #DIV/0! #DIV/0! #DIV/0!
36 #DIV/0! #DIV/0! #DIV/0!
37 #DIV/0! #DIV/0! #DIV/0!
38 #DIV/0! #DIV/0! #DIV/0!
39 #DIV/0! #DIV/0! #DIV/0!
n = number of observations/sample
0 5
0
2
4
6
8
10
12
M
Colum
M e a n
The Mean Control Chexcept that the controlrather than the standathat sigma is unknowcalculate. The averagdeviation of the populmultiplying the averagThe tabulated factorsmean values, the ranAs in the previous chalimits is very unusual
Equation:UCL = Upper ControlLCL = Lower Control
X = A verage o f
A 2 = Factor for
R= A verage o f r
U C L= X A2∗ R
L C L= X − A2∗ R

8/8/2019 Ch. 8 Quality Template 2006
http://slidepdf.com/reader/full/ch-8-quality-template-2006 8/26
40 #DIV/0! #DIV/0! #DIV/0!
n value A2 factor
2 1.883 1.02
4 0.73
5 0.58
6 0.48
7 0.42
8 0.37
9 0.34
10 0.31
11 0.29
12 0.27
13 0.25
14 0.2415 0.22
16 0.21
17 0.2
18 0.19
19 0.19
20 0.18

8/8/2019 Ch. 8 Quality Template 2006
http://slidepdf.com/reader/full/ch-8-quality-template-2006 9/26
10 15 20 25 30 35 40
ean Control Chart (σ unknown)
n B Column D Column E Column F
Period
rt (sigma unknown) is similar to the previous chart,l limits are based on the range found in each sample,rd deviation of the population. The assumption here isfor the population and/or the range is easier torange of all samples is related to the standard
tion and upper and lower control limits are found bye range by a tabulated factor rather than the z value.begin on A54 of this sheet. In addition to the samplee of these values for each sample must be entered.rt, a sample mean outside the upper or lower controlnd indicates assignable or non-random variation.
Limitimit
ample m eans , overa l l m ean , o r popu l
3 s igma conf idence leve lstart ing a t A 54ange values

8/8/2019 Ch. 8 Quality Template 2006
http://slidepdf.com/reader/full/ch-8-quality-template-2006 10/26

8/8/2019 Ch. 8 Quality Template 2006
http://slidepdf.com/reader/full/ch-8-quality-template-2006 11/26
Range Control Chart
n Average Range #DIV/0!
UCL #N/A
LCL #N/A
Sample Range UCL Mean LCL
1 #DIV/0! #DIV/0! #DIV/0!
2 #DIV/0! #DIV/0! #DIV/0!
3 #DIV/0! #DIV/0! #DIV/0!
4 #DIV/0! #DIV/0! #DIV/0!
5 #DIV/0! #DIV/0! #DIV/0!
6 #DIV/0! #DIV/0! #DIV/0!
7 #DIV/0! #DIV/0! #DIV/0!
8 #DIV/0! #DIV/0! #DIV/0!
9 #DIV/0! #DIV/0! #DIV/0!10 #DIV/0! #DIV/0! #DIV/0!
11 #DIV/0! #DIV/0! #DIV/0!
12 #DIV/0! #DIV/0! #DIV/0!
13 #DIV/0! #DIV/0! #DIV/0!
14 #DIV/0! #DIV/0! #DIV/0!
15 #DIV/0! #DIV/0! #DIV/0!
16 #DIV/0! #DIV/0! #DIV/0!
17 #DIV/0! #DIV/0! #DIV/0!
18 #DIV/0! #DIV/0! #DIV/0!
19 #DIV/0! #DIV/0! #DIV/0!
20 #DIV/0! #DIV/0! #DIV/0!
21 #DIV/0! #DIV/0! #DIV/0!22 #DIV/0! #DIV/0! #DIV/0!
23 #DIV/0! #DIV/0! #DIV/0!
24 #DIV/0! #DIV/0! #DIV/0!
25 #DIV/0! #DIV/0! #DIV/0!
26 #DIV/0! #DIV/0! #DIV/0!
27 #DIV/0! #DIV/0! #DIV/0!
28 #DIV/0! #DIV/0! #DIV/0!
29 #DIV/0! #DIV/0! #DIV/0!
30 #DIV/0! #DIV/0! #DIV/0!
31 #DIV/0! #DIV/0! #DIV/0!
32 #DIV/0! #DIV/0! #DIV/0!
33 #DIV/0! #DIV/0! #DIV/0!34 #DIV/0! #DIV/0! #DIV/0!
35 #DIV/0! #DIV/0! #DIV/0!
36 #DIV/0! #DIV/0! #DIV/0!
37 #DIV/0! #DIV/0! #DIV/0!
38 #DIV/0! #DIV/0! #DIV/0!
39 #DIV/0! #DIV/0! #DIV/0!
40 #DIV/0! #DIV/0! #DIV/0!
0 5 10
0
2
4
6
8
10
12
Column B
M e a n
The Range Control Chart plots t
mean of the ranges and the uppmeasure of variability within theindicate that the variablility in theassingnable causes. The upper using tabulated factors. These fa
Equation:UCL = Upper Control LimitLCL = Lower Control Limit
R = Average of sample r D3 = Factor for LCL sta
D4 = Factor for UCL stLCL= D3∗ R
UCL= D4∗ R

8/8/2019 Ch. 8 Quality Template 2006
http://slidepdf.com/reader/full/ch-8-quality-template-2006 12/26
LCL UCL
n value D3 factor D4 factor
2 0 3.27
3 0 2.57
4 0 2.285 0 2.11
6 0 2
7 0.08 1.92
8 0.14 1.86
9 0.18 1.82
10 0.22 1.78
11 0.26 1.74
12 0.28 1.72
13 0.31 1.69
14 0.33 1.67
15 0.35 1.65
16 0.36 1.6417 0.38 1.62
18 0.39 1.61
19 0.4 1.6
20 0.41 1.59

8/8/2019 Ch. 8 Quality Template 2006
http://slidepdf.com/reader/full/ch-8-quality-template-2006 13/26
15 20 25 30 35 40
Range Control Chart
Column C Column D Column E
Period
e ranges of the samples on the same chart as the
r and lower control limit for the range. The range is aamples and sample ranges outside the control limitssample is very unusual and should be investigated for nd lower control limits for the range are calculatedctors are on this sheet, starting at A54.
ngesting at A54
rting at A54

8/8/2019 Ch. 8 Quality Template 2006
http://slidepdf.com/reader/full/ch-8-quality-template-2006 14/26

8/8/2019 Ch. 8 Quality Template 2006
http://slidepdf.com/reader/full/ch-8-quality-template-2006 15/26
p Chart
n Average p #DIV/0!
σ #DIV/0!
z UCL #DIV/0!
LCL #DIV/0!
Sample p UCL Mean LCL
1 #DIV/0! #DIV/0! #DIV/0!
2 #DIV/0! #DIV/0! #DIV/0!
3 #DIV/0! #DIV/0! #DIV/0!
4 #DIV/0! #DIV/0! #DIV/0!
5 #DIV/0! #DIV/0! #DIV/0!
6 #DIV/0! #DIV/0! #DIV/0!
7 #DIV/0! #DIV/0! #DIV/0!
8 #DIV/0! #DIV/0! #DIV/0!
9 #DIV/0! #DIV/0! #DIV/0!10 #DIV/0! #DIV/0! #DIV/0!
11 #DIV/0! #DIV/0! #DIV/0!
12 #DIV/0! #DIV/0! #DIV/0!
13 #DIV/0! #DIV/0! #DIV/0!
14 #DIV/0! #DIV/0! #DIV/0!
15 #DIV/0! #DIV/0! #DIV/0!
16 #DIV/0! #DIV/0! #DIV/0!
17 #DIV/0! #DIV/0! #DIV/0!
18 #DIV/0! #DIV/0! #DIV/0!
19 #DIV/0! #DIV/0! #DIV/0!
20 #DIV/0! #DIV/0! #DIV/0!
21 #DIV/0! #DIV/0! #DIV/0!22 #DIV/0! #DIV/0! #DIV/0!
23 #DIV/0! #DIV/0! #DIV/0!
24 #DIV/0! #DIV/0! #DIV/0!
25 #DIV/0! #DIV/0! #DIV/0!
26 #DIV/0! #DIV/0! #DIV/0!
27 #DIV/0! #DIV/0! #DIV/0!
28 #DIV/0! #DIV/0! #DIV/0!
29 #DIV/0! #DIV/0! #DIV/0!
30 #DIV/0! #DIV/0! #DIV/0!
31 #DIV/0! #DIV/0! #DIV/0!
32 #DIV/0! #DIV/0! #DIV/0!
33 #DIV/0! #DIV/0! #DIV/0!34 #DIV/0! #DIV/0! #DIV/0!
35 #DIV/0! #DIV/0! #DIV/0!
36 #DIV/0! #DIV/0! #DIV/0!
37 #DIV/0! #DIV/0! #DIV/0!
38 #DIV/0! #DIV/0! #DIV/0!
39 #DIV/0! #DIV/0! #DIV/0!
40 #DIV/0! #DIV/0! #DIV/0!
0 5 10
0
2
4
6
8
10
12
Column B
M e a n
The p Chart plots values which a
chart is similar to both the Meanwhen the data is proportional ratapproximation to the binomial disor lower control limits is very unuindicates assignable or non-randeliminated or corrected.
Equation:UCL = Upper Control LimitLCL = Lower Control Limit
σ p
= S tandard er ror of propo
p = A verage of sample pron = N umb er of observat ions
z = Num ber of s tandard er r
σ p=
p∗1− p
n
U C L= pz*σ p
L C L= p−z*σ p

8/8/2019 Ch. 8 Quality Template 2006
http://slidepdf.com/reader/full/ch-8-quality-template-2006 16/26
8/8/2019 Ch. 8 Quality Template 2006
http://slidepdf.com/reader/full/ch-8-quality-template-2006 17/26
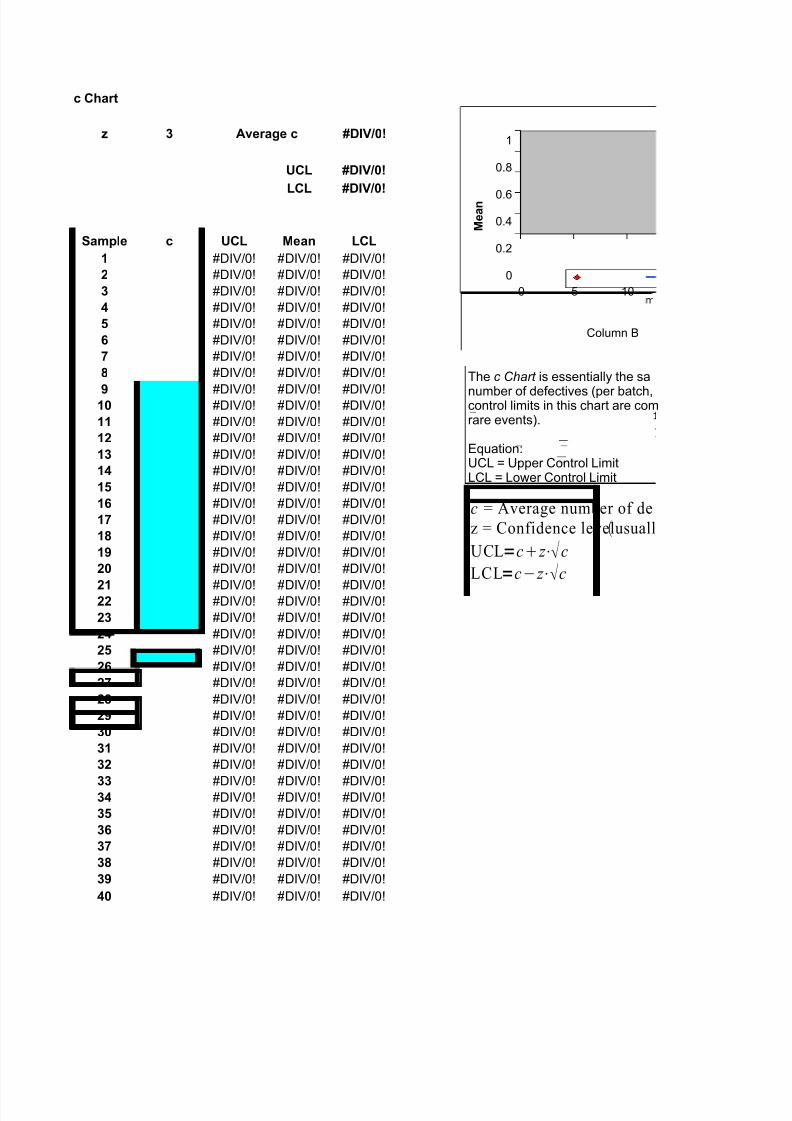
c Chart
z 3 Average c #DIV/0!
UCL #DIV/0!
LCL #DIV/0!
Sample c UCL Mean LCL
1 #DIV/0! #DIV/0! #DIV/0!
2 #DIV/0! #DIV/0! #DIV/0!
3 #DIV/0! #DIV/0! #DIV/0!
4 #DIV/0! #DIV/0! #DIV/0!
5 #DIV/0! #DIV/0! #DIV/0!
6 #DIV/0! #DIV/0! #DIV/0!
7 #DIV/0! #DIV/0! #DIV/0!
8 #DIV/0! #DIV/0! #DIV/0!
9 #DIV/0! #DIV/0! #DIV/0!10 #DIV/0! #DIV/0! #DIV/0!
11 #DIV/0! #DIV/0! #DIV/0!
12 #DIV/0! #DIV/0! #DIV/0!
13 #DIV/0! #DIV/0! #DIV/0!
14 #DIV/0! #DIV/0! #DIV/0!
15 #DIV/0! #DIV/0! #DIV/0!
16 #DIV/0! #DIV/0! #DIV/0!
17 #DIV/0! #DIV/0! #DIV/0!
18 #DIV/0! #DIV/0! #DIV/0!
19 #DIV/0! #DIV/0! #DIV/0!
20 #DIV/0! #DIV/0! #DIV/0!
21 #DIV/0! #DIV/0! #DIV/0!22 #DIV/0! #DIV/0! #DIV/0!
23 #DIV/0! #DIV/0! #DIV/0!
24 #DIV/0! #DIV/0! #DIV/0!
25 #DIV/0! #DIV/0! #DIV/0!
26 #DIV/0! #DIV/0! #DIV/0!
27 #DIV/0! #DIV/0! #DIV/0!
28 #DIV/0! #DIV/0! #DIV/0!
29 #DIV/0! #DIV/0! #DIV/0!
30 #DIV/0! #DIV/0! #DIV/0!
31 #DIV/0! #DIV/0! #DIV/0!
32 #DIV/0! #DIV/0! #DIV/0!
33 #DIV/0! #DIV/0! #DIV/0!34 #DIV/0! #DIV/0! #DIV/0!
35 #DIV/0! #DIV/0! #DIV/0!
36 #DIV/0! #DIV/0! #DIV/0!
37 #DIV/0! #DIV/0! #DIV/0!
38 #DIV/0! #DIV/0! #DIV/0!
39 #DIV/0! #DIV/0! #DIV/0!
40 #DIV/0! #DIV/0! #DIV/0!
0 5 10
0
0.2
0.4
0.6
0.8
1
Column B
M e a n
The c Chart is essentially the sa
number of defectives (per batch,control limits in this chart are comrare events).
Equation:UCL = Upper Control LimitLCL = Lower Control Limit
c = Average number of de
z = Confidence level usuall
UCL=c z ⋅ c
LCL=c− z ⋅ c

8/8/2019 Ch. 8 Quality Template 2006
http://slidepdf.com/reader/full/ch-8-quality-template-2006 18/26
15 20 25 30 35 40
c Chart
Column C Column D Column E
Period
e as the p Chart. However, In this chart, we plot the
per day, per machine, per 100 feet of pipe, etc.) and theputed based on the Poisson distribution (distribution of
ects per u
y 3

8/8/2019 Ch. 8 Quality Template 2006
http://slidepdf.com/reader/full/ch-8-quality-template-2006 19/26
Process Capability
Standard Machine Specification
Machine Deviation Capability Width Cp
A
B
CD
E
Non centered
Process Standard Lower Upper
Machine Mean Deviation Specification Ratio Specification
A
B
C
D
E
Process Ca process is ccapable, whchanged inwill only proCLs and the
process. Th(DPMO) on
Equation:Machine CaCapability =
For a non centered process (the mean of the process and the center of the specifications are not t(Cpk) needs to be calculated. As above, Cpk of greater than or equal to 1 means the process is cit is not capable and needs to be "fixed" in order to produce the product. Note that if the process isprocess is not centered, it is possible to get a Cp of greater than 1 and a Cpk of less than 1. Cpk iswhen the process is not centered to get the right answer. Six sigma quality implies a Cpk of 1.5, a
Equation:Lower Ratio = (Process Mean - Lower Specification) / (3 * Standard Deviation)Upper Ratio = (Upper Specification - Process Mean) / (3 * Standard Deviation)
Cpk = Min[ Lower Ratio or Upper Ratio ]

8/8/2019 Ch. 8 Quality Template 2006
http://slidepdf.com/reader/full/ch-8-quality-template-2006 20/26
Ratio Cpk
ability is a measure of how capable the process is, assuming theentered. A Cp of greater than or equal to 1 means the process isile less than 1 means it is not capable and needs to be "fixed" or rder to produce the product. A capable process, with a Cp of 1,uce 3 defects per 1000 opportunities. A Cp of 1 means that theSLs are the same. Six sigma has a Cp of 1.5, a very capable
process will only produce 3.4 defects per million opportunitiesone tail.
pability = Standard Deviation * 6Specification Width / Machine Capability
e same), the Capability Index pable, while less than 1 meanscentered Cp=Cpk. If thebasically an adjustment for Cpvery capable process.

8/8/2019 Ch. 8 Quality Template 2006
http://slidepdf.com/reader/full/ch-8-quality-template-2006 21/26
Normal Distribution
Mean = 20
Std Dev = 2
x = 29
z = 4.5
P(<x) = 1
P(>x) = 0
NormX Z P(X) X
0.01 15.35 -2.33 0.01 29
0.02 15.89 -2.05 0.02 29
0.03 16.24 -1.88 0.03 29
0.04 16.5 -1.75 0.04 29
0.05 16.71 -1.64 0.05 29
0.06 16.89 -1.55 0.06 29
0.07 17.05 -1.48 0.07 29
0.08 17.19 -1.41 0.07 29
0.09 17.32 -1.34 0.08 29
0.1 17.44 -1.28 0.09 29
0.11 17.55 -1.23 0.09 29
0.12 17.65 -1.17 0.1 29
0.13 17.75 -1.13 0.11 29
0.14 17.84 -1.08 0.11 29
0.15 17.93 -1.04 0.12 29
0.16 18.01 -0.99 0.12 29
0.17 18.09 -0.95 0.13 29
0.18 18.17 -0.92 0.13 29
0.19 18.24 -0.88 0.14 29
0.2 18.32 -0.84 0.14 29
0.21 18.39 -0.81 0.14 29
0.22 18.46 -0.77 0.15 29
0.23 18.52 -0.74 0.15 29
0.24 18.59 -0.71 0.16 29
0.25 18.65 -0.67 0.16 29
0.26 18.71 -0.64 0.16 29
0.27 18.77 -0.61 0.17 29
CumulativeP(X)
14 16 18 20 22 24
Normal Distribution

8/8/2019 Ch. 8 Quality Template 2006
http://slidepdf.com/reader/full/ch-8-quality-template-2006 22/26
0.28 18.83 -0.58 0.17 29
0.29 18.89 -0.55 0.17 29
0.3 18.95 -0.52 0.17 29
0.31 19.01 -0.5 0.18 29
0.32 19.06 -0.47 0.18 29
0.33 19.12 -0.44 0.18 29
0.34 19.18 -0.41 0.18 290.35 19.23 -0.39 0.19 29
0.36 19.28 -0.36 0.19 29
0.37 19.34 -0.33 0.19 29
0.38 19.39 -0.31 0.19 29
0.39 19.44 -0.28 0.19 29
0.4 19.49 -0.25 0.19 29
0.41 19.54 -0.23 0.19 29
0.42 19.6 -0.2 0.2 29
0.43 19.65 -0.18 0.2 29
0.44 19.7 -0.15 0.2 29
0.45 19.75 -0.13 0.2 29
0.46 19.8 -0.1 0.2 290.47 19.85 -0.08 0.2 29
0.48 19.9 -0.05 0.2 29
0.49 19.95 -0.03 0.2 29
0.5 20 0 0.2 29
0.51 20.05 0.03 0.2 29
0.52 20.1 0.05 0.2 29
0.53 20.15 0.08 0.2 29
0.54 20.2 0.1 0.2 29
0.55 20.25 0.13 0.2 29
0.56 20.3 0.15 0.2 29
0.57 20.35 0.18 0.2 29
0.58 20.4 0.2 0.2 290.59 20.46 0.23 0.19 29
0.6 20.51 0.25 0.19 29
0.61 20.56 0.28 0.19 29
0.62 20.61 0.31 0.19 29
0.63 20.66 0.33 0.19 29
0.64 20.72 0.36 0.19 29
0.65 20.77 0.39 0.19 29
0.66 20.82 0.41 0.18 29
0.67 20.88 0.44 0.18 29
0.68 20.94 0.47 0.18 29
0.69 20.99 0.5 0.18 29
0.7 21.05 0.52 0.17 290.71 21.11 0.55 0.17 29
0.72 21.17 0.58 0.17 29
0.73 21.23 0.61 0.17 29
0.74 21.29 0.64 0.16 29
0.75 21.35 0.67 0.16 29
0.76 21.41 0.71 0.16 29
0.77 21.48 0.74 0.15 29
0.78 21.54 0.77 0.15 29

8/8/2019 Ch. 8 Quality Template 2006
http://slidepdf.com/reader/full/ch-8-quality-template-2006 23/26
0.79 21.61 0.81 0.14 29
0.8 21.68 0.84 0.14 29
0.81 21.76 0.88 0.14 29
0.82 21.83 0.92 0.13 29
0.83 21.91 0.95 0.13 29
0.84 21.99 0.99 0.12 29
0.85 22.07 1.04 0.12 290.86 22.16 1.08 0.11 29
0.87 22.25 1.13 0.11 29
0.88 22.35 1.17 0.1 29
0.89 22.45 1.23 0.09 29
0.9 22.56 1.28 0.09 29
0.91 22.68 1.34 0.08 29
0.92 22.81 1.41 0.07 29
0.93 22.95 1.48 0.07 29
0.94 23.11 1.55 0.06 29
0.95 23.29 1.64 0.05 29
0.96 23.5 1.75 0.04 29
0.97 23.76 1.88 0.03 290.98 24.11 2.05 0.02 29
0.99 24.65 2.33 0.01 29
8/8/2019 Ch. 8 Quality Template 2006
http://slidepdf.com/reader/full/ch-8-quality-template-2006 24/26
26 28 30

8/8/2019 Ch. 8 Quality Template 2006
http://slidepdf.com/reader/full/ch-8-quality-template-2006 25/26

8/8/2019 Ch. 8 Quality Template 2006
http://slidepdf.com/reader/full/ch-8-quality-template-2006 26/26