ch. 8 – characterizing stars part 3: the hertzsprung-russell diagram luminosity classes spectral...
Post on 22-Dec-2015
219 views
TRANSCRIPT

Ch. 8 – Characterizing Stars
part 3:
The Hertzsprung-Russell DiagramLuminosity Classes
Spectral Types

The Hertzsprung-Russell Diagram
• We will plot stars on a chart which has temperature on the horizontal axis and the luminosity on the vertical axis.
• Named after two astronomers who made this type of plot in the 1920’s.
• Use units of solar luminosity and Kelvin

H–R Diagram of Well-Known Stars
Notice the luminosity is a special kind of scale
called a logarithmic scale, in powers of ten.
The temperature is plotted in reverse:
hot on the left, cooler on the right.
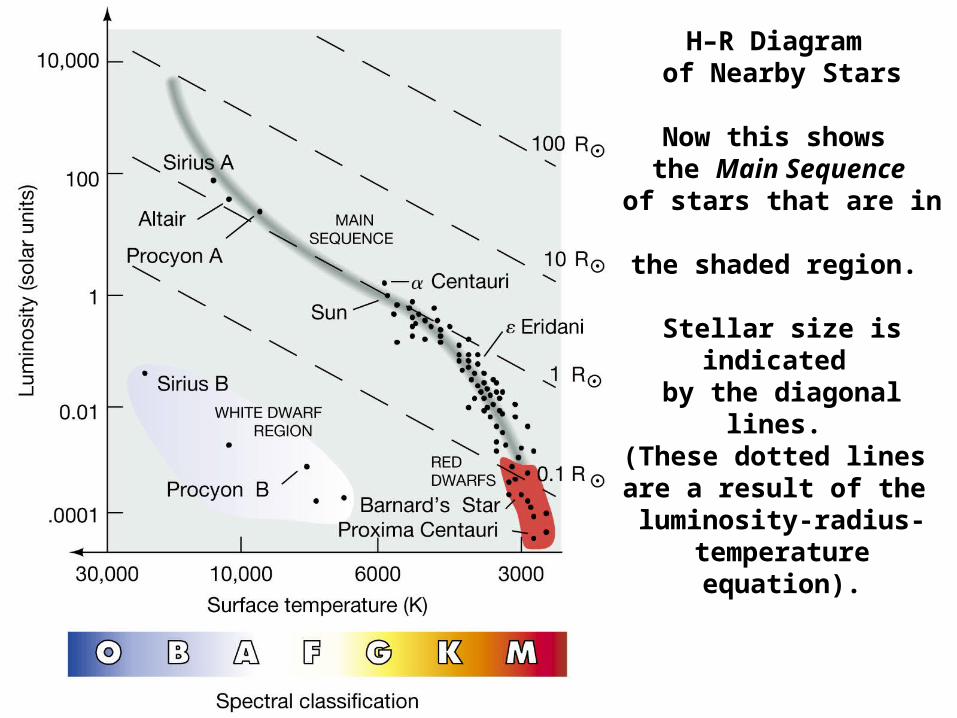
H–R Diagram of Nearby Stars
Now this shows the Main Sequence of stars that are in the shaded region.
Stellar size is indicated by the diagonal lines. (These dotted lines are a result of the luminosity-radius-
temperature equation).

H–R Diagram of the 100 Brightest Stars
This is biased in favor of giants, which are
very luminous, so we see all the giants in a large volume of
space, and don’t see the smaller stars in
such a large volume. As a result, very few smaller stars show
up on this plot.

Hipparcos H–R Diagram
This is a more representative set of
stars for a plot like this.


Determination of Stellar Distances by different methods:

Spectroscopic parallax is really a misnomer, it is not a direct measurement, but empirical, based on a statistical estimate, the most likely
distance for a star based on luminosity and color.
Luminosity class is an additional criterion, based on spectral line width and its correlation to gas pressure in the star’s photosphere.
We get several types of stars, listed in the Table on Stellar Luminosity Classes.

Spectra vary according to temperature.
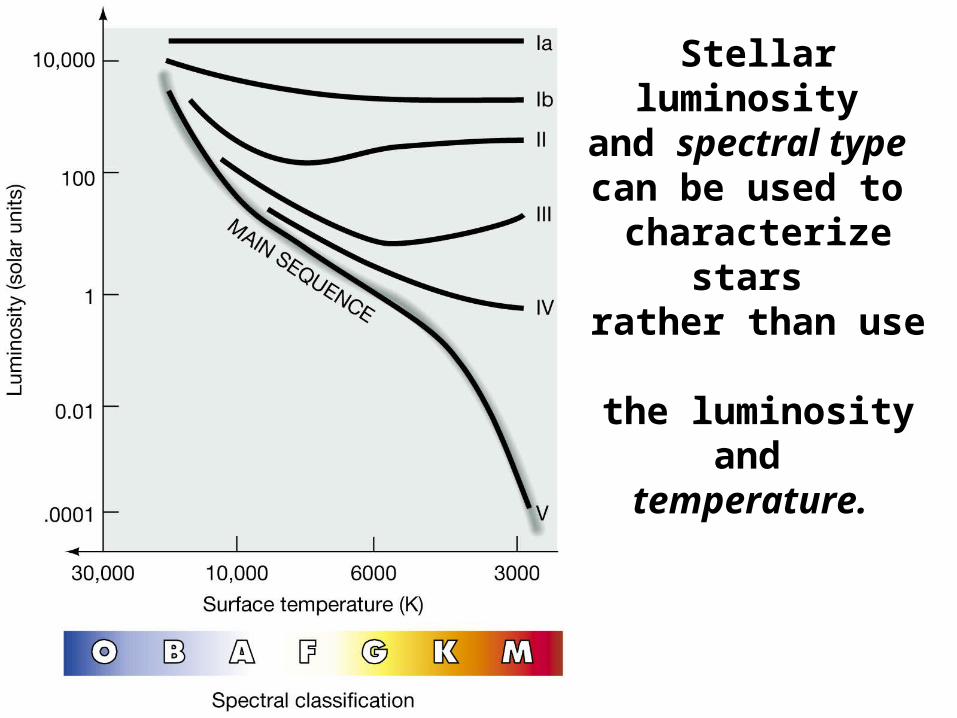
Stellar luminosity and spectral type
can be used to characterize stars
rather than use the luminosity and
temperature.


Visual binary stars

Stellar masses can be determined most easily in Binary Stars.
Kruger 60


Spectroscopic binary stars

Binary Spectra have line shifts due to the Doppler effect.


Orbital periods and the velocities can be plotted vs. time.


Eclipsing binary stars

Binary Light Curves sometimes indicate a transiting companion.

Stellar massesdetermine a star’s position along the main sequence, more than other properties do.

Stellar Mass Distribution
for some nearby stars.
Giants are rare.

Stellar Radii and Luminosities:
Radius is proportional to mass
Luminosity is proportional to (mass)4


Main sequence stars show some trends:
The small mass stars tend to be cooler and so they burn hydrogen more slowly in their core. Hence they have longer lives, in some cases,lives that will be much longer than the present age of the Universe (trillions of years).