cgms450- chapter 5- scheduling the...
TRANSCRIPT

CGMS450- Chapter 5- Scheduling the Project
1
Project schedule is simply the project plan in an altered format Convenient form for monitoring and controlling project activities Take on several forms
o Gantt charts o PERT/ CPM networks o Convert a project plan or WBS into these formats
5.1 PERT And CPM Networks PERT developed by US Navy, Booz-Allen Hamilton and Lockheed Aircraft CPM developed by Dupont De Nemours Inc. When developed there were significant differences
o PERT used probabilistic estimates of activity durations o CPM used deterministic estimates but included both time and cost estimates to
allow time/cost trade offs to be used o Both employed networks to schedule and display task sequences
Identified a critical path of tasks that could not be delayed without delaying the project
Identified activities with slack that could be somewhat delayed without extending the time required to complete project
Anything one can do with PERT, they could do with CPM Traditional PERT is used less often than CPM CPM can be used with 3 time estimates We can do things with PERT that were restricted to CPM in “olden times”
The Language Of PERT/ CPM Terms used in discussing PERT/ CPM
o Activity—task or set of tasks required by the project Use resources and time
o Event—an identifiable state resulting from the completion of one or more activities Consume no resources or time Before event is achieved—all predecessor activities must be complete
o Milestones—identifiable and noteworthy events marking significant progress on the project
o Network—A diagram of nodes connected by directional arcs that defines the project and illustrates the technological relationships of all activities
Drawn with a start node on the left an a finish mode on the right o Path—series of connected activities between any 2 events in a network o Critical path—set of activities on a oath from the projects start event to its finish
event that, of delayed, will delay the competition date of the project o Critical time—time required to complete all activities on the critical path
Building The Network 2 ways displaying the project network
o Depicts the activities as arrows and events in nodes Activity-on-arrow (AOA) network—usually associated with
PERT o Create an activity-on-nodes (AON) network by showing each task as a
node and linking the nodes to arrows that show their technological relationship Usually associated with CPM Easy to draw—more then 15-20 are more
difficult to draw by hand Often do not show events but it is simple
enough to add them by showing the event exactly as if it were an activity but with zero time duration and no resources
o Avoids lines crossing each other o Dummy activity—used in situations where 2 activities have the same starting and
finishing nodes or where a single activity connects 2 or more nodes Require no time or resources Problem: difficult to distinguish the tasks form one another
CGMS450- Chapter 5- Scheduling the Project
2
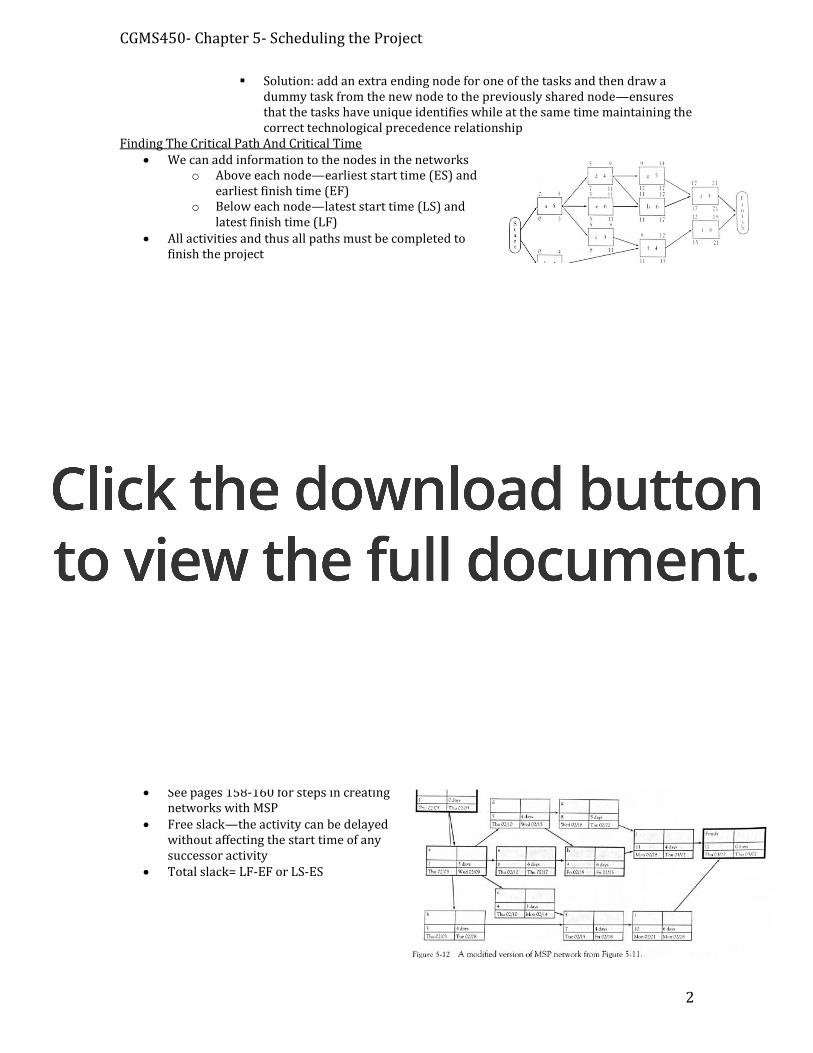
Solution: add an extra ending node for one of the tasks and then draw a dummy task from the new node to the previously shared node—ensures that the tasks have unique identifies while at the same time maintaining the correct technological precedence relationship
Finding The Critical Path And Critical Time We can add information to the nodes in the networks
o Above each node—earliest start time (ES) and earliest finish time (EF)
o Below each node—latest start time (LS) and latest finish time (LF)
All activities and thus all paths must be completed to finish the project
Shortest time for completion of the network is equal to the longest path through the network
Forward pass ES ad EF is found for each activity by beginning at the start node and moving from left to right through the network calculating as we go from node to node
Backward pass to calculate LS and LF—we begin by assuming that we would like to complete the project within the critical time identified in the forward pass
Calculating Activity Slack Within limits—if activities on the critical path cannot be delayed without causing the entire
project to be delayed, it follows that activities not on the critical path can be delayed without delaying the project
Slack or float- the amount of time a noncritical task can be delayed without delaying the project
o Slack= LS-ES=LF-EF Any task on the critical path—LS must be the same is EF therefore 0 slack If it finishes later than EF, the activity will be late, causing the project to delay in the project
o Equally true for its LS and ES Assumptions
o When calculating slack for a set of activities on a noncritical path, the calculation for any given activity assumes that no other activity on the same path uses any of the slack
Once activity s underway, if a predecessor activity uses come if its slack, its EF is adjusted accordingly and the ES of successor activities must be corrected
o Critical time for the project is also the projects due date—it is not common for a project to have “project slack”
Milestones may be added to the display quite easily: add desired milestone event as a node with zero duration
o ES=EF, LF=LS o Immediate successors of the activities that result in results o Common to show actual dates for EF, ES, LS, LF
PM primary attention must be paid to activities on the critical path Doing It The Easy Way—Microsoft Project (MSP)
See pages 158-160 for steps in creating networks with MSP
Free slack—the activity can be delayed without affecting the start time of any successor activity
Total slack= LF-EF or LS-ES

CGMS450- Chapter 5- Scheduling the Project
3
5.2 Project Uncertainties And Risk Management Calculating Probabilistic Activity Times
All possible durations for some tasks can be represented by a statistical distribution
Optimistic (a) estimates for a task duration, a, such that the actual duration of the task will
be a or lower less than 1% of the time Pessimistic (b) estimation duration for the same task such that the actual finish time will
be b or greater less than 1% of the time Most likely or “normal duration” (m) Mean of distribution- expected time
o TE=(a+4m+b)/ 6 o Approximation of the mean of a beta distribution
Beta distribution far more flexible than the more common normal distribution o More accurately reflects actual time and cost outcome o Calculation—weighted average of 3 time estimate, a,m,b, using weights of 1-4-1 o Standard deviation σ=(b-a)/6
6 is not a weighted average but rather an assumption that the range of the distribution covers 6 standard deviations (6σ)
o Variance of this distribution is estimated as Var=σ2=((b-a)/6)2
Range of distribution, b-a, covers 6 standard deviations is important Assumes that the estimate actually attempted to judge a and b so that 99.7$ of all cases were
greater than a and less than b o Less then 1% lay outside of these estimates
Estimators are not so uncomfortable making estimates at the 90-95% levels o a is estimated so that 5-10% of all cases are less than a and 5-10% are greater than
b o These levels do not cover 6σ instead we use
95% level σ=(b-a)/3.3 90% level σ=(b-a)/2.6
The Probabilistic Network, An Example Look at page 162-164 for further explanation of the probabilistic network
Once More The Easy Way MSP can easily handle the probabilistic network—does not do some calculations that we
demonstrated Calculations can be easily done by excel The stochastic (synonym for probabilistic) network used for the preceding discussion is
shown as a product of MSP The Probability Of Completing The Project On Time
E.g. what is the probability that a project will be completed 50 days or less o Answered with the information available concerning the level of uncertainty for the
various project activities There is an assumption that should be noted
o Individual variances of the activities in a series of activities may be summed to find the variance of the set of activities on the path itself—if the various activities in the set are statistically independent
o E.g. if a is a predecessor of b and if a is early or late, it will not effect the duration of b
Times when assumption of statistical independence is not met o Re-estimating the duration of tasks o This should be done anytime the resources supplied to a project are different from
those presumed then he duration of a project activities was originally estimated

CGMS450- Chapter 5- Scheduling the Project
4
To complete a project by a specific time requires that all the paths in the projects network by completed by a specified time
o Determining the probability tat a project is completed by a specific time requires calculating the probability that all paths are finished by a specific time
o o D= the desired project completion time o μ= the sum of the TE activities on the path being investigated o σ2
μ= the variance of the path being considered (the sum of the variances of the activities on the path
Simplify the task calculating the probability that a project is completed by a specific time—practical purposes it is reasonable to consider only those paths whose expected completion time have a reasonable chance of being greater than the specified time
Calculate the probability that a project will take longer than any specified time— first calculate the probability that it will take less than the specified time
o Subtracting hat probability from 1 gives us the probability that it will take longer than the specified time
Excel’s NORMDIST function—used as an alternative for calculating the probability that a path finished by a specified time, D
o Syntax of this function = NORMDIST (D,μ,σμ, TRUE) Selecting Risk And Finding D
Client asked when the project output will be available Working this problem backwards
Syntax of this function = NORMDIST (probability, μ,σμ) The Case Of The Unreasonable Boss
PAGE 171- 172 No negative Zs – indicates that D is less than μ
The Problem With Mergers Page172-173
5.3 Simulation Different approach to risk
o Build on probabilistic foundation established in the previous section and use simulation to handle the arithmetic as well—helps us understand the consequences of uncertainty
Simulation analysis can provide insight into the range and distribution of project completion times
Simulate a project instructions for excel pages 174-175 o Simple model for a complex problem o Hardest part of constructing this model is to identify all paths through the network
Small problems are easier Traditional Statistic VS Simulation
Difficulty—making sure that the risk analyst understands risk analysis o Irrespective of how the arithmetic is performed, by human or machine, the analyst
must understand the nature of the calculations—what they mean and what they don’t mean
o Examining many paths through a large network and finding those that may turn our to be critical or near-critical—overwhelming task
Some common issues o Both procedures assume that task durations are statistically independent o May not be the case when resources are shared across tasks but problems can be
handled by re-estimating task durations based on altered resources o Both procedures assume that the paths are independent—even when paths have
tasks in common, the common task durations are the same for every path in which they are an element during any given estimate of path duration by whatever procedure
As if a consent is being added to each path o Simulation has a direct way of circumventing the assumption of statistical
independence if the assumption is not realistic

CGMS450- Chapter 5- Scheduling the Project
5
o Simulation—one simply includes the activity or path dependencies as part of the model
Dependencies are modeled by expressing the functional relationship between the activities paths along with its distribution, mean, and variance—becomes variable in the simulation
o Statistical process—analyst must find the TE and variance for each path Simulation—computers selects a sample rom the distribution of activities
for each activity and then calculates the path duration for each path enumerated
o No matter what method is used—rarely necessary to evaluate every path carefully Large network—many paths will have both sort durations and low
variances when compare to high duration paths Even when it is technically possible for one of the short paths to be
critical—often unlikely o PM will discover the duration of each activity when the activity is complete—after
the fact, regardless of the method used to estimate and calculate project duration o Cannot know till the project is done—
Which of the paths will take the longest time Which path will be critical How much slack the other paths will have
o Can only have reasonable estimates Simulation
o Recommend as preferred tool for risk analysis—only after the analysis understands the underlying theory of the analysis
o Crystal Ball user friendly software that can be used to facilitate and enhance the simulation of the project networks as well as simulate a wide variety of other types of problems
Facilitates the task od selecting the best distributions to be used to model alternative activities if historical data are available for these activities
Can determine the best distribution to se to characterize project completion times and other outputs of the simulation analysis
Comprehensive set of probability distributions available and the selection of these distributions s facilitated by graphically showing the analyst the shape of the distribution based on parameters specified
Display results in variety of formats—frequency charts, cumulative frequency charts, reverse cumulative frequency charts
Provides all relevant descriptive statistics Quick ability to calculate the probability associated with various outcomes
E.g. The probability that a project can be completed by a specified time
o Immediately assess the impact that alternative parameter settings have the shape of the distribution
5.4 The Gantt Chart Henry Gantt—developed the Gantt chard around 1917 Displays project activities as bars measured against a horizontal time scale most popular way of exhibiting sets od related activities in the form of schedules
The Chart Simple Gantt chart
o Task names are usually descriptive o Each task shows its name o WBS number or ID number—in order to identify predecessors

CGMS450- Chapter 5- Scheduling the Project
6
Problems understanding chart o Several tasks begin at the same time and have the same duration o If one such task is on the critical path and the others not—it may be difficult to find
the critical path o Even with software aid—technical dependencies are harder to see on a Gantt chart
than on a PERT/CPM network
Software such a MSP—makes it easy to use Gantt chart or network to view critical tasks and
paths of project o One can experiment ‘what if’ with the project schedule—immediately observing
results of experiments on screen o Simple to enter alternate time estimates and instantly see the impact on the project
duration Information can be added to Gantt charts without making them difficult to read
o Symbols can indicate an event o Milestone symbols , diamonds, in MSP are added to the charts with different
shading or colours to differentiate between “schedule” and “completed” milestones Advantages
o Easy to read o Decorate the walls of the office o Updated easily o Anyone interested can read a Gantt chart, with little to no training—with little no or
no technical knowledge of the project Weakness
o To interpret beyond a simplistic level what appears on the chart or to alter the projects course may require an intimate knowledge of the projects technology
Not necessarily visible on the chart—but available on the network or the project plan
o Deceptive in its apparent simplicity One must be cautious about publicly displaying Gantt charts that include activity slack or LS
and LF o Members of the project team may be tempted to procrastinate and tackle the work
based on LS or LF o This makes the critical path out of a noncritical path—become immediate source of
headaches for the PM Lose the ability to reschedule the resources used by tasks that once had
slack Device in monitoring a project and/ or communicating information on its current state to
others Not adequate replacements for networks Complementary scheduling and control devices

CGMS450- Chapter 5- Scheduling the Project
7
5.5 Extensions To PERT/CPM Precedence Diagramming
PERT/CPM network method—doesn’t allow for leads and lags between 2 activities without
greatly increasing the number of sub-activities to account for this Finish to start activity 2 must not start before activity 1 had been completed
o Typical arrangement of an activity and its predecessor Start to start Activity 5 cannot begin until activity 4 has been underway for at least 2 days Finish to finish Activity 7 must be complete at lease 1 day before activity 8 is completed Start to finish activity 11 cannot be completed before 7 days after the start of activity 10
o Relationship is rare—there are usually simpler ways to map the required relationship
AON network method that easily allows for these leads and lags within the network MSP handles leads and lags without a problem Network nodes times are calculated in a manner similar to PERT/CPM times lead and lag
restrictions- it is often helpful to lay out a Gantt cart to see what is actually happening Final Thoughts On The Use Of These Tools Class notes Producing a schedule... create—
1. Work breakdown structure 2. Logic diagram
a. Relationship between work efforts b. Reality—people skip this step
3. Gantt chart Contingency time/ funds
What is it? o What you plan if something goes wrong
Why is it important? o Creates control
How is it represented? o Padded add extra time to each activity o Reserve “contingency task”
Adds extra time at the end in a separate task o Buffer ‘represented as a arrow’, float technique
Doesn’t show as an activity Allow for contingency
Don’t schedule 100% of you time or allocate 100% of your budget Use buffers of money and time to deal with uncertainty
o Absorbs minor problems leading up to key deliverables o Avoid using padding
Differentiate between project “nice to have”, “must do” deliverables