cfo let’s chat - fordcorporate.ford.com/content/dam/corporate/en/investors/investor... · slides:...
TRANSCRIPT

1
CFO LET’S CHAT November 17, 2016
Bob Shanks
Executive Vice President & CFO
2
AGENDA
Global business environment
North America
‒ Industry sales
‒ Pricing environment
‒ Super Duty / Continental launch
‒ U.S. election results
Europe
‒ Industry sales
‒ Pricing environment
‒ Edge / Kuga launch
Asia Pacific
‒ China industry sales
‒ Pricing environment
‒ China reporting structure
Ford Credit
‒ Auction values / used car pricing
Pension/OPEB
‒ Year end remeasurement / MTM
Taxes
Company outlook 2016 - 2017

3
INDUSTRY AND GDP PLANNING ASSUMPTIONS
GDP Growth (Pct) Industry (Mils)
2015 2016* 2017* 2015 2016* 2017*
Global 3.1% 2.9% 3.6% 88.2 91.1 92.4
U.S. 2.6% 1.6% 2.2% 17.8 17.8 17.7
Brazil (3.8)% (3.5)% 0.8% 2.6 2.0 2.2
Europe 1.2% 1.5% 1.5% 19.2 20.0 20.2
China 6.9% 6.7% 6.7% 23.5 26.1 26.0
* Consistent with Outlook at 3Q earnings and Investor Day

4
2016 KEY BUSINESS UNIT TOPICS
North America
‒ Industry sales
‒ Pricing environment
‒ Super Duty / Continental launch
‒ U.S. election results
Europe
‒ Industry sales
‒ Pricing environment
‒ Edge / Kuga launch
Asia Pacific
‒ China industry sales
‒ Pricing environment
‒ China reporting structure
5
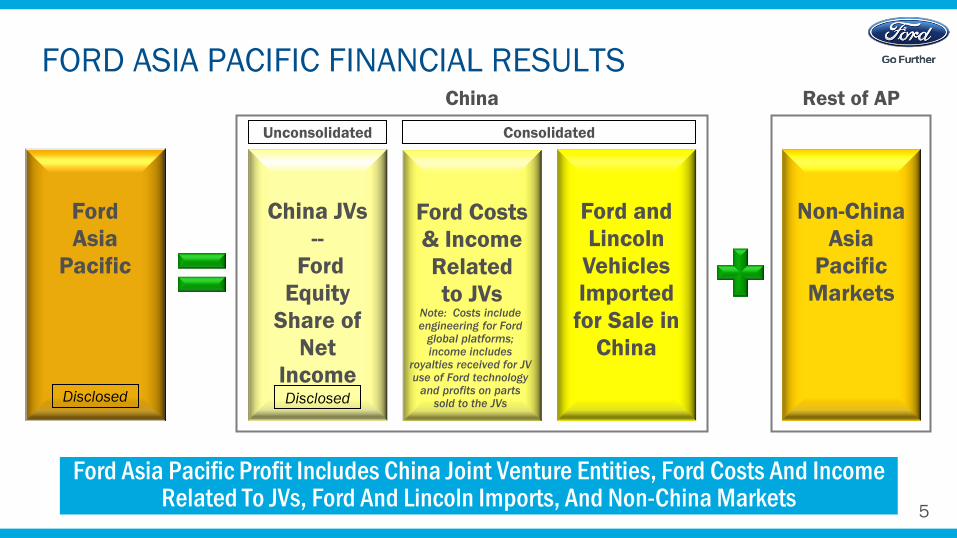
FORD ASIA PACIFIC FINANCIAL RESULTS
Ford Asia Pacific Profit Includes China Joint Venture Entities, Ford Costs And Income Related To JVs, Ford And Lincoln Imports, And Non-China Markets
Ford Costs
& Income
Related
to JVs
Ford
Asia
Pacific
China JVs
--
Ford
Equity
Share of
Net
Income
Ford and
Lincoln
Vehicles
Imported
for Sale in
China
Disclosed
Non-China
Asia
Pacific
Markets
Disclosed
Rest of AP China
Note: Costs include engineering for Ford
global platforms; income includes
royalties received for JV use of Ford technology
and profits on parts sold to the JVs
Unconsolidated Consolidated
6
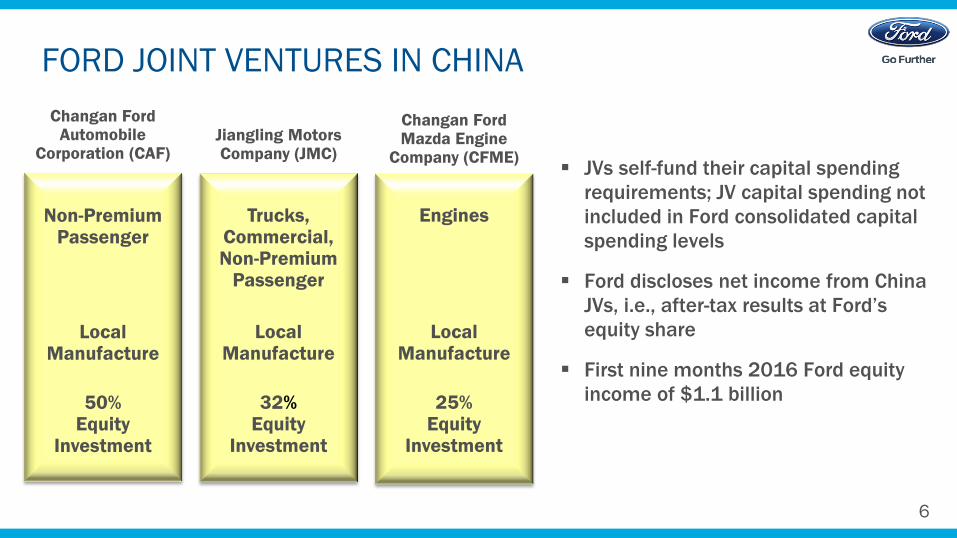
JVs self-fund their capital spending
requirements; JV capital spending not
included in Ford consolidated capital
spending levels
Ford discloses net income from China
JVs, i.e., after-tax results at Ford’s
equity share
First nine months 2016 Ford equity
income of $1.1 billion
FORD JOINT VENTURES IN CHINA
Non-Premium Passenger
Local Manufacture
50% Equity
Investment
Trucks, Commercial, Non-Premium
Passenger
Local Manufacture
32% Equity
Investment
Engines
Local Manufacture
25% Equity
Investment
Changan Ford Automobile
Corporation (CAF)
Changan Ford Mazda Engine
Company (CFME)
Jiangling Motors Company (JMC)
7
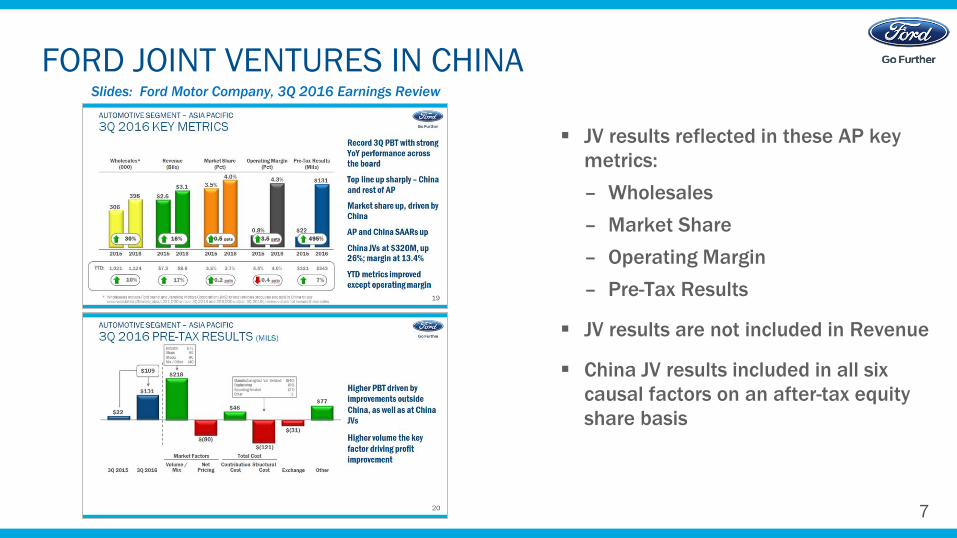
JV results reflected in these AP key
metrics:
– Wholesales
– Market Share
– Operating Margin
– Pre-Tax Results
JV results are not included in Revenue
China JV results included in all six
causal factors on an after-tax equity
share basis
FORD JOINT VENTURES IN CHINA Slides: Ford Motor Company, 3Q 2016 Earnings Review
8
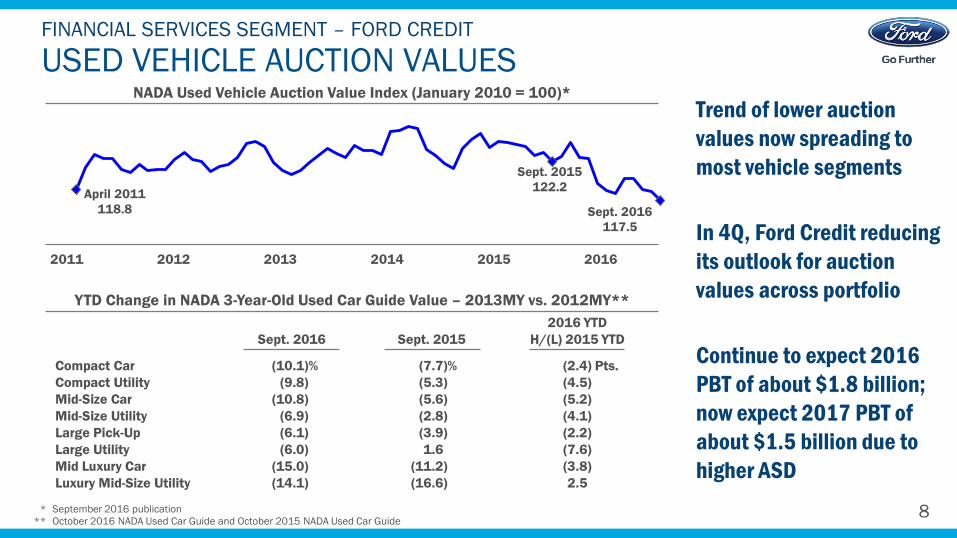
April 2011
118.8
Sept. 2015
122.2
Sept. 2016
117.5
USED VEHICLE AUCTION VALUES FINANCIAL SERVICES SEGMENT – FORD CREDIT
Trend of lower auction
values now spreading to
most vehicle segments
In 4Q, Ford Credit reducing
its outlook for auction
values across portfolio
Continue to expect 2016
PBT of about $1.8 billion;
now expect 2017 PBT of
about $1.5 billion due to
higher ASD
* September 2016 publication
** October 2016 NADA Used Car Guide and October 2015 NADA Used Car Guide
NADA Used Vehicle Auction Value Index (January 2010 = 100)*
YTD Change in NADA 3-Year-Old Used Car Guide Value – 2013MY vs. 2012MY**
2016 2015 2014 2013 2012 2011
2016 YTD
Sept. 2016 Sept. 2015 H/(L) 2015 YTD
Compact Car (10.1)% (7.7)% (2.4) Pts.
Compact Utility (9.8) (5.3) (4.5)
Mid-Size Car (10.8) (5.6) (5.2)
Mid-Size Utility (6.9) (2.8) (4.1)
Large Pick-Up (6.1) (3.9) (2.2)
Large Utility (6.0) 1.6 (7.6)
Mid Luxury Car (15.0) (11.2) (3.8)
Luxury Mid-Size Utility (14.1) (16.6) 2.5
9
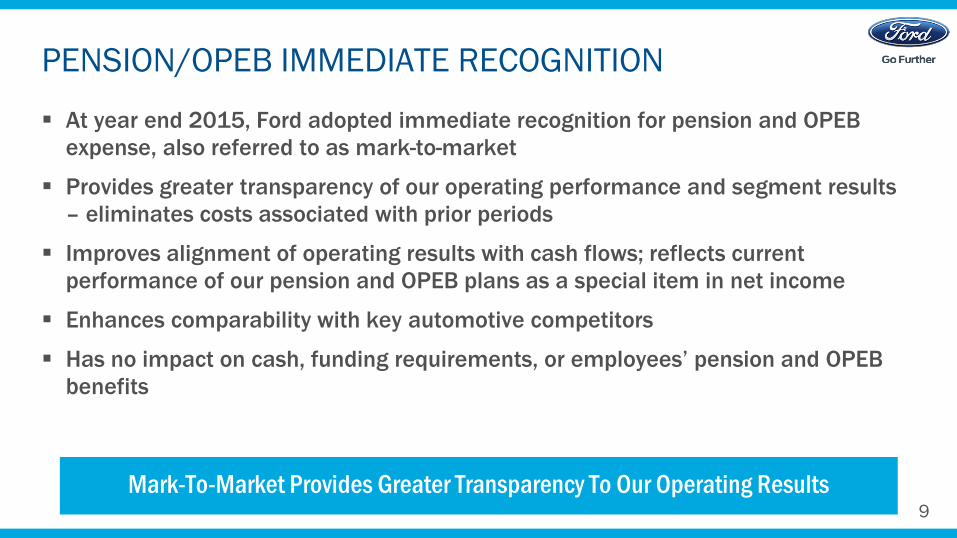
At year end 2015, Ford adopted immediate recognition for pension and OPEB
expense, also referred to as mark-to-market
Provides greater transparency of our operating performance and segment results
– eliminates costs associated with prior periods
Improves alignment of operating results with cash flows; reflects current
performance of our pension and OPEB plans as a special item in net income
Enhances comparability with key automotive competitors
Has no impact on cash, funding requirements, or employees’ pension and OPEB
benefits
PENSION/OPEB IMMEDIATE RECOGNITION
Mark-To-Market Provides Greater Transparency To Our Operating Results

10
Recognized as Fourth Quarter special item
Consistent with year end discount rates and asset values. Expected year end 2016
discount rates:
– Down in all markets from year end 2015
– Have limited U.S. impact as a result of de-risking strategy
– Down significantly in U.K. and Germany, where de-risking is less advanced*
– Are offset partially by higher asset returns
Along with normal accruals and contributions recorded throughout the year,
remeasurement impacts the year-over-year change in funded status
* Based on 11/11/2016 estimated discount rates compared with 12/31/15 discount rates
PENSION/OPEB YEAR END REMEASUREMENT
Remeasurement Can Be Estimated Using Data Provided In Our 10-K / 10-Q
11
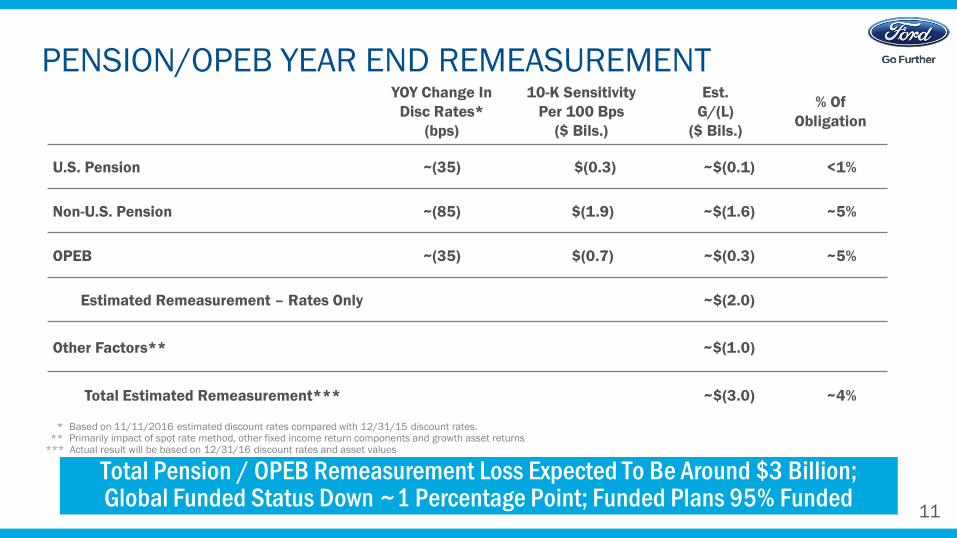
PENSION/OPEB YEAR END REMEASUREMENT
Total Pension / OPEB Remeasurement Loss Expected To Be Around $3 Billion; Global Funded Status Down ~1 Percentage Point; Funded Plans 95% Funded
YOY Change In
Disc Rates*
(bps)
10-K Sensitivity
Per 100 Bps
($ Bils.)
Est.
G/(L)
($ Bils.)
% Of
Obligation
U.S. Pension ~(35) $(0.3) ~$(0.1) <1%
Non-U.S. Pension ~(85) $(1.9) ~$(1.6) ~5%
OPEB ~(35) $(0.7) ~$(0.3) ~5%
Estimated Remeasurement – Rates Only ~$(2.0)
Other Factors** ~$(1.0)
Total Estimated Remeasurement*** ~$(3.0) ~4%
* Based on 11/11/2016 estimated discount rates compared with 12/31/15 discount rates. ** Primarily impact of spot rate method, other fixed income return components and growth asset returns *** Actual result will be based on 12/31/16 discount rates and asset values

12
2016 COMPANY GUIDANCE
We Continue To Expect 2016 Full Year Adjusted Pre-Tax Profit To Be About $10.2 Billion; Adjusted Effective Tax Rate Revised
2015 FY 2016 FY Memo:
Results Plan Outlook
2016 3Q
YTD
Results
Total Company Adjusted Pre-Tax Results* $10.8B ≥ 2015 ≈ $10.2B $8.2B
Adjusted EPS* $1.93 ≥ 2015 Lower $1.46
Automotive Segment Revenue $140.6B ≥ 2015 On Track $105.5B
Automotive Segment Operating Margin 6.8% ≥ 2015 Lower 7.0%
Automotive Segment Operating Cash Flow $7.3B Strong, but
< 2015 On Track $4.9B
Adjusted Effective Tax Rate* (Pct) 28.6% Low 30s High 20s 29.1%
* Excluding special items; see Appendix for detail, reconciliation to GAAP, and definitions. GAAP effective tax rate for 2016 Outlook also high 20s

$0
13
Slide: 2016 Investor Day Presentation

14
Q&A

15
RISK FACTORS Statements included or incorporated by reference herein may constitute "forward-looking statements" within the meaning of the Private Securities Litigation Reform Act of 1995. Forward-looking statements are based on
expectations, forecasts, and assumptions by our management and involve a number of risks, uncertainties, and other factors that could cause actual results to differ materially from those stated, including, without limitation:
Decline in industry sales volume, particularly in the United States, Europe, or China due to financial crisis, recession, geopolitical events, or other factors;
Decline in Ford's market share or failure to achieve growth;
Lower-than-anticipated market acceptance of Ford's new or existing products or services;
Market shift away from sales of larger, more profitable vehicles beyond Ford's current planning assumption, particularly in the United States;
An increase in or continued volatility of fuel prices, or reduced availability of fuel;
Continued or increased price competition resulting from industry excess capacity, currency fluctuations, or other factors;
Fluctuations in foreign currency exchange rates, commodity prices, and interest rates;
Adverse effects resulting from economic, geopolitical, or other events;
Economic distress of suppliers that may require Ford to provide substantial financial support or take other measures to ensure supplies of components or materials and could increase costs, affect liquidity, or cause
production constraints or disruptions;
Work stoppages at Ford or supplier facilities or other limitations on production (whether as a result of labor disputes, natural or man-made disasters, tight credit markets or other financial distress, production constraints or
difficulties, or other factors);
Single-source supply of components or materials;
Labor or other constraints on Ford's ability to maintain competitive cost structure;
Substantial pension and postretirement health care and life insurance liabilities impairing our liquidity or financial condition;
Worse-than-assumed economic and demographic experience for postretirement benefit plans (e.g., discount rates or investment returns);
Restriction on use of tax attributes from tax law "ownership change”;
The discovery of defects in vehicles resulting in delays in new model launches, recall campaigns, or increased warranty costs;
Increased safety, emissions, fuel economy, or other regulations resulting in higher costs, cash expenditures, and / or sales restrictions;
Unusual or significant litigation, governmental investigations, or adverse publicity arising out of alleged defects in products, perceived environmental impacts, or otherwise;
A change in requirements under long-term supply arrangements committing Ford to purchase minimum or fixed quantities of certain parts, or to pay a minimum amount to the seller ("take-or-pay" contracts);
Adverse effects on results from a decrease in or cessation or clawback of government incentives related to investments;
Inherent limitations of internal controls impacting financial statements and safeguarding of assets;
Cybersecurity risks to operational systems, security systems, or infrastructure owned by Ford, Ford Credit, or a third-party vendor or supplier;
Failure of financial institutions to fulfill commitments under committed credit and liquidity facilities;
Inability of Ford Credit to access debt, securitization, or derivative markets around the world at competitive rates or in sufficient amounts, due to credit rating downgrades, market volatility, market disruption, regulatory
requirements, or other factors;
Higher-than-expected credit losses, lower-than-anticipated residual values, or higher-than-expected return volumes for leased vehicles;
Increased competition from banks, financial institutions, or other third parties seeking to increase their share of financing Ford vehicles; and
New or increased credit regulations, consumer or data protection regulations, or other regulations resulting in higher costs and / or additional financing restrictions.
We cannot be certain that any expectation, forecast, or assumption made in preparing forward-looking statements will prove accurate, or that any projection will be realized. It is to be expected that there may be differences
between projected and actual results. Our forward-looking statements speak only as of the date of their initial issuance, and we do not undertake any obligation to update or revise publicly any forward-looking statement,
whether as a result of new information, future events, or otherwise. For additional discussion, see "Item 1A. Risk Factors" in our Annual Report on Form 10-K for the year ended December 31, 2015, as updated by subsequent
Quarterly Reports on Form 10-Q and Current Reports on Form 8-K.

APPENDIX

17
SPECIAL ITEMS TOTAL COMPANY
(Mils, except amounts per share data) 3Q YTD Memo:
2015 2016 2015 2016 FY 2015
Pre-tax Special Items
Separation-related actions $ -- $ (17) $ -- $ (293) $ --
Japan / Indonesia market closure -- (9) -- (26) --
Nemak IPO 166 -- 166 -- 150
Pension & OPEB remeasurement gains / (losses) -- -- -- (11) (698)
Total Pre-tax special items $ 166 $ (26) $ 166 $ (330) $ (548)
Tax Special Items
Net tax effect of Pre-tax special items $ (58) $ 9 $ (58) $ 116 $ 205
Tax expense of entity restructurings -- (69) -- (243) --
Total tax special items $ (58) $ (60) $ (58) $ (127) $ 205
Memo:
Special items impact on earnings per share $ 0.03 $ (0.02) $ 0.03 $ (0.11) $ (0.09)
A1
18
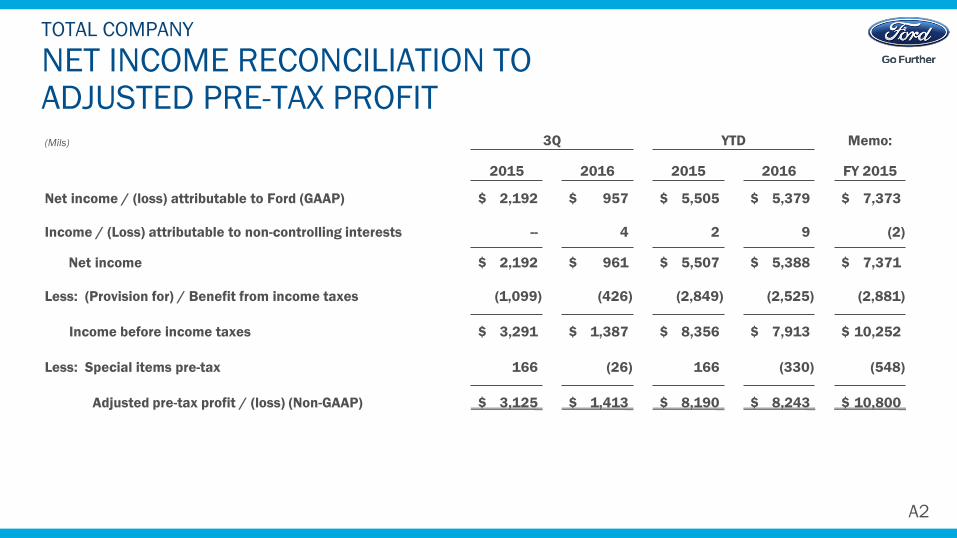
NET INCOME RECONCILIATION TO ADJUSTED PRE-TAX PROFIT
TOTAL COMPANY
A2
(Mils) 3Q YTD Memo:
2015 2016 2015 2016 FY 2015
Net income / (loss) attributable to Ford (GAAP) $ 2,192 $ 957 $ 5,505 $ 5,379 $ 7,373
Income / (Loss) attributable to non-controlling interests -- 4 2 9 (2)
Net income $ 2,192 $ 961 $ 5,507 $ 5,388 $ 7,371
Less: (Provision for) / Benefit from income taxes (1,099) (426) (2,849) (2,525) (2,881)
Income before income taxes $ 3,291 $ 1,387 $ 8,356 $ 7,913 $ 10,252
Less: Special items pre-tax 166 (26) 166 (330) (548)
Adjusted pre-tax profit / (loss) (Non-GAAP) $ 3,125 $ 1,413 $ 8,190 $ 8,243 $ 10,800
19
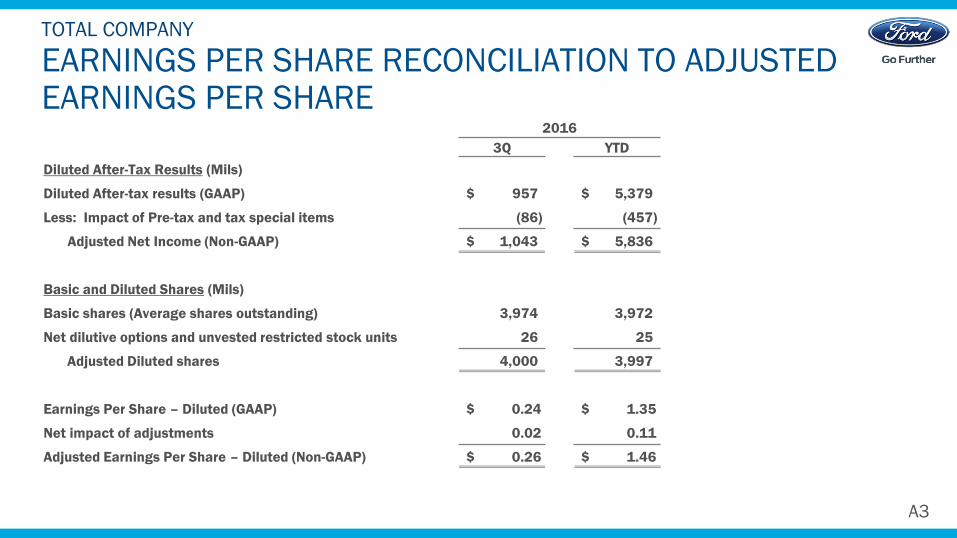
EARNINGS PER SHARE RECONCILIATION TO ADJUSTED EARNINGS PER SHARE
TOTAL COMPANY
A3
2016
3Q YTD
Diluted After-Tax Results (Mils)
Diluted After-tax results (GAAP) $ 957 $ 5,379
Less: Impact of Pre-tax and tax special items (86) (457)
Adjusted Net Income (Non-GAAP) $ 1,043 $ 5,836
Basic and Diluted Shares (Mils)
Basic shares (Average shares outstanding) 3,974 3,972
Net dilutive options and unvested restricted stock units 26 25
Adjusted Diluted shares 4,000 3,997
Earnings Per Share – Diluted (GAAP) $ 0.24 $ 1.35
Net impact of adjustments 0.02 0.11
Adjusted Earnings Per Share – Diluted (Non-GAAP) $ 0.26 $ 1.46
20
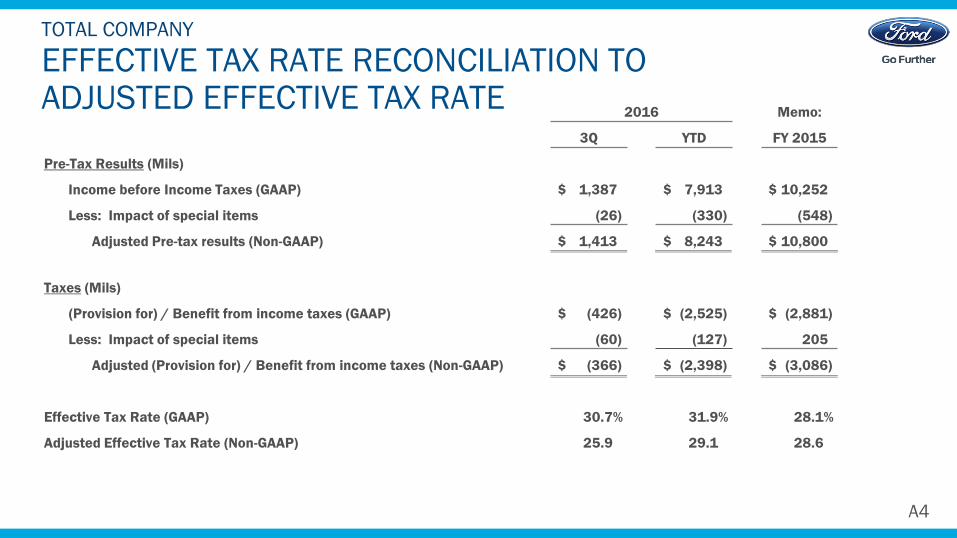
2016 Memo:
3Q YTD FY 2015
Pre-Tax Results (Mils)
Income before Income Taxes (GAAP) $ 1,387 $ 7,913 $ 10,252
Less: Impact of special items (26) (330) (548)
Adjusted Pre-tax results (Non-GAAP) $ 1,413 $ 8,243 $ 10,800
Taxes (Mils)
(Provision for) / Benefit from income taxes (GAAP) $ (426) $ (2,525) $ (2,881)
Less: Impact of special items (60) (127) 205
Adjusted (Provision for) / Benefit from income taxes (Non-GAAP) $ (366) $ (2,398) $ (3,086)
Effective Tax Rate (GAAP) 30.7% 31.9% 28.1%
Adjusted Effective Tax Rate (Non-GAAP) 25.9 29.1 28.6
EFFECTIVE TAX RATE RECONCILIATION TO ADJUSTED EFFECTIVE TAX RATE
TOTAL COMPANY
A4

21
NON-GAAP FINANCIAL MEASURES THAT SUPPLEMENT GAAP MEASURES We use both GAAP and non-GAAP financial measures for operational and financial decision making, and to assess Company and segment business performance. The
non-GAAP measures listed below are intended to be considered by users as supplemental information to their equivalent GAAP measures, to aid investors in better
understanding our financial results. We believe that these non-GAAP measures provide useful perspective on underlying business results and trends, and a means to assess
our period-over-period results. These non-GAAP measures should not be considered as a substitute for, or superior to measures of financial performance prepared in
accordance with GAAP. These non-GAAP measures may not be the same as similarly titled measures used by other companies due to possible differences in method and in
items or events being adjusted.
Total Company Adjusted Pre-tax Profit (Most Comparable GAAP Measure: Net income attributable to Ford) – The non-GAAP measure is useful to management and investors
because it allows users to evaluate our pre-tax results excluding pre-tax special items. Pre-tax special items consist of (i) pension and OPEB remeasurement gains and losses
that are not reflective of our underlying business results, (ii) significant restructuring actions related to our efforts to match production capacity and cost structure to market
demand and changing model mix, and (iii) other items that we do not necessarily consider to be indicative of earnings from ongoing operating activities.
Adjusted Earnings Per Share (Most Comparable GAAP Measure: Earnings Per Share) – Measure of Company’s diluted net earnings per share adjusted for impact of pre-tax
special items (described above), and tax special items. The measure provides investors with useful information to evaluate performance of our business excluding items not
indicative of underlying run rate of our business.
Adjusted Effective Tax Rate (Most Comparable GAAP Measure: Effective Tax Rate) – Measure of Company’s tax rate excluding pre-tax special items (described above) and tax
special items. The measure provides an ongoing effective rate which investors find useful for historical comparisons and for forecasting.
Ford Credit Managed Receivables – (Most Comparable GAAP Measure: Net Finance Receivables plus Net Investment in Operating Leases) – Measure of Ford Credit’s Total net
receivables, excluding unearned interest supplements and residual support, allowance for credit losses, and other (primarily accumulated supplemental depreciation). The
measure is useful to management and investors as it closely approximates the customer’s outstanding balance on the receivables, which is the basis for earning revenue.
Ford Credit Managed Leverage (Most Comparable GAAP Measure: Financial Statement Leverage) – Ford Credit’s debt-to-equity ratio adjusted (i) to exclude cash, cash
equivalents, and marketable securities (other than amounts related to insurance activities), and (ii) for derivative accounting. The measure is useful to investors because it
reflects the way Ford Credit manages its business. Cash, cash equivalents, and marketable securities are deducted because they generally correspond to excess debt beyond
the amount required to support operations and on-balance sheet securitization transactions. Derivative accounting adjustments are made to asset, debt, and equity positions
to reflect the impact of interest rate instruments used with Ford Credit’s term-debt issuances and securitization transactions. Ford Credit generally repays its debt obligations
as they mature, so the interim effects of changes in market interest rates are excluded in the calculation of managed leverage.
A5