cfd:computationalfluiddynamicsorconfoundingfactor ... the use of cfd analysis of patient ia...
TRANSCRIPT

REVIEW ARTICLE
CFD: Computational Fluid Dynamics or Confounding FactorDissemination? The Role of Hemodynamics in Intracranial
Aneurysm Rupture Risk AssessmentJ. Xiang, V.M. Tutino, K.V. Snyder, and H. Meng
ABSTRACT
SUMMARY: Image-based computational fluid dynamics holds a prominent position in the evaluation of intracranial aneurysms, especiallyas a promising tool to stratify rupture risk. Current computational fluid dynamics findings correlating both high and low wall shear stresswith intracranial aneurysm growth and rupture puzzle researchers and clinicians alike. These conflicting findings may stem from inconsis-tent parameter definitions, small datasets, and intrinsic complexities in intracranial aneurysm growth and rupture. In Part 1 of this 2-partreview, we proposed a unifying hypothesis: both high and low wall shear stress drive intracranial aneurysm growth and rupture throughmural cell–mediated and inflammatory cell–mediated destructive remodeling pathways, respectively. In the present report, Part 2, wedelineate different wall shear stress parameter definitions and survey recent computational fluid dynamics studies, in light of thismechanistic heterogeneity. In the future, we expect that larger datasets, better analyses, and increased understanding of hemodynamic-biologic mechanisms will lead to more accurate predictive models for intracranial aneurysm risk assessment from computational fluiddynamics.
ABBREVIATIONS: CFD � computational fluid dynamics; IA � intracranial aneurysm; LSA � low shear-stress area; MWSS � maximum wall shear stress; OSI �oscillatory shear index; TAWSS � time-averaged wall shear stress; WSS � wall shear stress
Image-based computational fluid dynamics (CFD) holds a
prominent position in the patient-specific evaluation of intra-
cranial aneurysms (IAs). Hemodynamic parameters, particularly
those related to aneurysmal wall shear stress (WSS), the frictional
force of flowing blood on the vessel lumen, have been shown to
correlate with IA growth1-3 and rupture.4,5 Consequently, the
clinical community has taken an interest in not only the intuitive
and esthetic aspects of CFD simulations (dubbed “color for doc-
tors”)6 but also the enormous potential of CFD to provide objec-
tive, quantitative, and mechanism-based markers of aneurysm
rupture risk.
In a recent American Journal of Neuroradiology editorial,
Kallmes7 raised concerns regarding the current status of CFD
studies and their clinical utility in IA rupture risk assessments,
asking if CFD should alternatively be interpreted as “confounding
factor dissemination.” This thought- and debate-provoking ques-
tion reflects wide concerns over the growing number of hemody-
namic parameters and conflicting findings reported in the current
literature. Indeed, 3 other editorials published in the same jour-
nal8-10 appeared shortly after Kallmes’s editorial. Cebral and
Meng8 offered the first counterpoint, in which they commented
that inconsistencies in hemodynamic parameter definitions and
conflicting findings reflect exploratory efforts of isolated groups
with small datasets; yet, more importantly, the conflicting find-
ings could originate from the intrinsic complexity of aneurysm
growth and rupture mechanisms and our scarce knowledge
about them. Intracranial aneurysm has long been suspected to
be a highly heterogeneous disease, containing several disease
types.10,11 As Strother and Jiang10 pointed out in their edito-
rial, IA may even be a spectrum of a disease or even multiple
separate diseases.
Currently, conflicting results concerning aneurysmal WSS,
the most frequently explored hemodynamic parameter of aug-
mented rupture risk, puzzle the IA research and clinical commu-
nities. Both high and low WSS have been found to be correlated
with IA growth and rupture.1-5,12,13 Prompted by this “high-ver-
sus-low WSS” controversy, we published Part 1 of a 2-part review,
in which we proposed a unified hypothesis regarding the roles of
high and low WSS in IA growth and rupture.11 That review aimed
From the Toshiba Stroke and Vascular Research Center (J.X., V.M.T., K.V.S., H.M.)and Departments of Neurosurgery (J.X.), Biomedical Engineering (V.M.T.), and Me-chanical and Aerospace Engineering (H.M.), University at Buffalo, State Universityof New York, Buffalo, New York.
Grant support (H.M.) was provided by the National Institutes of Health(5R01NS064592) and Toshiba Medical Systems.
Please address correspondence to Hui Meng, PhD, Toshiba Stroke and VascularResearch Center, University at Buffalo, Clinical and Translational Research Center,875 Ellicott St, Buffalo, NY 14203; e-mail: [email protected]
Indicates open access to non-subscribers at www.ajnr.org
Indicates article with supplemental on-line tables
http://dx.doi.org/10.3174/ajnr.A3710
AJNR Am J Neuroradiol 35:1849 –57 Oct 2014 www.ajnr.org 1849

at providing new insight into the complex hemodynamic-biologic
mechanisms underlying IA pathophysiology. In brief, we pro-
posed that both high and low WSS could drive IA growth and
rupture. On the basis of published studies on pathologic vascular
responses to hemodynamics in IA genesis14,15 and atherosclero-
sis,16 we hypothesized that these 2 aberrant hemodynamic condi-
tions could elicit different destructive vascular remodeling path-
ways, mediated by mural cells and inflammatory cell infiltrates,
respectively. Such diversity in the driving hemodynamics and
elicited biologic pathways may generate the observed heterogene-
ity of IA phenotypes. Understanding this intrinsic mechanistic
complexity could help us to better characterize and converge in-
consistent CFD findings.
To follow up, this work serves as Part 2 of this 2-part review.
We delineate commonly used definitions of WSS and related pa-
rameters, provide a detailed survey on how WSS can be defined
and used in image-based CFD studies, and describe how it has
been related to IA growth and rupture. In conjunction with Part 1,
we hope this review sheds light on the disparate CFD findings
concerning the role of WSS in IA growth and rupture.
Current Status of Image-Based CFD Studies ofAneurysmal HemodynamicsHemodynamics plays a central role throughout IA natural his-
tory.11 Because of a lack of appropriate animal models to study
hemodynamic-biologic mechanisms, investigators have resorted
to the use of CFD analysis of patient IA images1-5,12,13,17-38 to
identify hemodynamic characteristics and explore potential
mechanisms associated with IA growth and rupture. The capabil-
ity of image-based CFD to investigate detailed 3D aneurysmal
hemodynamics, combined with the availability of segmentation
tools such as the Vascular Modeling Toolkit (www.vmtk.org),39
has contributed to an increasing number of hemodynamic IA
studies over the past 2 decades. There have been several large,
multi-nation projects that use image-based CFD to study aneu-
rysms. For example, the @neurIST project, with a €17 million
budget, gathered data from 28 public and private institutions in
12 European countries from 2006 –2010.40-42
Over the past 10 years, the number of publications in this field
has increased nearly exponentially,9 as image-based CFD studies
have grown broader and deeper. Simulations have steadily mi-
grated from idealized geometries to patient-specific IA geome-
tries, from steady-state flow to pulsatile flow, and from qualitative
flow pattern descriptions20,22,23,43 to sophisticated quantitative
statistical analyses.4,5,30 Furthermore, efforts to bolster statistical
power have increased the number of patient-specific IA cases per
hemodynamic study from 1 (in the year 2003)44 to 210 (in the year
2011).5 Worldwide interactions between engineers and clinicians,
exemplified by the annual International Intracranial Stent Meet-
ing (http://www.ics-meeting.net), have stressed the dire medical
need for clinically relevant information, including rupture risk
assessments.
The rising number of CFD studies has resulted in a growing
number of proposed hemodynamic parameters related to IA
growth and rupture. On-line Table 1 summarizes the most com-
monly defined hemodynamic parameters in these studies.
Clearly, WSS has been the focus because it is a measurable biome-
chanical factor (obtained from CFD calculation) that holds the
promise of reporting and predicting IA development.
WSS in Aneurysm Development
WSS and Pressure in IA Pathologic Remodeling. Wall shear stress
directly acts on the luminal surface of vascular endothelial cells to
stimulate biologic responses through the main stages of IA natural
history. As shown in Fig 2A of Part 1,11 blood flow interacts with
the IA wall by exerting both pressure and WSS. Blood pressure
elicits tensile stresses in the wall, which, when unbalanced, stim-
ulate medial cell–mediated collagen synthesis and cross-linking
and collagen degradation.45 Wall shear stress, on the other hand,
is sensed by endothelial cells, which transduce this mechanical
signal into biologic signals, activating biochemical pathways that
maintain vascular homeostasis and regulate remodeling.46 Aber-
rant levels of WSS elicit endothelial cell–mediated pathologic
responses, including pro-inflammatory behavior,16 matrix
metalloproteinase activation,47 cell death,48 extracellular matrix
degradation, and destructive remodeling.15,49,50
Although both tensile stress and WSS can affect aneurysmal
pathobiology, the current exploration of WSS-mediated effects
appears to offer a greater clinical utility for the following reasons:
1) Patient-specific in vivo flow dynamic simulation, that is, CFD,
and WSS analyses can be routinely performed from existing med-
ical imaging modalities (DSA, CTA, MRA). Conversely, tensile
stress calculation requires knowledge of patient-specific, in vivo
wall thickness and material properties, which are unavailable
from current imaging capabilities. 2) The simplified analyses of
tensile stress–mediated pathways involve collagen turnover in re-
sponse to imbalanced wall stresses. Theoretically, this process
should reduce the imbalance and ultimately lead to IA stabiliza-
tion, not to unbound growth or rupture.51 The rupture event
itself, a catastrophe that results when wall stress exceeds wall
strength, is precipitated by a local weakening of the IA wall result-
ing from pathologic remodeling.45 Without the means to monitor
wall stress and wall strength, it is impossible to predict when an IA
will rupture. However, because pathologic remodeling is partially
mediated by abnormal WSS, which can persist throughout IA
natural history, WSS may be a suitable for clinical application at
this stage.
Various Definitions of WSS. By definition, WSS is a mechanical
stress that acts tangential to the vessel lumen. For unsteady flow
(which is always the case for patient aneurysms), instantaneous
WSS can change its magnitude and direction with space and time.
Motivated by different hypotheses regarding the hemodynamic
conditions driving IA progression, CFD researchers have ex-
plored different variations of WSS definitions.
To reflect the hypothesis that lasting exposure to abnormal
WSS potentiates wall weakening, WSS has been most commonly
reported as the time-averaged magnitude of WSS (the mathemat-
ical definition is given in the first row of On-line Table 1), or
TAWSS. Time-averaged wall shear stress is defined point-wise on
the lumen of the vessel and plotted as a surface distribution. Un-
less explicitly stated otherwise, time-averaging over 1 cardiac cycle
is usually implied. Occasionally, however, instantaneous WSS at a
1850 Xiang Oct 2014 www.ajnr.org

certain time point in the cardiac cycle, such as peak systole or
diastole, is used instead of TAWSS.
To compare the overall level of WSS among different aneu-
rysms for risk stratification, TAWSS is sometimes further spatially
averaged over the entire aneurysm sac, such that each aneurysm
has one average aneurysmal WSS value.5,30,31 Alternatively, some
authors prefer to examine the spatial maximum (MWSS in On-
line Table 1) of TAWSS in an aneurysm. Both values require iden-
tification of the IA neck and an objective method to isolate the
aneurysm.52,53
To remove the dependence of WSS values on the inlet flow
condition, the time- and space-averaged aneurysmal WSS can be
normalized by the average parent vessel WSS value to become a
nondimensional number4 (second row in On-line Table 1). It has
been suggested that normalized WSS is more reliable than the
absolute WSS when used to stratify IA rupture risk,4 especially
when patient-specific inlet flow conditions are unavailable and
CFD simulations are carried out under assumed inlet flow condi-
tions. When surrogate (assumed) inlet flow boundary conditions
are used, the CFD-generated absolute aneurysmal WSS values are
not meaningful; only relative values are meaningful. Normaliza-
tion by parent vessel WSS generated from the same CFD simula-
tion minimizes the dependence on inlet conditions. Furthermore,
this normalized ratio compares the pathologic IA wall with the
healthy parent vessel wall, as a baseline. In parallel to such ap-
proaches in hemodynamic studies, recent morphologic studies
have shown that to better inform rupture risk, aneurysm size
should be evaluated relative to the parent vessel diameter (thus
generating an important new morphologic metric, size ratio).54
Size ratio is potentially better at predicting IA rupture risk than
aneurysm size only.4,54-56 Similarly, aneurysmal WSS values
might be better evaluated against a healthy baseline from the in-
dividual at a specific location, for example, WSS values from the
parent vessel.
Besides responding to TAWSS directly, endothelial cells
respond to temporal oscillations and spatial gradients of
WSS.16,57,58 The hypothesis that directional variations of WSS
induce pathologic endothelial cell responses (as in atherogenesis)
is reflected by the oscillatory shear index (OSI), a dimensionless
metric of directional changes in WSS59 (third row in On-line Ta-
ble 1). Oscillatory shear index is often used to describe the distur-
bance of a flow field. Additionally, spatial WSS gradient, the de-
rivative of WSS along the flow direction, is also considered in
some studies.4 Variations of these factors, for example, low shear-
stress area (LSA)4 and gradient oscillatory number factor (GON
factor),60 are summarized in On-line Table 1.
It is important to recognize that instantaneous WSS is a vector.
During a cardiac cycle, the unsteady aneurysmal flow leaves im-
prints of flickering, swirling, and dancing WSS vectors on the
luminal surface, forming various patterns such as sources, sinks,
or streets. The definitions of WSS-derived hemodynamic factors
above are degenerated forms that account only for the magnitude
of WSS (as in TAWSS) or the magnitude of the cycle-averaged
vector (as in OSI). How endothelial cells respond to various pat-
terns of instantaneous WSS vectors is unknown but could play an
important role in the pathologic remodeling leading to IA growth
and rupture. When new evidence indicates such roles, new hemo-
dynamic parameters capturing these characteristics may need to
be defined.
Currently, a plethora of WSS definitions and other flow pa-
rameters are confusing to both the clinical and engineering com-
munities.7-10 Findings from different studies correlating WSS to
IA progression are not converging: both high and low WSS are
correlated to growth and rupture. To gain a better understanding
of these divergent findings, we systematically review the current
literature on hemodynamic studies correlating high and low WSS
to IA growth and rupture in the following 2 sections.
CFD Studies of High and Low WSS in Aneurysm GrowthThe investigation of IA growth requires longitudinally following
patients with 3D imaging. Because of a lack of reliable risk assess-
ment systems, discovered IAs are often defensively treated, leav-
ing only a small number of aneurysms for conservative observa-
tion and periodic imaging.1,2,17 These IAs tend to be small or have
no clear, safe surgical options.1,2,17 Thus, only a limited number
of studies have been able to investigate the hemodynamics of
growing IAs.
In On-line Table 2, we summarize 5 published studies that inves-
tigated patient-specific hemodynamics during IA growth.1-3,17,19
The number of patients in these studies ranged from 1 to 25.
Impressively, 41-3,17 of the 5 studies used patient-specific inlet
boundary conditions (velocity from phase-contrast MRA), which
is more accurate for CFD simulation than the widely used, as-
sumed inlet flow conditions.
Three of these studies found a correlation between IA growth
and low aneurysmal WSS. Jou et al1 demonstrated this correlation
in their CFD analysis of 2 aneurysms. Additionally, a serial study
containing baseline imaging and 4 follow-ups by Acevedo-Bolton
et al2 found that the region of maximal growth in a giant basilar
trunk IA consistently had the lowest WSS (Fig 1A).2 The same
group analyzed 7 growing aneurysms in a follow-up study and
found a linear correlation between the local displacement of the
IA wall (that is, enlargement) and low WSS, as shown in Fig 1B.17
Studies by Sugiyama et al3 and Sforza et al,19 however, found
that both low WSS and high WSS were associated with aneurysm
growth. Sugiyama et al3 reported 2 adjacent growing aneurysms
in 1 patient, each with different hemodynamic characteristics and
growing patterns. They found that the distal growing aneurysm
was associated with low and oscillatory WSS in the entire aneu-
rysm sac, whereas the proximal aneurysm was subjected to local
high flow in the growing lobe.3 In the other study, Sforza et al19
followed several growing aneurysms. The growth of 3 aneurysms
was correlated with high WSS impingement at the dome, whereas
the growth of 2 aneurysms was correlated with low WSS at the
dome.
These inconsistent findings may be attributed to a limited
number of cases and thus selection biases. However, we believe
that these contradictions may stem from the intrinsic mechanistic
complexity of IAs. As hypothesized in Part 1,11 both high and low
WSS could drive IA progression. To confirm this, future investi-
gations of IA growth would need to collect a larger volume of
longitudinal data despite the inherent difficulties in building
large, unskewed databases of unruptured growing IAs. One pos-
sible solution would be to implement population-based screening
AJNR Am J Neuroradiol 35:1849 –57 Oct 2014 www.ajnr.org 1851

methods. For example, in Japan, screening of the population to
detect and monitor IAs has provided the opportunity to longitu-
dinally follow unruptured aneurysms. However, these conserva-
tively followed IAs tend to be small, because large and giant IAs
are probably treated rather than monitored.28,31
CFD Studies of High and Low WSS in Aneurysm RuptureWhereas longitudinal data are needed to study aneurysm growth,
cross-sectional data have been used to study IA rupture, account-
ing for a larger number of rupture risk assessment studies. By
extracting hemodynamic features of ruptured IAs and comparing
them with those of unruptured IAs, these studies implicitly as-
sume that unruptured aneurysms resembling ruptured aneu-
rysms are at higher risk of rupture than those that do not. Thus,
hemodynamic parameters that significantly distinguish ruptured
from unruptured IAs have been explored and suggested as poten-
tial markers for rupture risk.
In On-line Table 3, we chronologically summarize 24 studies
that performed CFD on patient-specific aneurysm geometries in
search of correlations between aneurysmal hemodynamics and
rupture. The number of aneurysm cases in each study ranged
from 6 –210. Whereas all 24 studies included pulsatile CFD sim-
ulations, none used patient-specific flow waveforms at inlet
boundaries. As for the specification of inlet flow magnitude, dif-
ferent authors adopted different assumptions across different
cases, namely the same flow velocity,12,27,33,34 the same flow
rate,4,13,20,28,30,31,35 or the same WSS.5,22-26,43,61 The specified
values were either taken from the literature or measured from one
subject. Because the inlet boundary condition specified in this way
is not patient-specific, absolute levels of physical quantities, such
as WSS, calculated from CFD are not accurate. However, the dis-
tributions and relative levels of these hemodynamic quantities
and flow patterns should not be significantly influenced by the
inlet condition.5,13
Although many hemodynamic parameters have been pro-
posed and analyzed, most of these studies have focused on WSS.
Published results regarding whether aneurysmal WSS can signif-
icantly distinguish ruptured from unruptured aneurysms are
conflicting. These findings typically fall into 4 categories: 1)
high spatial mean WSS is correlated with rupture5; 2) low spa-
tial mean WSS is correlated with rupture4,27,29; 3) high maxi-
mum WSS is correlated with rupture22,23; and 4) WSS is not
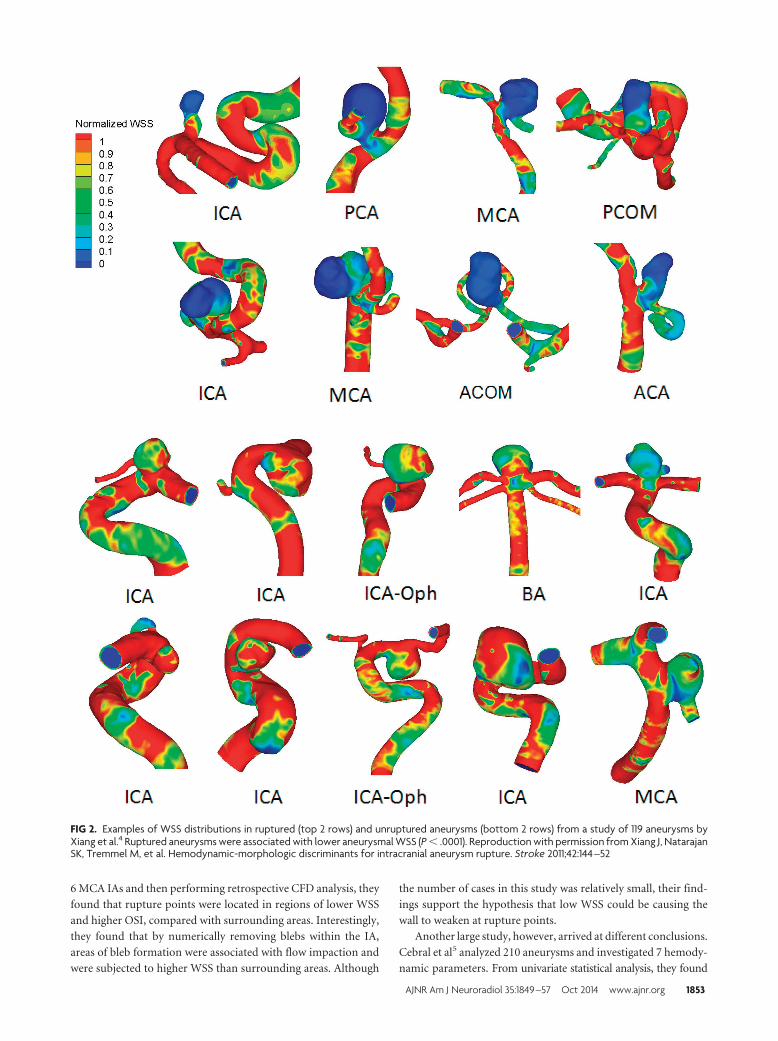
correlated with rupture.13,28,30 Examples of low WSS corre-
lated with aneurysm rupture are presented in Fig 2.4 Caution is
required when interpreting results from these studies because
many were based on small datasets and consequently have in-
herent selection bias.
Below, we discuss 2 notable studies that investigated a large
number of IAs but produced inconsistent findings.4,5 Xiang et al4
published the first study that comprehensively examined multiple
IA hemodynamic factors (as well as morphologic factors) in a
large dataset. The authors analyzed 119 aneurysms and found that
among the 7 hemodynamic parameters examined, 6 were signif-
icantly correlated with ruptured IAs. These were lower WSS,
lower maximum WSS (MWSS), higher relative residence time,
higher OSI, higher LSA, and larger number of vortices. Only 1
parameter, WSS gradient, showed no significance. Further multi-
variate logistic regression reduced the list of significant parame-
ters to 2 independently significant parameters: WSS and OSI. The
odds of an IA being ruptured can be estimated by use of a predic-
tion model, which is an exponential function with (�WSS) and
OSI in the exponent. According to this result, aneurysms with
lower WSS and higher OSI have a larger chance of being
ruptured.4
The essential finding that low WSS and high OSI are correlated
with IA rupture is consistent with recent clinical results by
Omodaka et al.35 By intraoperatively identifying rupture points of
FIG 1. Longitudinally followed aneurysms show correlation between growth and low WSS. A, Overlying 3D images of a basilar-trunk aneurysmfrom consecutive years show dramatic size increase in the direction of the lowest WSS.2 B, Linear correlation between local displacement of IAwall (IA enlargement) and inverse of time-averaged WSS (P � .001) in a follow-up study analyzing 7 growing IAs by the same group.17 Reproducedwith permission from Acevedo-Bolton G, Jou LD, Dispensa BP, et al. Estimating the hemodynamic impact of interventional treatments ofaneurysms: numerical simulation with experimental validation: technical case report. Neurosurgery 2006;59:E429 –30 and Boussel L, Rayz V,McCulloch C, et al. Aneurysm growth occurs at region of low wall shear stress: patient-specific correlation of hemodynamics and growth in alongitudinal study. Stroke 2008;39:2997–3002.
1852 Xiang Oct 2014 www.ajnr.org
6 MCA IAs and then performing retrospective CFD analysis, they
found that rupture points were located in regions of lower WSS
and higher OSI, compared with surrounding areas. Interestingly,
they found that by numerically removing blebs within the IA,
areas of bleb formation were associated with flow impaction and
were subjected to higher WSS than surrounding areas. Although
the number of cases in this study was relatively small, their find-
ings support the hypothesis that low WSS could be causing the
wall to weaken at rupture points.
Another large study, however, arrived at different conclusions.
Cebral et al5 analyzed 210 aneurysms and investigated 7 hemody-
namic parameters. From univariate statistical analysis, they found
FIG 2. Examples of WSS distributions in ruptured (top 2 rows) and unruptured aneurysms (bottom 2 rows) from a study of 119 aneurysms byXiang et al.4 Ruptured aneurysms were associated with lower aneurysmal WSS (P � .0001). Reproduction with permission from Xiang J, NatarajanSK, Tremmel M, et al. Hemodynamic-morphologic discriminants for intracranial aneurysm rupture. Stroke 2011;42:144 –52
AJNR Am J Neuroradiol 35:1849 –57 Oct 2014 www.ajnr.org 1853

that 4 of the 7 parameters, that is, larger MWSS, larger inflow con-
centration index and larger shear concentration index, and lower
viscous dissipation ratio, were significantly correlated with ruptured
IAs. The other 3 hemodynamic parameters, that is, LSA, kinetic en-
ergy ratio, and low shear index, did not achieve statistical signifi-
cance. By simulating these 210 aneurysms with different inlet flow
conditions (2 different pulsatile conditions and 3 steady-flow condi-
tions), the authors further demonstrated that though the values of
hemodynamic quantities changed with different inlet flow condi-
tions, the statistical differences or ratios between their mean values
over the ruptured and unruptured IAs were maintained.
In the above-mentioned large studies (Xiang et al4 and Cebral et
al5), findings regarding LSA and MWSS, the only overlapping pa-
rameters analyzed, were contradictory. Low shear stress area signifi-
cantly separated ruptured from unruptured IAs in the Xiang et al4
study but not in the Cebral et al5 study. This difference could partially
be attributed to the different definitions of LSA used by these authors.
Xiang et al4 used 10% of parent vessel WSS value as the threshold for
low WSS in LSA calculation, whereas Cebral et al5 used a threshold
below 1 standard deviation of parent vessel WSS. The conflicting
results could also reflect different hemodynamic mechanisms dom-
inating these 2 IA cohorts. Overall, their inconsistent LSA definitions
make it difficult to compare their results.
In the case of MWSS, which had consistent definitions in both
studies, the reported opposite associations of MWSS with rupture
might suggest something more fundamental. Xiang et al4 found
that low MWSS along with low (average) WSS were significantly
correlated with ruptured IAs. Furthermore, Xiang et al4 found
that in most of their IAs, the MWSS was located near the aneu-
rysm neck. However, Cebral et al5,20,22,23 found that high MWSS
correlated with ruptured IAs and was mostly located in the IA
dome. This raises an important question: did these 2 cohorts con-
tain vastly different types of aneurysms, which might have been
subjected to different flow and rupture mechanisms?
In a recent editorial, Strother and Jiang10 suggested that IA
may not be one single disease but may be a spectrum of a disease
or even multiple diseases. In Part 1 of our 2-part review,11 we
hypothesized that there are 3 principal IA phenotypes: Type I,
typically small IAs with thin, translucent walls, dominated by high
WSS and impinging flow; Type II, typically large IAs with thick
and atherosclerotic walls, dominated by low WSS and disturbed
flow; and a third type, a combination of Type I and Type II, con-
taining both high and low WSS. We proposed that both high and
low WSS can drive IA growth and rupture by different biologic
mechanisms: high WSS may trigger a mural cell–mediated de-
structive remodeling pathway, akin to the process of IA gene-
sis14,15 or bleb formation,26,29 whereas low WSS may trigger an
inflammatory cell–mediated destructive remodeling pathway,
akin to atherosclerotic (aortic aneurysm) development. The 2 hy-
pothesized pathways can dominate different phases of IA devel-
opment (including rupture) or even different parts of the same
aneurysm sac at a given time.
Given such heterogeneity in aneurysmal hemodynamic-bio-
logic mechanisms and manifestation, studies with a limited num-
ber of samples could be skewed to one side of the spectrum or the
other. Overall, however, we think that after the aneurysm initia-
tion phase (which has been determined to be driven by high WSS
and high, positive WSS gradient14,15), aneurysm sac enlargement
tends to continuously lower WSS, allowing inflammation to
dominate the rest of IA development. Still, a smaller set of aneu-
rysms may be continuously dominated by impinging flow be-
cause of their geometry; thus, their growth and rupture may be
driven by high WSS through the noninflammatory pathway.
SummaryCollaborative efforts between computational researchers and cli-
nicians have thrust image-based CFD to the forefront of emerging
patient-specific IA evaluations. WSS-based hemodynamic met-
rics are promising predictors of IA growth and rupture. However,
the rapid growth of this field has also generated inconsistent he-
modynamic parameters and at times produced conflicting results,
raising concerns of the clinical utility of image-based CFD.
The “high-versus-low WSS” controversy represents the pinna-
cle of this unsettling issue. Although it is not surprising to see
inconsistent results from studies that are based on small datasets
(typically 1–30 IA cases),8 it is disconcerting that larger studies
with consistent WSS definitions have produced opposite results
concerning the correlation of WSS with IA rupture. This suggests
that perhaps the mechanistic heterogeneity underlying IA growth
and rupture leads to different characteristics within IA datasets
collected at different centers, thereby producing the inconsistent
findings reported in the current literature.
We believe that the intrinsic complexity of aneurysm growth
and rupture mechanisms could be a major cause of inconsistent
findings. As elaborated on in Part 1,11 high and low WSS can elicit
different hemodynamic-biologic pathways of pathologic remod-
eling, driving IA growth and rupture and accounting for hetero-
geneous aneurysm phenotypes. As such, IA heterogeneity may
need to be taken into account in future large-scale correlative
hemodynamic IA studies. Computational fluid dynamics is not
“confounding factor dissemination”; rather, it enables us to ap-
preciate the complexity of IA pathophysiology driven by hemo-
dynamics. To close the gap between CFD research and clinical
utility, however, we must perform CFD more thoughtfully. We
expect that both larger databases and better ways of categorizing
and analyzing IAs, along with increased knowledge of the hemo-
dynamic-mechanobiology of IA, will continue to define the role
of hemodynamics in IA growth and rupture, leading to more ac-
curate rupture risk assessments and improved clinical utility of
CFD analyses.
Future DirectionsGoing forward, the heterogeneity of IA presentation and the pro-
posed underlying hemodynamic mechanisms should be ad-
dressed in large, multi-center, CFD studies. Large databases could
help to consolidate contradictory WSS findings, form conceptual
models of IA pathophysiology, and build a foundation for more
accurate clinical risk stratification models.
To facilitate the creation of such databases, CFD researchers
should begin to standardize and unify aneurysm modeling proce-
dures and hemodynamic variable definitions.8 Once these proce-
dures are standardized, it will be possible to combine and com-
pare datasets from different centers with assured consistency,
which is required to conduct studies of aneurysm rupture risk that
1854 Xiang Oct 2014 www.ajnr.org

are valid across centers and populations. A common framework,
available across the entire aneurysm research community, on
which to study the connections between hemodynamics and an-
eurysm growth and rupture, will help accomplish this goal. On
the other hand, we should also advance the clinical integration of
user-friendly, streamlined computational tools at the point of
care. Such clinically oriented IA analysis tools will enable clini-
cians to gain first-hand experience with CFD modeling, sharpen
their intuition of treatment decisions and planning on the basis of
flow visualization, and rapidly provide sorely needed constructive
feedback and guidance to computational researchers.8
Mechanistic heterogeneity implies that different datasets, or
subsets of datasets, could be dominated by different mechanisms
of IA growth and rupture. Thus, whereas larger databases could
increase the statistical prowess of predictive metrics, they also
could produce more divergence. More sophisticated data mining
and analytic methods will be required to categorize aneurysms. In
accordance with the hypothesis that both high and low WSS can
drive aneurysm growth and rupture through different biologic
mechanisms,11 integrative hemodynamic parameters capturing
both mechanisms could be explored as potentially better risk pre-
dictors. Alternatively, aneurysms could be categorized by location
or type for the extrapolation of separate predictive markers. These
foreseeable developments are expected to not only produce more
accurate predictors of IA growth and rupture, but also consolidate
the large number of predictive metrics suggested in the literature.
Modeling and analytic efforts must be directed by a better
understanding of hemodynamic-biologic and mechanobiological
mechanisms of IA growth and rupture. Ideally, both hemody-
namic-biologic and mechanobiological mechanisms at play dur-
ing IA natural history should be tested in experimental models,
but endogenous models of IA growth and rupture do not cur-
rently exist. At the present time, efforts can be made to follow
different types of IAs (eg, Type I and Type II, see Part 111) in
patients when possible, so that specific hemodynamic-biologic
pathways related to aneurysm growth and rupture can be identi-
fied. Furthermore, study of the mechanobiology of the IA wall, for
example, the interaction of aneurysm biology and wall mechanics,
will help researchers better understand the mechanisms of
IA growth and rupture that cannot be explained wholly by
hemodynamics.9
It is important to recognize that most aneurysm datasets ob-
tained clinically are composed of cross-sectional data. Bringing
computational tools to the bedside can improve our ability to
follow and analyze aneurysm hemodynamics and natural history
longitudinally. Such data are vital not only for the validation of
predictive models built from cross-sectional data but also for the
development of new models that incorporate the progression of
time. As proposed in Part 1,11 hemodynamics may change roles
throughout IA natural history. The advancement of IA wall
mechanobiological measurements, combined with longitudinal
aneurysm datasets, could enable a new class of computational
tools, for example, fluid-solid-growth models, to simulate IA pro-
gression.45 Such longitudinal models could provide a general
framework upon which researchers might explore aneurysm evo-
lution and test hypotheses related to aneurysm growth and rup-
ture, leading to more robust rupture risk assessments.9,45 Fur-
thermore, by incorporating hemodynamics, mechanobiological
wall mechanics, and geometry changes throughout IA natural his-
tory, fluid-solid-growth models could allow researchers to infer
changing mechanisms during growth and rupture.
We hope that this review not only helps to delineate the cur-
rent CFD literature to clarify the WSS controversy but also calls
for worldwide interactions among CFD researchers and clini-
cians. Collaborative efforts will converge discrepancies in the field
and ultimately lead to a greater understanding of the complex
aneurysm pathophysiology, more robust risk predictors, and bet-
ter patient care outcomes.
ACKNOWLEDGMENTSWe thank Dr Charles Strother for stimulating discussions.
Disclosures: Kenneth Snyder—RELATED: Grant: Toshiba,* ev3*; Consulting Fee orHonorarium: Toshiba, ev3, Covidien; Support for Travel to Meetings for the Studyor Other Purposes: Toshiba, ev3, Covidien; Other: Toshiba, ev3, Covidien;UNRELATED: Consultancy: Toshiba, ev3, Covidien; Grants/Grants Pending:Toshiba,* ev3*; Payment for Lectures (including service on speakers bureaus):Toshiba, ev3, Covidien; Other: Toshiba, ev3, Covidien. Hui Meng—RELATED: Grant:NIH,* Toshiba,* Comments: NIH Grant R01NS064592 for investigating pathogenesisof intracranial aneurysm; A grant from Toshiba Medical System Corp. for CFD studyof aneurysm. (*money paid to institution).
REFERENCES1. Jou LD, Wong G, Dispensa B, et al. Correlation between lumenal
geometry changes and hemodynamics in fusiform intracranial an-eurysms. AJNR Am J Neuroradiol 2005;26:2357– 63
2. Acevedo-Bolton G, Jou LD, Dispensa BP, et al. Estimating the hemo-dynamic impact of interventional treatments of aneurysms: nu-merical simulation with experimental validation: technical case re-port. Neurosurgery 2006;59:E429 –30
3. Sugiyama SI, Meng H, Funamoto K, et al. Hemodynamic analysis ofgrowing intracranial aneurysms arising from a posterior inferiorcerebellar artery. World Neurosurg 2012;78:462– 68
4. Xiang J, Natarajan SK, Tremmel M, et al. Hemodynamic-morpho-logic discriminants for intracranial aneurysm rupture. Stroke2011;42:144 –52
5. Cebral JR, Mut F, Weir J, et al. Quantitative characterization of thehemodynamic environment in ruptured and unruptured brain an-eurysms. AJNR Am J Neuroradiol 2011;32:145–51
6. Steinman DA. Computational modeling and flow diverters: a teach-ing moment. AJNR Am J Neuroradiol 2011;32:981– 83
7. Kallmes DF. Point: CFD– computational fluid dynamics or con-founding factor dissemination. AJNR Am J Neuroradiol2012;33:395–96
8. Cebral JR, Meng H. Counterpoint: realizing the clinical utility ofcomputational fluid dynamics– closing the gap. AJNR Am J Neuro-radiol 2012;33:396 –98
9. Robertson AM, Watton PN. Computational fluid dynamics in an-eurysm research: critical reflections, future directions. AJNR Am JNeuroradiol 2012;33:992–95
10. Strother CM, Jiang J. Intracranial aneurysms, cancer, x-rays, andcomputational fluid dynamics. AJNR Am J Neuroradiol2012;33:991–92
11. Meng H, Tutino VM, Xiang J, et al. High WSS or low WSS? Complexinteractions of hemodynamics with intracranial aneurysm initia-tion, growth, and rupture: toward a unifying hypothesis. AJNR Am JNeuroradiol 2014;35:1254 – 62
12. Shojima M, Oshima M, Takagi K, et al. Magnitude and role of wallshear stress on cerebral aneurysm: computational fluid dynamicstudy of 20 middle cerebral artery aneurysms. Stroke2004;35:2500 – 05
13. Jou LD, Lee DH, Morsi H, et al. Wall shear stress on ruptured and
AJNR Am J Neuroradiol 35:1849 –57 Oct 2014 www.ajnr.org 1855
unruptured intracranial aneurysms at the internal carotid artery.AJNR Am J Neuroradiol 2008;29:1761– 67
14. Meng H, Wang Z, Hoi Y, et al. Complex hemodynamics at the apexof an arterial bifurcation induces vascular remodeling resemblingcerebral aneurysm initiation. Stroke 2007;38:1924 –31
15. Metaxa E, Tremmel M, Natarajan SK, et al. Characterization of crit-ical hemodynamics contributing to aneurysmal remodeling at thebasilar terminus in a rabbit model. Stroke 2010;41:1774 – 82
16. Malek AM, Alper SL, Izumo S. Hemodynamic shear stress and itsrole in atherosclerosis. JAMA 1999;282:2035– 42
17. Boussel L, Rayz V, McCulloch C, et al. Aneurysm growth occursat region of low wall shear stress: patient-specific correlation ofhemodynamics and growth in a longitudinal study. Stroke 2008;39:2997–3002
18. Tateshima S, Tanishita K, Omura H, et al. Intra-aneurysmal hemo-dynamics during the growth of an unruptured aneurysm: in vitrostudy using longitudinal CT angiogram database. AJNR Am J Neu-roradiol 2007;28:622–27
19. Sforza DM, Putman CM, Tateshima S, et al. Hemodynamics charac-teristics of growing and stable aneurysms. ASME Summer Bioengi-neering Conference, Fajardo, Puerto Rico, June 20 –23, 2012
20. Cebral JR, Castro MA, Burgess JE, et al. Characterization of cerebralaneurysms for assessing risk of rupture by using patient-specificcomputational hemodynamics models. AJNR Am J Neuroradiol2005;26:2550 –59
21. Hassan T, Timofeev EV, Saito T, et al. A proposed parent vesselgeometry-based categorization of saccular intracranial aneurysms:computational flow dynamics analysis of the risk factors for lesionrupture. J Neurosurg 2005;103:662– 80
22. Castro M, Putman C, Radaelli A, et al. Hemodynamics and ruptureof terminal cerebral aneurysms. Acad Radiol 2009;16:1201– 07
23. Castro MA, Putman CM, Sheridan MJ, et al. Hemodynamic pat-terns of anterior communicating artery aneurysms: a possibleassociation with rupture. AJNR Am J Neuroradiol2009;30:297–302
24. Chien A, Castro MA, Tateshima S, et al. Quantitative hemodynamicanalysis of brain aneurysms at different locations. AJNR Am J Neu-roradiol 2009;30:1507–12
25. Chien A, Tateshima S, Sayre J, et al. Patient-specific hemodynamicanalysis of small internal carotid artery-ophthalmic artery aneu-rysms. Surg Neurol 2009;72:444 –50
26. Cebral JR, Sheridan M, Putman CM. Hemodynamics and bleb for-mation in intracranial aneurysms. AJNR Am J Neuroradiol2010;31:304 –10
27. Lu G, Huang L, Zhang XL, et al. Influence of hemodynamic factorson rupture of intracranial aneurysms: patient-specific 3D mirroraneurysms model computational fluid dynamics simulation. AJNRAm J Neuroradiol 2011;32:1255– 61
28. Qian Y, Takao H, Umezu M, et al. Risk analysis of unruptured an-eurysms using computational fluid dynamics technology: prelimi-nary results. AJNR Am J Neuroradiol 2011;32:1948 –55
29. Zhang Y, Mu S, Chen J, et al. Hemodynamic analysis of intracranialaneurysms with daughter blebs. Eur Neurol 2011;66:359 – 67
30. Goubergrits L, Schaller J, Kertzscher U, et al. Statistical wall shearstress maps of ruptured and unruptured middle cerebral artery an-eurysms. J R Soc Interface 2012;9:677– 88
31. Takao H, Murayama Y, Otsuka S, et al. Hemodynamic differencesbetween unruptured and ruptured intracranial aneurysms duringobservation. Stroke 2012;43:1436 –39
32. Hoi Y, Meng H, Woodward SH, et al. Effects of arterial geometry onaneurysm growth: three-dimensional computational fluid dynam-ics study. J Neurosurg 2004;101:676 – 81
33. Shojima M, Oshima M, Takagi K, et al. Role of the bloodstreamimpacting force and the local pressure elevation in the rupture ofcerebral aneurysms. Stroke 2005;36:1933–38
34. Valencia A, Morales H, Rivera R, et al. Blood flow dynamics in pa-tient-specific cerebral aneurysm models: the relationship between
wall shear stress and aneurysm area index. Med Eng Phys2008;30:329 – 40
35. Omodaka S, Sugiyama S, Inoue T, et al. Local hemodynamics at therupture point of cerebral aneurysms determined by computationalfluid dynamics analysis. Cerebrovasc Dis 2012;34:121–29
36. Kawaguchi T, Kanamori M, Takazawa H, et al. Flow dynamics anal-ysis in patients with a ruptured middle cerebral artery aneurysm: acase report. No Shinkei Geka 2011;39:281– 86
37. Miura Y, Ishida F, Umeda Y, et al. Low wall shear stress is indepen-dently associated with the rupture status of middle cerebral arteryaneurysms. Stroke 2013;44:519 –21
38. Xu J, Yu Y, Wu X, et al. Morphological and hemodynamic analysis ofmirror posterior communicating artery aneurysms. PloS One2013;8:e55413
39. Antiga L, Piccinelli M, Botti L, et al. An image-based modelingframework for patient-specific computational hemodynamics.Med Biol Eng Comput 2008;46:1097–112
40. Geers AJ, Larrabide I, Radaelli AG, et al. Patient-specific computa-tional hemodynamics of intracranial aneurysms from 3D rota-tional angiography and CT angiography: an in vivo reproducibilitystudy. AJNR Am J Neuroradiol 2011;32:581– 86
41. Morales HG, Kim M, Vivas EE, et al. How do coil configuration andpacking density influence intra-aneurysmal hemodynamics? AJNRAm J Neuroradiol 2011;32:1935– 41
42. Marzo A, Singh P, Larrabide I, et al. Computational hemodynamicsin cerebral aneurysms: the effects of modeled versus measuredboundary conditions. Ann Biomed Eng 2011;39:884 –96
43. Cebral JR, Mut F, Weir J, et al. Association of hemodynamic charac-teristics and cerebral aneurysm rupture. AJNR Am J Neuroradiol2011;32:264 –70
44. Steinman DA, Milner JS, Norley CJ, et al. Image-based computa-tional simulation of flow dynamics in a giant intracranial aneu-rysm. AJNR Am J Neuroradiol 2003;24:559 – 66
45. Humphrey JD, Taylor CA. Intracranial and abdominal aorticaneurysms: similarities, differences, and need for a new class ofcomputational models. Annu Rev Biomed Eng 2008;10:221– 46
46. Nixon AM, Gunel M, Sumpio BE. The critical role of hemodynamicsin the development of cerebral vascular disease. J Neurosurg2010;112:1240 –53
47. Ota R, Kurihara C, Tsou TL, et al. Roles of matrix metalloprotei-nases in flow-induced outward vascular remodeling. J Cereb BloodFlow Metab 2009;29:1547–58
48. Frosen J, Tulamo R, Paetau A, et al. Saccular intracranial aneurysm:pathology and mechanisms. Acta Neuropathol 2012;123:773– 86
49. Wang Z, Kolega J, Hoi Y, et al. Molecular alterations associated withaneurysmal remodeling are localized in the high hemodynamicstress region of a created carotid bifurcation. Neurosurgery2009;65:169 –77
50. Kolega J, Gao L, Mandelbaum M, et al. Cellular and molecularresponses of the basilar terminus to hemodynamics during in-tracranial aneurysm initiation in a rabbit model. J Vasc Res2011;48:429 – 42
51. Watton PN, Selimovic A, Raberger NB, et al. Modelling evolutionand the evolving mechanical environment of saccular cerebral an-eurysms. Biomech Modeling Mechanobiol 2011;10:109 –32
52. Cardenes R, Pozo JM, Bogunovic H, et al. Automatic aneurysm neckdetection using surface Voronoi diagrams. IEEE Trans Med Imaging2011;30:1863–76
53. Larrabide I, Cruz Villa-Uriol M, Cardenes R, et al. Three-dimen-sional morphological analysis of intracranial aneurysms: a fully au-tomated method for aneurysm sac isolation and quantification.Med Physics 2011;38:2439 – 49
54. Dhar S, Tremmel M, Mocco J, et al. Morphology parameters forintracranial aneurysm rupture risk assessment. Neurosurgery2008;63:185–96
55. Rahman M, Smietana J, Hauck E, et al. Size ratio correlates withintracranial aneurysm rupture status: a prospective study. Stroke2010;41:916 –20
1856 Xiang Oct 2014 www.ajnr.org

56. Ma D, Tremmel M, Paluch RA, et al. Size ratio for clinical assess-ment of intracranial aneurysm rupture risk. Neurol Res 2010;32:482– 86
57. Dolan JM, Meng H, Singh S, et al. High fluid shear stress and spatialshear stress gradients affect endothelial proliferation, survival, andalignment. Ann Biomed Eng 2011;39:1620 –31
58. LaMack JA, Friedman MH. Individual and combined effects ofshear stress magnitude and spatial gradient on endothelial cellgene expression. Am J Physiol Heart Circ Physiol 2007;293:H2853–59
59. He X, Ku DN. Pulsatile flow in the human left coronary arterybifurcation: average conditions. J Biomech Eng 1996;118:74 – 82
60. Shimogonya Y, Ishikawa T, Imai Y, et al. Can temporal fluctuation inspatial wall shear stress gradient initiate a cerebral aneurysm? Aproposed novel hemodynamic index, the gradient oscillatory num-ber (GON). J Biomech 2009;42:550 –54
61. Chien A, Tateshima S, Castro M, et al. Patient-specific flow analysisof brain aneurysms at a single location: comparison of hemody-namic characteristics in small aneurysms. Med Biol Eng Comput2008;46:1113–20
62. Kawaguchi T, Nishimura S, Kanamori M, et al. Distinctive flow pat-tern of wall shear stress and oscillatory shear index: similarity anddissimilarity in ruptured and unruptured cerebral aneurysm blebs.J Neurosurg 2012;117:774 – 80
AJNR Am J Neuroradiol 35:1849 –57 Oct 2014 www.ajnr.org 1857