cfd simulation of methanol flushing in subsea jumpers
TRANSCRIPT
CFD Simulation of Methanol Flushing in Subsea Jumpers
© 2011 ANSYS, Inc. September 16,
2011
1
Lubeena R
Mohammed Elyyan
Mohan Srinivasa
Introduction
• Hydrate formation is a concern in the deepwater production lines. This is normally
favored by the low temperature and the high pressure. Under the right conditions
hydrates can form anytime and anywhere hydrocarbons and water are present.
• The hydrate plugs act as a hindrance to hydrocarbon flow.
• On shut -in, the line temperature cools very rapidly to that of the ocean floor so that
© 2011 ANSYS, Inc. September 16,
2011
2
• On shut -in, the line temperature cools very rapidly to that of the ocean floor so that
the system is almost always in the hydrate region if the line is not depressurized.
• One common method for protecting subsea jumpers from the hydrate formation is to
flush the jumpers with methanol to displace and inhibit any water accumulation in
the lines.

Objective
• Use ANSYS CFD to predict the distribution of methanol and water in the jumper
after methanol flushing.
• Compare the numerical results with experimental results
– Amount of water and methanol remaining in the jumper after methanol flushing
© 2011 ANSYS, Inc. September 16,
2011
3

Problem Description
Methanol mass flow inletPressure outlet
(atmospheric pressure)
Oil, Water and Air
© 2011 ANSYS, Inc. September 16,
2011
4
Reference: Hydrate inhibition of subsea jumpers during Shut-in, T.Cagney and S.Hare,Total E&P Angola, and S.J.Svedeman, Southwest Research Inst.Copyright 2006, Society of Petroleum Engineers
Find the distribution of methanol and water in the jumper after
methanol is injected into the jumper
Oil, Water and Air
6.3m

Grid Details
Cell Count: 2.75M
Mesh: Hexahedral cells
© 2011 ANSYS, Inc. September 16,
2011
5
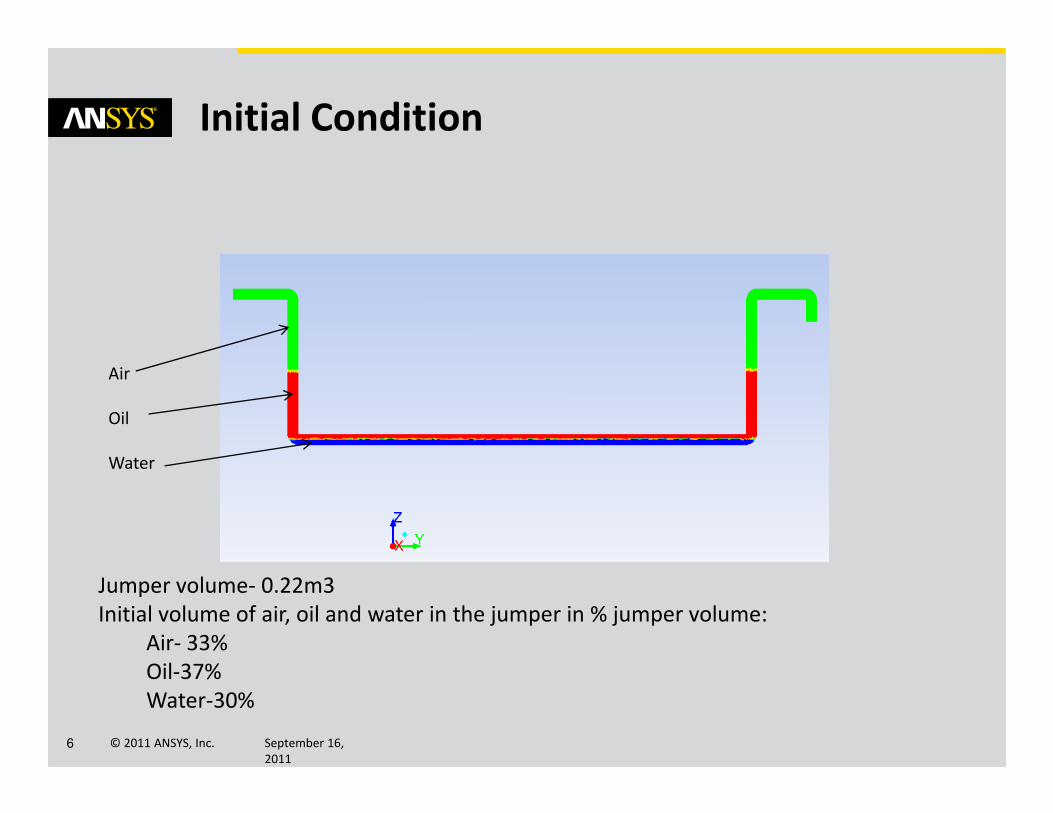
Initial Condition
Air
Oil
© 2011 ANSYS, Inc. September 16,
2011
6
Jumper volume- 0.22m3
Initial volume of air, oil and water in the jumper in % jumper volume:
Air- 33%
Oil-37%
Water-30%
Oil
Water

Model Details
• Transient solver
• Multiphase: VOF model with Species Transport model
• Turbulence: SST K-omega with turbulence damping at the interface
• Pressure-Velocity Coupling:
– SIMPLE
• Spatial Discretization Schemes:
– Green Gauss Cell Based for Gradient
© 2011 ANSYS, Inc. September 16,
2011
7
– Green Gauss Cell Based for Gradient
– PRESTO for Pressure
– Compressive for Volume fraction
• Time step size:
– 5e-3s for 10 and 16.5 m3/hr cases
– 1e-2s for 5m3/hr case
• Computational time taken:
– 1 day to run 16s in 12 CPUs (16.5m3/hr case with time step size 5e-3)
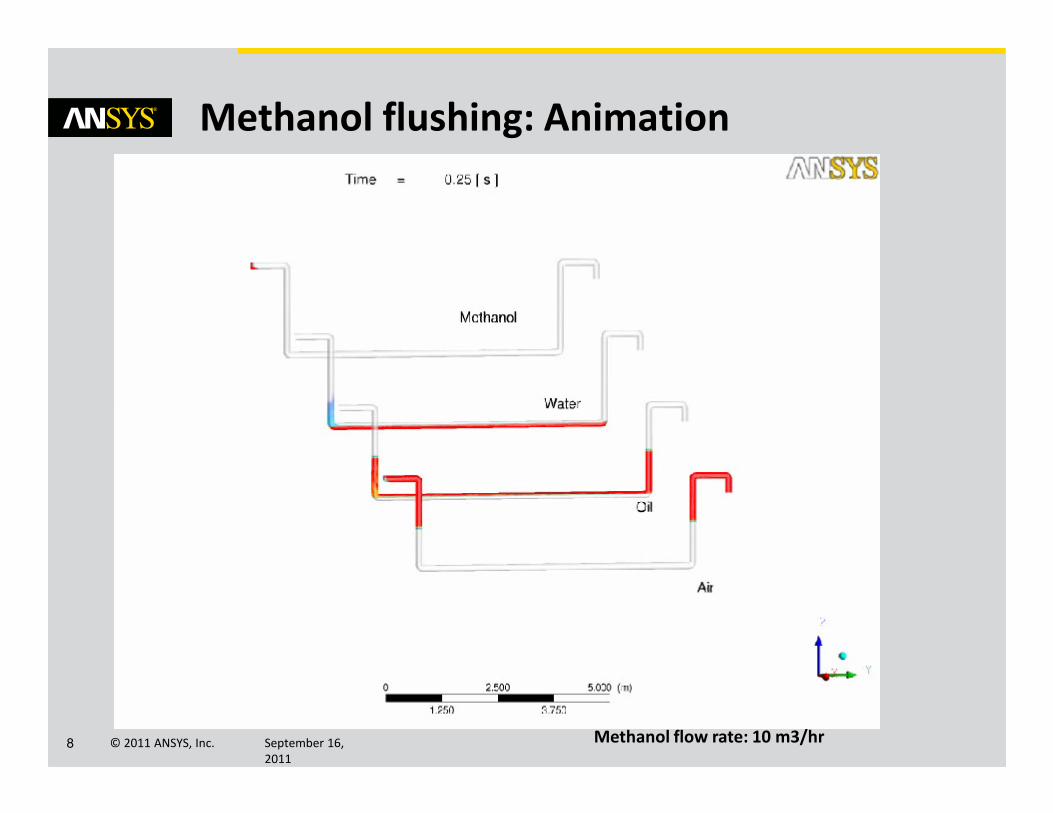
Methanol flushing: Animation
© 2011 ANSYS, Inc. September 16,
2011
8 Methanol flow rate: 10 m3/hr

Methanol flushing: Animation
© 2011 ANSYS, Inc. September 16,
2011
9
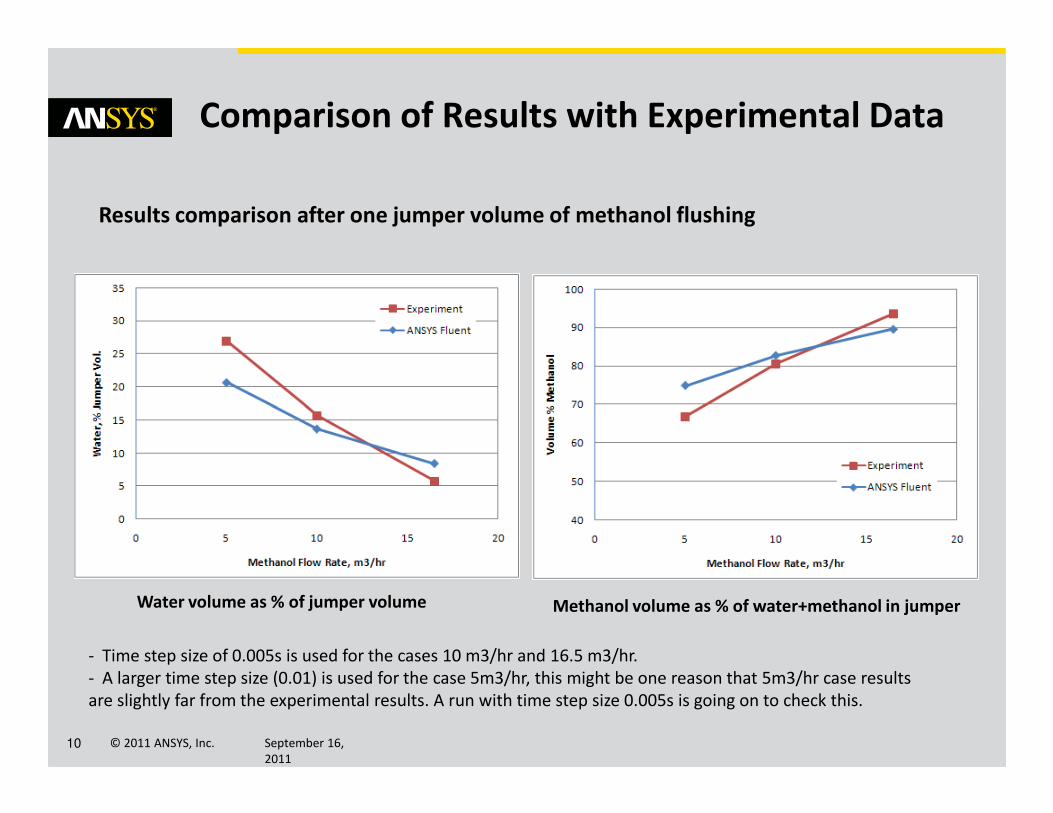
Comparison of Results with Experimental Data
Results comparison after one jumper volume of methanol flushing
© 2011 ANSYS, Inc. September 16,
2011
10
Water volume as % of jumper volume Methanol volume as % of water+methanol in jumper
- Time step size of 0.005s is used for the cases 10 m3/hr and 16.5 m3/hr.
- A larger time step size (0.01) is used for the case 5m3/hr, this might be one reason that 5m3/hr case results
are slightly far from the experimental results. A run with time step size 0.005s is going on to check this.
Summary
• ANSYS FLUENT is used to model methanol flushing in a subsea jumper and predict
the water and methanol distribution after the methanol flushing
• The simulation results are compared with the experimental results
– The amount of water and methanol left in the jumper at the end of methanol
flush
• Numerical simulation predicted the experimental behavior very well
© 2011 ANSYS, Inc. September 16,
2011
11
• Numerical simulation predicted the experimental behavior very well
– Higher methanol flow rates removed more water from the jumper
– Almost all the oil is swept from the jumper
– At the end of methanol flush, the two phase flow pattern in the lower portion of
the jumper was stratified with limited mixing at the interface between methanol
and water
• The numerical results are in good agreement with the experimental results

APPENDIX
• To see the animations in this presentation you will need to install the
swiff point player and enable ActiveX Controls in the Trust Center
Settings of Power Point Options.
© 2011 ANSYS, Inc. September 16,
2011
12