cfd 기반 유체충격 해석에서 공기 압축성...
TRANSCRIPT
CFD 기반 유체충격 해석에서 공기 압축성 효과찬후피1 안형택2dagger
Baker Hughes Inc1
울산대학교 조선해양공학부2
Air Compressibility Effect in CFD-based Water Impact AnalysisTran Huu Phi1 Hyung Taek Ahn2daggerBaker Hughes Inc1
School of Naval Architecture and Ocean Engineering University of Ulsan2
AbstractThis paper describes the air compressibility effect in the CFD simulation of water impact load prediction In order to consider the air
compressibility effect two sets of governing equations are employed namely the incompressible Navier-stokes equations and compressible
Navier-Stokes equations that describe general compressible gas flow In order to describe violent motion of free surface volume-of-fluid
method is utilized The role of air compressibility is presented by the comparative study of water impact load obtained from two different
air models ie the compressible and incompressible air For both cases water is considered as incompressible media Compressible air
model shows oscillatory behavior of pressure on the solid surface that may attribute to the air-cushion effect Incompressible air model
showed no such oscillatory behavior in the pressure history This study also showed that the CFD simulation can capture the formation
of air pockets enclosed by water and solid surface which may be the location where the air compressibility effect is dominant
Keywords Water Impact(유체충격) Air Compressibility(공기압축성) Navier-Stokes equations(나비어-스톡스방정식) Computational Fluid
Dynamics(CFD전산유체역학) Volume-of-fluid(VOF 유체체적법)
1 IntroductionHydrodynamics of free-surface flows that causes impact
loads on the marine structures has not been fully understood Prediction of the impact loads is essential in designing ships and offshore structures Green water on ship deck wave run-up on offshore structures slamming and sloshing in tank are among the representative examples of water impact phenomena in the area of naval hydrodynamics (Wu et al 2004 Howison et al 2001 Sun and Faltinsen 2006) Available theories such as potential theory (Korobkin and Iafrati 2005 Wu 1998) which is commonly solved by a boundary element method (BEM) (Wu et al 2004 Zhao and Faltinsen 1993 Sun and Faltinsen 2006) showed limited success on water problems involving violent free surface deformation Perhaps this is because in addition to the free-surface geometrical complexities discontinuities in the flow and air entrainment and compressibility effects in these problems are difficult to be treated satisfactorily
New trends are towards direct numerical solutions of Navier-
Stokes equations (Yum and Yoon 2008 Lee et al 2008 Kleefsman et al 2005 Zhang et al 2010) Yoon (1991) and Lee et al (2008) applied Lagrangian and particle based methods for water impact simulation Kang and Troesch (1990) reported impact load prediction for 3D bodies More recently Nho et al(2010) reported structural response due to the water impact load
In this endeavor it is necessary to find a proper mathematical model (the governing equations) that best describes the complex water impact problem Different numerical techniques and methods are under investigation to explore complex free- surface and impact problems Among the large volume of literature written on this subject Scardovelli and Zaleski (1999) provides a good review and highlights the problems associated with numerical techniques
Most of the previous study on water impact assumes the fluid as incompressible media (Yum and Yoon 2008 Lee et al 2008) and few work has been done about compressible fluids (Godderidge et al 2009) However when water impacts on flat surface like ship with wide flat bottom water slamming
접수일 2010년 8월 31일 985115 1차 수정일 2011년 1월 9일 985115 게재확정일 2011년 8월 29일dagger교신저자 htahnulsanackr 052-259-2164
Vol 48 No 6 pp 581-591 December 2011
httpdxdoiorg103744SNAK2011486581
대한조선학회논문집
Journal of the Society of Naval Architects of Korea
CFD 기반 유체충격 해석에서 공기 압축성 효과
582 대한조선학회논문집 제 48 권 제6 호 2011년 12월
often involves air trapping and air cushion effect A pioneering experimental work of flat bottom water slamming is being carried out by Kwon et al (2010) In this case the compressibility effects of air may play an important role and its effect is not clearly reported A new computational research for better understanding of water impact and air compressibility associated with it is also desired
In this study air is considered both compressible and incompressible media by employing compressible Navier-Stokes equations for ideal gas and incompressible Navier-Stokes equations for incompressible air model respectively Volume- of-fluid (VOF) method is used to describe deformation of free surface In order to save time and effort related to the de-velopment and verification of two different sets of flow solvers (compressible and incompressible Navier-Stokes solvers) a general purpose CFD package Fluent (2008) is utilized
The effect of air compressibility is investigated by the comparison of compressible and incompressible simulations The results are presented in impact pressure on the solid surface forces acting on the solid surface and impulse exerted during the impact process Also the effect of air compressibility with respected to different domain sizes is investigated
This paper is organized as follows In Sec 2 the governing equations for both compressible and incompressible flows are presented For the free surface representation the basic concept of Volume-of-Fluid method is introduced In order to check the validity of current compressible air model a simple compression test involving evolving free surface is presented in Sec 3 The role of air compressibility is presented in Sec 4 by considering water drop impact on the flat solid surface Histories of pressure force impulses are compared for compressible and incompressible models Time step refinement and mesh refinement study is presented for the convergence check Scale effect is also discussed with a series of simulations with different domain size This paper is summarized in the following conclusion section
2 Governing EquationsIn this section we present two sets of governing equations
namely compressible and incompressible Navier-Stokes equations For the representation of free surface evolution volume-of-fluid (VOF) method is employed and its basic concept is presented
21 Compressible Navier-Stokes EquationsIn order to consider the compressibility of the air we consider
the compressible Navier-Stokes equations The compressible Navier-Stokes equations consisted of continuity momentum
and energy equations can be expressed as follows in differential form
nabla∙ (1)
nabla∙∙ (2)
Here is the density of the fluid is the fluid velocity is the body force per unit mass is the stress tensor whose components are expressed as follows
where is the pressure is the viscosity and is the second coefficient of viscosity
nabla∙nabla∙∙nabla∙∙ (3)
For the energy equation as shown in Eq (3) is the total energy per unit volume and is the heat flux
The system of compressible Navier-Stokes equations is composed of equations where is the number of spatial dimensions Whereas the unknowns appearing in the system are and the velocity components ie total unknowns Hence two auxiliary equations are necessary for the system of equations to be closed
The above two equation are general representation of thermal and caloric equations of state respectively For ideal and calorically perfect gas (gas at relatively low temperature) the above equations can be expressed as follows
where is the specific heat at constant volume
22 Incompressible Navier-Stokes EquationsThe flow can be considered as incompressible in case the
density variation is negligible regardless of pressure Typically low speed air flow and most of water flow can be considered as incompressible Once the flow is assumed as incompressible then the density is constant and the original compressible
찬후피 안형택
JSNAK Vol 48 No 6 December 2011 583
Navier-stokes equations can be simplified as follows
nabla∙ (4)
∙nablanabla∙ (5)
where is the viscous stress tensor and its component is defined as follows
The above system of equations composed of continuity and
momentum equation involves unknowns of and velocity com-ponents The incompressible Navier-Stokes equations are now closed to be solved
23 Volume-of-fluid MethodIn order to represent dynamically evolving free surface we
employ Volume-of-Fluid method The volume of fluid (VOF) method is a numerical technique for tracking and locating the free surface or fluid-fluid interface It belongs to the class of Eulerian methods that represents the moving interface based on volume-fraction information being updated at each time
The method is based on the idea of so called volume fraction function It is defined as the integral of fluidrsquos characteristic function in the control volume Basically if the cell is empty (there is no traced fluid inside) if the cell is full we have and if the interface cuts the cell then <<
The fraction function is a scalar function and convected passively by the fluid velocity The evolution equation of the volume fraction can be represented simply by an advection equation described as follows
∙nabla (6)
Based on the volume fraction at each computational cell interface between the air and water is represented by the Piecewise-Linear Interface Calculation (PLIC) scheme
3 Simple Compression Test31 Problem Definition
The purpose of this test is to validate compressible air
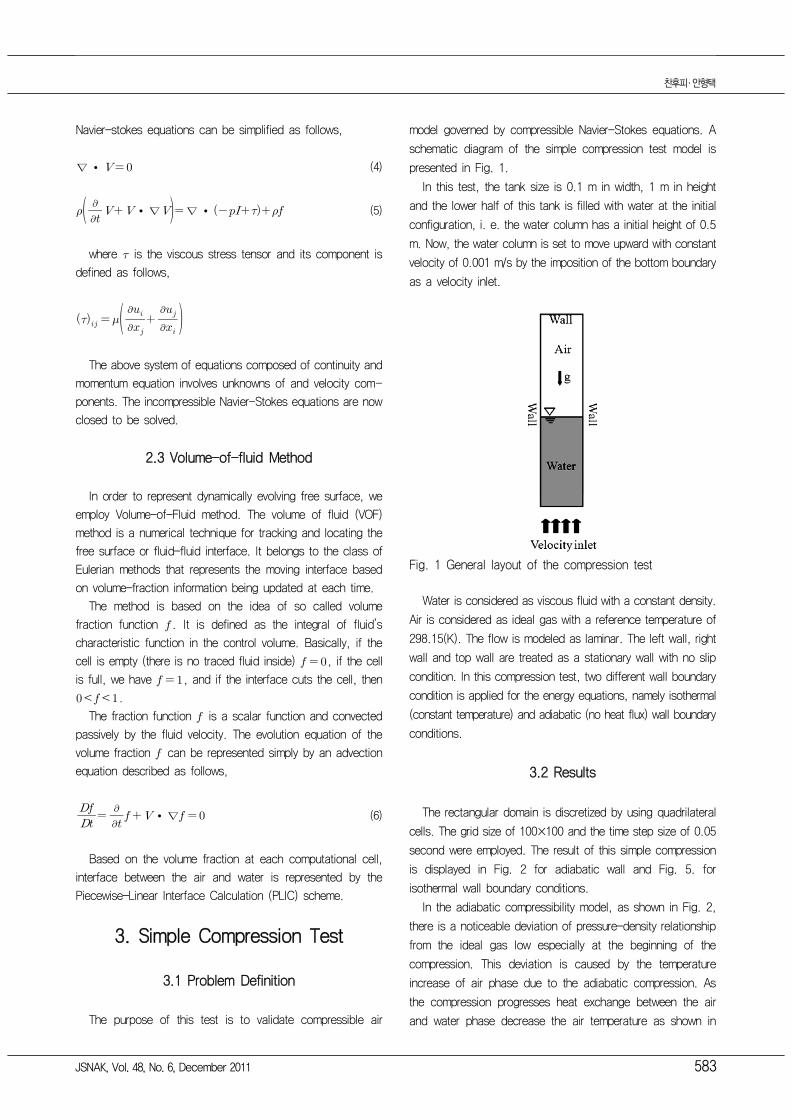
model governed by compressible Navier-Stokes equations A schematic diagram of the simple compression test model is presented in Fig 1
In this test the tank size is 01 m in width 1 m in height and the lower half of this tank is filled with water at the initial configuration i e the water column has a initial height of 05 m Now the water column is set to move upward with constant velocity of 0001 ms by the imposition of the bottom boundary as a velocity inlet
Fig 1 General layout of the compression testWater is considered as viscous fluid with a constant density
Air is considered as ideal gas with a reference temperature of 29815(K) The flow is modeled as laminar The left wall right wall and top wall are treated as a stationary wall with no slip condition In this compression test two different wall boundary condition is applied for the energy equations namely isothermal (constant temperature) and adiabatic (no heat flux) wall boundary conditions
32 ResultsThe rectangular domain is discretized by using quadrilateral
cells The grid size of 100times100 and the time step size of 005 second were employed The result of this simple compression is displayed in Fig 2 for adiabatic wall and Fig 5 for isothermal wall boundary conditions
In the adiabatic compressibility model as shown in Fig 2 there is a noticeable deviation of pressure-density relationship from the ideal gas low especially at the beginning of the compression This deviation is caused by the temperature increase of air phase due to the adiabatic compression As the compression progresses heat exchange between the air and water phase decrease the air temperature as shown in
CFD 기반 유체충격 해석에서 공기 압축성 효과
584 대한조선학회논문집 제 48 권 제6 호 2011년 12월
Fig 3 Overall the pressure density relationship follows the ideal gad law well except at the initial stage of air temperature increase
Fig 2 Pressure-density relation of the compressible air during the simple compression test-adiabatic wall boundary
Fig 3 Temperature history of the compressible air during the simple compression test-adiabatic wall boundary
In the isothermal compressibility model the wall temperature is fixed to the initial air temperature Hence the air tem-perature is kept almost constant though the entire compression progresses This is shown in Fig 5 It is also confirmed that
Fig 4 Pressure-density relation of the air phase with the isothermal compressibility model
with constant air temperature the pressure-density relation follows perfectly the one obtained by the ideal gas law as shown in Fig 4 This result strengthens the validity of the current compressible air modeling
Fig 5 Temperature history of the air phase with the iso-thermal compressibility model
Fig 6 shows snapshots of the airwater interface evolution at different time moments For the result the adiabatic wall boundary condition is used Slight asymmetricity in the interface can be attributed to the non-linear nature of the Navier-Stokes equations
Fig 6 Water phase evolution with the adiabatic com-pressibility model Red-water blue-air
4 Water Drop Problem41 Problem Definition
The water impact problem modeled in this study is illustrated in Fig 7 In this model the tank size is L=1 m and H=1 m Initially a block of water (L=04 m and H=04 m) is located at the center of the tank For impact pressure measurements on the bottom wall a sensor point P0(05 m 0 m) is located at the center of the bottom
찬후피 안형택
JSNAK Vol 48 No 6 December 2011 585
Water is considered as viscous fluid with a constant density Flow is considered as laminar and no turbulence model is employed Since the major interest of current study is about water impact force which is an inertia-dominated force no effect of turbulence is encountered although further investigation about the effect of turbulence is strongly encouraged Air is considered in two different models constant density incom-pressible air and compressible air following ideal gas law as validated in the previous section The flow is modeled as laminar
As shown in Fig 7 the boundary conditions are all set as adiabatic no-slip wall conditions except for the tank top which is set as pressure outlet The pressure outlet boundary condition maintains a zero gauge pressure (same as the atmospheric pressure) at the defined boundary which is desired for the tank top The falling of the fresh water block initially at rest is initiated by the gravitational acceleration
The size of time step plays an important role in unsteady simulation of fluid flow We present time step refinement study for two different levels of meshes to check if the solution converges as the time step refines Three levels of successively refined time steps were used to examine its effects to the results
A proper time step which provides converged results is a function of grid size applied to the problem For the case A1 100times100 mesh considering ∆ sec and the approximate impact velocity the maximum value of Courant number over the domain can be approximated as ∆
∆ The initial time step for the time
step refinement study is determined based on the previous computation so that the maximum Courant number near the free surface does not violate the CFL stability condition The Courant number for this test was set to 025
Fig 7 General layout of the water drop test
42 Results421 Compressible Air
In order to see the effect of air compressibility the air is considered as compressible ideal gas The time histories of pressure and vertical force acting on the bottom surface are shown in Fig 8 and Fig 9 respectively Both of the figures show large scale oscillation in pressure as well as force history exerted on the entire bottom wall This indicates that the compressible air may attribute to energy absorbing and releasing mechanism obtained at the impact moment The linkage between the compressible air and pressure and force oscillation is further investigated in the following sections
Another observation from the figures is that the results indeed converge when the time step becomes smaller than
Fig 8 Compressible air pressure history measured at P0 (bottom center) with successively refined time steps Oscillation in pressure history is evident Grid-100 times100 is used
Fig 9 Compressible air vertical force exerted on the bottom wall with successively refined time steps Negative force indicated downward force Oscillation in force history is clearly resolved Grid-100times100 is used
CFD 기반 유체충격 해석에서 공기 압축성 효과
586 대한조선학회논문집 제 48 권 제6 호 2011년 12월
02millisecond for 100times100 grid This study also shows that larger time step under-predicts the pressures and the vertical forces
422 Incompressible Air
Now the air is model as incompressible fluid Similar to the compressible air case we present time step refinement study for A1 100times100 mesh The pressure history is presented in Fig 10 and the vertical force acting on the bottom surface is presented in Fig 11
Fig 10 Incompressible air pressure history measured P0 (bottom center) No oscillation is observed Grid- 100times100 is used
Fig 11 Incompressible air vertical force acting on the bottom wall No oscillation is observed Grid-100 times100 is used
By the comparison of compressible air case(Fig 8-9) and incompressible air case(Fig 10-11) two important observations can be drawn First it is evident that air compressibility result in oscillations in the pressure as well as force acting on the bottom wall Second the incompressible air case shows much higher and sharp peak history than the compressible air case
Based on this observation it can be presumed that the oscillation is due to the air-cushion effect that originated from the entrapped air pocket between the solid surface and water Such air pocket acts as a bumper to reduce the peak values in impact pressure and force as well as oscillation after the impact Further evidence of our conjecture will be presented in the following sections
423 Grid Refinement Study
It is well known that CFD results are sensitive to grid sizes Three levels of successively refined meshes were used to check the convergence and sensitivity of the results depending on the mesh resolution A1 100times100 (ie single cell size 10mm times10mm) A2 200times200 (ie single cell size 5mmtimes5mm) A3 400times400 (ie single cell size 25mmtimes25 mm)
As shown in Fig 12-13 the peak values of the pressure
(a)
(b)Fig 12 Mesh convergence study pressure history at bottom
center obtained by successively refined meshes (a) compressible air (b) incompressible air Com-pressible air cases show oscillation and lower peak values than incompressible air cases
찬후피 안형택
JSNAK Vol 48 No 6 December 2011 587
and force highly depend on the mesh resolution The results are extremely sensitive to the mesh resolution rather than the time step size
Based on the observation of Fig 12 and 13 there is no conclusive evidence of mesh convergence in peak pressure and force In fact the difference of peak value is rather be-comes larger as mesh refines which indicates typical divergence This is clearly not a favorable indication for the validity of the result Further investigation is necessary for the conclusive result about mesh refinement study
(a)
(b)Fig 13 Mesh convergence study vertical force history
obtained by successively refined meshes (a) compressible air model (b) incompressible air model Compressible air cases show oscillation and lower peak values than incompressible air cases
However in terms of the structural response and damage prediction impulse exerted to the structure during certain period of time is more critical than a local pressureforce at a specific time moment In that sense we present the evolution of impulse during the water impact simulation Fig 15 shows that the impulse defined as
which is the integration of the force with respect to the simulation time As shown in Fig 14 superior mesh converge is obtained for impulse history which is contrast to the pressure and force histories
(a)
(b)Fig 14 Impulse predicted by using various grid sizes (a)
compressible air model (b) incompressible air model Oscillation is observed in the impulse history for compressible air case while no such oscillation observed for incompressible air case
As shown in Fig 14 the compressible air model reveals oscillatory evolution of impulse on the solid surface whereas the incompressible air model shows monotonic increase of the impulse Regardless of the model both cases show convergence in impulse history as mesh refines
424 Air Pockets and Pressure Oscillation
For the compressible air model the fluid impact on the
CFD 기반 유체충격 해석에서 공기 압축성 효과
588 대한조선학회논문집 제 48 권 제6 호 2011년 12월
tank wall results in the formation of a wide air layer as shown in Fig 15 As the impact progresses the air layer becomes large air pockets entrapped by water and bottom wall (Fig 15a) then it collapses into many smaller air pockets (Fig 15b)
(a)
(b)Fig 15 Formation of air pocket on the bottom wall (a)
large air layer on the bottom (b) air layer broken into smaller air pockets
The pressure oscillation can be explained by the results presented in Fig 16 The water flow followed by the impact moment produces pressure oscillation in the bubble regions When the air pockets are compressed by surround fluid motion the air pressure exceeds the surrounding water pressure as shown in Fig 16a At this time the air pockets size reduces due to air compression Later the air pocket with higher pressure redirects the water flow away from the air bubble and this process results in a lower pressure in the air than in the surrounding fluid as shown in Fig 16b At this time the air pocket expands Throughout this process the air pocket acts as a spring that absorbs the kinetic energy from the
impact moment and results in oscillations in pressure and force history This oscillation eventually decays due to viscous diffusion of the governing equations
(a)
(b)Fig 16 Pressure oscillation in the air pocket (a) bubble
compression(positive pressure) t=0276s (b) bubble expansion(negative pressure) t=0282s
425 Scale Effect
In order to investigate the effect of the domain size to the results a series of simulation was carried out with various domain sizes 1mtimes1m 2mtimes2m 4mtimes4m 8mtimes8m 16mtimes16m In order to quantify the air compressibility effect on this water drop example we propose air compressibility indicator based on the normalized impulse difference between compressible and incompressible air simulations as follows
Here is the impulse obtained from the incompressible air simulation and is the impulse from the compressible air model defined as follows
찬후피 안형택
JSNAK Vol 48 No 6 December 2011 589
where and are the force history for compressible and incompressible air models respectively and is the integration interval defined as
(a)
(b)Fig 17 Impulse difference ratio between the compres-
sible and incompressible air simulations (a) linear scale (b) log scale
Fig 17 shows the trend of impulse ratio value with respects to domain size The impulse ratio which is an indicator of air compressibility effect has its maximum for the scale of meters and diminishes either for the smaller size (length scale <) or for the larger size (length scale <) In other words the effects of air compressibility play a more important role when the domain size is in the order of meters whereas less significant for the domain very small or very large
This result seems to follows our intuition For very small scale the fluid inertia is not big enough for the air to feel compressibility effect For very large scale inertia is too big so the air compressibility plays minor role for the total impulse
The air compressibility seems to be the maximum when the length is meter scale where usual laboratory experiment is being conducted This result implies that air compressibility has to be considered more carefully for laboratory scale water impact experiments
5 Water Entry Problem51 Problem Definition
In order to strengthen the conclusion the effect of air com-pressibility we propose another yet more practical case which is a rigid body water entry problem The constant velocity water entry model in this study is presented as shown in Fig 18 In this model the tank size is L=1 m H=1 m and a rectangular rigid body with 01 m wide 01 m height The rectangular body is set to move downward from 01 m above the calm water free surface with constant speed of 14 ms which is the impact velocity in free-fall condition For impact pressure measurement a sensor point P0 is defined at the center on the bottom of the moving body As shown in figure 18 the boundary conditions are all set as no-slip wall con-ditions except for the tank top which is set as pressure outlet The pressure outlet boundary condition maintains a zero gauge pressure at the defined boundary which is desired for the tank top
Fig 18 General layout of the water entry problem and boundary conditions
52 Simulation Results521 Compressible Air
Fig 19 shows the pressure time history at the point P0 for the grid size 200x200 The time step convergence was studied
CFD 기반 유체충격 해석에서 공기 압축성 효과
590 대한조선학회논문집 제 48 권 제6 호 2011년 12월
with various time step sizes It was found that the larger time step case under-predicts the initial peak pressure As the time step refines the results converges especially if the step size is smaller than 02millisecond
Fig 19 Pressure time history at P0 compressible airIn term of structural response and damage prediction impulse
exerted to the structure during certain period of time is more important rather than a local pressure at a specific time moment(Faltinsen 1990 Shin et al 2010) In those sense we present the evolution of impulse during the water impact si-mulation Fig 20 shows that the impulse which is defined as the integral of the lift force with respect to time is converged when the grid size is refined
Fig 20 Impulse convergence study compressible airFurthermore the author like to emphasize that the oscillations
in the pressure as shown in Fig 19 is also observed in the experimental study by Shin et al(2010) in a similar manner which strengthens the validity of current simulation of water impact problem
522 Incompressible Air
Similar to the compressible air case we present time step refinement study for the grid size 200x200 The pressure time history is presented in Fig 21
Fig 21 Pressure time history at P0 incompressible airBy the comparison of compressible air simulation (Fig 19)
it is evident that air compressibility result in oscillations in the impact pressure history This oscillation is presumed to be due to the air-cushion effect that originated from the entrapped air pocket between the solid surface and water
Fig 22 Impulse convergence study incompressible airFig 22 shows the impulse convergence study of the in-
compressible air case Three grid sizes are employed 100times 100 200times200 400times400 The impulse time history of the incompressible air model shows monotonic increase of the impulse value whereas the compressible air model reveals oscillatory evolution of impulse on the body surface (Fig 20) This further strengthens our finding that the compressible air model correctly predicts the air-cushion effect at the impact moment
6 ConclusionAir compressibility effect in water impact problem is in-
vestigated by CFD simulations In order to investigate the air compressibility effect the air is modeled as compressible ideal gas as well as incompressible fluid For both cases the water is modeled as incompressible fluid By the comparison of impact load response compressible air model showed that oscillatory behavior in pressure and force histories acting on
찬후피 안형택
JSNAK Vol 48 No 6 December 2011 591
the solid surface Such oscillation decays as time goes due to the viscous dissipation On contrary incompressible air model showed no such oscillatory behavior in neither pressure nor force responses Incompressible air model showed only a single sharp peak in pressure and force response followed by the impact moment The current CFD simulation also resolved that the oscillation is due to the air pockets generated on the solid surface where the pressure oscillates Mesh refinement study showed that the impulse exerted during the impact process is convergent while further study is to be carried about the convergence of the peak pressure and forces Lastly the scale effect study showed that air compressibility represented by the impulse difference is biggest for the scale of meters which requests further investigation of air compressibility also in laboratory experiments
AcknowledgementThis work was supported by the 2009 Research Fund of
University of Ulsan
ReferencesFaltinsen OM 1990 Sea loads on ships and offshore
structures Cambridge University PressFluent 2008 Ver 63 User ManualGodderidge B Tunock S Earl C amp Tan M 2009 The
effect of fluid compressibility on the simulation of sloshing impacts Ocean Engineering 36 pp 578-587
Howison SD Ockendon JR amp Wilson SK 1991 Incompressible water-entry problems at small dead-rise angles Journal of Fluid Mechanics 222 pp 215ndash230
Kang CG amp Troesch A W 1990 Prediction of Hydrodynamic Impact Loads on Three-Dimensional Bodies Journal of the Society of Naval Architects of Korea 27(3) pp 73-88
Kleefsman KMT Fekken G Veldman AEP Buchner B amp Iwanowski B 2005 A Volume-of-Fluid based simulation method for wave impact problems Journal of Computational Physics 206 pp 363-393
Korobkin AA amp Iafrati A 2005 Hydrodynamic loads during initial stage of floating body impact Journal of Fluids and Structures 21 pp 413-427
Kwon SH Chung JY Kwak DW Lee SH amp Choi YM 2010 A Note on Slamming The 6th National Congress on Fluids Engineering Busan Republic of Korea 18-20 August 2010 pp 779-780
Lee BY Park JC Jung SJ Ryu MC amp Ki YS 2008 Numerical Simulation for Fluid Impact Load by Flat Plate with Incident Angles Journal of the Society of Naval Architects of Korea 45(1) pp 1-9
Nho I S Lee J M amp Yeom C W 2010 A Fundamental Study for Time History Modeling of Fluid Impact Pressure Journal of the Society of Naval Architects of Korea 47(2) pp 242-247
Scardovelli R amp Zaleski S 1999 Direct numerical simulation of free-surface and interfacial flow Annual Review of Fluid Mechanics 31 pp 567ndash603
Shin H Kim S-C amp Cho S-R 2010 Experimental Investigations on Slamming Impacts by Drop Tests Journal of the Society of Naval Architects of Korea 47(3) pp 410-420
Sun H amp Faltinsen OM 2006 Water impact of horizontal circular cylinders and cylindrical shells Applied Ocean Research 28 pp 299-311
Wu GX 1998 Hydrodynamic force on a rigid body during impact with liquid Journal of Fluids and Structures 12 pp 549ndash559
Wu G X Sun H amp He Y S 2004 Numerical simulation and experimental study of water entry of a wedge in free fall motion Journal of Fluid and Structures 19 pp 277ndash289
Yoon BS 1991 Lagrangian Finite Element Analysis of Water Impact Problem Journal of the Society of Naval Architects of Korea 28(1) pp 60-68
Yum DJ amp Yoon BS 2008 Numerical Simulation of Slamming Phenomena for 2-D Wedges Journal of the Society of Naval Architects of Korea 45(5) pp 477- 486
Zhang Y Zou Q amp Greaves D 2010 A level set immersed boundary method for water entry and exit Communication in Computational Physics 8 pp 265-288
Zhao R amp Faltinsen O 1993 Water Entry of Two- dimensional Bodies Journal of Fluid Mechanics 246 pp 593-612
찬 후 피 안 형 택
CFD 기반 유체충격 해석에서 공기 압축성 효과
582 대한조선학회논문집 제 48 권 제6 호 2011년 12월
often involves air trapping and air cushion effect A pioneering experimental work of flat bottom water slamming is being carried out by Kwon et al (2010) In this case the compressibility effects of air may play an important role and its effect is not clearly reported A new computational research for better understanding of water impact and air compressibility associated with it is also desired
In this study air is considered both compressible and incompressible media by employing compressible Navier-Stokes equations for ideal gas and incompressible Navier-Stokes equations for incompressible air model respectively Volume- of-fluid (VOF) method is used to describe deformation of free surface In order to save time and effort related to the de-velopment and verification of two different sets of flow solvers (compressible and incompressible Navier-Stokes solvers) a general purpose CFD package Fluent (2008) is utilized
The effect of air compressibility is investigated by the comparison of compressible and incompressible simulations The results are presented in impact pressure on the solid surface forces acting on the solid surface and impulse exerted during the impact process Also the effect of air compressibility with respected to different domain sizes is investigated
This paper is organized as follows In Sec 2 the governing equations for both compressible and incompressible flows are presented For the free surface representation the basic concept of Volume-of-Fluid method is introduced In order to check the validity of current compressible air model a simple compression test involving evolving free surface is presented in Sec 3 The role of air compressibility is presented in Sec 4 by considering water drop impact on the flat solid surface Histories of pressure force impulses are compared for compressible and incompressible models Time step refinement and mesh refinement study is presented for the convergence check Scale effect is also discussed with a series of simulations with different domain size This paper is summarized in the following conclusion section
2 Governing EquationsIn this section we present two sets of governing equations
namely compressible and incompressible Navier-Stokes equations For the representation of free surface evolution volume-of-fluid (VOF) method is employed and its basic concept is presented
21 Compressible Navier-Stokes EquationsIn order to consider the compressibility of the air we consider
the compressible Navier-Stokes equations The compressible Navier-Stokes equations consisted of continuity momentum
and energy equations can be expressed as follows in differential form
nabla∙ (1)
nabla∙∙ (2)
Here is the density of the fluid is the fluid velocity is the body force per unit mass is the stress tensor whose components are expressed as follows
where is the pressure is the viscosity and is the second coefficient of viscosity
nabla∙nabla∙∙nabla∙∙ (3)
For the energy equation as shown in Eq (3) is the total energy per unit volume and is the heat flux
The system of compressible Navier-Stokes equations is composed of equations where is the number of spatial dimensions Whereas the unknowns appearing in the system are and the velocity components ie total unknowns Hence two auxiliary equations are necessary for the system of equations to be closed
The above two equation are general representation of thermal and caloric equations of state respectively For ideal and calorically perfect gas (gas at relatively low temperature) the above equations can be expressed as follows
where is the specific heat at constant volume
22 Incompressible Navier-Stokes EquationsThe flow can be considered as incompressible in case the
density variation is negligible regardless of pressure Typically low speed air flow and most of water flow can be considered as incompressible Once the flow is assumed as incompressible then the density is constant and the original compressible
찬후피 안형택
JSNAK Vol 48 No 6 December 2011 583
Navier-stokes equations can be simplified as follows
nabla∙ (4)
∙nablanabla∙ (5)
where is the viscous stress tensor and its component is defined as follows
The above system of equations composed of continuity and
momentum equation involves unknowns of and velocity com-ponents The incompressible Navier-Stokes equations are now closed to be solved
23 Volume-of-fluid MethodIn order to represent dynamically evolving free surface we
employ Volume-of-Fluid method The volume of fluid (VOF) method is a numerical technique for tracking and locating the free surface or fluid-fluid interface It belongs to the class of Eulerian methods that represents the moving interface based on volume-fraction information being updated at each time
The method is based on the idea of so called volume fraction function It is defined as the integral of fluidrsquos characteristic function in the control volume Basically if the cell is empty (there is no traced fluid inside) if the cell is full we have and if the interface cuts the cell then <<
The fraction function is a scalar function and convected passively by the fluid velocity The evolution equation of the volume fraction can be represented simply by an advection equation described as follows
∙nabla (6)
Based on the volume fraction at each computational cell interface between the air and water is represented by the Piecewise-Linear Interface Calculation (PLIC) scheme
3 Simple Compression Test31 Problem Definition
The purpose of this test is to validate compressible air
model governed by compressible Navier-Stokes equations A schematic diagram of the simple compression test model is presented in Fig 1
In this test the tank size is 01 m in width 1 m in height and the lower half of this tank is filled with water at the initial configuration i e the water column has a initial height of 05 m Now the water column is set to move upward with constant velocity of 0001 ms by the imposition of the bottom boundary as a velocity inlet
Fig 1 General layout of the compression testWater is considered as viscous fluid with a constant density
Air is considered as ideal gas with a reference temperature of 29815(K) The flow is modeled as laminar The left wall right wall and top wall are treated as a stationary wall with no slip condition In this compression test two different wall boundary condition is applied for the energy equations namely isothermal (constant temperature) and adiabatic (no heat flux) wall boundary conditions
32 ResultsThe rectangular domain is discretized by using quadrilateral
cells The grid size of 100times100 and the time step size of 005 second were employed The result of this simple compression is displayed in Fig 2 for adiabatic wall and Fig 5 for isothermal wall boundary conditions
In the adiabatic compressibility model as shown in Fig 2 there is a noticeable deviation of pressure-density relationship from the ideal gas low especially at the beginning of the compression This deviation is caused by the temperature increase of air phase due to the adiabatic compression As the compression progresses heat exchange between the air and water phase decrease the air temperature as shown in
CFD 기반 유체충격 해석에서 공기 압축성 효과
584 대한조선학회논문집 제 48 권 제6 호 2011년 12월
Fig 3 Overall the pressure density relationship follows the ideal gad law well except at the initial stage of air temperature increase
Fig 2 Pressure-density relation of the compressible air during the simple compression test-adiabatic wall boundary
Fig 3 Temperature history of the compressible air during the simple compression test-adiabatic wall boundary
In the isothermal compressibility model the wall temperature is fixed to the initial air temperature Hence the air tem-perature is kept almost constant though the entire compression progresses This is shown in Fig 5 It is also confirmed that
Fig 4 Pressure-density relation of the air phase with the isothermal compressibility model
with constant air temperature the pressure-density relation follows perfectly the one obtained by the ideal gas law as shown in Fig 4 This result strengthens the validity of the current compressible air modeling
Fig 5 Temperature history of the air phase with the iso-thermal compressibility model
Fig 6 shows snapshots of the airwater interface evolution at different time moments For the result the adiabatic wall boundary condition is used Slight asymmetricity in the interface can be attributed to the non-linear nature of the Navier-Stokes equations
Fig 6 Water phase evolution with the adiabatic com-pressibility model Red-water blue-air
4 Water Drop Problem41 Problem Definition
The water impact problem modeled in this study is illustrated in Fig 7 In this model the tank size is L=1 m and H=1 m Initially a block of water (L=04 m and H=04 m) is located at the center of the tank For impact pressure measurements on the bottom wall a sensor point P0(05 m 0 m) is located at the center of the bottom
찬후피 안형택
JSNAK Vol 48 No 6 December 2011 585
Water is considered as viscous fluid with a constant density Flow is considered as laminar and no turbulence model is employed Since the major interest of current study is about water impact force which is an inertia-dominated force no effect of turbulence is encountered although further investigation about the effect of turbulence is strongly encouraged Air is considered in two different models constant density incom-pressible air and compressible air following ideal gas law as validated in the previous section The flow is modeled as laminar
As shown in Fig 7 the boundary conditions are all set as adiabatic no-slip wall conditions except for the tank top which is set as pressure outlet The pressure outlet boundary condition maintains a zero gauge pressure (same as the atmospheric pressure) at the defined boundary which is desired for the tank top The falling of the fresh water block initially at rest is initiated by the gravitational acceleration
The size of time step plays an important role in unsteady simulation of fluid flow We present time step refinement study for two different levels of meshes to check if the solution converges as the time step refines Three levels of successively refined time steps were used to examine its effects to the results
A proper time step which provides converged results is a function of grid size applied to the problem For the case A1 100times100 mesh considering ∆ sec and the approximate impact velocity the maximum value of Courant number over the domain can be approximated as ∆
∆ The initial time step for the time
step refinement study is determined based on the previous computation so that the maximum Courant number near the free surface does not violate the CFL stability condition The Courant number for this test was set to 025
Fig 7 General layout of the water drop test
42 Results421 Compressible Air
In order to see the effect of air compressibility the air is considered as compressible ideal gas The time histories of pressure and vertical force acting on the bottom surface are shown in Fig 8 and Fig 9 respectively Both of the figures show large scale oscillation in pressure as well as force history exerted on the entire bottom wall This indicates that the compressible air may attribute to energy absorbing and releasing mechanism obtained at the impact moment The linkage between the compressible air and pressure and force oscillation is further investigated in the following sections
Another observation from the figures is that the results indeed converge when the time step becomes smaller than
Fig 8 Compressible air pressure history measured at P0 (bottom center) with successively refined time steps Oscillation in pressure history is evident Grid-100 times100 is used
Fig 9 Compressible air vertical force exerted on the bottom wall with successively refined time steps Negative force indicated downward force Oscillation in force history is clearly resolved Grid-100times100 is used
CFD 기반 유체충격 해석에서 공기 압축성 효과
586 대한조선학회논문집 제 48 권 제6 호 2011년 12월
02millisecond for 100times100 grid This study also shows that larger time step under-predicts the pressures and the vertical forces
422 Incompressible Air
Now the air is model as incompressible fluid Similar to the compressible air case we present time step refinement study for A1 100times100 mesh The pressure history is presented in Fig 10 and the vertical force acting on the bottom surface is presented in Fig 11
Fig 10 Incompressible air pressure history measured P0 (bottom center) No oscillation is observed Grid- 100times100 is used
Fig 11 Incompressible air vertical force acting on the bottom wall No oscillation is observed Grid-100 times100 is used
By the comparison of compressible air case(Fig 8-9) and incompressible air case(Fig 10-11) two important observations can be drawn First it is evident that air compressibility result in oscillations in the pressure as well as force acting on the bottom wall Second the incompressible air case shows much higher and sharp peak history than the compressible air case
Based on this observation it can be presumed that the oscillation is due to the air-cushion effect that originated from the entrapped air pocket between the solid surface and water Such air pocket acts as a bumper to reduce the peak values in impact pressure and force as well as oscillation after the impact Further evidence of our conjecture will be presented in the following sections
423 Grid Refinement Study
It is well known that CFD results are sensitive to grid sizes Three levels of successively refined meshes were used to check the convergence and sensitivity of the results depending on the mesh resolution A1 100times100 (ie single cell size 10mm times10mm) A2 200times200 (ie single cell size 5mmtimes5mm) A3 400times400 (ie single cell size 25mmtimes25 mm)
As shown in Fig 12-13 the peak values of the pressure
(a)
(b)Fig 12 Mesh convergence study pressure history at bottom
center obtained by successively refined meshes (a) compressible air (b) incompressible air Com-pressible air cases show oscillation and lower peak values than incompressible air cases
찬후피 안형택
JSNAK Vol 48 No 6 December 2011 587
and force highly depend on the mesh resolution The results are extremely sensitive to the mesh resolution rather than the time step size
Based on the observation of Fig 12 and 13 there is no conclusive evidence of mesh convergence in peak pressure and force In fact the difference of peak value is rather be-comes larger as mesh refines which indicates typical divergence This is clearly not a favorable indication for the validity of the result Further investigation is necessary for the conclusive result about mesh refinement study
(a)
(b)Fig 13 Mesh convergence study vertical force history
obtained by successively refined meshes (a) compressible air model (b) incompressible air model Compressible air cases show oscillation and lower peak values than incompressible air cases
However in terms of the structural response and damage prediction impulse exerted to the structure during certain period of time is more critical than a local pressureforce at a specific time moment In that sense we present the evolution of impulse during the water impact simulation Fig 15 shows that the impulse defined as
which is the integration of the force with respect to the simulation time As shown in Fig 14 superior mesh converge is obtained for impulse history which is contrast to the pressure and force histories
(a)
(b)Fig 14 Impulse predicted by using various grid sizes (a)
compressible air model (b) incompressible air model Oscillation is observed in the impulse history for compressible air case while no such oscillation observed for incompressible air case
As shown in Fig 14 the compressible air model reveals oscillatory evolution of impulse on the solid surface whereas the incompressible air model shows monotonic increase of the impulse Regardless of the model both cases show convergence in impulse history as mesh refines
424 Air Pockets and Pressure Oscillation
For the compressible air model the fluid impact on the
CFD 기반 유체충격 해석에서 공기 압축성 효과
588 대한조선학회논문집 제 48 권 제6 호 2011년 12월
tank wall results in the formation of a wide air layer as shown in Fig 15 As the impact progresses the air layer becomes large air pockets entrapped by water and bottom wall (Fig 15a) then it collapses into many smaller air pockets (Fig 15b)
(a)
(b)Fig 15 Formation of air pocket on the bottom wall (a)
large air layer on the bottom (b) air layer broken into smaller air pockets
The pressure oscillation can be explained by the results presented in Fig 16 The water flow followed by the impact moment produces pressure oscillation in the bubble regions When the air pockets are compressed by surround fluid motion the air pressure exceeds the surrounding water pressure as shown in Fig 16a At this time the air pockets size reduces due to air compression Later the air pocket with higher pressure redirects the water flow away from the air bubble and this process results in a lower pressure in the air than in the surrounding fluid as shown in Fig 16b At this time the air pocket expands Throughout this process the air pocket acts as a spring that absorbs the kinetic energy from the
impact moment and results in oscillations in pressure and force history This oscillation eventually decays due to viscous diffusion of the governing equations
(a)
(b)Fig 16 Pressure oscillation in the air pocket (a) bubble
compression(positive pressure) t=0276s (b) bubble expansion(negative pressure) t=0282s
425 Scale Effect
In order to investigate the effect of the domain size to the results a series of simulation was carried out with various domain sizes 1mtimes1m 2mtimes2m 4mtimes4m 8mtimes8m 16mtimes16m In order to quantify the air compressibility effect on this water drop example we propose air compressibility indicator based on the normalized impulse difference between compressible and incompressible air simulations as follows
Here is the impulse obtained from the incompressible air simulation and is the impulse from the compressible air model defined as follows
찬후피 안형택
JSNAK Vol 48 No 6 December 2011 589
where and are the force history for compressible and incompressible air models respectively and is the integration interval defined as
(a)
(b)Fig 17 Impulse difference ratio between the compres-
sible and incompressible air simulations (a) linear scale (b) log scale
Fig 17 shows the trend of impulse ratio value with respects to domain size The impulse ratio which is an indicator of air compressibility effect has its maximum for the scale of meters and diminishes either for the smaller size (length scale <) or for the larger size (length scale <) In other words the effects of air compressibility play a more important role when the domain size is in the order of meters whereas less significant for the domain very small or very large
This result seems to follows our intuition For very small scale the fluid inertia is not big enough for the air to feel compressibility effect For very large scale inertia is too big so the air compressibility plays minor role for the total impulse
The air compressibility seems to be the maximum when the length is meter scale where usual laboratory experiment is being conducted This result implies that air compressibility has to be considered more carefully for laboratory scale water impact experiments
5 Water Entry Problem51 Problem Definition
In order to strengthen the conclusion the effect of air com-pressibility we propose another yet more practical case which is a rigid body water entry problem The constant velocity water entry model in this study is presented as shown in Fig 18 In this model the tank size is L=1 m H=1 m and a rectangular rigid body with 01 m wide 01 m height The rectangular body is set to move downward from 01 m above the calm water free surface with constant speed of 14 ms which is the impact velocity in free-fall condition For impact pressure measurement a sensor point P0 is defined at the center on the bottom of the moving body As shown in figure 18 the boundary conditions are all set as no-slip wall con-ditions except for the tank top which is set as pressure outlet The pressure outlet boundary condition maintains a zero gauge pressure at the defined boundary which is desired for the tank top
Fig 18 General layout of the water entry problem and boundary conditions
52 Simulation Results521 Compressible Air
Fig 19 shows the pressure time history at the point P0 for the grid size 200x200 The time step convergence was studied
CFD 기반 유체충격 해석에서 공기 압축성 효과
590 대한조선학회논문집 제 48 권 제6 호 2011년 12월
with various time step sizes It was found that the larger time step case under-predicts the initial peak pressure As the time step refines the results converges especially if the step size is smaller than 02millisecond
Fig 19 Pressure time history at P0 compressible airIn term of structural response and damage prediction impulse
exerted to the structure during certain period of time is more important rather than a local pressure at a specific time moment(Faltinsen 1990 Shin et al 2010) In those sense we present the evolution of impulse during the water impact si-mulation Fig 20 shows that the impulse which is defined as the integral of the lift force with respect to time is converged when the grid size is refined
Fig 20 Impulse convergence study compressible airFurthermore the author like to emphasize that the oscillations
in the pressure as shown in Fig 19 is also observed in the experimental study by Shin et al(2010) in a similar manner which strengthens the validity of current simulation of water impact problem
522 Incompressible Air
Similar to the compressible air case we present time step refinement study for the grid size 200x200 The pressure time history is presented in Fig 21
Fig 21 Pressure time history at P0 incompressible airBy the comparison of compressible air simulation (Fig 19)
it is evident that air compressibility result in oscillations in the impact pressure history This oscillation is presumed to be due to the air-cushion effect that originated from the entrapped air pocket between the solid surface and water
Fig 22 Impulse convergence study incompressible airFig 22 shows the impulse convergence study of the in-
compressible air case Three grid sizes are employed 100times 100 200times200 400times400 The impulse time history of the incompressible air model shows monotonic increase of the impulse value whereas the compressible air model reveals oscillatory evolution of impulse on the body surface (Fig 20) This further strengthens our finding that the compressible air model correctly predicts the air-cushion effect at the impact moment
6 ConclusionAir compressibility effect in water impact problem is in-
vestigated by CFD simulations In order to investigate the air compressibility effect the air is modeled as compressible ideal gas as well as incompressible fluid For both cases the water is modeled as incompressible fluid By the comparison of impact load response compressible air model showed that oscillatory behavior in pressure and force histories acting on
찬후피 안형택
JSNAK Vol 48 No 6 December 2011 591
the solid surface Such oscillation decays as time goes due to the viscous dissipation On contrary incompressible air model showed no such oscillatory behavior in neither pressure nor force responses Incompressible air model showed only a single sharp peak in pressure and force response followed by the impact moment The current CFD simulation also resolved that the oscillation is due to the air pockets generated on the solid surface where the pressure oscillates Mesh refinement study showed that the impulse exerted during the impact process is convergent while further study is to be carried about the convergence of the peak pressure and forces Lastly the scale effect study showed that air compressibility represented by the impulse difference is biggest for the scale of meters which requests further investigation of air compressibility also in laboratory experiments
AcknowledgementThis work was supported by the 2009 Research Fund of
University of Ulsan
ReferencesFaltinsen OM 1990 Sea loads on ships and offshore
structures Cambridge University PressFluent 2008 Ver 63 User ManualGodderidge B Tunock S Earl C amp Tan M 2009 The
effect of fluid compressibility on the simulation of sloshing impacts Ocean Engineering 36 pp 578-587
Howison SD Ockendon JR amp Wilson SK 1991 Incompressible water-entry problems at small dead-rise angles Journal of Fluid Mechanics 222 pp 215ndash230
Kang CG amp Troesch A W 1990 Prediction of Hydrodynamic Impact Loads on Three-Dimensional Bodies Journal of the Society of Naval Architects of Korea 27(3) pp 73-88
Kleefsman KMT Fekken G Veldman AEP Buchner B amp Iwanowski B 2005 A Volume-of-Fluid based simulation method for wave impact problems Journal of Computational Physics 206 pp 363-393
Korobkin AA amp Iafrati A 2005 Hydrodynamic loads during initial stage of floating body impact Journal of Fluids and Structures 21 pp 413-427
Kwon SH Chung JY Kwak DW Lee SH amp Choi YM 2010 A Note on Slamming The 6th National Congress on Fluids Engineering Busan Republic of Korea 18-20 August 2010 pp 779-780
Lee BY Park JC Jung SJ Ryu MC amp Ki YS 2008 Numerical Simulation for Fluid Impact Load by Flat Plate with Incident Angles Journal of the Society of Naval Architects of Korea 45(1) pp 1-9
Nho I S Lee J M amp Yeom C W 2010 A Fundamental Study for Time History Modeling of Fluid Impact Pressure Journal of the Society of Naval Architects of Korea 47(2) pp 242-247
Scardovelli R amp Zaleski S 1999 Direct numerical simulation of free-surface and interfacial flow Annual Review of Fluid Mechanics 31 pp 567ndash603
Shin H Kim S-C amp Cho S-R 2010 Experimental Investigations on Slamming Impacts by Drop Tests Journal of the Society of Naval Architects of Korea 47(3) pp 410-420
Sun H amp Faltinsen OM 2006 Water impact of horizontal circular cylinders and cylindrical shells Applied Ocean Research 28 pp 299-311
Wu GX 1998 Hydrodynamic force on a rigid body during impact with liquid Journal of Fluids and Structures 12 pp 549ndash559
Wu G X Sun H amp He Y S 2004 Numerical simulation and experimental study of water entry of a wedge in free fall motion Journal of Fluid and Structures 19 pp 277ndash289
Yoon BS 1991 Lagrangian Finite Element Analysis of Water Impact Problem Journal of the Society of Naval Architects of Korea 28(1) pp 60-68
Yum DJ amp Yoon BS 2008 Numerical Simulation of Slamming Phenomena for 2-D Wedges Journal of the Society of Naval Architects of Korea 45(5) pp 477- 486
Zhang Y Zou Q amp Greaves D 2010 A level set immersed boundary method for water entry and exit Communication in Computational Physics 8 pp 265-288
Zhao R amp Faltinsen O 1993 Water Entry of Two- dimensional Bodies Journal of Fluid Mechanics 246 pp 593-612
찬 후 피 안 형 택
찬후피 안형택
JSNAK Vol 48 No 6 December 2011 583
Navier-stokes equations can be simplified as follows
nabla∙ (4)
∙nablanabla∙ (5)
where is the viscous stress tensor and its component is defined as follows
The above system of equations composed of continuity and
momentum equation involves unknowns of and velocity com-ponents The incompressible Navier-Stokes equations are now closed to be solved
23 Volume-of-fluid MethodIn order to represent dynamically evolving free surface we
employ Volume-of-Fluid method The volume of fluid (VOF) method is a numerical technique for tracking and locating the free surface or fluid-fluid interface It belongs to the class of Eulerian methods that represents the moving interface based on volume-fraction information being updated at each time
The method is based on the idea of so called volume fraction function It is defined as the integral of fluidrsquos characteristic function in the control volume Basically if the cell is empty (there is no traced fluid inside) if the cell is full we have and if the interface cuts the cell then <<
The fraction function is a scalar function and convected passively by the fluid velocity The evolution equation of the volume fraction can be represented simply by an advection equation described as follows
∙nabla (6)
Based on the volume fraction at each computational cell interface between the air and water is represented by the Piecewise-Linear Interface Calculation (PLIC) scheme
3 Simple Compression Test31 Problem Definition
The purpose of this test is to validate compressible air
model governed by compressible Navier-Stokes equations A schematic diagram of the simple compression test model is presented in Fig 1
In this test the tank size is 01 m in width 1 m in height and the lower half of this tank is filled with water at the initial configuration i e the water column has a initial height of 05 m Now the water column is set to move upward with constant velocity of 0001 ms by the imposition of the bottom boundary as a velocity inlet
Fig 1 General layout of the compression testWater is considered as viscous fluid with a constant density
Air is considered as ideal gas with a reference temperature of 29815(K) The flow is modeled as laminar The left wall right wall and top wall are treated as a stationary wall with no slip condition In this compression test two different wall boundary condition is applied for the energy equations namely isothermal (constant temperature) and adiabatic (no heat flux) wall boundary conditions
32 ResultsThe rectangular domain is discretized by using quadrilateral
cells The grid size of 100times100 and the time step size of 005 second were employed The result of this simple compression is displayed in Fig 2 for adiabatic wall and Fig 5 for isothermal wall boundary conditions
In the adiabatic compressibility model as shown in Fig 2 there is a noticeable deviation of pressure-density relationship from the ideal gas low especially at the beginning of the compression This deviation is caused by the temperature increase of air phase due to the adiabatic compression As the compression progresses heat exchange between the air and water phase decrease the air temperature as shown in
CFD 기반 유체충격 해석에서 공기 압축성 효과
584 대한조선학회논문집 제 48 권 제6 호 2011년 12월
Fig 3 Overall the pressure density relationship follows the ideal gad law well except at the initial stage of air temperature increase
Fig 2 Pressure-density relation of the compressible air during the simple compression test-adiabatic wall boundary
Fig 3 Temperature history of the compressible air during the simple compression test-adiabatic wall boundary
In the isothermal compressibility model the wall temperature is fixed to the initial air temperature Hence the air tem-perature is kept almost constant though the entire compression progresses This is shown in Fig 5 It is also confirmed that
Fig 4 Pressure-density relation of the air phase with the isothermal compressibility model
with constant air temperature the pressure-density relation follows perfectly the one obtained by the ideal gas law as shown in Fig 4 This result strengthens the validity of the current compressible air modeling
Fig 5 Temperature history of the air phase with the iso-thermal compressibility model
Fig 6 shows snapshots of the airwater interface evolution at different time moments For the result the adiabatic wall boundary condition is used Slight asymmetricity in the interface can be attributed to the non-linear nature of the Navier-Stokes equations
Fig 6 Water phase evolution with the adiabatic com-pressibility model Red-water blue-air
4 Water Drop Problem41 Problem Definition
The water impact problem modeled in this study is illustrated in Fig 7 In this model the tank size is L=1 m and H=1 m Initially a block of water (L=04 m and H=04 m) is located at the center of the tank For impact pressure measurements on the bottom wall a sensor point P0(05 m 0 m) is located at the center of the bottom
찬후피 안형택
JSNAK Vol 48 No 6 December 2011 585
Water is considered as viscous fluid with a constant density Flow is considered as laminar and no turbulence model is employed Since the major interest of current study is about water impact force which is an inertia-dominated force no effect of turbulence is encountered although further investigation about the effect of turbulence is strongly encouraged Air is considered in two different models constant density incom-pressible air and compressible air following ideal gas law as validated in the previous section The flow is modeled as laminar
As shown in Fig 7 the boundary conditions are all set as adiabatic no-slip wall conditions except for the tank top which is set as pressure outlet The pressure outlet boundary condition maintains a zero gauge pressure (same as the atmospheric pressure) at the defined boundary which is desired for the tank top The falling of the fresh water block initially at rest is initiated by the gravitational acceleration
The size of time step plays an important role in unsteady simulation of fluid flow We present time step refinement study for two different levels of meshes to check if the solution converges as the time step refines Three levels of successively refined time steps were used to examine its effects to the results
A proper time step which provides converged results is a function of grid size applied to the problem For the case A1 100times100 mesh considering ∆ sec and the approximate impact velocity the maximum value of Courant number over the domain can be approximated as ∆
∆ The initial time step for the time
step refinement study is determined based on the previous computation so that the maximum Courant number near the free surface does not violate the CFL stability condition The Courant number for this test was set to 025
Fig 7 General layout of the water drop test
42 Results421 Compressible Air
In order to see the effect of air compressibility the air is considered as compressible ideal gas The time histories of pressure and vertical force acting on the bottom surface are shown in Fig 8 and Fig 9 respectively Both of the figures show large scale oscillation in pressure as well as force history exerted on the entire bottom wall This indicates that the compressible air may attribute to energy absorbing and releasing mechanism obtained at the impact moment The linkage between the compressible air and pressure and force oscillation is further investigated in the following sections
Another observation from the figures is that the results indeed converge when the time step becomes smaller than
Fig 8 Compressible air pressure history measured at P0 (bottom center) with successively refined time steps Oscillation in pressure history is evident Grid-100 times100 is used
Fig 9 Compressible air vertical force exerted on the bottom wall with successively refined time steps Negative force indicated downward force Oscillation in force history is clearly resolved Grid-100times100 is used
CFD 기반 유체충격 해석에서 공기 압축성 효과
586 대한조선학회논문집 제 48 권 제6 호 2011년 12월
02millisecond for 100times100 grid This study also shows that larger time step under-predicts the pressures and the vertical forces
422 Incompressible Air
Now the air is model as incompressible fluid Similar to the compressible air case we present time step refinement study for A1 100times100 mesh The pressure history is presented in Fig 10 and the vertical force acting on the bottom surface is presented in Fig 11
Fig 10 Incompressible air pressure history measured P0 (bottom center) No oscillation is observed Grid- 100times100 is used
Fig 11 Incompressible air vertical force acting on the bottom wall No oscillation is observed Grid-100 times100 is used
By the comparison of compressible air case(Fig 8-9) and incompressible air case(Fig 10-11) two important observations can be drawn First it is evident that air compressibility result in oscillations in the pressure as well as force acting on the bottom wall Second the incompressible air case shows much higher and sharp peak history than the compressible air case
Based on this observation it can be presumed that the oscillation is due to the air-cushion effect that originated from the entrapped air pocket between the solid surface and water Such air pocket acts as a bumper to reduce the peak values in impact pressure and force as well as oscillation after the impact Further evidence of our conjecture will be presented in the following sections
423 Grid Refinement Study
It is well known that CFD results are sensitive to grid sizes Three levels of successively refined meshes were used to check the convergence and sensitivity of the results depending on the mesh resolution A1 100times100 (ie single cell size 10mm times10mm) A2 200times200 (ie single cell size 5mmtimes5mm) A3 400times400 (ie single cell size 25mmtimes25 mm)
As shown in Fig 12-13 the peak values of the pressure
(a)
(b)Fig 12 Mesh convergence study pressure history at bottom
center obtained by successively refined meshes (a) compressible air (b) incompressible air Com-pressible air cases show oscillation and lower peak values than incompressible air cases
찬후피 안형택
JSNAK Vol 48 No 6 December 2011 587
and force highly depend on the mesh resolution The results are extremely sensitive to the mesh resolution rather than the time step size
Based on the observation of Fig 12 and 13 there is no conclusive evidence of mesh convergence in peak pressure and force In fact the difference of peak value is rather be-comes larger as mesh refines which indicates typical divergence This is clearly not a favorable indication for the validity of the result Further investigation is necessary for the conclusive result about mesh refinement study
(a)
(b)Fig 13 Mesh convergence study vertical force history
obtained by successively refined meshes (a) compressible air model (b) incompressible air model Compressible air cases show oscillation and lower peak values than incompressible air cases
However in terms of the structural response and damage prediction impulse exerted to the structure during certain period of time is more critical than a local pressureforce at a specific time moment In that sense we present the evolution of impulse during the water impact simulation Fig 15 shows that the impulse defined as
which is the integration of the force with respect to the simulation time As shown in Fig 14 superior mesh converge is obtained for impulse history which is contrast to the pressure and force histories
(a)
(b)Fig 14 Impulse predicted by using various grid sizes (a)
compressible air model (b) incompressible air model Oscillation is observed in the impulse history for compressible air case while no such oscillation observed for incompressible air case
As shown in Fig 14 the compressible air model reveals oscillatory evolution of impulse on the solid surface whereas the incompressible air model shows monotonic increase of the impulse Regardless of the model both cases show convergence in impulse history as mesh refines
424 Air Pockets and Pressure Oscillation
For the compressible air model the fluid impact on the
CFD 기반 유체충격 해석에서 공기 압축성 효과
588 대한조선학회논문집 제 48 권 제6 호 2011년 12월
tank wall results in the formation of a wide air layer as shown in Fig 15 As the impact progresses the air layer becomes large air pockets entrapped by water and bottom wall (Fig 15a) then it collapses into many smaller air pockets (Fig 15b)
(a)
(b)Fig 15 Formation of air pocket on the bottom wall (a)
large air layer on the bottom (b) air layer broken into smaller air pockets
The pressure oscillation can be explained by the results presented in Fig 16 The water flow followed by the impact moment produces pressure oscillation in the bubble regions When the air pockets are compressed by surround fluid motion the air pressure exceeds the surrounding water pressure as shown in Fig 16a At this time the air pockets size reduces due to air compression Later the air pocket with higher pressure redirects the water flow away from the air bubble and this process results in a lower pressure in the air than in the surrounding fluid as shown in Fig 16b At this time the air pocket expands Throughout this process the air pocket acts as a spring that absorbs the kinetic energy from the
impact moment and results in oscillations in pressure and force history This oscillation eventually decays due to viscous diffusion of the governing equations
(a)
(b)Fig 16 Pressure oscillation in the air pocket (a) bubble
compression(positive pressure) t=0276s (b) bubble expansion(negative pressure) t=0282s
425 Scale Effect
In order to investigate the effect of the domain size to the results a series of simulation was carried out with various domain sizes 1mtimes1m 2mtimes2m 4mtimes4m 8mtimes8m 16mtimes16m In order to quantify the air compressibility effect on this water drop example we propose air compressibility indicator based on the normalized impulse difference between compressible and incompressible air simulations as follows
Here is the impulse obtained from the incompressible air simulation and is the impulse from the compressible air model defined as follows
찬후피 안형택
JSNAK Vol 48 No 6 December 2011 589
where and are the force history for compressible and incompressible air models respectively and is the integration interval defined as
(a)
(b)Fig 17 Impulse difference ratio between the compres-
sible and incompressible air simulations (a) linear scale (b) log scale
Fig 17 shows the trend of impulse ratio value with respects to domain size The impulse ratio which is an indicator of air compressibility effect has its maximum for the scale of meters and diminishes either for the smaller size (length scale <) or for the larger size (length scale <) In other words the effects of air compressibility play a more important role when the domain size is in the order of meters whereas less significant for the domain very small or very large
This result seems to follows our intuition For very small scale the fluid inertia is not big enough for the air to feel compressibility effect For very large scale inertia is too big so the air compressibility plays minor role for the total impulse
The air compressibility seems to be the maximum when the length is meter scale where usual laboratory experiment is being conducted This result implies that air compressibility has to be considered more carefully for laboratory scale water impact experiments
5 Water Entry Problem51 Problem Definition
In order to strengthen the conclusion the effect of air com-pressibility we propose another yet more practical case which is a rigid body water entry problem The constant velocity water entry model in this study is presented as shown in Fig 18 In this model the tank size is L=1 m H=1 m and a rectangular rigid body with 01 m wide 01 m height The rectangular body is set to move downward from 01 m above the calm water free surface with constant speed of 14 ms which is the impact velocity in free-fall condition For impact pressure measurement a sensor point P0 is defined at the center on the bottom of the moving body As shown in figure 18 the boundary conditions are all set as no-slip wall con-ditions except for the tank top which is set as pressure outlet The pressure outlet boundary condition maintains a zero gauge pressure at the defined boundary which is desired for the tank top
Fig 18 General layout of the water entry problem and boundary conditions
52 Simulation Results521 Compressible Air
Fig 19 shows the pressure time history at the point P0 for the grid size 200x200 The time step convergence was studied
CFD 기반 유체충격 해석에서 공기 압축성 효과
590 대한조선학회논문집 제 48 권 제6 호 2011년 12월
with various time step sizes It was found that the larger time step case under-predicts the initial peak pressure As the time step refines the results converges especially if the step size is smaller than 02millisecond
Fig 19 Pressure time history at P0 compressible airIn term of structural response and damage prediction impulse
exerted to the structure during certain period of time is more important rather than a local pressure at a specific time moment(Faltinsen 1990 Shin et al 2010) In those sense we present the evolution of impulse during the water impact si-mulation Fig 20 shows that the impulse which is defined as the integral of the lift force with respect to time is converged when the grid size is refined
Fig 20 Impulse convergence study compressible airFurthermore the author like to emphasize that the oscillations
in the pressure as shown in Fig 19 is also observed in the experimental study by Shin et al(2010) in a similar manner which strengthens the validity of current simulation of water impact problem
522 Incompressible Air
Similar to the compressible air case we present time step refinement study for the grid size 200x200 The pressure time history is presented in Fig 21
Fig 21 Pressure time history at P0 incompressible airBy the comparison of compressible air simulation (Fig 19)
it is evident that air compressibility result in oscillations in the impact pressure history This oscillation is presumed to be due to the air-cushion effect that originated from the entrapped air pocket between the solid surface and water
Fig 22 Impulse convergence study incompressible airFig 22 shows the impulse convergence study of the in-
compressible air case Three grid sizes are employed 100times 100 200times200 400times400 The impulse time history of the incompressible air model shows monotonic increase of the impulse value whereas the compressible air model reveals oscillatory evolution of impulse on the body surface (Fig 20) This further strengthens our finding that the compressible air model correctly predicts the air-cushion effect at the impact moment
6 ConclusionAir compressibility effect in water impact problem is in-
vestigated by CFD simulations In order to investigate the air compressibility effect the air is modeled as compressible ideal gas as well as incompressible fluid For both cases the water is modeled as incompressible fluid By the comparison of impact load response compressible air model showed that oscillatory behavior in pressure and force histories acting on
찬후피 안형택
JSNAK Vol 48 No 6 December 2011 591
the solid surface Such oscillation decays as time goes due to the viscous dissipation On contrary incompressible air model showed no such oscillatory behavior in neither pressure nor force responses Incompressible air model showed only a single sharp peak in pressure and force response followed by the impact moment The current CFD simulation also resolved that the oscillation is due to the air pockets generated on the solid surface where the pressure oscillates Mesh refinement study showed that the impulse exerted during the impact process is convergent while further study is to be carried about the convergence of the peak pressure and forces Lastly the scale effect study showed that air compressibility represented by the impulse difference is biggest for the scale of meters which requests further investigation of air compressibility also in laboratory experiments
AcknowledgementThis work was supported by the 2009 Research Fund of
University of Ulsan
ReferencesFaltinsen OM 1990 Sea loads on ships and offshore
structures Cambridge University PressFluent 2008 Ver 63 User ManualGodderidge B Tunock S Earl C amp Tan M 2009 The
effect of fluid compressibility on the simulation of sloshing impacts Ocean Engineering 36 pp 578-587
Howison SD Ockendon JR amp Wilson SK 1991 Incompressible water-entry problems at small dead-rise angles Journal of Fluid Mechanics 222 pp 215ndash230
Kang CG amp Troesch A W 1990 Prediction of Hydrodynamic Impact Loads on Three-Dimensional Bodies Journal of the Society of Naval Architects of Korea 27(3) pp 73-88
Kleefsman KMT Fekken G Veldman AEP Buchner B amp Iwanowski B 2005 A Volume-of-Fluid based simulation method for wave impact problems Journal of Computational Physics 206 pp 363-393
Korobkin AA amp Iafrati A 2005 Hydrodynamic loads during initial stage of floating body impact Journal of Fluids and Structures 21 pp 413-427
Kwon SH Chung JY Kwak DW Lee SH amp Choi YM 2010 A Note on Slamming The 6th National Congress on Fluids Engineering Busan Republic of Korea 18-20 August 2010 pp 779-780
Lee BY Park JC Jung SJ Ryu MC amp Ki YS 2008 Numerical Simulation for Fluid Impact Load by Flat Plate with Incident Angles Journal of the Society of Naval Architects of Korea 45(1) pp 1-9
Nho I S Lee J M amp Yeom C W 2010 A Fundamental Study for Time History Modeling of Fluid Impact Pressure Journal of the Society of Naval Architects of Korea 47(2) pp 242-247
Scardovelli R amp Zaleski S 1999 Direct numerical simulation of free-surface and interfacial flow Annual Review of Fluid Mechanics 31 pp 567ndash603
Shin H Kim S-C amp Cho S-R 2010 Experimental Investigations on Slamming Impacts by Drop Tests Journal of the Society of Naval Architects of Korea 47(3) pp 410-420
Sun H amp Faltinsen OM 2006 Water impact of horizontal circular cylinders and cylindrical shells Applied Ocean Research 28 pp 299-311
Wu GX 1998 Hydrodynamic force on a rigid body during impact with liquid Journal of Fluids and Structures 12 pp 549ndash559
Wu G X Sun H amp He Y S 2004 Numerical simulation and experimental study of water entry of a wedge in free fall motion Journal of Fluid and Structures 19 pp 277ndash289
Yoon BS 1991 Lagrangian Finite Element Analysis of Water Impact Problem Journal of the Society of Naval Architects of Korea 28(1) pp 60-68
Yum DJ amp Yoon BS 2008 Numerical Simulation of Slamming Phenomena for 2-D Wedges Journal of the Society of Naval Architects of Korea 45(5) pp 477- 486
Zhang Y Zou Q amp Greaves D 2010 A level set immersed boundary method for water entry and exit Communication in Computational Physics 8 pp 265-288
Zhao R amp Faltinsen O 1993 Water Entry of Two- dimensional Bodies Journal of Fluid Mechanics 246 pp 593-612
찬 후 피 안 형 택

CFD 기반 유체충격 해석에서 공기 압축성 효과
584 대한조선학회논문집 제 48 권 제6 호 2011년 12월
Fig 3 Overall the pressure density relationship follows the ideal gad law well except at the initial stage of air temperature increase
Fig 2 Pressure-density relation of the compressible air during the simple compression test-adiabatic wall boundary
Fig 3 Temperature history of the compressible air during the simple compression test-adiabatic wall boundary
In the isothermal compressibility model the wall temperature is fixed to the initial air temperature Hence the air tem-perature is kept almost constant though the entire compression progresses This is shown in Fig 5 It is also confirmed that
Fig 4 Pressure-density relation of the air phase with the isothermal compressibility model
with constant air temperature the pressure-density relation follows perfectly the one obtained by the ideal gas law as shown in Fig 4 This result strengthens the validity of the current compressible air modeling
Fig 5 Temperature history of the air phase with the iso-thermal compressibility model
Fig 6 shows snapshots of the airwater interface evolution at different time moments For the result the adiabatic wall boundary condition is used Slight asymmetricity in the interface can be attributed to the non-linear nature of the Navier-Stokes equations
Fig 6 Water phase evolution with the adiabatic com-pressibility model Red-water blue-air
4 Water Drop Problem41 Problem Definition
The water impact problem modeled in this study is illustrated in Fig 7 In this model the tank size is L=1 m and H=1 m Initially a block of water (L=04 m and H=04 m) is located at the center of the tank For impact pressure measurements on the bottom wall a sensor point P0(05 m 0 m) is located at the center of the bottom
찬후피 안형택
JSNAK Vol 48 No 6 December 2011 585
Water is considered as viscous fluid with a constant density Flow is considered as laminar and no turbulence model is employed Since the major interest of current study is about water impact force which is an inertia-dominated force no effect of turbulence is encountered although further investigation about the effect of turbulence is strongly encouraged Air is considered in two different models constant density incom-pressible air and compressible air following ideal gas law as validated in the previous section The flow is modeled as laminar
As shown in Fig 7 the boundary conditions are all set as adiabatic no-slip wall conditions except for the tank top which is set as pressure outlet The pressure outlet boundary condition maintains a zero gauge pressure (same as the atmospheric pressure) at the defined boundary which is desired for the tank top The falling of the fresh water block initially at rest is initiated by the gravitational acceleration
The size of time step plays an important role in unsteady simulation of fluid flow We present time step refinement study for two different levels of meshes to check if the solution converges as the time step refines Three levels of successively refined time steps were used to examine its effects to the results
A proper time step which provides converged results is a function of grid size applied to the problem For the case A1 100times100 mesh considering ∆ sec and the approximate impact velocity the maximum value of Courant number over the domain can be approximated as ∆
∆ The initial time step for the time
step refinement study is determined based on the previous computation so that the maximum Courant number near the free surface does not violate the CFL stability condition The Courant number for this test was set to 025
Fig 7 General layout of the water drop test
42 Results421 Compressible Air
In order to see the effect of air compressibility the air is considered as compressible ideal gas The time histories of pressure and vertical force acting on the bottom surface are shown in Fig 8 and Fig 9 respectively Both of the figures show large scale oscillation in pressure as well as force history exerted on the entire bottom wall This indicates that the compressible air may attribute to energy absorbing and releasing mechanism obtained at the impact moment The linkage between the compressible air and pressure and force oscillation is further investigated in the following sections
Another observation from the figures is that the results indeed converge when the time step becomes smaller than
Fig 8 Compressible air pressure history measured at P0 (bottom center) with successively refined time steps Oscillation in pressure history is evident Grid-100 times100 is used
Fig 9 Compressible air vertical force exerted on the bottom wall with successively refined time steps Negative force indicated downward force Oscillation in force history is clearly resolved Grid-100times100 is used
CFD 기반 유체충격 해석에서 공기 압축성 효과
586 대한조선학회논문집 제 48 권 제6 호 2011년 12월
02millisecond for 100times100 grid This study also shows that larger time step under-predicts the pressures and the vertical forces
422 Incompressible Air
Now the air is model as incompressible fluid Similar to the compressible air case we present time step refinement study for A1 100times100 mesh The pressure history is presented in Fig 10 and the vertical force acting on the bottom surface is presented in Fig 11
Fig 10 Incompressible air pressure history measured P0 (bottom center) No oscillation is observed Grid- 100times100 is used
Fig 11 Incompressible air vertical force acting on the bottom wall No oscillation is observed Grid-100 times100 is used
By the comparison of compressible air case(Fig 8-9) and incompressible air case(Fig 10-11) two important observations can be drawn First it is evident that air compressibility result in oscillations in the pressure as well as force acting on the bottom wall Second the incompressible air case shows much higher and sharp peak history than the compressible air case
Based on this observation it can be presumed that the oscillation is due to the air-cushion effect that originated from the entrapped air pocket between the solid surface and water Such air pocket acts as a bumper to reduce the peak values in impact pressure and force as well as oscillation after the impact Further evidence of our conjecture will be presented in the following sections
423 Grid Refinement Study
It is well known that CFD results are sensitive to grid sizes Three levels of successively refined meshes were used to check the convergence and sensitivity of the results depending on the mesh resolution A1 100times100 (ie single cell size 10mm times10mm) A2 200times200 (ie single cell size 5mmtimes5mm) A3 400times400 (ie single cell size 25mmtimes25 mm)
As shown in Fig 12-13 the peak values of the pressure
(a)
(b)Fig 12 Mesh convergence study pressure history at bottom
center obtained by successively refined meshes (a) compressible air (b) incompressible air Com-pressible air cases show oscillation and lower peak values than incompressible air cases
찬후피 안형택
JSNAK Vol 48 No 6 December 2011 587
and force highly depend on the mesh resolution The results are extremely sensitive to the mesh resolution rather than the time step size
Based on the observation of Fig 12 and 13 there is no conclusive evidence of mesh convergence in peak pressure and force In fact the difference of peak value is rather be-comes larger as mesh refines which indicates typical divergence This is clearly not a favorable indication for the validity of the result Further investigation is necessary for the conclusive result about mesh refinement study
(a)
(b)Fig 13 Mesh convergence study vertical force history
obtained by successively refined meshes (a) compressible air model (b) incompressible air model Compressible air cases show oscillation and lower peak values than incompressible air cases
However in terms of the structural response and damage prediction impulse exerted to the structure during certain period of time is more critical than a local pressureforce at a specific time moment In that sense we present the evolution of impulse during the water impact simulation Fig 15 shows that the impulse defined as
which is the integration of the force with respect to the simulation time As shown in Fig 14 superior mesh converge is obtained for impulse history which is contrast to the pressure and force histories
(a)
(b)Fig 14 Impulse predicted by using various grid sizes (a)
compressible air model (b) incompressible air model Oscillation is observed in the impulse history for compressible air case while no such oscillation observed for incompressible air case
As shown in Fig 14 the compressible air model reveals oscillatory evolution of impulse on the solid surface whereas the incompressible air model shows monotonic increase of the impulse Regardless of the model both cases show convergence in impulse history as mesh refines
424 Air Pockets and Pressure Oscillation
For the compressible air model the fluid impact on the
CFD 기반 유체충격 해석에서 공기 압축성 효과
588 대한조선학회논문집 제 48 권 제6 호 2011년 12월
tank wall results in the formation of a wide air layer as shown in Fig 15 As the impact progresses the air layer becomes large air pockets entrapped by water and bottom wall (Fig 15a) then it collapses into many smaller air pockets (Fig 15b)
(a)
(b)Fig 15 Formation of air pocket on the bottom wall (a)
large air layer on the bottom (b) air layer broken into smaller air pockets
The pressure oscillation can be explained by the results presented in Fig 16 The water flow followed by the impact moment produces pressure oscillation in the bubble regions When the air pockets are compressed by surround fluid motion the air pressure exceeds the surrounding water pressure as shown in Fig 16a At this time the air pockets size reduces due to air compression Later the air pocket with higher pressure redirects the water flow away from the air bubble and this process results in a lower pressure in the air than in the surrounding fluid as shown in Fig 16b At this time the air pocket expands Throughout this process the air pocket acts as a spring that absorbs the kinetic energy from the
impact moment and results in oscillations in pressure and force history This oscillation eventually decays due to viscous diffusion of the governing equations
(a)
(b)Fig 16 Pressure oscillation in the air pocket (a) bubble
compression(positive pressure) t=0276s (b) bubble expansion(negative pressure) t=0282s
425 Scale Effect
In order to investigate the effect of the domain size to the results a series of simulation was carried out with various domain sizes 1mtimes1m 2mtimes2m 4mtimes4m 8mtimes8m 16mtimes16m In order to quantify the air compressibility effect on this water drop example we propose air compressibility indicator based on the normalized impulse difference between compressible and incompressible air simulations as follows
Here is the impulse obtained from the incompressible air simulation and is the impulse from the compressible air model defined as follows
찬후피 안형택
JSNAK Vol 48 No 6 December 2011 589
where and are the force history for compressible and incompressible air models respectively and is the integration interval defined as
(a)
(b)Fig 17 Impulse difference ratio between the compres-
sible and incompressible air simulations (a) linear scale (b) log scale
Fig 17 shows the trend of impulse ratio value with respects to domain size The impulse ratio which is an indicator of air compressibility effect has its maximum for the scale of meters and diminishes either for the smaller size (length scale <) or for the larger size (length scale <) In other words the effects of air compressibility play a more important role when the domain size is in the order of meters whereas less significant for the domain very small or very large
This result seems to follows our intuition For very small scale the fluid inertia is not big enough for the air to feel compressibility effect For very large scale inertia is too big so the air compressibility plays minor role for the total impulse
The air compressibility seems to be the maximum when the length is meter scale where usual laboratory experiment is being conducted This result implies that air compressibility has to be considered more carefully for laboratory scale water impact experiments
5 Water Entry Problem51 Problem Definition
In order to strengthen the conclusion the effect of air com-pressibility we propose another yet more practical case which is a rigid body water entry problem The constant velocity water entry model in this study is presented as shown in Fig 18 In this model the tank size is L=1 m H=1 m and a rectangular rigid body with 01 m wide 01 m height The rectangular body is set to move downward from 01 m above the calm water free surface with constant speed of 14 ms which is the impact velocity in free-fall condition For impact pressure measurement a sensor point P0 is defined at the center on the bottom of the moving body As shown in figure 18 the boundary conditions are all set as no-slip wall con-ditions except for the tank top which is set as pressure outlet The pressure outlet boundary condition maintains a zero gauge pressure at the defined boundary which is desired for the tank top
Fig 18 General layout of the water entry problem and boundary conditions
52 Simulation Results521 Compressible Air
Fig 19 shows the pressure time history at the point P0 for the grid size 200x200 The time step convergence was studied
CFD 기반 유체충격 해석에서 공기 압축성 효과
590 대한조선학회논문집 제 48 권 제6 호 2011년 12월
with various time step sizes It was found that the larger time step case under-predicts the initial peak pressure As the time step refines the results converges especially if the step size is smaller than 02millisecond
Fig 19 Pressure time history at P0 compressible airIn term of structural response and damage prediction impulse
exerted to the structure during certain period of time is more important rather than a local pressure at a specific time moment(Faltinsen 1990 Shin et al 2010) In those sense we present the evolution of impulse during the water impact si-mulation Fig 20 shows that the impulse which is defined as the integral of the lift force with respect to time is converged when the grid size is refined
Fig 20 Impulse convergence study compressible airFurthermore the author like to emphasize that the oscillations
in the pressure as shown in Fig 19 is also observed in the experimental study by Shin et al(2010) in a similar manner which strengthens the validity of current simulation of water impact problem
522 Incompressible Air
Similar to the compressible air case we present time step refinement study for the grid size 200x200 The pressure time history is presented in Fig 21
Fig 21 Pressure time history at P0 incompressible airBy the comparison of compressible air simulation (Fig 19)
it is evident that air compressibility result in oscillations in the impact pressure history This oscillation is presumed to be due to the air-cushion effect that originated from the entrapped air pocket between the solid surface and water
Fig 22 Impulse convergence study incompressible airFig 22 shows the impulse convergence study of the in-
compressible air case Three grid sizes are employed 100times 100 200times200 400times400 The impulse time history of the incompressible air model shows monotonic increase of the impulse value whereas the compressible air model reveals oscillatory evolution of impulse on the body surface (Fig 20) This further strengthens our finding that the compressible air model correctly predicts the air-cushion effect at the impact moment
6 ConclusionAir compressibility effect in water impact problem is in-
vestigated by CFD simulations In order to investigate the air compressibility effect the air is modeled as compressible ideal gas as well as incompressible fluid For both cases the water is modeled as incompressible fluid By the comparison of impact load response compressible air model showed that oscillatory behavior in pressure and force histories acting on
찬후피 안형택
JSNAK Vol 48 No 6 December 2011 591
the solid surface Such oscillation decays as time goes due to the viscous dissipation On contrary incompressible air model showed no such oscillatory behavior in neither pressure nor force responses Incompressible air model showed only a single sharp peak in pressure and force response followed by the impact moment The current CFD simulation also resolved that the oscillation is due to the air pockets generated on the solid surface where the pressure oscillates Mesh refinement study showed that the impulse exerted during the impact process is convergent while further study is to be carried about the convergence of the peak pressure and forces Lastly the scale effect study showed that air compressibility represented by the impulse difference is biggest for the scale of meters which requests further investigation of air compressibility also in laboratory experiments
AcknowledgementThis work was supported by the 2009 Research Fund of
University of Ulsan
ReferencesFaltinsen OM 1990 Sea loads on ships and offshore
structures Cambridge University PressFluent 2008 Ver 63 User ManualGodderidge B Tunock S Earl C amp Tan M 2009 The
effect of fluid compressibility on the simulation of sloshing impacts Ocean Engineering 36 pp 578-587
Howison SD Ockendon JR amp Wilson SK 1991 Incompressible water-entry problems at small dead-rise angles Journal of Fluid Mechanics 222 pp 215ndash230
Kang CG amp Troesch A W 1990 Prediction of Hydrodynamic Impact Loads on Three-Dimensional Bodies Journal of the Society of Naval Architects of Korea 27(3) pp 73-88
Kleefsman KMT Fekken G Veldman AEP Buchner B amp Iwanowski B 2005 A Volume-of-Fluid based simulation method for wave impact problems Journal of Computational Physics 206 pp 363-393
Korobkin AA amp Iafrati A 2005 Hydrodynamic loads during initial stage of floating body impact Journal of Fluids and Structures 21 pp 413-427
Kwon SH Chung JY Kwak DW Lee SH amp Choi YM 2010 A Note on Slamming The 6th National Congress on Fluids Engineering Busan Republic of Korea 18-20 August 2010 pp 779-780
Lee BY Park JC Jung SJ Ryu MC amp Ki YS 2008 Numerical Simulation for Fluid Impact Load by Flat Plate with Incident Angles Journal of the Society of Naval Architects of Korea 45(1) pp 1-9
Nho I S Lee J M amp Yeom C W 2010 A Fundamental Study for Time History Modeling of Fluid Impact Pressure Journal of the Society of Naval Architects of Korea 47(2) pp 242-247
Scardovelli R amp Zaleski S 1999 Direct numerical simulation of free-surface and interfacial flow Annual Review of Fluid Mechanics 31 pp 567ndash603
Shin H Kim S-C amp Cho S-R 2010 Experimental Investigations on Slamming Impacts by Drop Tests Journal of the Society of Naval Architects of Korea 47(3) pp 410-420
Sun H amp Faltinsen OM 2006 Water impact of horizontal circular cylinders and cylindrical shells Applied Ocean Research 28 pp 299-311
Wu GX 1998 Hydrodynamic force on a rigid body during impact with liquid Journal of Fluids and Structures 12 pp 549ndash559
Wu G X Sun H amp He Y S 2004 Numerical simulation and experimental study of water entry of a wedge in free fall motion Journal of Fluid and Structures 19 pp 277ndash289
Yoon BS 1991 Lagrangian Finite Element Analysis of Water Impact Problem Journal of the Society of Naval Architects of Korea 28(1) pp 60-68
Yum DJ amp Yoon BS 2008 Numerical Simulation of Slamming Phenomena for 2-D Wedges Journal of the Society of Naval Architects of Korea 45(5) pp 477- 486
Zhang Y Zou Q amp Greaves D 2010 A level set immersed boundary method for water entry and exit Communication in Computational Physics 8 pp 265-288
Zhao R amp Faltinsen O 1993 Water Entry of Two- dimensional Bodies Journal of Fluid Mechanics 246 pp 593-612
찬 후 피 안 형 택

찬후피 안형택
JSNAK Vol 48 No 6 December 2011 585
Water is considered as viscous fluid with a constant density Flow is considered as laminar and no turbulence model is employed Since the major interest of current study is about water impact force which is an inertia-dominated force no effect of turbulence is encountered although further investigation about the effect of turbulence is strongly encouraged Air is considered in two different models constant density incom-pressible air and compressible air following ideal gas law as validated in the previous section The flow is modeled as laminar
As shown in Fig 7 the boundary conditions are all set as adiabatic no-slip wall conditions except for the tank top which is set as pressure outlet The pressure outlet boundary condition maintains a zero gauge pressure (same as the atmospheric pressure) at the defined boundary which is desired for the tank top The falling of the fresh water block initially at rest is initiated by the gravitational acceleration
The size of time step plays an important role in unsteady simulation of fluid flow We present time step refinement study for two different levels of meshes to check if the solution converges as the time step refines Three levels of successively refined time steps were used to examine its effects to the results
A proper time step which provides converged results is a function of grid size applied to the problem For the case A1 100times100 mesh considering ∆ sec and the approximate impact velocity the maximum value of Courant number over the domain can be approximated as ∆
∆ The initial time step for the time
step refinement study is determined based on the previous computation so that the maximum Courant number near the free surface does not violate the CFL stability condition The Courant number for this test was set to 025
Fig 7 General layout of the water drop test
42 Results421 Compressible Air
In order to see the effect of air compressibility the air is considered as compressible ideal gas The time histories of pressure and vertical force acting on the bottom surface are shown in Fig 8 and Fig 9 respectively Both of the figures show large scale oscillation in pressure as well as force history exerted on the entire bottom wall This indicates that the compressible air may attribute to energy absorbing and releasing mechanism obtained at the impact moment The linkage between the compressible air and pressure and force oscillation is further investigated in the following sections
Another observation from the figures is that the results indeed converge when the time step becomes smaller than
Fig 8 Compressible air pressure history measured at P0 (bottom center) with successively refined time steps Oscillation in pressure history is evident Grid-100 times100 is used
Fig 9 Compressible air vertical force exerted on the bottom wall with successively refined time steps Negative force indicated downward force Oscillation in force history is clearly resolved Grid-100times100 is used
CFD 기반 유체충격 해석에서 공기 압축성 효과
586 대한조선학회논문집 제 48 권 제6 호 2011년 12월
02millisecond for 100times100 grid This study also shows that larger time step under-predicts the pressures and the vertical forces
422 Incompressible Air
Now the air is model as incompressible fluid Similar to the compressible air case we present time step refinement study for A1 100times100 mesh The pressure history is presented in Fig 10 and the vertical force acting on the bottom surface is presented in Fig 11
Fig 10 Incompressible air pressure history measured P0 (bottom center) No oscillation is observed Grid- 100times100 is used
Fig 11 Incompressible air vertical force acting on the bottom wall No oscillation is observed Grid-100 times100 is used
By the comparison of compressible air case(Fig 8-9) and incompressible air case(Fig 10-11) two important observations can be drawn First it is evident that air compressibility result in oscillations in the pressure as well as force acting on the bottom wall Second the incompressible air case shows much higher and sharp peak history than the compressible air case
Based on this observation it can be presumed that the oscillation is due to the air-cushion effect that originated from the entrapped air pocket between the solid surface and water Such air pocket acts as a bumper to reduce the peak values in impact pressure and force as well as oscillation after the impact Further evidence of our conjecture will be presented in the following sections
423 Grid Refinement Study
It is well known that CFD results are sensitive to grid sizes Three levels of successively refined meshes were used to check the convergence and sensitivity of the results depending on the mesh resolution A1 100times100 (ie single cell size 10mm times10mm) A2 200times200 (ie single cell size 5mmtimes5mm) A3 400times400 (ie single cell size 25mmtimes25 mm)
As shown in Fig 12-13 the peak values of the pressure
(a)
(b)Fig 12 Mesh convergence study pressure history at bottom
center obtained by successively refined meshes (a) compressible air (b) incompressible air Com-pressible air cases show oscillation and lower peak values than incompressible air cases
찬후피 안형택
JSNAK Vol 48 No 6 December 2011 587
and force highly depend on the mesh resolution The results are extremely sensitive to the mesh resolution rather than the time step size
Based on the observation of Fig 12 and 13 there is no conclusive evidence of mesh convergence in peak pressure and force In fact the difference of peak value is rather be-comes larger as mesh refines which indicates typical divergence This is clearly not a favorable indication for the validity of the result Further investigation is necessary for the conclusive result about mesh refinement study
(a)
(b)Fig 13 Mesh convergence study vertical force history
obtained by successively refined meshes (a) compressible air model (b) incompressible air model Compressible air cases show oscillation and lower peak values than incompressible air cases
However in terms of the structural response and damage prediction impulse exerted to the structure during certain period of time is more critical than a local pressureforce at a specific time moment In that sense we present the evolution of impulse during the water impact simulation Fig 15 shows that the impulse defined as
which is the integration of the force with respect to the simulation time As shown in Fig 14 superior mesh converge is obtained for impulse history which is contrast to the pressure and force histories
(a)
(b)Fig 14 Impulse predicted by using various grid sizes (a)
compressible air model (b) incompressible air model Oscillation is observed in the impulse history for compressible air case while no such oscillation observed for incompressible air case
As shown in Fig 14 the compressible air model reveals oscillatory evolution of impulse on the solid surface whereas the incompressible air model shows monotonic increase of the impulse Regardless of the model both cases show convergence in impulse history as mesh refines
424 Air Pockets and Pressure Oscillation
For the compressible air model the fluid impact on the
CFD 기반 유체충격 해석에서 공기 압축성 효과
588 대한조선학회논문집 제 48 권 제6 호 2011년 12월
tank wall results in the formation of a wide air layer as shown in Fig 15 As the impact progresses the air layer becomes large air pockets entrapped by water and bottom wall (Fig 15a) then it collapses into many smaller air pockets (Fig 15b)
(a)
(b)Fig 15 Formation of air pocket on the bottom wall (a)
large air layer on the bottom (b) air layer broken into smaller air pockets
The pressure oscillation can be explained by the results presented in Fig 16 The water flow followed by the impact moment produces pressure oscillation in the bubble regions When the air pockets are compressed by surround fluid motion the air pressure exceeds the surrounding water pressure as shown in Fig 16a At this time the air pockets size reduces due to air compression Later the air pocket with higher pressure redirects the water flow away from the air bubble and this process results in a lower pressure in the air than in the surrounding fluid as shown in Fig 16b At this time the air pocket expands Throughout this process the air pocket acts as a spring that absorbs the kinetic energy from the
impact moment and results in oscillations in pressure and force history This oscillation eventually decays due to viscous diffusion of the governing equations
(a)
(b)Fig 16 Pressure oscillation in the air pocket (a) bubble
compression(positive pressure) t=0276s (b) bubble expansion(negative pressure) t=0282s
425 Scale Effect
In order to investigate the effect of the domain size to the results a series of simulation was carried out with various domain sizes 1mtimes1m 2mtimes2m 4mtimes4m 8mtimes8m 16mtimes16m In order to quantify the air compressibility effect on this water drop example we propose air compressibility indicator based on the normalized impulse difference between compressible and incompressible air simulations as follows
Here is the impulse obtained from the incompressible air simulation and is the impulse from the compressible air model defined as follows
찬후피 안형택
JSNAK Vol 48 No 6 December 2011 589
where and are the force history for compressible and incompressible air models respectively and is the integration interval defined as
(a)
(b)Fig 17 Impulse difference ratio between the compres-
sible and incompressible air simulations (a) linear scale (b) log scale
Fig 17 shows the trend of impulse ratio value with respects to domain size The impulse ratio which is an indicator of air compressibility effect has its maximum for the scale of meters and diminishes either for the smaller size (length scale <) or for the larger size (length scale <) In other words the effects of air compressibility play a more important role when the domain size is in the order of meters whereas less significant for the domain very small or very large
This result seems to follows our intuition For very small scale the fluid inertia is not big enough for the air to feel compressibility effect For very large scale inertia is too big so the air compressibility plays minor role for the total impulse
The air compressibility seems to be the maximum when the length is meter scale where usual laboratory experiment is being conducted This result implies that air compressibility has to be considered more carefully for laboratory scale water impact experiments
5 Water Entry Problem51 Problem Definition
In order to strengthen the conclusion the effect of air com-pressibility we propose another yet more practical case which is a rigid body water entry problem The constant velocity water entry model in this study is presented as shown in Fig 18 In this model the tank size is L=1 m H=1 m and a rectangular rigid body with 01 m wide 01 m height The rectangular body is set to move downward from 01 m above the calm water free surface with constant speed of 14 ms which is the impact velocity in free-fall condition For impact pressure measurement a sensor point P0 is defined at the center on the bottom of the moving body As shown in figure 18 the boundary conditions are all set as no-slip wall con-ditions except for the tank top which is set as pressure outlet The pressure outlet boundary condition maintains a zero gauge pressure at the defined boundary which is desired for the tank top
Fig 18 General layout of the water entry problem and boundary conditions
52 Simulation Results521 Compressible Air
Fig 19 shows the pressure time history at the point P0 for the grid size 200x200 The time step convergence was studied
CFD 기반 유체충격 해석에서 공기 압축성 효과
590 대한조선학회논문집 제 48 권 제6 호 2011년 12월
with various time step sizes It was found that the larger time step case under-predicts the initial peak pressure As the time step refines the results converges especially if the step size is smaller than 02millisecond
Fig 19 Pressure time history at P0 compressible airIn term of structural response and damage prediction impulse
exerted to the structure during certain period of time is more important rather than a local pressure at a specific time moment(Faltinsen 1990 Shin et al 2010) In those sense we present the evolution of impulse during the water impact si-mulation Fig 20 shows that the impulse which is defined as the integral of the lift force with respect to time is converged when the grid size is refined
Fig 20 Impulse convergence study compressible airFurthermore the author like to emphasize that the oscillations
in the pressure as shown in Fig 19 is also observed in the experimental study by Shin et al(2010) in a similar manner which strengthens the validity of current simulation of water impact problem
522 Incompressible Air
Similar to the compressible air case we present time step refinement study for the grid size 200x200 The pressure time history is presented in Fig 21
Fig 21 Pressure time history at P0 incompressible airBy the comparison of compressible air simulation (Fig 19)
it is evident that air compressibility result in oscillations in the impact pressure history This oscillation is presumed to be due to the air-cushion effect that originated from the entrapped air pocket between the solid surface and water
Fig 22 Impulse convergence study incompressible airFig 22 shows the impulse convergence study of the in-
compressible air case Three grid sizes are employed 100times 100 200times200 400times400 The impulse time history of the incompressible air model shows monotonic increase of the impulse value whereas the compressible air model reveals oscillatory evolution of impulse on the body surface (Fig 20) This further strengthens our finding that the compressible air model correctly predicts the air-cushion effect at the impact moment
6 ConclusionAir compressibility effect in water impact problem is in-
vestigated by CFD simulations In order to investigate the air compressibility effect the air is modeled as compressible ideal gas as well as incompressible fluid For both cases the water is modeled as incompressible fluid By the comparison of impact load response compressible air model showed that oscillatory behavior in pressure and force histories acting on
찬후피 안형택
JSNAK Vol 48 No 6 December 2011 591
the solid surface Such oscillation decays as time goes due to the viscous dissipation On contrary incompressible air model showed no such oscillatory behavior in neither pressure nor force responses Incompressible air model showed only a single sharp peak in pressure and force response followed by the impact moment The current CFD simulation also resolved that the oscillation is due to the air pockets generated on the solid surface where the pressure oscillates Mesh refinement study showed that the impulse exerted during the impact process is convergent while further study is to be carried about the convergence of the peak pressure and forces Lastly the scale effect study showed that air compressibility represented by the impulse difference is biggest for the scale of meters which requests further investigation of air compressibility also in laboratory experiments
AcknowledgementThis work was supported by the 2009 Research Fund of
University of Ulsan
ReferencesFaltinsen OM 1990 Sea loads on ships and offshore
structures Cambridge University PressFluent 2008 Ver 63 User ManualGodderidge B Tunock S Earl C amp Tan M 2009 The
effect of fluid compressibility on the simulation of sloshing impacts Ocean Engineering 36 pp 578-587
Howison SD Ockendon JR amp Wilson SK 1991 Incompressible water-entry problems at small dead-rise angles Journal of Fluid Mechanics 222 pp 215ndash230
Kang CG amp Troesch A W 1990 Prediction of Hydrodynamic Impact Loads on Three-Dimensional Bodies Journal of the Society of Naval Architects of Korea 27(3) pp 73-88
Kleefsman KMT Fekken G Veldman AEP Buchner B amp Iwanowski B 2005 A Volume-of-Fluid based simulation method for wave impact problems Journal of Computational Physics 206 pp 363-393
Korobkin AA amp Iafrati A 2005 Hydrodynamic loads during initial stage of floating body impact Journal of Fluids and Structures 21 pp 413-427
Kwon SH Chung JY Kwak DW Lee SH amp Choi YM 2010 A Note on Slamming The 6th National Congress on Fluids Engineering Busan Republic of Korea 18-20 August 2010 pp 779-780
Lee BY Park JC Jung SJ Ryu MC amp Ki YS 2008 Numerical Simulation for Fluid Impact Load by Flat Plate with Incident Angles Journal of the Society of Naval Architects of Korea 45(1) pp 1-9
Nho I S Lee J M amp Yeom C W 2010 A Fundamental Study for Time History Modeling of Fluid Impact Pressure Journal of the Society of Naval Architects of Korea 47(2) pp 242-247
Scardovelli R amp Zaleski S 1999 Direct numerical simulation of free-surface and interfacial flow Annual Review of Fluid Mechanics 31 pp 567ndash603
Shin H Kim S-C amp Cho S-R 2010 Experimental Investigations on Slamming Impacts by Drop Tests Journal of the Society of Naval Architects of Korea 47(3) pp 410-420
Sun H amp Faltinsen OM 2006 Water impact of horizontal circular cylinders and cylindrical shells Applied Ocean Research 28 pp 299-311
Wu GX 1998 Hydrodynamic force on a rigid body during impact with liquid Journal of Fluids and Structures 12 pp 549ndash559
Wu G X Sun H amp He Y S 2004 Numerical simulation and experimental study of water entry of a wedge in free fall motion Journal of Fluid and Structures 19 pp 277ndash289
Yoon BS 1991 Lagrangian Finite Element Analysis of Water Impact Problem Journal of the Society of Naval Architects of Korea 28(1) pp 60-68
Yum DJ amp Yoon BS 2008 Numerical Simulation of Slamming Phenomena for 2-D Wedges Journal of the Society of Naval Architects of Korea 45(5) pp 477- 486
Zhang Y Zou Q amp Greaves D 2010 A level set immersed boundary method for water entry and exit Communication in Computational Physics 8 pp 265-288
Zhao R amp Faltinsen O 1993 Water Entry of Two- dimensional Bodies Journal of Fluid Mechanics 246 pp 593-612
찬 후 피 안 형 택
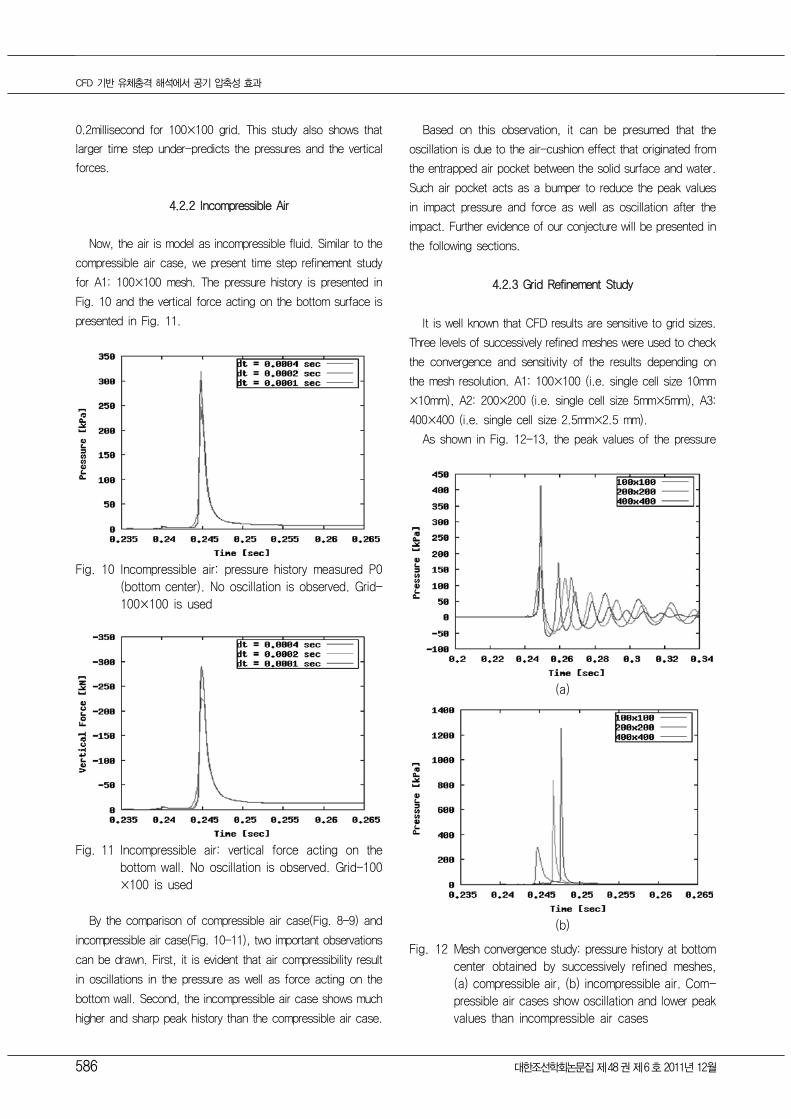
CFD 기반 유체충격 해석에서 공기 압축성 효과
586 대한조선학회논문집 제 48 권 제6 호 2011년 12월
02millisecond for 100times100 grid This study also shows that larger time step under-predicts the pressures and the vertical forces
422 Incompressible Air
Now the air is model as incompressible fluid Similar to the compressible air case we present time step refinement study for A1 100times100 mesh The pressure history is presented in Fig 10 and the vertical force acting on the bottom surface is presented in Fig 11
Fig 10 Incompressible air pressure history measured P0 (bottom center) No oscillation is observed Grid- 100times100 is used
Fig 11 Incompressible air vertical force acting on the bottom wall No oscillation is observed Grid-100 times100 is used
By the comparison of compressible air case(Fig 8-9) and incompressible air case(Fig 10-11) two important observations can be drawn First it is evident that air compressibility result in oscillations in the pressure as well as force acting on the bottom wall Second the incompressible air case shows much higher and sharp peak history than the compressible air case
Based on this observation it can be presumed that the oscillation is due to the air-cushion effect that originated from the entrapped air pocket between the solid surface and water Such air pocket acts as a bumper to reduce the peak values in impact pressure and force as well as oscillation after the impact Further evidence of our conjecture will be presented in the following sections
423 Grid Refinement Study
It is well known that CFD results are sensitive to grid sizes Three levels of successively refined meshes were used to check the convergence and sensitivity of the results depending on the mesh resolution A1 100times100 (ie single cell size 10mm times10mm) A2 200times200 (ie single cell size 5mmtimes5mm) A3 400times400 (ie single cell size 25mmtimes25 mm)
As shown in Fig 12-13 the peak values of the pressure
(a)
(b)Fig 12 Mesh convergence study pressure history at bottom
center obtained by successively refined meshes (a) compressible air (b) incompressible air Com-pressible air cases show oscillation and lower peak values than incompressible air cases
찬후피 안형택
JSNAK Vol 48 No 6 December 2011 587
and force highly depend on the mesh resolution The results are extremely sensitive to the mesh resolution rather than the time step size
Based on the observation of Fig 12 and 13 there is no conclusive evidence of mesh convergence in peak pressure and force In fact the difference of peak value is rather be-comes larger as mesh refines which indicates typical divergence This is clearly not a favorable indication for the validity of the result Further investigation is necessary for the conclusive result about mesh refinement study
(a)
(b)Fig 13 Mesh convergence study vertical force history
obtained by successively refined meshes (a) compressible air model (b) incompressible air model Compressible air cases show oscillation and lower peak values than incompressible air cases
However in terms of the structural response and damage prediction impulse exerted to the structure during certain period of time is more critical than a local pressureforce at a specific time moment In that sense we present the evolution of impulse during the water impact simulation Fig 15 shows that the impulse defined as
which is the integration of the force with respect to the simulation time As shown in Fig 14 superior mesh converge is obtained for impulse history which is contrast to the pressure and force histories
(a)
(b)Fig 14 Impulse predicted by using various grid sizes (a)
compressible air model (b) incompressible air model Oscillation is observed in the impulse history for compressible air case while no such oscillation observed for incompressible air case
As shown in Fig 14 the compressible air model reveals oscillatory evolution of impulse on the solid surface whereas the incompressible air model shows monotonic increase of the impulse Regardless of the model both cases show convergence in impulse history as mesh refines
424 Air Pockets and Pressure Oscillation
For the compressible air model the fluid impact on the
CFD 기반 유체충격 해석에서 공기 압축성 효과
588 대한조선학회논문집 제 48 권 제6 호 2011년 12월
tank wall results in the formation of a wide air layer as shown in Fig 15 As the impact progresses the air layer becomes large air pockets entrapped by water and bottom wall (Fig 15a) then it collapses into many smaller air pockets (Fig 15b)
(a)
(b)Fig 15 Formation of air pocket on the bottom wall (a)
large air layer on the bottom (b) air layer broken into smaller air pockets
The pressure oscillation can be explained by the results presented in Fig 16 The water flow followed by the impact moment produces pressure oscillation in the bubble regions When the air pockets are compressed by surround fluid motion the air pressure exceeds the surrounding water pressure as shown in Fig 16a At this time the air pockets size reduces due to air compression Later the air pocket with higher pressure redirects the water flow away from the air bubble and this process results in a lower pressure in the air than in the surrounding fluid as shown in Fig 16b At this time the air pocket expands Throughout this process the air pocket acts as a spring that absorbs the kinetic energy from the
impact moment and results in oscillations in pressure and force history This oscillation eventually decays due to viscous diffusion of the governing equations
(a)
(b)Fig 16 Pressure oscillation in the air pocket (a) bubble
compression(positive pressure) t=0276s (b) bubble expansion(negative pressure) t=0282s
425 Scale Effect
In order to investigate the effect of the domain size to the results a series of simulation was carried out with various domain sizes 1mtimes1m 2mtimes2m 4mtimes4m 8mtimes8m 16mtimes16m In order to quantify the air compressibility effect on this water drop example we propose air compressibility indicator based on the normalized impulse difference between compressible and incompressible air simulations as follows
Here is the impulse obtained from the incompressible air simulation and is the impulse from the compressible air model defined as follows
찬후피 안형택
JSNAK Vol 48 No 6 December 2011 589
where and are the force history for compressible and incompressible air models respectively and is the integration interval defined as
(a)
(b)Fig 17 Impulse difference ratio between the compres-
sible and incompressible air simulations (a) linear scale (b) log scale
Fig 17 shows the trend of impulse ratio value with respects to domain size The impulse ratio which is an indicator of air compressibility effect has its maximum for the scale of meters and diminishes either for the smaller size (length scale <) or for the larger size (length scale <) In other words the effects of air compressibility play a more important role when the domain size is in the order of meters whereas less significant for the domain very small or very large
This result seems to follows our intuition For very small scale the fluid inertia is not big enough for the air to feel compressibility effect For very large scale inertia is too big so the air compressibility plays minor role for the total impulse
The air compressibility seems to be the maximum when the length is meter scale where usual laboratory experiment is being conducted This result implies that air compressibility has to be considered more carefully for laboratory scale water impact experiments
5 Water Entry Problem51 Problem Definition
In order to strengthen the conclusion the effect of air com-pressibility we propose another yet more practical case which is a rigid body water entry problem The constant velocity water entry model in this study is presented as shown in Fig 18 In this model the tank size is L=1 m H=1 m and a rectangular rigid body with 01 m wide 01 m height The rectangular body is set to move downward from 01 m above the calm water free surface with constant speed of 14 ms which is the impact velocity in free-fall condition For impact pressure measurement a sensor point P0 is defined at the center on the bottom of the moving body As shown in figure 18 the boundary conditions are all set as no-slip wall con-ditions except for the tank top which is set as pressure outlet The pressure outlet boundary condition maintains a zero gauge pressure at the defined boundary which is desired for the tank top
Fig 18 General layout of the water entry problem and boundary conditions
52 Simulation Results521 Compressible Air
Fig 19 shows the pressure time history at the point P0 for the grid size 200x200 The time step convergence was studied
CFD 기반 유체충격 해석에서 공기 압축성 효과
590 대한조선학회논문집 제 48 권 제6 호 2011년 12월
with various time step sizes It was found that the larger time step case under-predicts the initial peak pressure As the time step refines the results converges especially if the step size is smaller than 02millisecond
Fig 19 Pressure time history at P0 compressible airIn term of structural response and damage prediction impulse
exerted to the structure during certain period of time is more important rather than a local pressure at a specific time moment(Faltinsen 1990 Shin et al 2010) In those sense we present the evolution of impulse during the water impact si-mulation Fig 20 shows that the impulse which is defined as the integral of the lift force with respect to time is converged when the grid size is refined
Fig 20 Impulse convergence study compressible airFurthermore the author like to emphasize that the oscillations
in the pressure as shown in Fig 19 is also observed in the experimental study by Shin et al(2010) in a similar manner which strengthens the validity of current simulation of water impact problem
522 Incompressible Air
Similar to the compressible air case we present time step refinement study for the grid size 200x200 The pressure time history is presented in Fig 21
Fig 21 Pressure time history at P0 incompressible airBy the comparison of compressible air simulation (Fig 19)
it is evident that air compressibility result in oscillations in the impact pressure history This oscillation is presumed to be due to the air-cushion effect that originated from the entrapped air pocket between the solid surface and water
Fig 22 Impulse convergence study incompressible airFig 22 shows the impulse convergence study of the in-
compressible air case Three grid sizes are employed 100times 100 200times200 400times400 The impulse time history of the incompressible air model shows monotonic increase of the impulse value whereas the compressible air model reveals oscillatory evolution of impulse on the body surface (Fig 20) This further strengthens our finding that the compressible air model correctly predicts the air-cushion effect at the impact moment
6 ConclusionAir compressibility effect in water impact problem is in-
vestigated by CFD simulations In order to investigate the air compressibility effect the air is modeled as compressible ideal gas as well as incompressible fluid For both cases the water is modeled as incompressible fluid By the comparison of impact load response compressible air model showed that oscillatory behavior in pressure and force histories acting on
찬후피 안형택
JSNAK Vol 48 No 6 December 2011 591
the solid surface Such oscillation decays as time goes due to the viscous dissipation On contrary incompressible air model showed no such oscillatory behavior in neither pressure nor force responses Incompressible air model showed only a single sharp peak in pressure and force response followed by the impact moment The current CFD simulation also resolved that the oscillation is due to the air pockets generated on the solid surface where the pressure oscillates Mesh refinement study showed that the impulse exerted during the impact process is convergent while further study is to be carried about the convergence of the peak pressure and forces Lastly the scale effect study showed that air compressibility represented by the impulse difference is biggest for the scale of meters which requests further investigation of air compressibility also in laboratory experiments
AcknowledgementThis work was supported by the 2009 Research Fund of
University of Ulsan
ReferencesFaltinsen OM 1990 Sea loads on ships and offshore
structures Cambridge University PressFluent 2008 Ver 63 User ManualGodderidge B Tunock S Earl C amp Tan M 2009 The
effect of fluid compressibility on the simulation of sloshing impacts Ocean Engineering 36 pp 578-587
Howison SD Ockendon JR amp Wilson SK 1991 Incompressible water-entry problems at small dead-rise angles Journal of Fluid Mechanics 222 pp 215ndash230
Kang CG amp Troesch A W 1990 Prediction of Hydrodynamic Impact Loads on Three-Dimensional Bodies Journal of the Society of Naval Architects of Korea 27(3) pp 73-88
Kleefsman KMT Fekken G Veldman AEP Buchner B amp Iwanowski B 2005 A Volume-of-Fluid based simulation method for wave impact problems Journal of Computational Physics 206 pp 363-393
Korobkin AA amp Iafrati A 2005 Hydrodynamic loads during initial stage of floating body impact Journal of Fluids and Structures 21 pp 413-427
Kwon SH Chung JY Kwak DW Lee SH amp Choi YM 2010 A Note on Slamming The 6th National Congress on Fluids Engineering Busan Republic of Korea 18-20 August 2010 pp 779-780
Lee BY Park JC Jung SJ Ryu MC amp Ki YS 2008 Numerical Simulation for Fluid Impact Load by Flat Plate with Incident Angles Journal of the Society of Naval Architects of Korea 45(1) pp 1-9
Nho I S Lee J M amp Yeom C W 2010 A Fundamental Study for Time History Modeling of Fluid Impact Pressure Journal of the Society of Naval Architects of Korea 47(2) pp 242-247
Scardovelli R amp Zaleski S 1999 Direct numerical simulation of free-surface and interfacial flow Annual Review of Fluid Mechanics 31 pp 567ndash603
Shin H Kim S-C amp Cho S-R 2010 Experimental Investigations on Slamming Impacts by Drop Tests Journal of the Society of Naval Architects of Korea 47(3) pp 410-420
Sun H amp Faltinsen OM 2006 Water impact of horizontal circular cylinders and cylindrical shells Applied Ocean Research 28 pp 299-311
Wu GX 1998 Hydrodynamic force on a rigid body during impact with liquid Journal of Fluids and Structures 12 pp 549ndash559
Wu G X Sun H amp He Y S 2004 Numerical simulation and experimental study of water entry of a wedge in free fall motion Journal of Fluid and Structures 19 pp 277ndash289
Yoon BS 1991 Lagrangian Finite Element Analysis of Water Impact Problem Journal of the Society of Naval Architects of Korea 28(1) pp 60-68
Yum DJ amp Yoon BS 2008 Numerical Simulation of Slamming Phenomena for 2-D Wedges Journal of the Society of Naval Architects of Korea 45(5) pp 477- 486
Zhang Y Zou Q amp Greaves D 2010 A level set immersed boundary method for water entry and exit Communication in Computational Physics 8 pp 265-288
Zhao R amp Faltinsen O 1993 Water Entry of Two- dimensional Bodies Journal of Fluid Mechanics 246 pp 593-612
찬 후 피 안 형 택
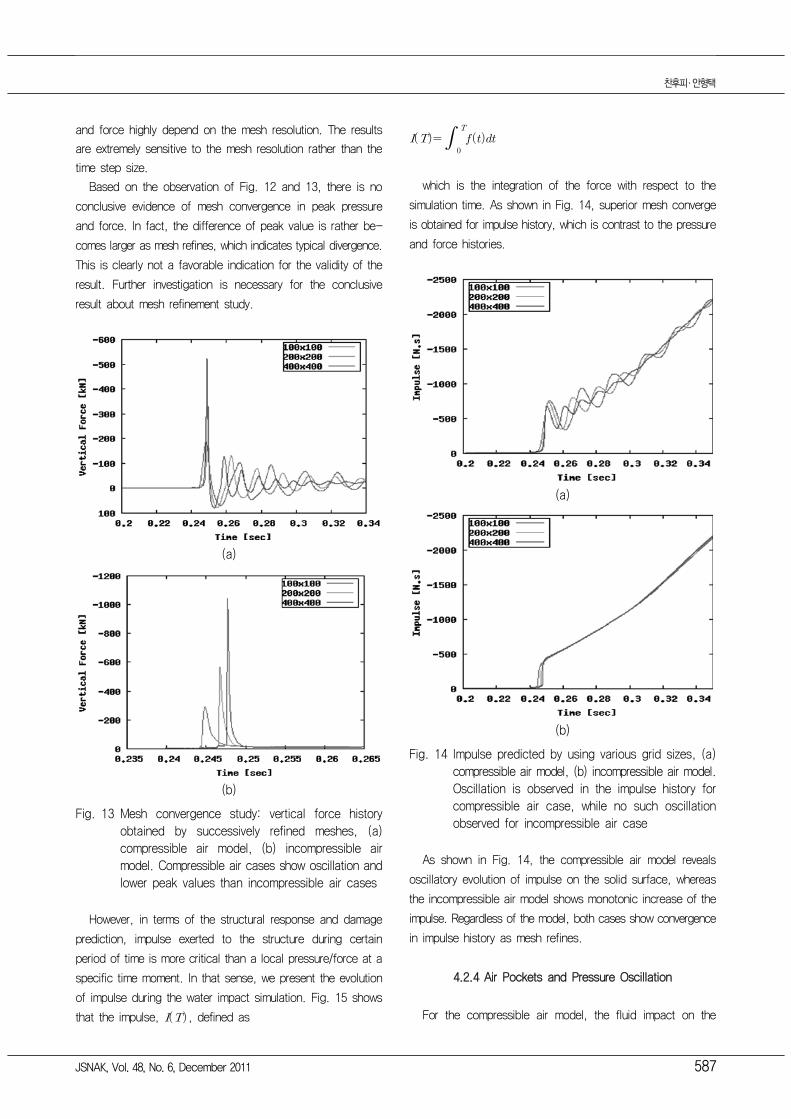
찬후피 안형택
JSNAK Vol 48 No 6 December 2011 587
and force highly depend on the mesh resolution The results are extremely sensitive to the mesh resolution rather than the time step size
Based on the observation of Fig 12 and 13 there is no conclusive evidence of mesh convergence in peak pressure and force In fact the difference of peak value is rather be-comes larger as mesh refines which indicates typical divergence This is clearly not a favorable indication for the validity of the result Further investigation is necessary for the conclusive result about mesh refinement study
(a)
(b)Fig 13 Mesh convergence study vertical force history
obtained by successively refined meshes (a) compressible air model (b) incompressible air model Compressible air cases show oscillation and lower peak values than incompressible air cases
However in terms of the structural response and damage prediction impulse exerted to the structure during certain period of time is more critical than a local pressureforce at a specific time moment In that sense we present the evolution of impulse during the water impact simulation Fig 15 shows that the impulse defined as
which is the integration of the force with respect to the simulation time As shown in Fig 14 superior mesh converge is obtained for impulse history which is contrast to the pressure and force histories
(a)
(b)Fig 14 Impulse predicted by using various grid sizes (a)
compressible air model (b) incompressible air model Oscillation is observed in the impulse history for compressible air case while no such oscillation observed for incompressible air case
As shown in Fig 14 the compressible air model reveals oscillatory evolution of impulse on the solid surface whereas the incompressible air model shows monotonic increase of the impulse Regardless of the model both cases show convergence in impulse history as mesh refines
424 Air Pockets and Pressure Oscillation
For the compressible air model the fluid impact on the
CFD 기반 유체충격 해석에서 공기 압축성 효과
588 대한조선학회논문집 제 48 권 제6 호 2011년 12월
tank wall results in the formation of a wide air layer as shown in Fig 15 As the impact progresses the air layer becomes large air pockets entrapped by water and bottom wall (Fig 15a) then it collapses into many smaller air pockets (Fig 15b)
(a)
(b)Fig 15 Formation of air pocket on the bottom wall (a)
large air layer on the bottom (b) air layer broken into smaller air pockets
The pressure oscillation can be explained by the results presented in Fig 16 The water flow followed by the impact moment produces pressure oscillation in the bubble regions When the air pockets are compressed by surround fluid motion the air pressure exceeds the surrounding water pressure as shown in Fig 16a At this time the air pockets size reduces due to air compression Later the air pocket with higher pressure redirects the water flow away from the air bubble and this process results in a lower pressure in the air than in the surrounding fluid as shown in Fig 16b At this time the air pocket expands Throughout this process the air pocket acts as a spring that absorbs the kinetic energy from the
impact moment and results in oscillations in pressure and force history This oscillation eventually decays due to viscous diffusion of the governing equations
(a)
(b)Fig 16 Pressure oscillation in the air pocket (a) bubble
compression(positive pressure) t=0276s (b) bubble expansion(negative pressure) t=0282s
425 Scale Effect
In order to investigate the effect of the domain size to the results a series of simulation was carried out with various domain sizes 1mtimes1m 2mtimes2m 4mtimes4m 8mtimes8m 16mtimes16m In order to quantify the air compressibility effect on this water drop example we propose air compressibility indicator based on the normalized impulse difference between compressible and incompressible air simulations as follows
Here is the impulse obtained from the incompressible air simulation and is the impulse from the compressible air model defined as follows
찬후피 안형택
JSNAK Vol 48 No 6 December 2011 589
where and are the force history for compressible and incompressible air models respectively and is the integration interval defined as
(a)
(b)Fig 17 Impulse difference ratio between the compres-
sible and incompressible air simulations (a) linear scale (b) log scale
Fig 17 shows the trend of impulse ratio value with respects to domain size The impulse ratio which is an indicator of air compressibility effect has its maximum for the scale of meters and diminishes either for the smaller size (length scale <) or for the larger size (length scale <) In other words the effects of air compressibility play a more important role when the domain size is in the order of meters whereas less significant for the domain very small or very large
This result seems to follows our intuition For very small scale the fluid inertia is not big enough for the air to feel compressibility effect For very large scale inertia is too big so the air compressibility plays minor role for the total impulse
The air compressibility seems to be the maximum when the length is meter scale where usual laboratory experiment is being conducted This result implies that air compressibility has to be considered more carefully for laboratory scale water impact experiments
5 Water Entry Problem51 Problem Definition
In order to strengthen the conclusion the effect of air com-pressibility we propose another yet more practical case which is a rigid body water entry problem The constant velocity water entry model in this study is presented as shown in Fig 18 In this model the tank size is L=1 m H=1 m and a rectangular rigid body with 01 m wide 01 m height The rectangular body is set to move downward from 01 m above the calm water free surface with constant speed of 14 ms which is the impact velocity in free-fall condition For impact pressure measurement a sensor point P0 is defined at the center on the bottom of the moving body As shown in figure 18 the boundary conditions are all set as no-slip wall con-ditions except for the tank top which is set as pressure outlet The pressure outlet boundary condition maintains a zero gauge pressure at the defined boundary which is desired for the tank top
Fig 18 General layout of the water entry problem and boundary conditions
52 Simulation Results521 Compressible Air
Fig 19 shows the pressure time history at the point P0 for the grid size 200x200 The time step convergence was studied
CFD 기반 유체충격 해석에서 공기 압축성 효과
590 대한조선학회논문집 제 48 권 제6 호 2011년 12월
with various time step sizes It was found that the larger time step case under-predicts the initial peak pressure As the time step refines the results converges especially if the step size is smaller than 02millisecond
Fig 19 Pressure time history at P0 compressible airIn term of structural response and damage prediction impulse
exerted to the structure during certain period of time is more important rather than a local pressure at a specific time moment(Faltinsen 1990 Shin et al 2010) In those sense we present the evolution of impulse during the water impact si-mulation Fig 20 shows that the impulse which is defined as the integral of the lift force with respect to time is converged when the grid size is refined
Fig 20 Impulse convergence study compressible airFurthermore the author like to emphasize that the oscillations
in the pressure as shown in Fig 19 is also observed in the experimental study by Shin et al(2010) in a similar manner which strengthens the validity of current simulation of water impact problem
522 Incompressible Air
Similar to the compressible air case we present time step refinement study for the grid size 200x200 The pressure time history is presented in Fig 21
Fig 21 Pressure time history at P0 incompressible airBy the comparison of compressible air simulation (Fig 19)
it is evident that air compressibility result in oscillations in the impact pressure history This oscillation is presumed to be due to the air-cushion effect that originated from the entrapped air pocket between the solid surface and water
Fig 22 Impulse convergence study incompressible airFig 22 shows the impulse convergence study of the in-
compressible air case Three grid sizes are employed 100times 100 200times200 400times400 The impulse time history of the incompressible air model shows monotonic increase of the impulse value whereas the compressible air model reveals oscillatory evolution of impulse on the body surface (Fig 20) This further strengthens our finding that the compressible air model correctly predicts the air-cushion effect at the impact moment
6 ConclusionAir compressibility effect in water impact problem is in-
vestigated by CFD simulations In order to investigate the air compressibility effect the air is modeled as compressible ideal gas as well as incompressible fluid For both cases the water is modeled as incompressible fluid By the comparison of impact load response compressible air model showed that oscillatory behavior in pressure and force histories acting on
찬후피 안형택
JSNAK Vol 48 No 6 December 2011 591
the solid surface Such oscillation decays as time goes due to the viscous dissipation On contrary incompressible air model showed no such oscillatory behavior in neither pressure nor force responses Incompressible air model showed only a single sharp peak in pressure and force response followed by the impact moment The current CFD simulation also resolved that the oscillation is due to the air pockets generated on the solid surface where the pressure oscillates Mesh refinement study showed that the impulse exerted during the impact process is convergent while further study is to be carried about the convergence of the peak pressure and forces Lastly the scale effect study showed that air compressibility represented by the impulse difference is biggest for the scale of meters which requests further investigation of air compressibility also in laboratory experiments
AcknowledgementThis work was supported by the 2009 Research Fund of
University of Ulsan
ReferencesFaltinsen OM 1990 Sea loads on ships and offshore
structures Cambridge University PressFluent 2008 Ver 63 User ManualGodderidge B Tunock S Earl C amp Tan M 2009 The
effect of fluid compressibility on the simulation of sloshing impacts Ocean Engineering 36 pp 578-587
Howison SD Ockendon JR amp Wilson SK 1991 Incompressible water-entry problems at small dead-rise angles Journal of Fluid Mechanics 222 pp 215ndash230
Kang CG amp Troesch A W 1990 Prediction of Hydrodynamic Impact Loads on Three-Dimensional Bodies Journal of the Society of Naval Architects of Korea 27(3) pp 73-88
Kleefsman KMT Fekken G Veldman AEP Buchner B amp Iwanowski B 2005 A Volume-of-Fluid based simulation method for wave impact problems Journal of Computational Physics 206 pp 363-393
Korobkin AA amp Iafrati A 2005 Hydrodynamic loads during initial stage of floating body impact Journal of Fluids and Structures 21 pp 413-427
Kwon SH Chung JY Kwak DW Lee SH amp Choi YM 2010 A Note on Slamming The 6th National Congress on Fluids Engineering Busan Republic of Korea 18-20 August 2010 pp 779-780
Lee BY Park JC Jung SJ Ryu MC amp Ki YS 2008 Numerical Simulation for Fluid Impact Load by Flat Plate with Incident Angles Journal of the Society of Naval Architects of Korea 45(1) pp 1-9
Nho I S Lee J M amp Yeom C W 2010 A Fundamental Study for Time History Modeling of Fluid Impact Pressure Journal of the Society of Naval Architects of Korea 47(2) pp 242-247
Scardovelli R amp Zaleski S 1999 Direct numerical simulation of free-surface and interfacial flow Annual Review of Fluid Mechanics 31 pp 567ndash603
Shin H Kim S-C amp Cho S-R 2010 Experimental Investigations on Slamming Impacts by Drop Tests Journal of the Society of Naval Architects of Korea 47(3) pp 410-420
Sun H amp Faltinsen OM 2006 Water impact of horizontal circular cylinders and cylindrical shells Applied Ocean Research 28 pp 299-311
Wu GX 1998 Hydrodynamic force on a rigid body during impact with liquid Journal of Fluids and Structures 12 pp 549ndash559
Wu G X Sun H amp He Y S 2004 Numerical simulation and experimental study of water entry of a wedge in free fall motion Journal of Fluid and Structures 19 pp 277ndash289
Yoon BS 1991 Lagrangian Finite Element Analysis of Water Impact Problem Journal of the Society of Naval Architects of Korea 28(1) pp 60-68
Yum DJ amp Yoon BS 2008 Numerical Simulation of Slamming Phenomena for 2-D Wedges Journal of the Society of Naval Architects of Korea 45(5) pp 477- 486
Zhang Y Zou Q amp Greaves D 2010 A level set immersed boundary method for water entry and exit Communication in Computational Physics 8 pp 265-288
Zhao R amp Faltinsen O 1993 Water Entry of Two- dimensional Bodies Journal of Fluid Mechanics 246 pp 593-612
찬 후 피 안 형 택
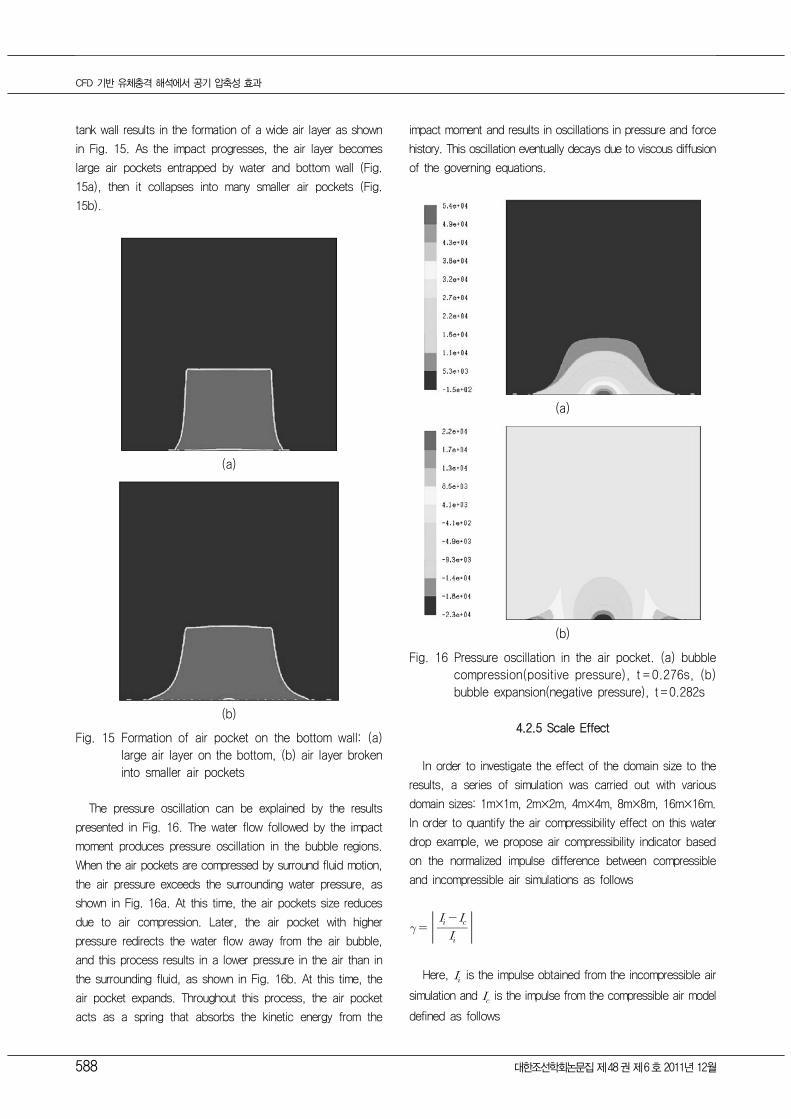
CFD 기반 유체충격 해석에서 공기 압축성 효과
588 대한조선학회논문집 제 48 권 제6 호 2011년 12월
tank wall results in the formation of a wide air layer as shown in Fig 15 As the impact progresses the air layer becomes large air pockets entrapped by water and bottom wall (Fig 15a) then it collapses into many smaller air pockets (Fig 15b)
(a)
(b)Fig 15 Formation of air pocket on the bottom wall (a)
large air layer on the bottom (b) air layer broken into smaller air pockets
The pressure oscillation can be explained by the results presented in Fig 16 The water flow followed by the impact moment produces pressure oscillation in the bubble regions When the air pockets are compressed by surround fluid motion the air pressure exceeds the surrounding water pressure as shown in Fig 16a At this time the air pockets size reduces due to air compression Later the air pocket with higher pressure redirects the water flow away from the air bubble and this process results in a lower pressure in the air than in the surrounding fluid as shown in Fig 16b At this time the air pocket expands Throughout this process the air pocket acts as a spring that absorbs the kinetic energy from the
impact moment and results in oscillations in pressure and force history This oscillation eventually decays due to viscous diffusion of the governing equations
(a)
(b)Fig 16 Pressure oscillation in the air pocket (a) bubble
compression(positive pressure) t=0276s (b) bubble expansion(negative pressure) t=0282s
425 Scale Effect
In order to investigate the effect of the domain size to the results a series of simulation was carried out with various domain sizes 1mtimes1m 2mtimes2m 4mtimes4m 8mtimes8m 16mtimes16m In order to quantify the air compressibility effect on this water drop example we propose air compressibility indicator based on the normalized impulse difference between compressible and incompressible air simulations as follows
Here is the impulse obtained from the incompressible air simulation and is the impulse from the compressible air model defined as follows
찬후피 안형택
JSNAK Vol 48 No 6 December 2011 589
where and are the force history for compressible and incompressible air models respectively and is the integration interval defined as
(a)
(b)Fig 17 Impulse difference ratio between the compres-
sible and incompressible air simulations (a) linear scale (b) log scale
Fig 17 shows the trend of impulse ratio value with respects to domain size The impulse ratio which is an indicator of air compressibility effect has its maximum for the scale of meters and diminishes either for the smaller size (length scale <) or for the larger size (length scale <) In other words the effects of air compressibility play a more important role when the domain size is in the order of meters whereas less significant for the domain very small or very large
This result seems to follows our intuition For very small scale the fluid inertia is not big enough for the air to feel compressibility effect For very large scale inertia is too big so the air compressibility plays minor role for the total impulse
The air compressibility seems to be the maximum when the length is meter scale where usual laboratory experiment is being conducted This result implies that air compressibility has to be considered more carefully for laboratory scale water impact experiments
5 Water Entry Problem51 Problem Definition
In order to strengthen the conclusion the effect of air com-pressibility we propose another yet more practical case which is a rigid body water entry problem The constant velocity water entry model in this study is presented as shown in Fig 18 In this model the tank size is L=1 m H=1 m and a rectangular rigid body with 01 m wide 01 m height The rectangular body is set to move downward from 01 m above the calm water free surface with constant speed of 14 ms which is the impact velocity in free-fall condition For impact pressure measurement a sensor point P0 is defined at the center on the bottom of the moving body As shown in figure 18 the boundary conditions are all set as no-slip wall con-ditions except for the tank top which is set as pressure outlet The pressure outlet boundary condition maintains a zero gauge pressure at the defined boundary which is desired for the tank top
Fig 18 General layout of the water entry problem and boundary conditions
52 Simulation Results521 Compressible Air
Fig 19 shows the pressure time history at the point P0 for the grid size 200x200 The time step convergence was studied
CFD 기반 유체충격 해석에서 공기 압축성 효과
590 대한조선학회논문집 제 48 권 제6 호 2011년 12월
with various time step sizes It was found that the larger time step case under-predicts the initial peak pressure As the time step refines the results converges especially if the step size is smaller than 02millisecond
Fig 19 Pressure time history at P0 compressible airIn term of structural response and damage prediction impulse
exerted to the structure during certain period of time is more important rather than a local pressure at a specific time moment(Faltinsen 1990 Shin et al 2010) In those sense we present the evolution of impulse during the water impact si-mulation Fig 20 shows that the impulse which is defined as the integral of the lift force with respect to time is converged when the grid size is refined
Fig 20 Impulse convergence study compressible airFurthermore the author like to emphasize that the oscillations
in the pressure as shown in Fig 19 is also observed in the experimental study by Shin et al(2010) in a similar manner which strengthens the validity of current simulation of water impact problem
522 Incompressible Air
Similar to the compressible air case we present time step refinement study for the grid size 200x200 The pressure time history is presented in Fig 21
Fig 21 Pressure time history at P0 incompressible airBy the comparison of compressible air simulation (Fig 19)
it is evident that air compressibility result in oscillations in the impact pressure history This oscillation is presumed to be due to the air-cushion effect that originated from the entrapped air pocket between the solid surface and water
Fig 22 Impulse convergence study incompressible airFig 22 shows the impulse convergence study of the in-
compressible air case Three grid sizes are employed 100times 100 200times200 400times400 The impulse time history of the incompressible air model shows monotonic increase of the impulse value whereas the compressible air model reveals oscillatory evolution of impulse on the body surface (Fig 20) This further strengthens our finding that the compressible air model correctly predicts the air-cushion effect at the impact moment
6 ConclusionAir compressibility effect in water impact problem is in-
vestigated by CFD simulations In order to investigate the air compressibility effect the air is modeled as compressible ideal gas as well as incompressible fluid For both cases the water is modeled as incompressible fluid By the comparison of impact load response compressible air model showed that oscillatory behavior in pressure and force histories acting on
찬후피 안형택
JSNAK Vol 48 No 6 December 2011 591
the solid surface Such oscillation decays as time goes due to the viscous dissipation On contrary incompressible air model showed no such oscillatory behavior in neither pressure nor force responses Incompressible air model showed only a single sharp peak in pressure and force response followed by the impact moment The current CFD simulation also resolved that the oscillation is due to the air pockets generated on the solid surface where the pressure oscillates Mesh refinement study showed that the impulse exerted during the impact process is convergent while further study is to be carried about the convergence of the peak pressure and forces Lastly the scale effect study showed that air compressibility represented by the impulse difference is biggest for the scale of meters which requests further investigation of air compressibility also in laboratory experiments
AcknowledgementThis work was supported by the 2009 Research Fund of
University of Ulsan
ReferencesFaltinsen OM 1990 Sea loads on ships and offshore
structures Cambridge University PressFluent 2008 Ver 63 User ManualGodderidge B Tunock S Earl C amp Tan M 2009 The
effect of fluid compressibility on the simulation of sloshing impacts Ocean Engineering 36 pp 578-587
Howison SD Ockendon JR amp Wilson SK 1991 Incompressible water-entry problems at small dead-rise angles Journal of Fluid Mechanics 222 pp 215ndash230
Kang CG amp Troesch A W 1990 Prediction of Hydrodynamic Impact Loads on Three-Dimensional Bodies Journal of the Society of Naval Architects of Korea 27(3) pp 73-88
Kleefsman KMT Fekken G Veldman AEP Buchner B amp Iwanowski B 2005 A Volume-of-Fluid based simulation method for wave impact problems Journal of Computational Physics 206 pp 363-393
Korobkin AA amp Iafrati A 2005 Hydrodynamic loads during initial stage of floating body impact Journal of Fluids and Structures 21 pp 413-427
Kwon SH Chung JY Kwak DW Lee SH amp Choi YM 2010 A Note on Slamming The 6th National Congress on Fluids Engineering Busan Republic of Korea 18-20 August 2010 pp 779-780
Lee BY Park JC Jung SJ Ryu MC amp Ki YS 2008 Numerical Simulation for Fluid Impact Load by Flat Plate with Incident Angles Journal of the Society of Naval Architects of Korea 45(1) pp 1-9
Nho I S Lee J M amp Yeom C W 2010 A Fundamental Study for Time History Modeling of Fluid Impact Pressure Journal of the Society of Naval Architects of Korea 47(2) pp 242-247
Scardovelli R amp Zaleski S 1999 Direct numerical simulation of free-surface and interfacial flow Annual Review of Fluid Mechanics 31 pp 567ndash603
Shin H Kim S-C amp Cho S-R 2010 Experimental Investigations on Slamming Impacts by Drop Tests Journal of the Society of Naval Architects of Korea 47(3) pp 410-420
Sun H amp Faltinsen OM 2006 Water impact of horizontal circular cylinders and cylindrical shells Applied Ocean Research 28 pp 299-311
Wu GX 1998 Hydrodynamic force on a rigid body during impact with liquid Journal of Fluids and Structures 12 pp 549ndash559
Wu G X Sun H amp He Y S 2004 Numerical simulation and experimental study of water entry of a wedge in free fall motion Journal of Fluid and Structures 19 pp 277ndash289
Yoon BS 1991 Lagrangian Finite Element Analysis of Water Impact Problem Journal of the Society of Naval Architects of Korea 28(1) pp 60-68
Yum DJ amp Yoon BS 2008 Numerical Simulation of Slamming Phenomena for 2-D Wedges Journal of the Society of Naval Architects of Korea 45(5) pp 477- 486
Zhang Y Zou Q amp Greaves D 2010 A level set immersed boundary method for water entry and exit Communication in Computational Physics 8 pp 265-288
Zhao R amp Faltinsen O 1993 Water Entry of Two- dimensional Bodies Journal of Fluid Mechanics 246 pp 593-612
찬 후 피 안 형 택
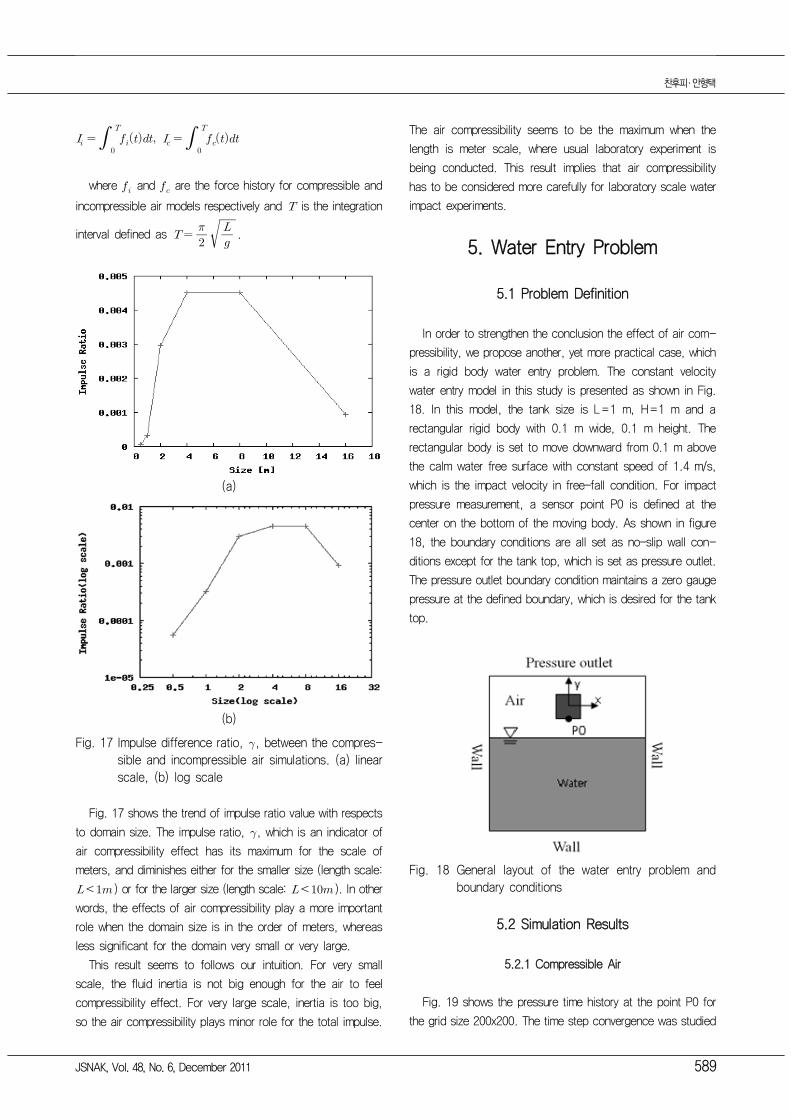
찬후피 안형택
JSNAK Vol 48 No 6 December 2011 589
where and are the force history for compressible and incompressible air models respectively and is the integration interval defined as
(a)
(b)Fig 17 Impulse difference ratio between the compres-
sible and incompressible air simulations (a) linear scale (b) log scale
Fig 17 shows the trend of impulse ratio value with respects to domain size The impulse ratio which is an indicator of air compressibility effect has its maximum for the scale of meters and diminishes either for the smaller size (length scale <) or for the larger size (length scale <) In other words the effects of air compressibility play a more important role when the domain size is in the order of meters whereas less significant for the domain very small or very large
This result seems to follows our intuition For very small scale the fluid inertia is not big enough for the air to feel compressibility effect For very large scale inertia is too big so the air compressibility plays minor role for the total impulse
The air compressibility seems to be the maximum when the length is meter scale where usual laboratory experiment is being conducted This result implies that air compressibility has to be considered more carefully for laboratory scale water impact experiments
5 Water Entry Problem51 Problem Definition
In order to strengthen the conclusion the effect of air com-pressibility we propose another yet more practical case which is a rigid body water entry problem The constant velocity water entry model in this study is presented as shown in Fig 18 In this model the tank size is L=1 m H=1 m and a rectangular rigid body with 01 m wide 01 m height The rectangular body is set to move downward from 01 m above the calm water free surface with constant speed of 14 ms which is the impact velocity in free-fall condition For impact pressure measurement a sensor point P0 is defined at the center on the bottom of the moving body As shown in figure 18 the boundary conditions are all set as no-slip wall con-ditions except for the tank top which is set as pressure outlet The pressure outlet boundary condition maintains a zero gauge pressure at the defined boundary which is desired for the tank top
Fig 18 General layout of the water entry problem and boundary conditions
52 Simulation Results521 Compressible Air
Fig 19 shows the pressure time history at the point P0 for the grid size 200x200 The time step convergence was studied
CFD 기반 유체충격 해석에서 공기 압축성 효과
590 대한조선학회논문집 제 48 권 제6 호 2011년 12월
with various time step sizes It was found that the larger time step case under-predicts the initial peak pressure As the time step refines the results converges especially if the step size is smaller than 02millisecond
Fig 19 Pressure time history at P0 compressible airIn term of structural response and damage prediction impulse
exerted to the structure during certain period of time is more important rather than a local pressure at a specific time moment(Faltinsen 1990 Shin et al 2010) In those sense we present the evolution of impulse during the water impact si-mulation Fig 20 shows that the impulse which is defined as the integral of the lift force with respect to time is converged when the grid size is refined
Fig 20 Impulse convergence study compressible airFurthermore the author like to emphasize that the oscillations
in the pressure as shown in Fig 19 is also observed in the experimental study by Shin et al(2010) in a similar manner which strengthens the validity of current simulation of water impact problem
522 Incompressible Air
Similar to the compressible air case we present time step refinement study for the grid size 200x200 The pressure time history is presented in Fig 21
Fig 21 Pressure time history at P0 incompressible airBy the comparison of compressible air simulation (Fig 19)
it is evident that air compressibility result in oscillations in the impact pressure history This oscillation is presumed to be due to the air-cushion effect that originated from the entrapped air pocket between the solid surface and water
Fig 22 Impulse convergence study incompressible airFig 22 shows the impulse convergence study of the in-
compressible air case Three grid sizes are employed 100times 100 200times200 400times400 The impulse time history of the incompressible air model shows monotonic increase of the impulse value whereas the compressible air model reveals oscillatory evolution of impulse on the body surface (Fig 20) This further strengthens our finding that the compressible air model correctly predicts the air-cushion effect at the impact moment
6 ConclusionAir compressibility effect in water impact problem is in-
vestigated by CFD simulations In order to investigate the air compressibility effect the air is modeled as compressible ideal gas as well as incompressible fluid For both cases the water is modeled as incompressible fluid By the comparison of impact load response compressible air model showed that oscillatory behavior in pressure and force histories acting on
찬후피 안형택
JSNAK Vol 48 No 6 December 2011 591
the solid surface Such oscillation decays as time goes due to the viscous dissipation On contrary incompressible air model showed no such oscillatory behavior in neither pressure nor force responses Incompressible air model showed only a single sharp peak in pressure and force response followed by the impact moment The current CFD simulation also resolved that the oscillation is due to the air pockets generated on the solid surface where the pressure oscillates Mesh refinement study showed that the impulse exerted during the impact process is convergent while further study is to be carried about the convergence of the peak pressure and forces Lastly the scale effect study showed that air compressibility represented by the impulse difference is biggest for the scale of meters which requests further investigation of air compressibility also in laboratory experiments
AcknowledgementThis work was supported by the 2009 Research Fund of
University of Ulsan
ReferencesFaltinsen OM 1990 Sea loads on ships and offshore
structures Cambridge University PressFluent 2008 Ver 63 User ManualGodderidge B Tunock S Earl C amp Tan M 2009 The
effect of fluid compressibility on the simulation of sloshing impacts Ocean Engineering 36 pp 578-587
Howison SD Ockendon JR amp Wilson SK 1991 Incompressible water-entry problems at small dead-rise angles Journal of Fluid Mechanics 222 pp 215ndash230
Kang CG amp Troesch A W 1990 Prediction of Hydrodynamic Impact Loads on Three-Dimensional Bodies Journal of the Society of Naval Architects of Korea 27(3) pp 73-88
Kleefsman KMT Fekken G Veldman AEP Buchner B amp Iwanowski B 2005 A Volume-of-Fluid based simulation method for wave impact problems Journal of Computational Physics 206 pp 363-393
Korobkin AA amp Iafrati A 2005 Hydrodynamic loads during initial stage of floating body impact Journal of Fluids and Structures 21 pp 413-427
Kwon SH Chung JY Kwak DW Lee SH amp Choi YM 2010 A Note on Slamming The 6th National Congress on Fluids Engineering Busan Republic of Korea 18-20 August 2010 pp 779-780
Lee BY Park JC Jung SJ Ryu MC amp Ki YS 2008 Numerical Simulation for Fluid Impact Load by Flat Plate with Incident Angles Journal of the Society of Naval Architects of Korea 45(1) pp 1-9
Nho I S Lee J M amp Yeom C W 2010 A Fundamental Study for Time History Modeling of Fluid Impact Pressure Journal of the Society of Naval Architects of Korea 47(2) pp 242-247
Scardovelli R amp Zaleski S 1999 Direct numerical simulation of free-surface and interfacial flow Annual Review of Fluid Mechanics 31 pp 567ndash603
Shin H Kim S-C amp Cho S-R 2010 Experimental Investigations on Slamming Impacts by Drop Tests Journal of the Society of Naval Architects of Korea 47(3) pp 410-420
Sun H amp Faltinsen OM 2006 Water impact of horizontal circular cylinders and cylindrical shells Applied Ocean Research 28 pp 299-311
Wu GX 1998 Hydrodynamic force on a rigid body during impact with liquid Journal of Fluids and Structures 12 pp 549ndash559
Wu G X Sun H amp He Y S 2004 Numerical simulation and experimental study of water entry of a wedge in free fall motion Journal of Fluid and Structures 19 pp 277ndash289
Yoon BS 1991 Lagrangian Finite Element Analysis of Water Impact Problem Journal of the Society of Naval Architects of Korea 28(1) pp 60-68
Yum DJ amp Yoon BS 2008 Numerical Simulation of Slamming Phenomena for 2-D Wedges Journal of the Society of Naval Architects of Korea 45(5) pp 477- 486
Zhang Y Zou Q amp Greaves D 2010 A level set immersed boundary method for water entry and exit Communication in Computational Physics 8 pp 265-288
Zhao R amp Faltinsen O 1993 Water Entry of Two- dimensional Bodies Journal of Fluid Mechanics 246 pp 593-612
찬 후 피 안 형 택
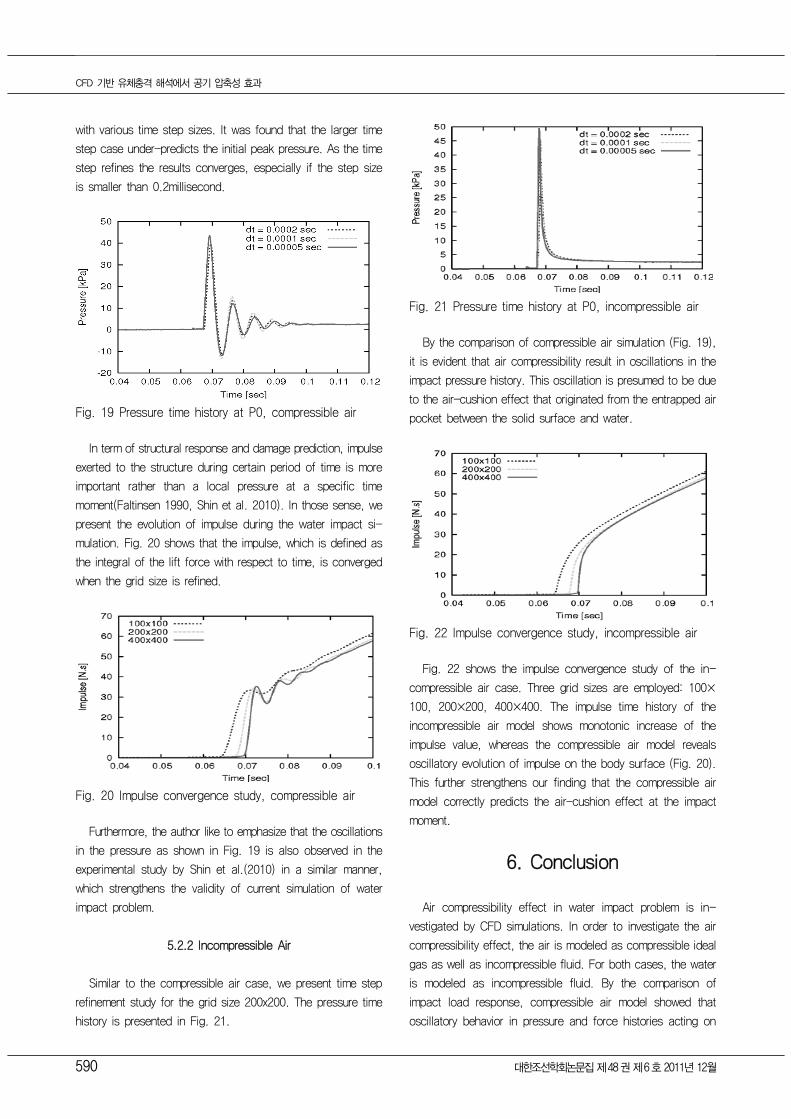