cfd assessment of railway tunnel train … assessment of railway tunnel train fire scenarios 4 / 16...
TRANSCRIPT

1 / 16
CFD ASSESSMENT OF RAILWAY TUNNEL TRAIN FIRE SCENARIOS
Yunlong Liu*, Xijuan Liu and Bradley Paroz
Fire Science and Technology Laboratory CSIRO Manufacturing and Infrastructure Technology
PO Box 310 North Ryde, NSW 1670, Australia Tel: +61 2 9490 5421, Fax: +61 2 9490 5777
*Email: [email protected]
ABSTRACT: Five fire scenarios have been simulated with the CFD model FDS to analyse the performance-based fire safety design of a 2935m-long railway tunnel. The influence of tunnel longitudinal ventilation fan activation time, fire size and the type of burning materials on tunnel tenability was investigated based on variations of two primary scenarios: Scenario #1 assumed a 15MW fire in the front end of a train, and Scenario #2 assumed a 15MW fire at the rear of a train. In both scenarios the burning material was assumed predominantly polyurethane, and tunnel fans were assumed to activate 901s after fire initiation. Scenario #3 was a variation of Scenario #1 with the dominant burning material changed to wood; Scenario #4 was a variation of Scenario #2 which assumed that fans activated 3 minutes after fire initiation; and Scenario #5 was a 6MW fire, which was scaled down from 15MW of Scenario #1. For all of the scenarios, a reversible bi-directional ventilation strategy was implemented, and the worst wind condition was considered. The burning materials (polyurethane and wood) were assumed to generate a soot rate of 10% and 1% per unit weight of fuel respectively. Maximum tenable time (known as Available Safe Egress Time, ASET, hereafter), was computed based on a visibility limit of 10m at a height of 2.1m. CFD virtual realisation results showed that the fire heat release rate, type of dominant burning material and the activation time of Smoke Management Systems (SMS) fans all influence tenability times within the tunnel. It is suggested that all these factors must be considered in the performance-based fire safety design and the management of a tunnel. KEYWORDS: Railway, Train Fire, Tunnel ventilation, CFD, Smoke management.
NOMENCLATURE CFD = Computational Fluid Dynamics FDS = Fire Dynamics Simulator HRR = Heat Release Rate (MW) NIST = National Institute of Standards and Technology L x W x H = Length x Width x Height SMS = Smoke Management System The station side = tunnel section between the fire involved train and the station The portal side = tunnel section between the fire involved train and the portal Portal = Station B
CFD Assessment Of Railway Tunnel Train Fire Scenarios
2 / 16 Yunlong Liu, Xijuan Liu & Bradley Paroz
1. INTRODUCTION
In recent years, the number of tunnel construction projects around the world has increased remarkably. Tunnels can greatly improve the efficiency of transportation where surface roads are congested. However, there are many issues for tunnel designers to consider, one of which is the level of fire safety, since accidental fires in a tunnel can have disastrous consequences in terms of loss of life and property [1]. Recent major tunnel fire incidents in Europe include fires in the Mont Blanc Tunnel, Tauern Range Tunnel, Gleinhalm Tunnel and Gotthard Tunnel. Inadequate ventilation was identified as one of the possible reasons [2] for a prolonged exposure of people to the backflow of hot and toxic smoke. Factors which can influence tunnel occupants’ life safety in the event of a tunnel fire include tunnel geometry, location of the train, ventilation rate, fire location, fire generated heat release rate and growth rate, burning material’s soot production rate, fan activation time, implementation and reliability of smoke detection and communication systems, wind conditions, fire suppression systems and its reliability, design of emergency exits, human behaviour, fire suppression systems, etc. Numerous research papers have been published recently on tunnel fire safety and related topics. Lonnermark and Ingason [3] recorded time dependent temperature data during large scale tunnel fire experiments. Tunnel fire safety under different ventilation systems, including longitudinal, semi-transverse, transverse, partial transverse and combined longitudinal and semi-transverse ventilation systems, has been investigated using Computational Fluid Dynamics (CFD) fire-smoke models [2, 4]. Modic has conducted fire simulations in road tunnels, and has also discussed evacuation strategies [5]. Apte et al [6] have measured burning rate, temperature field and smoke backflow in a series of pool fire tests in a ventilated tunnel. Liu and Apte et al [7] investigated road tunnel fire safety issues with the aid of CFD approach. C.C.Hwang and J.C.Edwards investigated the critical ventilation velocity in a tunnel fire using CFD modelling approach [8]. Kwang-Soo Jegal and Deog-Su Kim reviewed the design of the ventilation and risk control system of Young Dong railway tunnel by the CFD modelling and risk analysis [9]. However, publications on comprehensive CFD assessment of railway tunnel safety in the event of an accidental fire, using realistic, transient design fires are not found in the recent literature. This paper presents a virtual realisation methodology to assess fire safety in a railway tunnel in the event of a fire. Five fire scenarios have been investigated. The major difference between the railway tunnel ventilation and the road tunnel ventilation is that in the railway tunnel design the reversible bi-directional ventilation system [10] does not activate until an accidental fire is detected, whereas a road tunnel has a one-way ventilation system and a ventilation airflow speed is maintained under normal operating conditions. In this paper, smoke transport is computed using the Fire Dynamics Simulator (FDS) [11] developed by NIST. The dependence of maximum tenable time (known as Available Safe Egress Time, ASET) on fire ventilation management, dominant burning material (soot production rate) and train fire heat release rate (HRR) of an accidental fire has been discussed.

CFD Assessment Of Railway Tunnel Train Fire Scenarios
Yunlong Liu, Xijuan Liu & Bradley Paroz 3 / 16
2. PHYSICAL MODEL: TUNNEL AND THE TRAIN FIRE The railway tunnel in this study is 2935m long with a station located at one end and a portal at the other end. The tunnel is rectangular in cross section and is 4.4m wide and 5.6m high. The tunnel has an uphill slope gradient of 3% from the station to the portal. There is an emergency exit at 900m from the station, which is assumed open for egress, except that in Scenario #5 it remains closed to analyse its influence on the tunnel’s tenability. The station and the portal are included in the computational domain. The station comprises of a platform and the tunnel section in the station, its tunnel opens to the platform. As shown in Figures 2 and 3, the tunnel Smoke Management System (SMS) is a reversible two-way ventilation system in a railway tunnel to manage different fire scenarios. This system includes Fans A and B at the station and tunnel Fans C and D. Fans A and B with an airflow displacement capacity of 100m3/s and 200m3/s respectively, are installed at the two ends the station, which will operate in either the supply mode or the exhaust mode to blow air into or suck the gas out of the tunnel depending on the fire scenarios. They remain inactive during normal operation conditions. Fans A and B, having a capacity of 50m3/s each, are installed in the tunnel to aid with the smoke displacement. Fan A, located 200m from the station, blows air from the station towards the portal, and Fan B, located 700m from the portal, blows air from the portal towards the Station. They remain inactive during normal operation conditions. The activation status of Fans A, B, C and D are managed by the tunnel emergency management team to drive the smoke in the desired direction without any significant backlayering. Details will be discussed in the following section. It is assumed that two trains operate at the same time in the tunnel. Both trains have a size of 140m long, 3m wide and 4m high. Train A, where no fire is involved, is stopped at a location 500m from the station, because Train B is involved in an accidental fire. The front end of Train B is located at 1105m away from the portal. It is assumed that both trains stop moving upon fire initiation. Tunnel geometrical and operating parameters are summarized in Table-1.
Table-1: Tunnel fire CFD modelling input parameters
Parameter name Description Comments Tunnel Size 2935m x 4.4m x 5.6m (L x
W X H)
Slope Gradient 3% Airflow capacity of SMS (Fan C and D)1
300 m3/s
Location of SMS fans C and D In the station SMS fans activation time1 901s from fire initiation Airflow capacity of Fan A 50 m3/s Scenario #1
#3, #5 only Airflow capacity of Fan B 50 m3/s Scenario #2,
#4 only Fan A Activation Time 901s from fire initiation Scenario #1,
#3, #5 only
CFD Assessment Of Railway Tunnel Train Fire Scenarios
4 / 16 Yunlong Liu, Xijuan Liu & Bradley Paroz
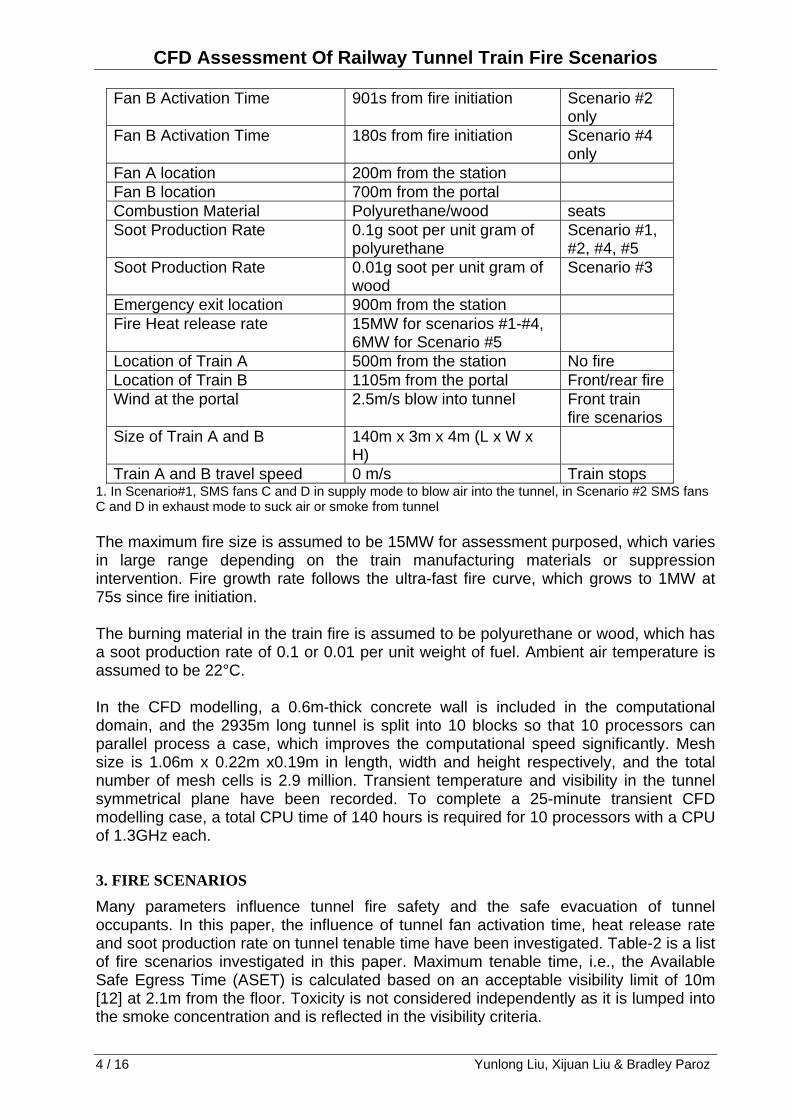
Fan B Activation Time 901s from fire initiation Scenario #2 only
Fan B Activation Time 180s from fire initiation Scenario #4 only
Fan A location 200m from the station Fan B location 700m from the portal Combustion Material Polyurethane/wood seats Soot Production Rate 0.1g soot per unit gram of
polyurethane Scenario #1, #2, #4, #5
Soot Production Rate 0.01g soot per unit gram of wood
Scenario #3
Emergency exit location 900m from the station Fire Heat release rate 15MW for scenarios #1-#4,
6MW for Scenario #5
Location of Train A 500m from the station No fire Location of Train B 1105m from the portal Front/rear fire Wind at the portal 2.5m/s blow into tunnel Front train
fire scenarios Size of Train A and B 140m x 3m x 4m (L x W x
H)
Train A and B travel speed 0 m/s Train stops 1. In Scenario#1, SMS fans C and D in supply mode to blow air into the tunnel, in Scenario #2 SMS fans C and D in exhaust mode to suck air or smoke from tunnel The maximum fire size is assumed to be 15MW for assessment purposed, which varies in large range depending on the train manufacturing materials or suppression intervention. Fire growth rate follows the ultra-fast fire curve, which grows to 1MW at 75s since fire initiation. The burning material in the train fire is assumed to be polyurethane or wood, which has a soot production rate of 0.1 or 0.01 per unit weight of fuel. Ambient air temperature is assumed to be 22°C. In the CFD modelling, a 0.6m-thick concrete wall is included in the computational domain, and the 2935m long tunnel is split into 10 blocks so that 10 processors can parallel process a case, which improves the computational speed significantly. Mesh size is 1.06m x 0.22m x0.19m in length, width and height respectively, and the total number of mesh cells is 2.9 million. Transient temperature and visibility in the tunnel symmetrical plane have been recorded. To complete a 25-minute transient CFD modelling case, a total CPU time of 140 hours is required for 10 processors with a CPU of 1.3GHz each.
3. FIRE SCENARIOS
Many parameters influence tunnel fire safety and the safe evacuation of tunnel occupants. In this paper, the influence of tunnel fan activation time, heat release rate and soot production rate on tunnel tenable time have been investigated. Table-2 is a list of fire scenarios investigated in this paper. Maximum tenable time, i.e., the Available Safe Egress Time (ASET) is calculated based on an acceptable visibility limit of 10m [12] at 2.1m from the floor. Toxicity is not considered independently as it is lumped into the smoke concentration and is reflected in the visibility criteria.

CFD Assessment Of Railway Tunnel Train Fire Scenarios
Yunlong Liu, Xijuan Liu & Bradley Paroz 5 / 16
Table-2: Summary of Scenarios #1 - #5
Scenario #
Fire location
HRR(MW) Burning Material and soot
production
SMS fans
activation time (s)
Status of Emergency
door
1 Front train fire
15 Polyurethane soot
production=0.1%
901 open
2 Rear train fire
15 Polyurethane soot
production=0.1%
901 open
3 Front train fire
15 wood soot production
0.01%
901 open
4 Rear train fire
15 Polyurethane soot
production=0.1%
180 open
5 Front train fire
6 Polyurethane soot
production=0.1%
901 closed
3.1 Scenario #1: A 15MW train frontal fire, 2.5m/s wind blow into the portal Fire origin located at the front end of Train B, which is on the high end of the train. Passenger carriages are lower than the fire location, as shown in Figure 1.
Figure 1: Train frontal fire scenarios (not to scale) When a front train fire occurs, ventilation fans will activate at 901s after fire initiation. Fan A blows from the station towards the portal, and Fans C and D at the station will be in the supply mode to blow fresh air into the tunnel. The purpose is to maintain a tenable condition for Train A and Train B’s passenger carriage and the evacuation route. The evacuation route is the tunnel section between the fire origin and the station. Wind blows at 2.5m/s into the portal, which pushes the fire-generated hot smoke towards the train carriage into the station direction. This is the worst scenario in terms
200m 914m
440m 276m
Station
Fan C and D
Wind Train B front Fire
1105m
Train A Emergency exit
Fan A
Portal Train driving direction

CFD Assessment Of Railway Tunnel Train Fire Scenarios
6 / 16 Yunlong Liu, Xijuan Liu & Bradley Paroz
of wind condition, as smoke should ideally be managed to flow away from the passenger train carriage to give a longer tenable time for occupants to evacuate. 3.2 Scenario #2: A 15MW train rear fire, buoyancy driven ventilation under windless condition Fire origin located at the rear of Train B, which is on the low end of the train. Passenger carriages are higher than the fire location, as shown in Figure 2.
Figure 2: Train rear fire scenarios (not to scale)
When a fire occurs at the rear end of Train B, ventilation fans will activate at 901s after fire initiation. Fan B blows from the portal towards the station, and Fans C and D at the station will be in the exhaust mode to remove the gas from the tunnel. The evacuation route is the tunnel section between the fire origin and the portal. Considering the worst wind condition, it is assumed that there is no wind at the portal, and the portal is fully open to allow free airflow. The fire generated hot gas and smoke is driven by buoyancy and flows uphill towards the train carriage in the portal direction, until all the fans are activated at 901s after fire initiation. 3.3 Scenario #3: A variation of Scenario #1, with a soot production rate of 0.01g/g as burning material assumed as “wood” All other parameters are the same as in Scenario #1, with the exception that wood is assumed as burning material, generating 0.01g soot per unit gram of fuel. This represents a scenario where the burning material from the fire-involved train is dominated by wood. The purpose of this scenario is to analyse the train seat material’s influence on visibility and tunnel tenability. 3.4 Scenario #4: A variation of Scenario #2, with fans activated at 180s Scenario #4 is based on Scenario #2. SMS Fans are assumed to activate at 180s since fire initiation. This scenario represents a case where the tunnel management team receives the fire accident signal one minute after the fire is initiated, and allows for a further one minute for the tunnel management team to make a correct decision based on the fire scenario, i.e., fire in the train front, or near the rear, to activate Fans A, C and D or Fans B, C and D. An additional one minute is required for the fans to activate.
640m 276m
700m 914m
Fan C and D Fan B Train B
Rear Fire
405m
Train A
Emergency exit
Portal Station
Train driving direction
CFD Assessment Of Railway Tunnel Train Fire Scenarios
Yunlong Liu, Xijuan Liu & Bradley Paroz 7 / 16
Based on the above assumptions, fans can be activated within 3 minutes of fire initiation, if the smoke detection and communication systems are implemented and function reliably. 3.5 Scenario #5: A variation of Scenario #1, with fire size reduced to 6MW Scenario #5 is based on Scenario #1. All other parameters are the same as in Scenario #1, except that the fire heat release rate is 6MW. This scenario represents a case where the train fire is partially controlled, or the materials in the train have a lower fire load.
4. RESULTS AND DISCUSSIONS
In this investigation, the following issues are considered when analysing the CFD results:
1. Available Safe Evacuation Time (ASET) of the passenger train and the tunnel. 2. Maximum untenable distance and direction before SMS fans activated at 901s
for Scenarios #1, #2, #3 and #5. 3. Whether or not 2 m/s longitudinal air velocity can be maintained at the desired
direction once Tunnel Smoke Management System (SMS) are activated. 4. For the scenarios where smoke is extracted from the station, whether any smoke
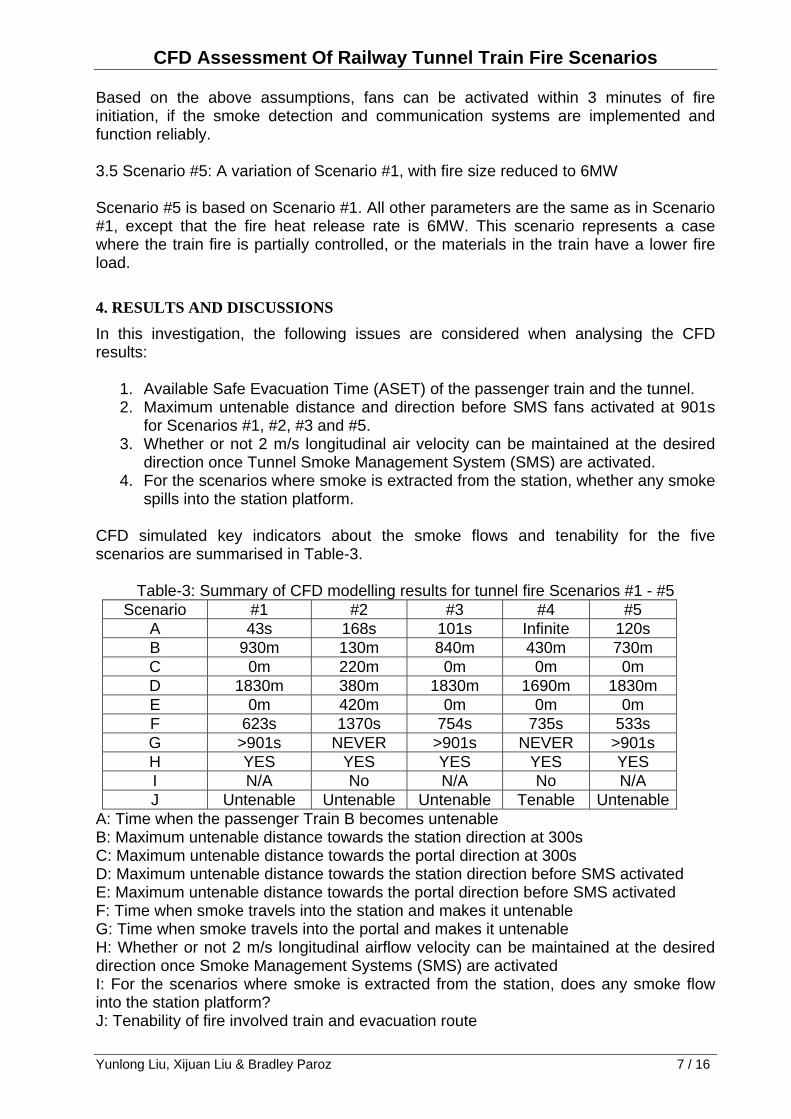
spills into the station platform. CFD simulated key indicators about the smoke flows and tenability for the five scenarios are summarised in Table-3.
Table-3: Summary of CFD modelling results for tunnel fire Scenarios #1 - #5 Scenario #1 #2 #3 #4 #5
A 43s 168s 101s Infinite 120s B 930m 130m 840m 430m 730m C 0m 220m 0m 0m 0m D 1830m 380m 1830m 1690m 1830m E 0m 420m 0m 0m 0m F 623s 1370s 754s 735s 533s G >901s NEVER >901s NEVER >901s H YES YES YES YES YES I N/A No N/A No N/A J Untenable Untenable Untenable Tenable Untenable
A: Time when the passenger Train B becomes untenable B: Maximum untenable distance towards the station direction at 300s C: Maximum untenable distance towards the portal direction at 300s D: Maximum untenable distance towards the station direction before SMS activated E: Maximum untenable distance towards the portal direction before SMS activated F: Time when smoke travels into the station and makes it untenable G: Time when smoke travels into the portal and makes it untenable H: Whether or not 2 m/s longitudinal airflow velocity can be maintained at the desired direction once Smoke Management Systems (SMS) are activated I: For the scenarios where smoke is extracted from the station, does any smoke flow into the station platform? J: Tenability of fire involved train and evacuation route
CFD Assessment Of Railway Tunnel Train Fire Scenarios
8 / 16 Yunlong Liu, Xijuan Liu & Bradley Paroz
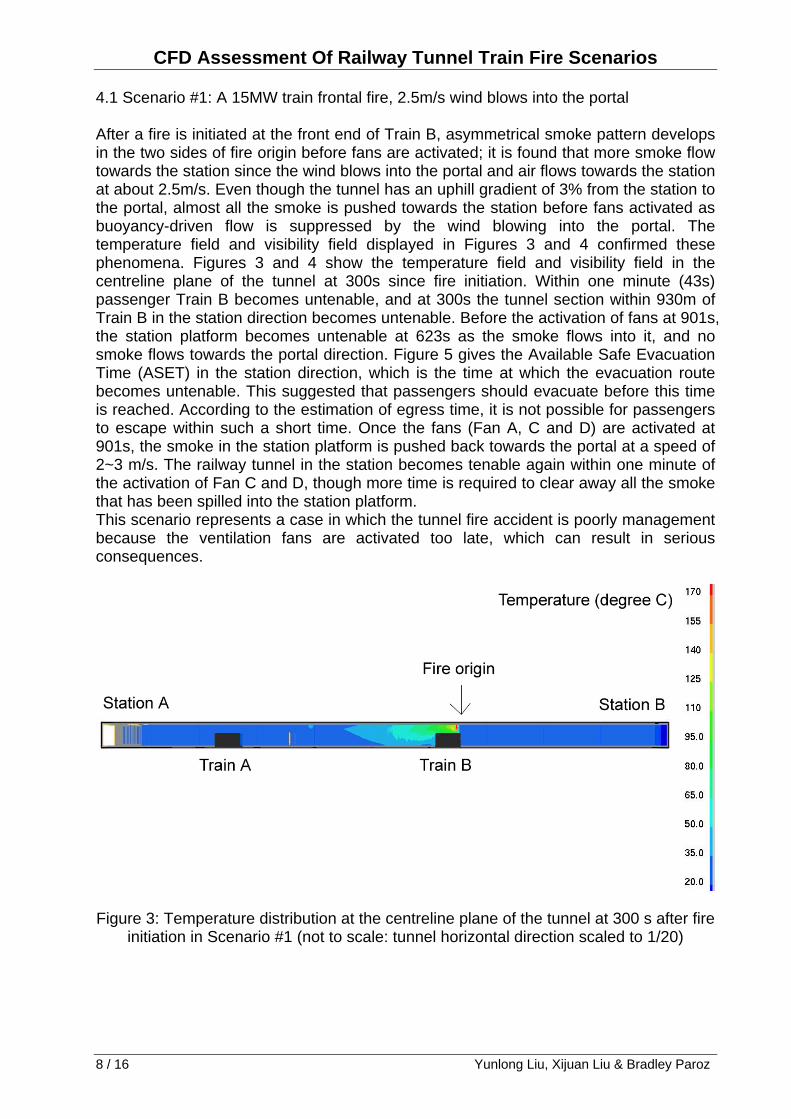
4.1 Scenario #1: A 15MW train frontal fire, 2.5m/s wind blows into the portal After a fire is initiated at the front end of Train B, asymmetrical smoke pattern develops in the two sides of fire origin before fans are activated; it is found that more smoke flow towards the station since the wind blows into the portal and air flows towards the station at about 2.5m/s. Even though the tunnel has an uphill gradient of 3% from the station to the portal, almost all the smoke is pushed towards the station before fans activated as buoyancy-driven flow is suppressed by the wind blowing into the portal. The temperature field and visibility field displayed in Figures 3 and 4 confirmed these phenomena. Figures 3 and 4 show the temperature field and visibility field in the centreline plane of the tunnel at 300s since fire initiation. Within one minute (43s) passenger Train B becomes untenable, and at 300s the tunnel section within 930m of Train B in the station direction becomes untenable. Before the activation of fans at 901s, the station platform becomes untenable at 623s as the smoke flows into it, and no smoke flows towards the portal direction. Figure 5 gives the Available Safe Evacuation Time (ASET) in the station direction, which is the time at which the evacuation route becomes untenable. This suggested that passengers should evacuate before this time is reached. According to the estimation of egress time, it is not possible for passengers to escape within such a short time. Once the fans (Fan A, C and D) are activated at 901s, the smoke in the station platform is pushed back towards the portal at a speed of 2~3 m/s. The railway tunnel in the station becomes tenable again within one minute of the activation of Fan C and D, though more time is required to clear away all the smoke that has been spilled into the station platform. This scenario represents a case in which the tunnel fire accident is poorly management because the ventilation fans are activated too late, which can result in serious consequences.
Figure 3: Temperature distribution at the centreline plane of the tunnel at 300 s after fire initiation in Scenario #1 (not to scale: tunnel horizontal direction scaled to 1/20)

CFD Assessment Of Railway Tunnel Train Fire Scenarios
Yunlong Liu, Xijuan Liu & Bradley Paroz 9 / 16
Figure 4: Visibility distribution at the centreline plane of the tunnel at 300 s after fire initiation in Scenario #1 (not to scale: tunnel horizontal direction scaled to 1/20)
Scenario#1,#3,#5:Tenable Time Station side
0100200300400500600700800900
0 500 1000 1500 2000Distance from Train B
ASE
T (s
)
Scenario #1
Scenario #3
Scenario #5
Figure 5: Time at which the tunnel on the station side becomes untenable
4.2 Scenario #2: A 15MW train rear fire, buoyancy-driven smoke transport

CFD Assessment Of Railway Tunnel Train Fire Scenarios
10 / 16 Yunlong Liu, Xijuan Liu & Bradley Paroz
After a fire is initiated at the rear end of Train B, smoke pattern develops in both directions before fans are activated at 901s; however, it is found that more smoke flows in the portal direction since there is an uphill slope gradient towards the portal and buoyancy-driven flow dominates since no wind blows at the portal. The passenger train carriage becomes untenable at 168s. At 300s, the tunnel section within 130m of Train B in the station direction, and 220m from the rear end of Train B in the portal direction becomes untenable. The temperature distribution and the visibility at the centreline plane of the tunnel at 300 s after fire ignition are shown in Figure 6 and Figure 7. The times when the evacuation routes on the station side and the portal side of Train B become untenable are given in Figure 8 and Figure 9. Before the activation of fans at 901s, the tunnel section within 380m from the rear of Train B in the station direction becomes untenable, and the tunnel section within 420m from the rear end of Train B in the portal direction becomes untenable. Once Fans B, C and D are activated, smoke travels at a speed of ~3 m/s in the station direction, with higher speeds found in the region with train blockages. Smoke flows into the station and the station becomes untenable at 1370s since fire initiation, which is 469s after fans are activated. On the portal side, tunnel section between Train B and the portal regained tenable condition at 1128s, this is 227s after the activation of the ventilation fans B, C and D. This scenario shows that a late response to the fire accident will result in serious consequences, even though the designed airflow capacity of tunnel fans is enough to handle the situation, a quicker decision on the SMS is necessary to minimise the losses from a train fire accident.
Figure 6: Temperature distribution at the centreline plane of the tunnel at 300 s after fire
initiation in Scenario #2 (not to scale: tunnel horizontal direction scaled to 1/20)

CFD Assessment Of Railway Tunnel Train Fire Scenarios
Yunlong Liu, Xijuan Liu & Bradley Paroz 11 / 16
Figure 7: Visibility distribution at the centreline plane of the tunnel at 300 s after fire ignition in Scenario #2 (not to scale: tunnel direction scaled to 1/20)
Scenario#2,#4: Tenable Time Station Side
0
200
400
600
800
1000
1200
1400
1600
0 500 1000 1500
Distance from Train B (m)
ASE
T (s
)
Scenario #2
Scenario #4
Figure 8: Time when the tunnel on the station side becomes untenable

CFD Assessment Of Railway Tunnel Train Fire Scenarios
12 / 16 Yunlong Liu, Xijuan Liu & Bradley Paroz
Scenario #2,#4: Tenable Time in Portal side
0100200300400500600700800
0 500 1000 1500
Distance from Train B (m)
ASE
T (s
)
Scenario #2
Scenario #4
(Note: Curve for Scenario #4 is not shown because ASET is infinite)
Figure 9: Time when the tunnel on the portal side becomes untenable
4.3 Scenario #3: A 15MW train frontal fire, 2.5m/s wind blows into the portal, burning material assumed as “wood”. The smoke development pattern is similar to that in Scenario #1, where only the station side of the tunnel is influenced by the fire. However, tenable time along the evacuation route is about 60~120s longer than that in Scenario #1, and the tenable time for the occupants in the train is 101s, as shown in Figure 6. This prolonged tenable time is a result of the soot production rate of wood, which is much lower than that of the polyurethane (0.01g soot production per unit gram of wood compared to 0.1g soot production per unit gram of polyurethane). The fire generated temperature and visibility distribution in the central plane is similar to that in Scenario #1, except that in Scenario#3 the smoke density is lower and the tenable time is longer. At 300s, the tunnel section within 840m of the rear of Train B in the direction of the station becomes untenable. Before the activation of the fans at 901s, the smoke flows into the station platform and makes it untenable at 754s. There is no smoke flow in the portal direction. Figure 5 gives the time when the evacuation route in the station side of the tunnel becomes untenable (ASET). Although maximum tenable time is longer, the condition is still not acceptable unless the passengers are encouraged to evacuate in the portal direction, which is unlikely to happen. This scenario shows that the influence of type of dominant burning materials can influence the maximum tenable time in the tunnel, materials with a lower soot production rate can give longer tenable time for passengers, and longer time is available to evacuate the passengers. 4.4 Scenario #4: A 15MW train rear fire, no wind blow at the portal, SMS fans activate at 180s
CFD Assessment Of Railway Tunnel Train Fire Scenarios
Yunlong Liu, Xijuan Liu & Bradley Paroz 13 / 16
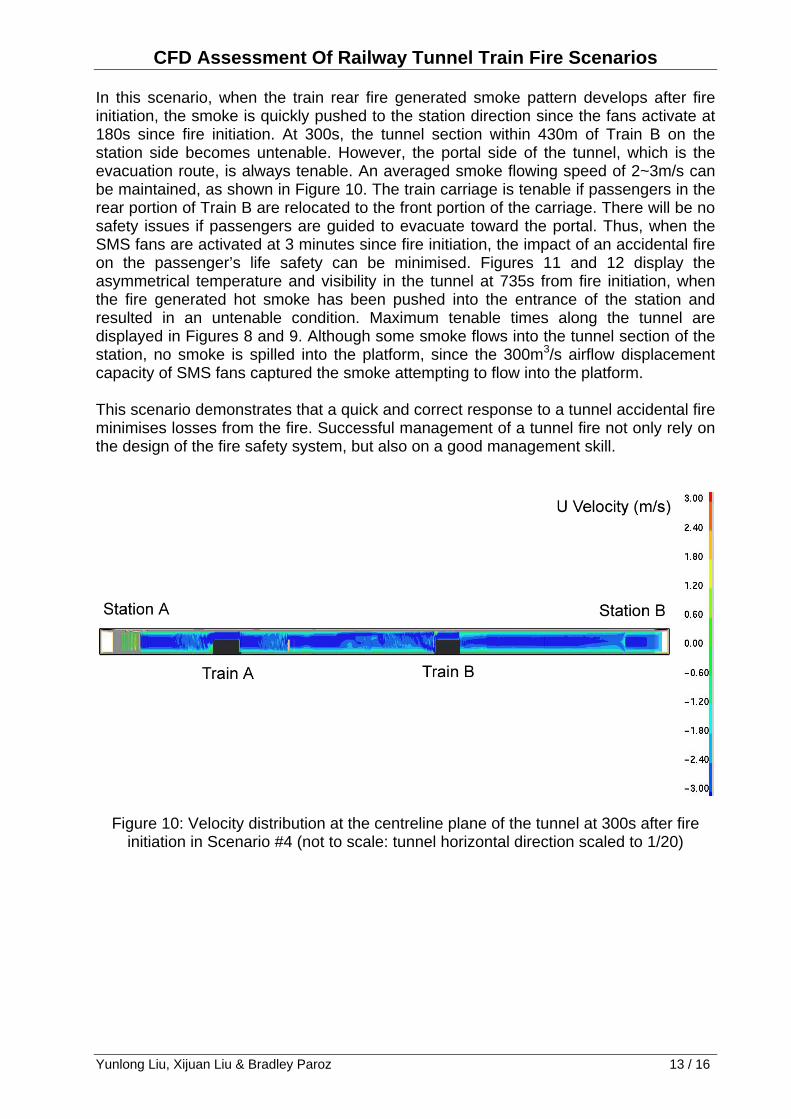
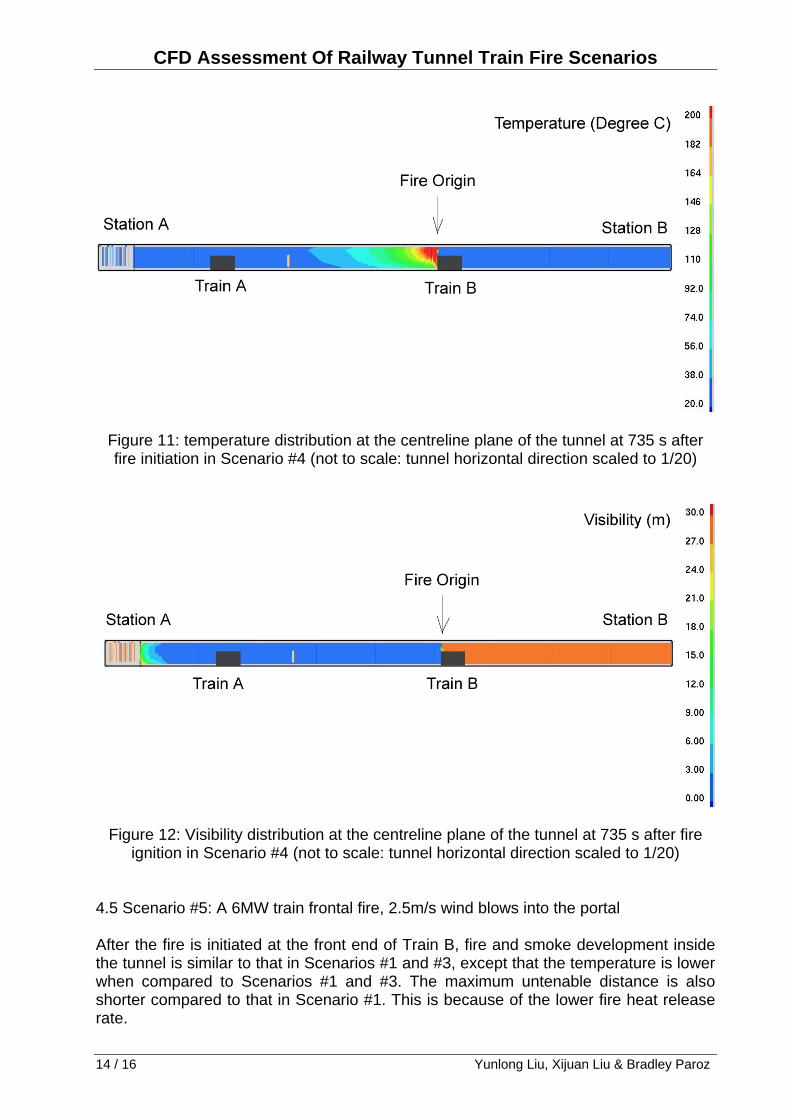
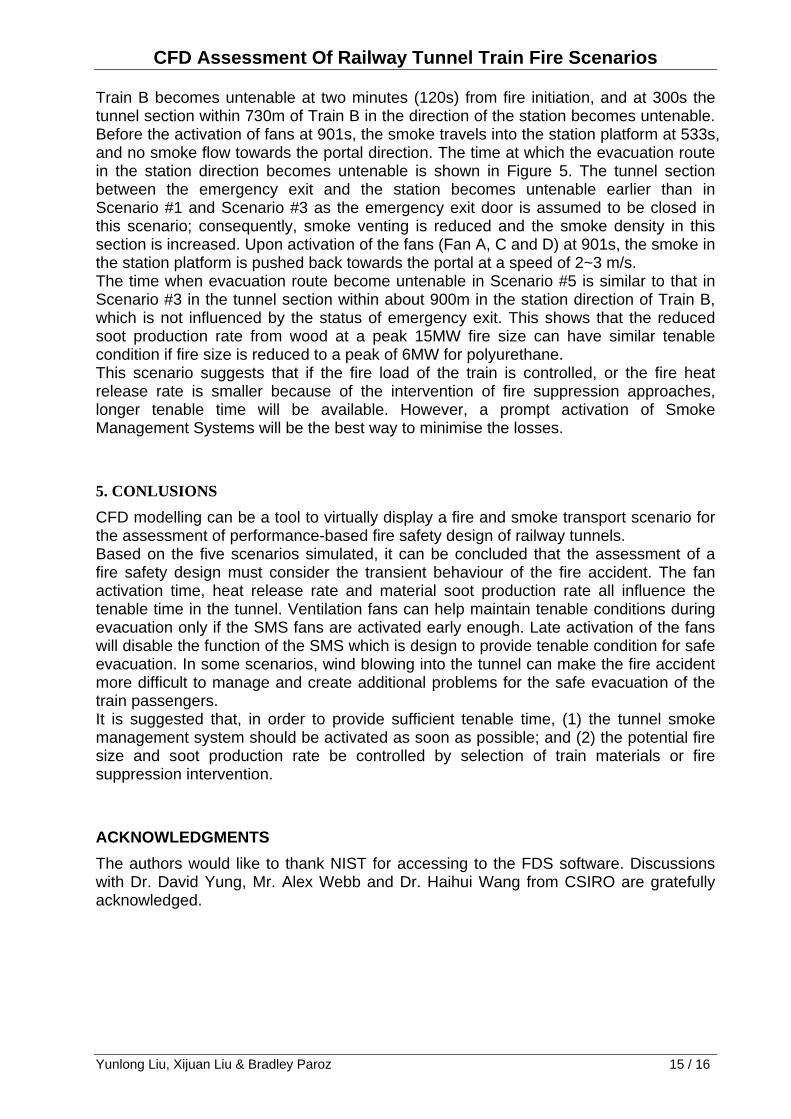
In this scenario, when the train rear fire generated smoke pattern develops after fire initiation, the smoke is quickly pushed to the station direction since the fans activate at 180s since fire initiation. At 300s, the tunnel section within 430m of Train B on the station side becomes untenable. However, the portal side of the tunnel, which is the evacuation route, is always tenable. An averaged smoke flowing speed of 2~3m/s can be maintained, as shown in Figure 10. The train carriage is tenable if passengers in the rear portion of Train B are relocated to the front portion of the carriage. There will be no safety issues if passengers are guided to evacuate toward the portal. Thus, when the SMS fans are activated at 3 minutes since fire initiation, the impact of an accidental fire on the passenger’s life safety can be minimised. Figures 11 and 12 display the asymmetrical temperature and visibility in the tunnel at 735s from fire initiation, when the fire generated hot smoke has been pushed into the entrance of the station and resulted in an untenable condition. Maximum tenable times along the tunnel are displayed in Figures 8 and 9. Although some smoke flows into the tunnel section of the station, no smoke is spilled into the platform, since the 300m3/s airflow displacement capacity of SMS fans captured the smoke attempting to flow into the platform. This scenario demonstrates that a quick and correct response to a tunnel accidental fire minimises losses from the fire. Successful management of a tunnel fire not only rely on the design of the fire safety system, but also on a good management skill.
Figure 10: Velocity distribution at the centreline plane of the tunnel at 300s after fire initiation in Scenario #4 (not to scale: tunnel horizontal direction scaled to 1/20)
CFD Assessment Of Railway Tunnel Train Fire Scenarios
14 / 16 Yunlong Liu, Xijuan Liu & Bradley Paroz
Figure 11: temperature distribution at the centreline plane of the tunnel at 735 s after fire initiation in Scenario #4 (not to scale: tunnel horizontal direction scaled to 1/20)
Figure 12: Visibility distribution at the centreline plane of the tunnel at 735 s after fire ignition in Scenario #4 (not to scale: tunnel horizontal direction scaled to 1/20)
4.5 Scenario #5: A 6MW train frontal fire, 2.5m/s wind blows into the portal After the fire is initiated at the front end of Train B, fire and smoke development inside the tunnel is similar to that in Scenarios #1 and #3, except that the temperature is lower when compared to Scenarios #1 and #3. The maximum untenable distance is also shorter compared to that in Scenario #1. This is because of the lower fire heat release rate.
CFD Assessment Of Railway Tunnel Train Fire Scenarios
Yunlong Liu, Xijuan Liu & Bradley Paroz 15 / 16
Train B becomes untenable at two minutes (120s) from fire initiation, and at 300s the tunnel section within 730m of Train B in the direction of the station becomes untenable. Before the activation of fans at 901s, the smoke travels into the station platform at 533s, and no smoke flow towards the portal direction. The time at which the evacuation route in the station direction becomes untenable is shown in Figure 5. The tunnel section between the emergency exit and the station becomes untenable earlier than in Scenario #1 and Scenario #3 as the emergency exit door is assumed to be closed in this scenario; consequently, smoke venting is reduced and the smoke density in this section is increased. Upon activation of the fans (Fan A, C and D) at 901s, the smoke in the station platform is pushed back towards the portal at a speed of 2~3 m/s. The time when evacuation route become untenable in Scenario #5 is similar to that in Scenario #3 in the tunnel section within about 900m in the station direction of Train B, which is not influenced by the status of emergency exit. This shows that the reduced soot production rate from wood at a peak 15MW fire size can have similar tenable condition if fire size is reduced to a peak of 6MW for polyurethane. This scenario suggests that if the fire load of the train is controlled, or the fire heat release rate is smaller because of the intervention of fire suppression approaches, longer tenable time will be available. However, a prompt activation of Smoke Management Systems will be the best way to minimise the losses. 5. CONLUSIONS
CFD modelling can be a tool to virtually display a fire and smoke transport scenario for the assessment of performance-based fire safety design of railway tunnels. Based on the five scenarios simulated, it can be concluded that the assessment of a fire safety design must consider the transient behaviour of the fire accident. The fan activation time, heat release rate and material soot production rate all influence the tenable time in the tunnel. Ventilation fans can help maintain tenable conditions during evacuation only if the SMS fans are activated early enough. Late activation of the fans will disable the function of the SMS which is design to provide tenable condition for safe evacuation. In some scenarios, wind blowing into the tunnel can make the fire accident more difficult to manage and create additional problems for the safe evacuation of the train passengers. It is suggested that, in order to provide sufficient tenable time, (1) the tunnel smoke management system should be activated as soon as possible; and (2) the potential fire size and soot production rate be controlled by selection of train materials or fire suppression intervention. ACKNOWLEDGMENTS The authors would like to thank NIST for accessing to the FDS software. Discussions with Dr. David Yung, Mr. Alex Webb and Dr. Haihui Wang from CSIRO are gratefully acknowledged.

CFD Assessment Of Railway Tunnel Train Fire Scenarios
16 / 16 Yunlong Liu, Xijuan Liu & Bradley Paroz
REFERENCES
1. Haack, A., “Current safety issues in traffic tunnels”, Tunnelling and underground
space technology Vol.17, No.2, pp.117-127, 2002. 2. Li, J.S.M., and Chow, W.K., “Numerical studies on performance evaluation of
tunnel ventilation safety systems”, Tunnelling and underground space technology Vol.18, No.5, pp.435-452, 2003.
3. Anders Lonnermark, Haukur Ingason, “Gas temperatures in heavy goods vehicle fires in tunnels”, Fire Safety Journal, 40, pp506-527, 2005.
4. Gao, P.Z., Chow, W.K., et al, “Large Eddy simulation for studying tunnel smoke ventilation”, Tunnelling and underground space technology Vol.19, No.6, pp.577-586, 2004.
5. Modic, J., “Fire simulation in road tunnels”, Tunnelling and underground space technology, Vol.18, No.5, pp.525-530, 2003.
6. Apte, V.B., Green, A.R., Kent, J.H. “Fire Plume Flow in Mines”, NERD&D Project No. 1078, TestSafe Australia, June 1991.
7. Yunlong Liu, Vivek Apte, Yen Luong, et al. “Tunnel Fire and Life Safety Issues’, Proceedings of IAFSS 2005.
8. C.C.Hwang and J.C.Edwards, “The critical ventilation velocity in tunnel fire – a computer simulation”, Fire Safety Journal, 40, 213-244, 2005
9. Kwang-Soo Jegal and Deog-Su Kim, “Ventilation and risk control of the Young Dong Rail Tunnel in Korea”, Proceedings of the first international conference on major tunnel and infrastructure projects, 22-24 May 2000, Taipei, Taiwan.
10. Design and Installation – Tunnel fire safety – New passenger railway tunnels, Engineering Standard, BSS02, Australian Rail Track Corporation, Issue 1, Revision 2, March 2005.
11. McGrattan, K. B, et al, “Fire dynamics simulator (version 3) – Technical reference guide”, National Institute of Standards and Technology, USA, 2005.
12. Fire Engineering Guidelines, First Edition, ISBN07337 04549, 1996.