cfa institute research challenge€¦ · 2016 | cfa institute research challenge business...
TRANSCRIPT
CFA Institute Research Challenge
Hosted by CFA Society Sydney
Griffith University

1
2016 | CFA Institute Research Challenge
Recommendation
Flight Centre Travel Group Limited FLT: AU/ FLT.AX Industry: Consumer Discretionary
Executive Summary As per our valuation, we issue a sell recommendation for Flight Centre (herein ‘FLT’ or the ‘Company’). Our 12-month target price is $31.93AUD, with a projected downside of 13%. This has been calculated using a combination of (1) The Dividend Discount Model, (2) Discounted Free Cash Flows to the Firm, and (3) several Relative Valuation techniques. Investment Thesis and Outline Industry volatility, lowered necessity for travel agency intermediation and little international room for expansion all collectively suggest that FLT will face future struggle. Declines in financial performance of the Company in 2016 have resulted in weaker competitive positioning. We believe this is paving the way to eventual stagnation of income, and hence loss of investor returns. A summary of our fundamental top-down analysis is as follows: • High International Competition: Many key international players already dominate worldwide
market share.1 We forecast eventual online market saturation, leaving little room for global development unless FLT can steal revenue from its existing competitors.
• Lowered Industry Commission Potential: Increased sales demand from price wars between domestic budget airlines cannot offset lowered commission revenues. Further, demand for agency intermediation is decreasing as online platforms are making it easier for consumers to bypass the middleman, and compare the competition.
• Shifts in consumer preferences: Consumer preferences have shifted and now favour localised travel due to the weak AUD/USD primary pairing. This form of travel is simple and does not usually require agency intermediation. Further, corresponding growth in inbound travel does not form revenue for FLT.
• Expensive Capital Structure: FLT currently has the most expensive WACC of all peers as CAPEX is funded entirely through equity.2 As the Company is focusing on future expansion, this will reduce the profitability of such ventures.
• High Expenses and Low Net Profit Margins: For the previous 3 financial years, operating expenses have grown at a higher rate than revenues, leaving low and unimproved net profit margins. This has led to a ROA below peer average, and an ROE at a second all time low, causing concerns for shareholders.
• Low Potential for International Profits: As FLT have shifted their focus onto claiming international market share, expenses incurred do not benefit from FLT’s economies of scale within Australia. Consequently the bottom line for these segments is not as profitable as it could be if revenues were incurred domestically.
• Many investment risks are faced and inherently volatile: Operation within 14 countries naturally causes high amounts of foreign exchange and economic risk. Further, FLT’s large fixed expenses combined with commissions fluctuating due to price wars cause high operating risk.
Current At 31/8/2016
Target Potential Downside
è Avg Daily Volume 820,640M
è Free Float 50.49% 100.93M Shares
$36.85
$31.93
13%
è Market Cap AU$3.6B
1Priceline (PCLN:US) $1,418.59, Expedia (EXPE:US) $113.13, CTrip.com (CTRP:US) $48.96 2Above, also including Webjet (WEB:AU) $9.64, HelloWorld (HLO:AU) $4.30, Corporate Travel Management (CTD:AU) $18.14
Key Stock Data Sep16
52 Week Range 45.37 - 29.38
Institutional Ownership 62.45%
ROE 18.67
Current P/E 12.93 Est. International P/E 10.21
Est. Domestic P/E 14.08
EPS 2.42
Est. EPS 2.69
Price/Book 2.37 Price/Sales 1.21
Dividend
Div. Yield 4.30% DPS 1.52 5 year Dividend Growth 12.59%
Relative Performance
S&P/ASX200 Ticker: AS51 1m 3.73 6m -25.46
12m -19.81
S&PASX 200 Consumer Discretionary Ticker: S5COND 1m 5.76 6m -16.68
12m -13.58
Source: Bloomberg & Team Estimates
Income Statement ($'000,000) 2016 2017F 2018F 2019F 2020F
TTV 19305 20608 21879 23095 24234 Revenue 2640 2878 3058 3222 3372 EBITDA 409 456 459 473 482
EBITDA Margin 15.49% 15.86% 15.01% 14.67% 14.29% Net Income 245 272 265 265 265
Net profit Margin 9.264% 9.466% 8.683% 8.240% 7.868% Balance Sheet ($'000,000) Total Assets 3001 3285 3596 3936 4308 Total Liabilities 1655 1812 1983 2171 2376 Total Equity 1346 1473 1612 1765 1932 Ratios FCFF/Share 2.80 2.77 2.72 2.65 2.56 EPS 2.42 2.70 2.63 2.63 2.63 DPS 1.52 1.61 1.55 1.54 1.53 ROE 18.70% 19.33% 17.21% 15.72% 14.35% ROIC 18.18% 18.30% 16.36% 15.03% 13.61%

2
2016 | CFA Institute Research Challenge
Business Description
Company Overview Founded in 1981, FLT is an Australian based travel agency headquartered in Brisbane, Queensland. The Company had its IPO in 1995, and boasts 2.64B in revenue and 3000 stores in 14 countries as of FY16. Despite their name, FLT is not limited to revenues from airline ticket sales, and actually provides a number of services within the travel industry, such as cruise lines, car hires, and hotel accommodation. Business Structure Previously known as Flight Centre Limited, FLT changed their name to Flight Centre Travel Group Limited in 2013. Majority of the Company’s revenues are derived from the travel industry, where they operate within leisure, corporate and wholesale sectors. Of the 40 brands under FLT, leisure has consistently remained the strongest sector, while the corporate division has grown to 33% of revenues for FY16 under 6 dedicated brands. The Company are targeting consumers at many different stages of travel: expanding their products to include tourist activity packages (Cruise About) and currency exchange services (Travel Money). Excluding the travel industry, in 2016 only 9.92% of total revenue was attributed to FLT’s other companies. Evidently, FLT’s business structure is hardly diversified. This is due to the fact that management are aiming to use such expansion into other areas to support FLT travel segment growth simultaneously. For example, products from Buffalo Tours are sold within FLT’s travel package bundles, and courses offered First Class Education Group include travel agency training for employees. Though originally a brick and mortar store based company, new technology developments are forcing FLT to expand online to continue sustainable growth. The Company has shifted its business structure by investing in online booking platforms, either by developing its own websites and online brands such as Aunt Betty, or acquiring businesses who already have a foot in the door such as BYOjet and Student Universe (Figure 3). Company Strategy FLT is undertaking a transition from traditional travel agency to a ‘person-to-person’ travel service provider. This includes less reliance on physical stores and increased presence online. Further, the company also wants to further personalise customer experiences, by giving agents the ability to work from home and build a selective customer base. The Company is undertaking large geographical expansion, and does so primarily through acquisitions. Within the last two financial years FLT have acquired several profitable companies, such as StudentUniverse.com. It is expected that they will continue to capture market share through this method. Revenue and Expenses FLT’s main source of income is on a commission basis with individual airlines. As these contracts are largely discretionary, FLT’s revenue streams can fluctuate, particularly if high competition is shrinking retail prices. These contracts include different commission streams, such as a flat dollar amount per ticket sold, a percentage, and even overrides if FLT is successful in selling all their holdings. FLT’s revenues are hence a percentage of their total transaction value (TTV); an unaudited Figure representing the total price of transactions they have undertaken as an agent. FLT suffers from high operating costs, particularly through wage and rent expenses necessary to maintain their dominant brick and mortar stores. Management is making efforts to combine several smaller stores into a few large ones to maximise efficiency. Further, as the Company is planning further expansion into digital platforms, this may also then cut these expenses. Geographical Performance FLT has operations across 14 countries, among which Australia comprises of 49% revenue. This should come as no surprise as FLT have built themselves to a bellwether status within the domestic market; with a total of 20,000 employees within Australia and 79% of the domestic industry revenue. Following Australia are both the Europe and North America segments, at 15.6% and 11.2% respectively. In FY16, South Africa hit a record first-half year result, becoming the third most profitable country by TTV to EBIT margin. FLT’s success however, is not consistent across the board. The INDUASIA segment contains India, Singapore & Malaysia, Greater China and United Arab Emirates. FLT have had increasing issues within this area and closed losses in FY16. However in order to compensate, management have made acquisitions within the area to capture increased market share. In particular, the Company may expand into mainland China to add to their geographical diversity.
Figure 2: Corporate Structure
Source: Flight Centre Travel Group Annual Report
Figure 3: Recent Acquisitions
Source: Bloomberg &FLT annual
Report Figure 4: FLT Revenue Break-down
Source: FLT Annual Report &
Bloomberg Figure 5: Industry Sentiment Survey: Factors Essential to tourism
Source: Austrade
3
2016 | CFA Institute Research Challenge
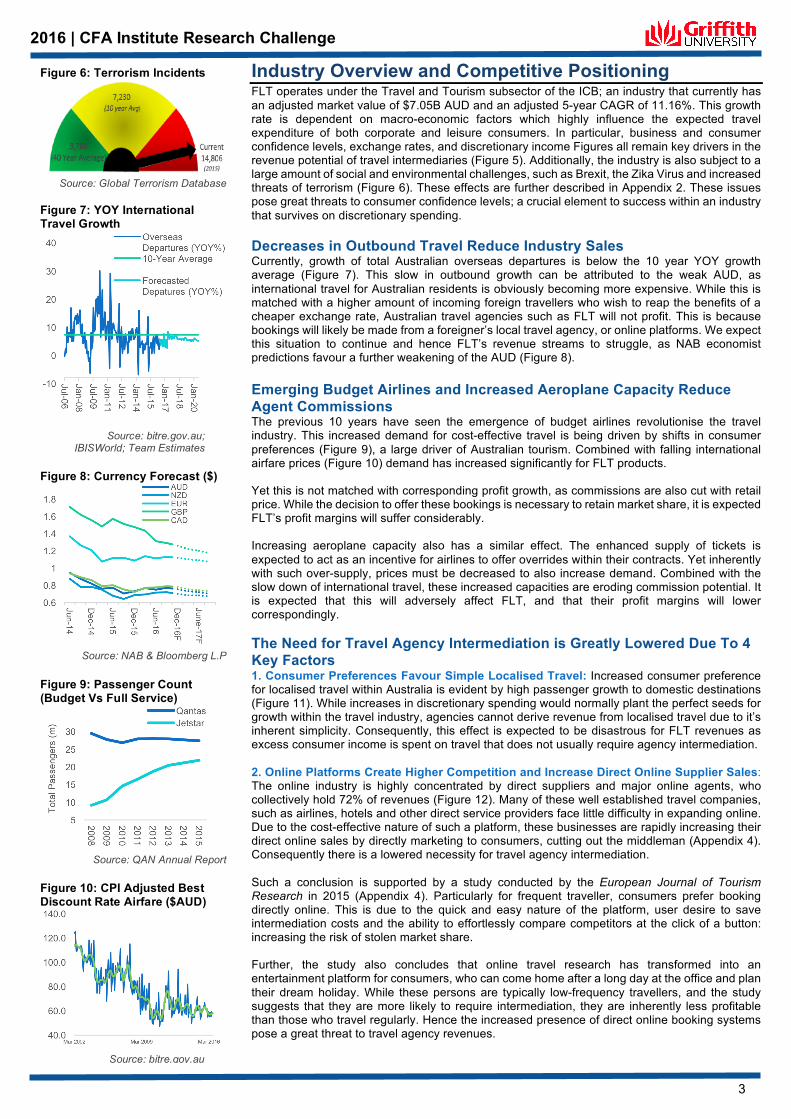
Industry Overview and Competitive Positioning FLT operates under the Travel and Tourism subsector of the ICB; an industry that currently has an adjusted market value of $7.05B AUD and an adjusted 5-year CAGR of 11.16%. This growth rate is dependent on macro-economic factors which highly influence the expected travel expenditure of both corporate and leisure consumers. In particular, business and consumer confidence levels, exchange rates, and discretionary income Figures all remain key drivers in the revenue potential of travel intermediaries (Figure 5). Additionally, the industry is also subject to a large amount of social and environmental challenges, such as Brexit, the Zika Virus and increased threats of terrorism (Figure 6). These effects are further described in Appendix 2. These issues pose great threats to consumer confidence levels; a crucial element to success within an industry that survives on discretionary spending. Decreases in Outbound Travel Reduce Industry Sales Currently, growth of total Australian overseas departures is below the 10 year YOY growth average (Figure 7). This slow in outbound growth can be attributed to the weak AUD, as international travel for Australian residents is obviously becoming more expensive. While this is matched with a higher amount of incoming foreign travellers who wish to reap the benefits of a cheaper exchange rate, Australian travel agencies such as FLT will not profit. This is because bookings will likely be made from a foreigner’s local travel agency, or online platforms. We expect this situation to continue and hence FLT’s revenue streams to struggle, as NAB economist predictions favour a further weakening of the AUD (Figure 8). Emerging Budget Airlines and Increased Aeroplane Capacity Reduce Agent Commissions The previous 10 years have seen the emergence of budget airlines revolutionise the travel industry. This increased demand for cost-effective travel is being driven by shifts in consumer preferences (Figure 9), a large driver of Australian tourism. Combined with falling international airfare prices (Figure 10) demand has increased significantly for FLT products. Yet this is not matched with corresponding profit growth, as commissions are also cut with retail price. While the decision to offer these bookings is necessary to retain market share, it is expected FLT’s profit margins will suffer considerably. Increasing aeroplane capacity also has a similar effect. The enhanced supply of tickets is expected to act as an incentive for airlines to offer overrides within their contracts. Yet inherently with such over-supply, prices must be decreased to also increase demand. Combined with the slow down of international travel, these increased capacities are eroding commission potential. It is expected that this will adversely affect FLT, and that their profit margins will lower correspondingly. The Need for Travel Agency Intermediation is Greatly Lowered Due To 4 Key Factors 1. Consumer Preferences Favour Simple Localised Travel: Increased consumer preference for localised travel within Australia is evident by high passenger growth to domestic destinations (Figure 11). While increases in discretionary spending would normally plant the perfect seeds for growth within the travel industry, agencies cannot derive revenue from localised travel due to it’s inherent simplicity. Consequently, this effect is expected to be disastrous for FLT revenues as excess consumer income is spent on travel that does not usually require agency intermediation. 2. Online Platforms Create Higher Competition and Increase Direct Online Supplier Sales: The online industry is highly concentrated by direct suppliers and major online agents, who collectively hold 72% of revenues (Figure 12). Many of these well established travel companies, such as airlines, hotels and other direct service providers face little difficulty in expanding online. Due to the cost-effective nature of such a platform, these businesses are rapidly increasing their direct online sales by directly marketing to consumers, cutting out the middleman (Appendix 4). Consequently there is a lowered necessity for travel agency intermediation. Such a conclusion is supported by a study conducted by the European Journal of Tourism Research in 2015 (Appendix 4). Particularly for frequent traveller, consumers prefer booking directly online. This is due to the quick and easy nature of the platform, user desire to save intermediation costs and the ability to effortlessly compare competitors at the click of a button: increasing the risk of stolen market share. Further, the study also concludes that online travel research has transformed into an entertainment platform for consumers, who can come home after a long day at the office and plan their dream holiday. While these persons are typically low-frequency travellers, and the study suggests that they are more likely to require intermediation, they are inherently less profitable than those who travel regularly. Hence the increased presence of direct online booking systems pose a great threat to travel agency revenues.
Figure 6: Terrorism Incidents
Source: Global Terrorism Database
Figure 7: YOY International Travel Growth
Source: bitre.gov.au; IBISWorld; Team Estimates
Figure 8: Currency Forecast ($)
Source: NAB & Bloomberg L.P
Figure 9: Passenger Count (Budget Vs Full Service)
Source: QAN Annual Report
Figure 10: CPI Adjusted Best Discount Rate Airfare ($AUD)
Source: bitre.gov.au
4
2016 | CFA Institute Research Challenge
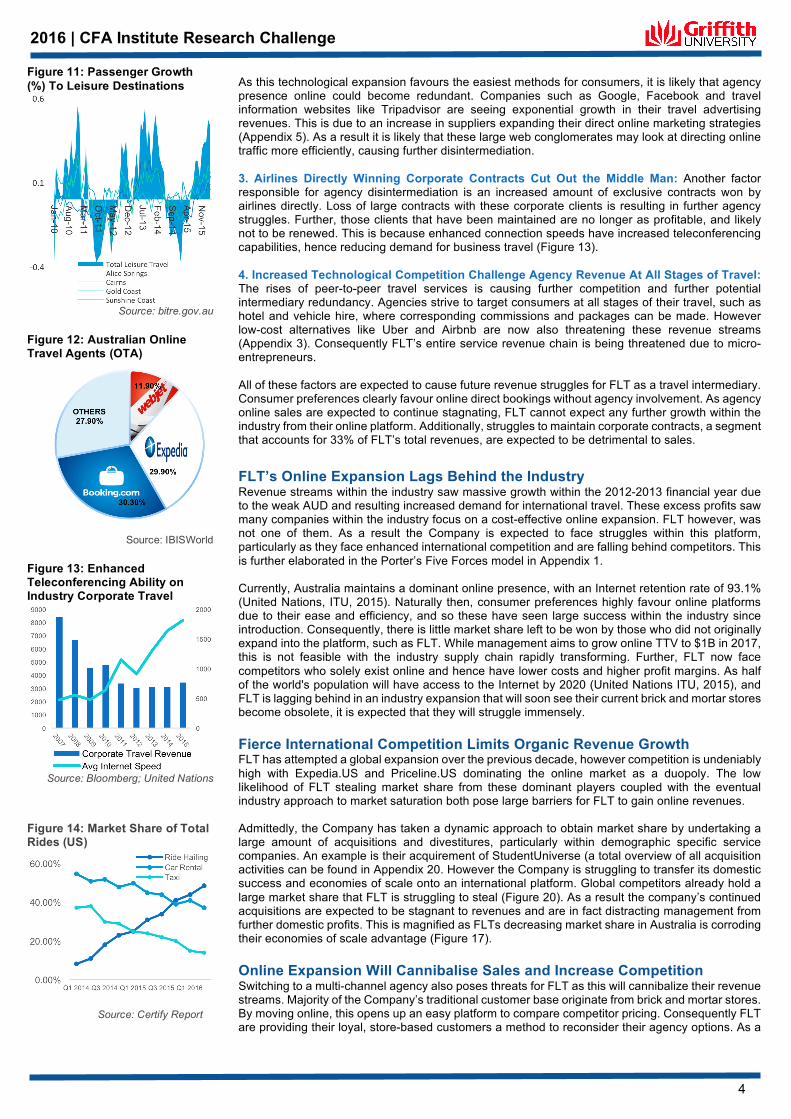
As this technological expansion favours the easiest methods for consumers, it is likely that agency presence online could become redundant. Companies such as Google, Facebook and travel information websites like Tripadvisor are seeing exponential growth in their travel advertising revenues. This is due to an increase in suppliers expanding their direct online marketing strategies (Appendix 5). As a result it is likely that these large web conglomerates may look at directing online traffic more efficiently, causing further disintermediation. 3. Airlines Directly Winning Corporate Contracts Cut Out the Middle Man: Another factor responsible for agency disintermediation is an increased amount of exclusive contracts won by airlines directly. Loss of large contracts with these corporate clients is resulting in further agency struggles. Further, those clients that have been maintained are no longer as profitable, and likely not to be renewed. This is because enhanced connection speeds have increased teleconferencing capabilities, hence reducing demand for business travel (Figure 13). 4. Increased Technological Competition Challenge Agency Revenue At All Stages of Travel: The rises of peer-to-peer travel services is causing further competition and further potential intermediary redundancy. Agencies strive to target consumers at all stages of their travel, such as hotel and vehicle hire, where corresponding commissions and packages can be made. However low-cost alternatives like Uber and Airbnb are now also threatening these revenue streams (Appendix 3). Consequently FLT’s entire service revenue chain is being threatened due to micro-entrepreneurs. All of these factors are expected to cause future revenue struggles for FLT as a travel intermediary. Consumer preferences clearly favour online direct bookings without agency involvement. As agency online sales are expected to continue stagnating, FLT cannot expect any further growth within the industry from their online platform. Additionally, struggles to maintain corporate contracts, a segment that accounts for 33% of FLT’s total revenues, are expected to be detrimental to sales. FLT’s Online Expansion Lags Behind the Industry Revenue streams within the industry saw massive growth within the 2012-2013 financial year due to the weak AUD and resulting increased demand for international travel. These excess profits saw many companies within the industry focus on a cost-effective online expansion. FLT however, was not one of them. As a result the Company is expected to face struggles within this platform, particularly as they face enhanced international competition and are falling behind competitors. This is further elaborated in the Porter’s Five Forces model in Appendix 1. Currently, Australia maintains a dominant online presence, with an Internet retention rate of 93.1% (United Nations, ITU, 2015). Naturally then, consumer preferences highly favour online platforms due to their ease and efficiency, and so these have seen large success within the industry since introduction. Consequently, there is little market share left to be won by those who did not originally expand into the platform, such as FLT. While management aims to grow online TTV to $1B in 2017, this is not feasible with the industry supply chain rapidly transforming. Further, FLT now face competitors who solely exist online and hence have lower costs and higher profit margins. As half of the world's population will have access to the Internet by 2020 (United Nations ITU, 2015), and FLT is lagging behind in an industry expansion that will soon see their current brick and mortar stores become obsolete, it is expected that they will struggle immensely. Fierce International Competition Limits Organic Revenue Growth FLT has attempted a global expansion over the previous decade, however competition is undeniably high with Expedia.US and Priceline.US dominating the online market as a duopoly. The low likelihood of FLT stealing market share from these dominant players coupled with the eventual industry approach to market saturation both pose large barriers for FLT to gain online revenues. Admittedly, the Company has taken a dynamic approach to obtain market share by undertaking a large amount of acquisitions and divestitures, particularly within demographic specific service companies. An example is their acquirement of StudentUniverse (a total overview of all acquisition activities can be found in Appendix 20. However the Company is struggling to transfer its domestic success and economies of scale onto an international platform. Global competitors already hold a large market share that FLT is struggling to steal (Figure 20). As a result the company’s continued acquisitions are expected to be stagnant to revenues and are in fact distracting management from further domestic profits. This is magnified as FLTs decreasing market share in Australia is corroding their economies of scale advantage (Figure 17). Online Expansion Will Cannibalise Sales and Increase Competition Switching to a multi-channel agency also poses threats for FLT as this will cannibalize their revenue streams. Majority of the Company’s traditional customer base originate from brick and mortar stores. By moving online, this opens up an easy platform to compare competitor pricing. Consequently FLT are providing their loyal, store-based customers a method to reconsider their agency options. As a
Figure 11: Passenger Growth (%) To Leisure Destinations
Source: bitre.gov.au
Figure 12: Australian Online Travel Agents (OTA)
Source: IBISWorld Figure 13: Enhanced Teleconferencing Ability on Industry Corporate Travel
Source: Bloomberg; United Nations
Figure 14: Market Share of Total Rides (US)
Source: Certify Report
5
2016 | CFA Institute Research Challenge
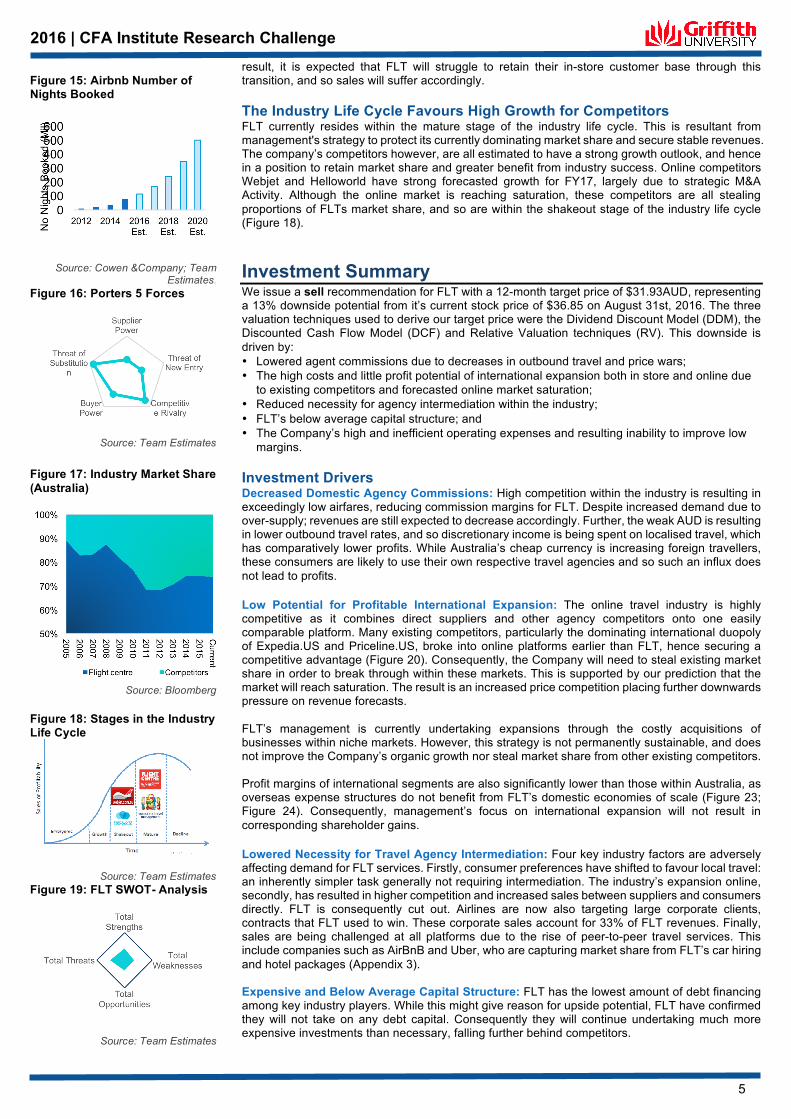
result, it is expected that FLT will struggle to retain their in-store customer base through this transition, and so sales will suffer accordingly. The Industry Life Cycle Favours High Growth for Competitors FLT currently resides within the mature stage of the industry life cycle. This is resultant from management's strategy to protect its currently dominating market share and secure stable revenues. The company’s competitors however, are all estimated to have a strong growth outlook, and hence in a position to retain market share and greater benefit from industry success. Online competitors Webjet and Helloworld have strong forecasted growth for FY17, largely due to strategic M&A Activity. Although the online market is reaching saturation, these competitors are all stealing proportions of FLTs market share, and so are within the shakeout stage of the industry life cycle (Figure 18). Investment Summary We issue a sell recommendation for FLT with a 12-month target price of $31.93AUD, representing a 13% downside potential from it’s current stock price of $36.85 on August 31st, 2016. The three valuation techniques used to derive our target price were the Dividend Discount Model (DDM), the Discounted Cash Flow Model (DCF) and Relative Valuation techniques (RV). This downside is driven by: • Lowered agent commissions due to decreases in outbound travel and price wars; • The high costs and little profit potential of international expansion both in store and online due
to existing competitors and forecasted online market saturation; • Reduced necessity for agency intermediation within the industry; • FLT’s below average capital structure; and • The Company’s high and inefficient operating expenses and resulting inability to improve low
margins.
Investment Drivers Decreased Domestic Agency Commissions: High competition within the industry is resulting in exceedingly low airfares, reducing commission margins for FLT. Despite increased demand due to over-supply; revenues are still expected to decrease accordingly. Further, the weak AUD is resulting in lower outbound travel rates, and so discretionary income is being spent on localised travel, which has comparatively lower profits. While Australia’s cheap currency is increasing foreign travellers, these consumers are likely to use their own respective travel agencies and so such an influx does not lead to profits. Low Potential for Profitable International Expansion: The online travel industry is highly competitive as it combines direct suppliers and other agency competitors onto one easily comparable platform. Many existing competitors, particularly the dominating international duopoly of Expedia.US and Priceline.US, broke into online platforms earlier than FLT, hence securing a competitive advantage (Figure 20). Consequently, the Company will need to steal existing market share in order to break through within these markets. This is supported by our prediction that the market will reach saturation. The result is an increased price competition placing further downwards pressure on revenue forecasts. FLT’s management is currently undertaking expansions through the costly acquisitions of businesses within niche markets. However, this strategy is not permanently sustainable, and does not improve the Company’s organic growth nor steal market share from other existing competitors. Profit margins of international segments are also significantly lower than those within Australia, as overseas expense structures do not benefit from FLT’s domestic economies of scale (Figure 23; Figure 24). Consequently, management’s focus on international expansion will not result in corresponding shareholder gains. Lowered Necessity for Travel Agency Intermediation: Four key industry factors are adversely affecting demand for FLT services. Firstly, consumer preferences have shifted to favour local travel: an inherently simpler task generally not requiring intermediation. The industry’s expansion online, secondly, has resulted in higher competition and increased sales between suppliers and consumers directly. FLT is consequently cut out. Airlines are now also targeting large corporate clients, contracts that FLT used to win. These corporate sales account for 33% of FLT revenues. Finally, sales are being challenged at all platforms due to the rise of peer-to-peer travel services. This include companies such as AirBnB and Uber, who are capturing market share from FLT’s car hiring and hotel packages (Appendix 3). Expensive and Below Average Capital Structure: FLT has the lowest amount of debt financing among key industry players. While this might give reason for upside potential, FLT have confirmed they will not take on any debt capital. Consequently they will continue undertaking much more expensive investments than necessary, falling further behind competitors.
Figure 15: Airbnb Number of Nights Booked
Source: Cowen &Company; Team Estimates.
Figure 16: Porters 5 Forces
Source: Team Estimates
Figure 17: Industry Market Share (Australia)
Source: Bloomberg Figure 18: Stages in the Industry Life Cycle
Source: Team Estimates Figure 19: FLT SWOT- Analysis
Source: Team Estimates
6
2016 | CFA Institute Research Challenge
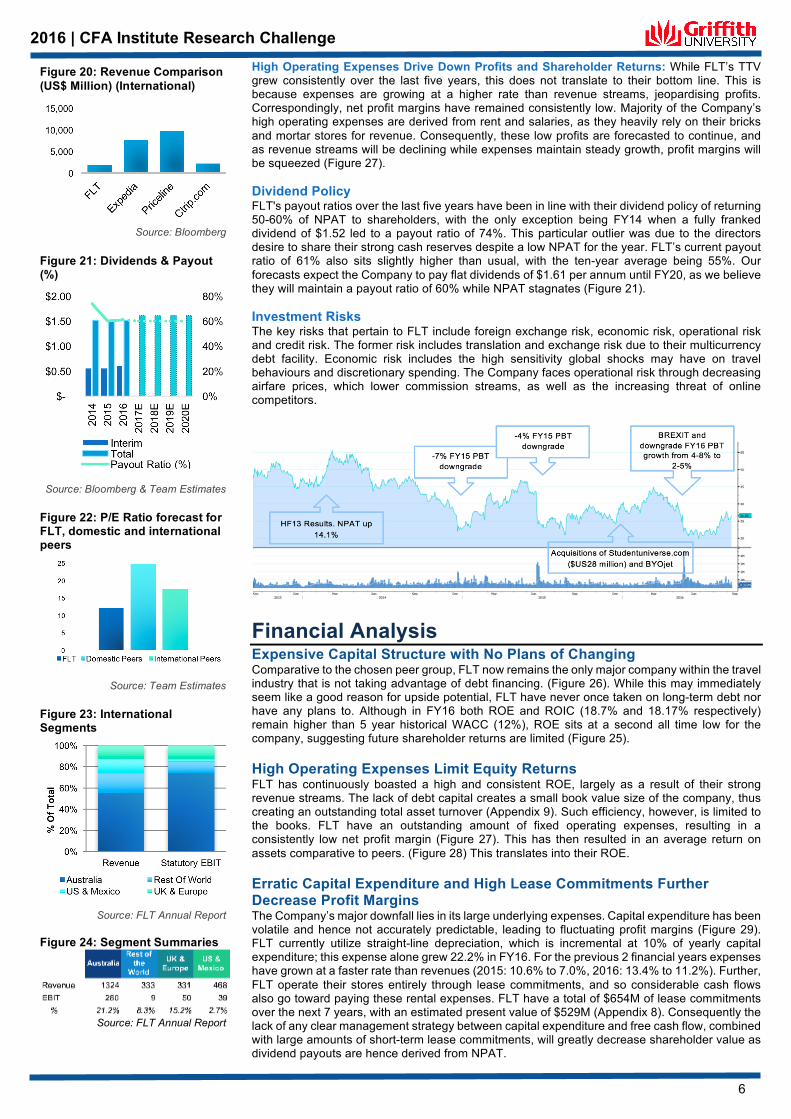
High Operating Expenses Drive Down Profits and Shareholder Returns: While FLT’s TTV grew consistently over the last five years, this does not translate to their bottom line. This is because expenses are growing at a higher rate than revenue streams, jeopardising profits. Correspondingly, net profit margins have remained consistently low. Majority of the Company’s high operating expenses are derived from rent and salaries, as they heavily rely on their bricks and mortar stores for revenue. Consequently, these low profits are forecasted to continue, and as revenue streams will be declining while expenses maintain steady growth, profit margins will be squeezed (Figure 27). Dividend Policy FLT's payout ratios over the last five years have been in line with their dividend policy of returning 50-60% of NPAT to shareholders, with the only exception being FY14 when a fully franked dividend of $1.52 led to a payout ratio of 74%. This particular outlier was due to the directors desire to share their strong cash reserves despite a low NPAT for the year. FLT’s current payout ratio of 61% also sits slightly higher than usual, with the ten-year average being 55%. Our forecasts expect the Company to pay flat dividends of $1.61 per annum until FY20, as we believe they will maintain a payout ratio of 60% while NPAT stagnates (Figure 21). Investment Risks The key risks that pertain to FLT include foreign exchange risk, economic risk, operational risk and credit risk. The former risk includes translation and exchange risk due to their multicurrency debt facility. Economic risk includes the high sensitivity global shocks may have on travel behaviours and discretionary spending. The Company faces operational risk through decreasing airfare prices, which lower commission streams, as well as the increasing threat of online competitors.
Financial Analysis Expensive Capital Structure with No Plans of Changing Comparative to the chosen peer group, FLT now remains the only major company within the travel industry that is not taking advantage of debt financing. (Figure 26). While this may immediately seem like a good reason for upside potential, FLT have never once taken on long-term debt nor have any plans to. Although in FY16 both ROE and ROIC (18.7% and 18.17% respectively) remain higher than 5 year historical WACC (12%), ROE sits at a second all time low for the company, suggesting future shareholder returns are limited (Figure 25). High Operating Expenses Limit Equity Returns FLT has continuously boasted a high and consistent ROE, largely as a result of their strong revenue streams. The lack of debt capital creates a small book value size of the company, thus creating an outstanding total asset turnover (Appendix 9). Such efficiency, however, is limited to the books. FLT have an outstanding amount of fixed operating expenses, resulting in a consistently low net profit margin (Figure 27). This has then resulted in an average return on assets comparative to peers. (Figure 28) This translates into their ROE. Erratic Capital Expenditure and High Lease Commitments Further Decrease Profit Margins The Company’s major downfall lies in its large underlying expenses. Capital expenditure has been volatile and hence not accurately predictable, leading to fluctuating profit margins (Figure 29). FLT currently utilize straight-line depreciation, which is incremental at 10% of yearly capital expenditure; this expense alone grew 22.2% in FY16. For the previous 2 financial years expenses have grown at a faster rate than revenues (2015: 10.6% to 7.0%, 2016: 13.4% to 11.2%). Further, FLT operate their stores entirely through lease commitments, and so considerable cash flows also go toward paying these rental expenses. FLT have a total of $654M of lease commitments over the next 7 years, with an estimated present value of $529M (Appendix 8). Consequently the lack of any clear management strategy between capital expenditure and free cash flow, combined with large amounts of short-term lease commitments, will greatly decrease shareholder value as dividend payouts are hence derived from NPAT.
Figure 20: Revenue Comparison (US$ Million) (International)
Source: Bloomberg
Figure 21: Dividends & Payout (%)
Source: Bloomberg & Team Estimates Figure 22: P/E Ratio forecast for FLT, domestic and international peers
Source: Team Estimates
Figure 23: International Segments
Source: FLT Annual Report Figure 24: Segment Summaries
Source: FLT Annual Report

7
2016 | CFA Institute Research Challenge
International Expansion Will Jeopardize Net Income Due To Higher Expenses and No Economies of Scale FLT are quick to boast their international income diversity, with Australia comprising 55.4% of total FY16 revenues (Figure 23). However differences in geographical expenses result in drastically different statutory EBIT values, as Australia rose to 74% due to the clear presence of economies of scale within domestic expense structure. Further, the segment’s profit margin stood at an astounding 21.15%, with the Rest of the World and US regions causing concern at 8.32% and 2.7% respectively (Figure 24). As discussed above, management is targeting strong international expansion. In doing so however, the larger expenses faced in non-domestic regions will result in lower profits than if such revenues were made locally. Also, the required capital expenditure to then set up such income streams in these new segments will then further decrease profitability and efficiency, drastically affecting shareholder value.
Revenues Internationally Are Not Justifying Costs The company is adamant regarding their strong TTV growth as a major driver of their success, however increased sales volume does not result in corresponding revenue growth. (Appendix 8). When the margin between TTV and revenue is broken down per segment, they severely differentiate, likely due to differentiating commission laws and standards. Though overall revenue grew 11.2% in FY16, expenses grew 14.61% (13.4% excluding the one off impairment charge), resulting in a 5.8% decrease in EBIT. When broken down into segments, all regions had decreased profit margins in comparison to FY15 (Appendix 6). As discussed above, FLT is losing market share due to its main competitors deriving online revenue. While this area is one that FLT are looking to explore further, these trends will continue as younger generations favor a technological approach. Despite the Company addressing this, they are still undertaking large investments into physical assets and employees. This alone increased their wages, rental and depreciation expenses by 11.91% in FY16. The current management plan clearly favours long-term growth however financially this will not result in increased shareholder value in the forecasted period. Instead it is expected that expense growth will continue to surpass sales growth within the next four years, and so any eventual benefits to net income will not fall within the forecasting period. Consequently, as the dividend policy sits at 50-60% of NPAT, these growing expenses will be detrimental to shareholder profit. Valuation We have used a combination of three valuation approaches: the Dividend Discount Model (DDM), the Discounted Cash Flow Model (DCF) and Relative Valuation techniques (RV). These have led us to our weighted average target price of $31.93AUD indicating 13% downside potential. Each of these methods have weightings of 20%, 40% and 40% respectively. These were chosen to reflect that free cash flows are a better indicator of FLT’s future cash flows opposed to dividends, and also to reflect our opinion that multiples are the key driver behind making a stock converge to it’s intrinsic value. Dividend Discount Model FLT has maintained relatively stable dividend payments over the past 10 years, hence making the DDM an ideal valuation technique. The Company has maintained their policy of returning 50% to 60% of NPAT. Therefore, future dividends are predicted based on this policy being maintained with forecasted earnings. CAPM: The capital asset pricing model was used to determine FLT's required rate of return at 8.51%.(Figure 31) Dividend Forecasts: We have assumed the Company will maintain a consistent 60% payout ratio of NPAT, and hence calculated future dividend payments based on our bearish net income forecasts.
Terminal Growth Rate: The Company’s terminal growth rate was estimated at 3% (Figure 35). Notably, nearly half of FLT’s total revenues are generated from international markets. Therefore we have incorporated the GDP growth rate of domestic and international markets to reach a suitable terminal growth rate. We assigned a weighting of 75% to the average GDP growth rate of the three most dominant markets (Australia, UK and US), consistent with revenue breakdown per segment. The remainder is attributed to an average of Asia and South Africa (Appendix 11). Two Stage Model: Currently our projected dividends indicate a decreasing trend due to our prediction that net income growth stagnate. However in times of struggling profits, FLT have historically raised the payout ratio to avoid negative dividend signals. As the last three years’ d ividends were paid at flat level, we assume that FLT will undertake a similar strategy on the basis of our forecasted 2017 dividend ($1.61AUD) until 2020. After this, we assume the dividend growth rate will be constant.
Figure 25: ROE and ROA
Source: Bloomberg & Team Estimates
Figure 26: WACC Peer Comparison
Source: Bloomberg & Team Estimates
Figure 27: Profitability Analysis
Source: Bloomberg & Team Estimates
Figure 28: Peer ROA Comparison
Source: Bloomberg
Figure 29: Operating Margin Analysis
Source: Bloomberg
Weighted Value $31.93
DDM (20%)
$27.33
DCF (40%)
$33.07
RV (40%)
$33.10

8
2016 | CFA Institute Research Challenge
Based on the above information and Appendix 12, we have reached an intrinsic value of $27.33AUD. Additional sensitivity analysis has been conducted with two pairs of variables: payout ratio versus cost of equity and terminal growth rate versus cost of equity.
Discount Cash Flow Model We have also used free cash flows to firm (FCFF) as alternative future cash flow to estimate FLT’s intrinsic value. WACC: We have considered two major uncertainties to estimate the cost of capital: 1. Historically low interest rates could entice FLT to take on more debt; and 2. High volatilities in stock price and pressures upon future earnings create higher risk. Consequently, we used a combination of current WACC (8.3%) and the 10-year historical average WACC (12%) to reach our long-term estimated cost of capital at 10.15% (Appendix 11). FCFF: We have computed FCFF from Cash Flows from Operations (CFO), which has been projected by directly forecasting its components. Two essential components are receipts from customers and payments to suppliers and employees. 1. We have set the growth rate of receipts at 6.3%, equal to forecasted compounded revenue growth from 2017-2020. Historically, these two factors have shown high correlation with minimal spread. 2. Similarly, we set the growth rate of payments equal to the compounded operating cost growth rate for the forecasted period, at 6.7%. CapEx Growth Rate: FLT has undertaken aggressive expansion in the past five years, and so we assume they will continue to invest in fixed assets in accordance with the historic five-year average CapEx growth rate of 11.5% (Appendix 11). By applying the same LGR as above, we reached an intrinsic of $33.10AUD. The three key variables used in sensitivity analysis are WACC, CapEx growth rate and LGR (Appendix 13 & 15). Relative Valuation Through our relative valuation model, we derived a target price of $33.07AUD using three key multipliers: Price/Earnings (P/E), Enterprise Value/Earnings before Interest Tax, Depreciation and Amortisation (EV/EBITDA), and Price/Sales (P/S). This model is then further split into domestic and international to provide insight into differentiating Company expectations within different playing fields. (Appendix:14). Within the domestic comparable pool we have included HLO:AU, CTD:AU, WEB:AU and also the S&P/ASX Consumer Discretionary Index. International peers consist CTRIP:US, PCLN:US, EXPE:US and the MSCI World Consumer Discretionary Index. All chosen comparables are subject to similar risks and growth potential. To derive our final intrinsic value, we have combined both target prices, weighting domestic and international target prices based on their forecasted proportions of total revenue as illustrated in Figure 34. P/E and EV/EBITDA: These multiplies provide an insight into FLT financial health by taking into account both the Company’s capital structure and earnings. Historically, both international and domestic multiples have sat above FLT by the same margin. Price/Sales: This multiple however, serves as an alternative and is useful for identifying how much revenue the company generates in isolation, with less chance of accounting manipulation. However as the multiple shows a limited picture by only capturing sales, we have assigned a weighting of 20%. P/S has also traded as a discount, with the international pool sitting significantly higher than domestic (Appendix 14). FLT has maintained a dominant presence in the Australian travel industry, hence explaining the higher target prices in comparison to international for P/E and P/Sales. This further illustrates the risk FLT will face as they expand internationally and compete with the international comparable. Additional Sensitivity Analysis Both the DDM and DCF methods highly depend on terminal value, in order to neutralise this drawback, we conduct the following analyses to gain further confidence in our recommendation. Residual Income: One of the key advantages to RI model is the reduced reliance on terminal value for the determination of intrinsic value. Applying the same variables as the DDM, and taking current book value into consideration, we obtained an intrinsic value of $32.25AUD. This is consistent with the DCF results. Consequently while residual income was not taken into the final weighting arrangement, the RI results confirm the results of our DCF model (Appendix 16).
Figure 30:
Source: Bloomberg. & Team Estimates Figure 31:
Source: Bloomberg. & Team Estimates Figure 32:
Source: Bloomberg & Team
Estimates Figure 33:
Source: Bloomberg & Team
Estimates Figure 34:
Source: Bloomberg & Team Estimates

9
2016 | CFA Institute Research Challenge
Monte Carlo: In addition to the sensitivity analyses conducted for each method, we have also completed a Monte Carlo simulation on the basis of the DCF. In the simulation, we defined assumptions for five major variables (receipts, payments, CapEx growth, WACC and LGR) and applied reasonable standard deviations. After running 20,000 trials, the simulation results suggest that more than 60% of total possibilities estimate a target price below FLT’s current market price (Appendix 17). Scenario: To gain further robustness, a scenario analysis was also conducted based on all three-valuation models, and has been explained with Monte Carlo distribution. The following table illustrates our forecasts for the decisive variables within the three valuation models for each case: bearish, base, and bullish. Bearish Assumptions: We assume that FLT’s revenue growth will be below the Australian outbound travel growth rate of 5.5% (Appendix 19). This is then expected to lead to even worse net income growth, and a lowered dividend payout ratio. In this situation, the Company will strive for survival by maintaining a relatively high CapEx growth rate. Further, cost of equity and hence WACC could rise due to higher risk. Bullish Assumption: Here, we have assumed FLT’s revenue growth rate will outperform their 5Y average, and stay in line with their historical 10Y long-term growth average by increasing investments. Net profit margin will be improved, which will boost investor confidence and hence decrease WACC.
Investment Risk By regressing FLTs monthly returns against the S&P/ASX200 and observing the coefficient of determination, it is evident that FLT’s risk profile is relatively independent from the market. Consequently, approximately 71% of total risk faced by FLT is unsystematic (See Appendix 19 for time-varying volatility modelling) This can be attributed to the outlined risks below. Foreign Exchange Risk FLT plans to expand their international operations (Figure 42), increasing their exposure to foreign exchange rate risk. As illustrated in Figure 39, FLT dramatically increased its foreign trade payables by 118% between 2014 and 2016 (Appendix 22).
FX1 - Translation Risk: For functional and presentation purposes, FLT’s financial statements are recorded in AUD. Transactions occurring overseas are transformed to Australian currency at the time of the transaction. Conversely, Asset and liability translations occur on the date of the statement using the closing rate. Any spreads arising from the translations are then reclassified to profit and loss, which have a history of being highly volatile (Figure 40). FX2 - Cash Flow: While forecasted cash flows are highly probable, they can be subject to forecasting error as the contracts are re-priced every 12 months. Over the previous 5 years, variations in gains and losses from cash flow hedges have remained relatively low (Figure 41). Mitigation: FLT is risk adverse in their hedging strategy. The Company aims to minimize exposure and achieve a 1:1 hedging ratio. FLT treasury only enter into forward foreign exchange when exchange forecasts become highly probable. Thus, speculation is not FLT’s hedging strategy. Economic Risks ER1– Consumer Confidence and travel patterns: Global shocks such as terrorism, political unrest, natural disasters and social pandemics can have an adverse effect on consumer travel confidence, potentially decreasing TTV. Furthermore, changes in discretionary income and exchanges rates can alter consumer travel patterns. Mitigation: FLT’s strategy involves increasing their brand and geographic diversification to avoid relying on a single segment.
Scenario Analysis Key Variables Bearish Base Bullish Receipts 5.00% 6.30% 9.00% Payment 6.00% 6.70% 9.00% CapEx 11.15% 11.50% 15.00% WACC 10.89% 10.15% 9.40% Cost of Equity 9.13% 8.51% 7.89% Payout Ratio 50.00% 60.00% 60.00% Net profit 1.50% 2.00% 12.50% Target Price $23.45 $31.61 $40.71 Up/Downside Potential -36.36% -14.21% 10.46% Probability 0.2455 0.4551 0.2994 Probability Weighted Target Price $32.33 Potential Downside -12.26%
Figure 35: Terminal Growth
Source: IMF & Team Estimates
Figure 36: Scenario Prices
Source: Bloomberg & Team Estimates
Figure 37: Monte Carlo
Source: Team Estimates
Figure 38: Risk Matrix
Source: Team Estimates
Figure 39: Trade & Other Payables ($'000)
Source: FLT Annual Report
Figure 40: Net exchange differences on translation of foreign operations ($'000)
Source: FLT Annual Report
10
2016 | CFA Institute Research Challenge
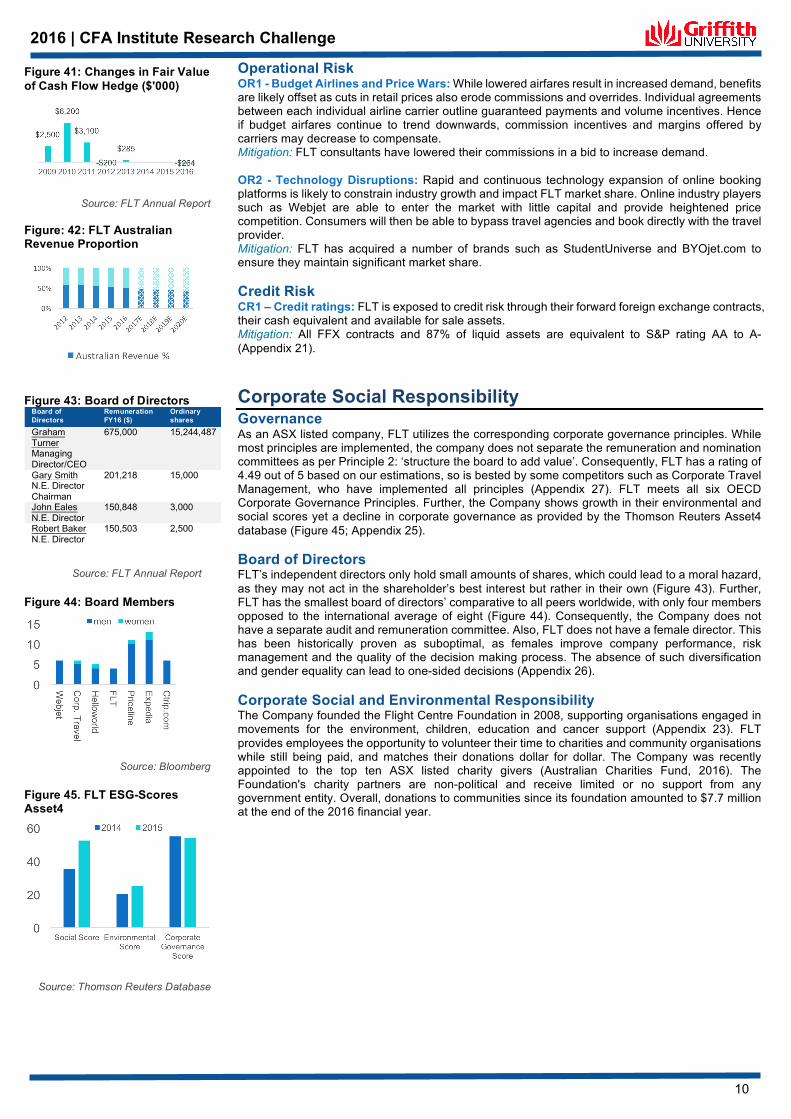
Operational Risk OR1 - Budget Airlines and Price Wars: While lowered airfares result in increased demand, benefits are likely offset as cuts in retail prices also erode commissions and overrides. Individual agreements between each individual airline carrier outline guaranteed payments and volume incentives. Hence if budget airfares continue to trend downwards, commission incentives and margins offered by carriers may decrease to compensate. Mitigation: FLT consultants have lowered their commissions in a bid to increase demand. OR2 - Technology Disruptions: Rapid and continuous technology expansion of online booking platforms is likely to constrain industry growth and impact FLT market share. Online industry players such as Webjet are able to enter the market with little capital and provide heightened price competition. Consumers will then be able to bypass travel agencies and book directly with the travel provider. Mitigation: FLT has acquired a number of brands such as StudentUniverse and BYOjet.com to ensure they maintain significant market share. Credit Risk CR1 – Credit ratings: FLT is exposed to credit risk through their forward foreign exchange contracts, their cash equivalent and available for sale assets. Mitigation: All FFX contracts and 87% of liquid assets are equivalent to S&P rating AA to A- (Appendix 21).
Corporate Social Responsibility Governance As an ASX listed company, FLT utilizes the corresponding corporate governance principles. While most principles are implemented, the company does not separate the remuneration and nomination committees as per Principle 2: ‘structure the board to add value’. Consequently, FLT has a rating of 4.49 out of 5 based on our estimations, so is bested by some competitors such as Corporate Travel Management, who have implemented all principles (Appendix 27). FLT meets all six OECD Corporate Governance Principles. Further, the Company shows growth in their environmental and social scores yet a decline in corporate governance as provided by the Thomson Reuters Asset4 database (Figure 45; Appendix 25). Board of Directors FLT’s independent directors only hold small amounts of shares, which could lead to a moral hazard, as they may not act in the shareholder’s best interest but rather in their own (Figure 43). Further, FLT has the smallest board of directors’ comparative to all peers worldwide, with only four members opposed to the international average of eight (Figure 44). Consequently, the Company does not have a separate audit and remuneration committee. Also, FLT does not have a female director. This has been historically proven as suboptimal, as females improve company performance, risk management and the quality of the decision making process. The absence of such diversification and gender equality can lead to one-sided decisions (Appendix 26). Corporate Social and Environmental Responsibility The Company founded the Flight Centre Foundation in 2008, supporting organisations engaged in movements for the environment, children, education and cancer support (Appendix 23). FLT provides employees the opportunity to volunteer their time to charities and community organisations while still being paid, and matches their donations dollar for dollar. The Company was recently appointed to the top ten ASX listed charity givers (Australian Charities Fund, 2016). The Foundation's charity partners are non-political and receive limited or no support from any government entity. Overall, donations to communities since its foundation amounted to $7.7 million at the end of the 2016 financial year.
Figure 41: Changes in Fair Value of Cash Flow Hedge ($'000)
Source: FLT Annual Report
Figure: 42: FLT Australian Revenue Proportion
Figure 43: Board of Directors
Board of Directors
Remuneration FY16 ($)
Ordinary shares
Graham Turner
675,000 15,244,487
Managing Director/CEO Gary Smith 201,218 15,000 N.E. Director Chairman John Eales 150,848 3,000 N.E. Director Robert Baker 150,503 2,500 N.E. Director
Source: FLT Annual Report Figure 44: Board Members
Source: Bloomberg
Figure 45. FLT ESG-Scores Asset4
Source: Thomson Reuters Database

11
tg2016 | CFA Institute Research Challenge
Appendix: 1 Force 1: Threat of New Entrants
1) Strict Regulatory and financial monitoring pressures on new agents
2) Existence of Economies of Scale and incumbent exclusive partnerships makes entry difficult and/or unprofitable
3) Rise of technology based travel advice allows low cost and innovative myriad micro-entrepreneurs to quickly gain market share. However online market heavily dominated.
4) Higher comparable Profit Margins for Online Travel Booking services
5) Large Network effect of current market leader (FLT) provides more tailored and cost effective service to clients.
Force 2: Threat of Substitute Products 1) Holds largest market share, however there are highly
substitutable branch and online travel booking services. 2) Other Flight Planning Services, particularly low-cost online travel booking services. However, buyers are still
dependent on a quality face-to-face tailored servicing. 3) Brandjacking: illegal use of popular brands by brandjackers to drive traffic to their sites without the permission of
brand owners. Potentially drawing away revenue and reputation of FLT. 4) Disintermediation: Especially on a domestic level, as Australian’s typically avoid travel agents when travelling
domestically. Additionally airlines are now directly approaching customers reducing potential commissions for FLT. Force 3: Bargaining Power of Buyers
1) Easily substitutable for other agents, and thus can negotiate price wars between agents. 2) Information Asymmetry: Lack of pricing information, especially on grounded services (hotels) between customers
and suppliers creates dependency of buyers. This due to the complexities of travel. Force 4: Bargaining Power of Suppliers/Sellers
1) High Threat of backward integration from Airline suppliers due to online pricing 2) Grounded travel Services (hotels) have little influence of FLT, as their revenues are highly dependent on the agency
relationship. 3) High Competition between suppliers, creates higher commission potential, and low bargaining power. 4) Enhanced Capacity and supply of available airline seats has enhanced the negotiating power for agents to receive
more commissions in order to fill the excess supply.
Force 5: Competition in the Industry 1) The Innovative Deployment of online travel agency models are showing higher levels of profitability than store-
based agents. 2) Enhanced online competition has forced FLT to enhance their online presence to keep market share. But, this has
cannibalised their store sales. 3) Still the market leader with economies of scale advantage. 4) Competition is fierce for offering low-cost travel services, hence marketing, brand awareness and online strategy
will give the competitive advantage.
Appendix 2: Current Issues affecting Travel Spread of the Zika Virus
Most Popular Travel Destinations for Australian Travellers (ABS Data)
New Zealand
Indonesia
USA
UK
Thailand
China
Singapore
Fiji
Japan
India
Supplier Power
Threat of New Entry
Competitive RivalryBuyer Power
Threat of Substitution

12
tg2016 | CFA Institute Research Challenge
Zika Virus The top 10 international destinations for Australian Travellers are shown in the above table. The transmission of the deadly Zika virus has been reported in 50% of the most popular travel destinations. Thus, it is expected that international travel demand will decrease through fear of contraction when travelling. Although it could be argued that the Zika virus would simply cause travellers to change their travel destination, this is not so easy. A key reason for these travel locations is their low-cost, and short distance from Australian Airports. The majority of south-east Asia has been infected by the Zika Virus, and thus the closest alternative is the European region or the northern parts of Asia. However, these are generally more expensive alternatives and thus may not be of adequate substitution for Australian Travellers. There is also the alternative for the Middle East, but travel to these countries has decreased by the effect of terrorist associations which are discussed next. Terrorism Since 2000, there has been a nine-fold increase in the number of deaths from terrorism. More recently the events in France, Bangladesh, turkey, United States as well as Australia highlight the increased threat at high-target areas. The Australian Government has listed mass gathering places such as hotels, markets, public transport, airports and tourist sites are a common target for terrorism activities. Australian’s are viewed by the levant (ISIL) as a key target for terrorist attacks. Even in cases where Australian’s weren’t necessarily the target, Australian citizens are still harmed by indiscriminate attacks. The immense fear from Australian Travellers particularly after events in 2016 has created a culture that hesitates to travel. A common trait is to cancel flights and travel after a major terrorism event, even if it is in another country. A survey in 2015 compiled by YouGov has shown that 10% of American travellers have cancelled their trip in response to terror, and 18% have delayed their travels. The world is now on red alert (figure 3), and we expect this adjustment to consumer preferences will cost the travel industry, and thus the travel agent industry. Brexit The effect on the UK leaving the European Union caused an immediate downturn on the world travel market. However the effects on airline share price, exchange rates and consumer confidence have already started to adjust from June. However the long-term effects are not fully realised yet. We expect the travel industry in Australia to have limited effect from the Brexit other than a decrease of UK tourists in Australia, which would be offset by an increase of Australian passengers to the UK. Although, once the Brexit is fully undertaken there may be a change in visa protocol which overrides the current no-visa policy for Australians holidaying in the UK and EU. Ultimately the Brexit has the biggest effect on the UK and European travel market. Thus with FLT deriving 13% of their profits and revenues from this continent, they are at risk of long-term revenue slowdowns. The International Air Transport Association has predicted by 2020 UK air passengers could be 3-5% lower due to a downturn in economic activity and fall in sterling. The Insurance Industry The insurance industry has faced rising costs in the form of reinsurance expenses over the past five years. An unusually high incidence of natural disasters and terrorist encounters around the world has led to a rise in the volume and value of insurance claims, forcing reinsurers to increase premiums (Wu, 2016). Ultimately, indirect costs of travel are increasing and this correlates with a decreased consumer confidence in travel due to the current aforementioned global risks. What was once seen as a safe and reliable place to travel, is now sacrificed due to the increasing threat of terrorism. Which has forced insurance companies to raise their risk-adjusted premiums. This problem also relates to FLT’s Travel insurance revenue stream. Thus enhanced insurance premiums are reducing the total Passenger outflow as well as the profit margins of Flight Centres Insurance Products. Source: Wu. T. (2016). IBISWorld Industry Report OD4216. Travel Insurance in Australia. Retrieved from http://www.ibisworld.com.au
Appendix 3: The Sharing Economy The Travel industry like most industries are rapidly expanding into peer-to-peer services. The low-cost options as well as direct exposure to locals is providing a more authentic and cost-saving experience compared to traditional Travel operations. Micro-entrepreneurs are offering alternatives in an array of travel sectors such as hotels (Airbnb), transportation (Uber, Lyft), dining (Eatwith, Feastly) and tours (Viator, Vayable). This growth is not just left for leisure travel, business travellers are increasingly adapting their Travel & Expenses (T&E) budget for more cost-effective sharing economy services.
0
10,000
20,000
30,000
40,000
50,000
1970
1975
1980
1985
1990
1995
2000
2005
2010
2015
Global Terrorism Threat
Number of IncidentsDeaths
Injuries
Source: Global Terrorism Database

13
tg2016 | CFA Institute Research Challenge
Holiday rental sites like Airbnb, are currently the main driver of growth in peer-to-peer travel services. HVS a global hospitality service has estimated that hotels are losing approximately $450 million in direct revenues per year due to the peer-to-peer economy. Additionally amongst a survey of 300 hotel groups, 70% predict Airbnb will pose a significant threat over the next 3 years. These effects have large impacts on the revenue of Flight Centre hotel commissions. Uber and other ride-share tech companies have now surpassed the total transactions for car rental companies, which were once a typically stable revenue stream for travel agencies. This has been caused by a fundamental change of business and leisure consumer preferences. The increased convenience of hailing and payment efficiencies is encouraging the switch to Uber. On a corporate level, ride-sharing is becoming the industry normality for business travel. Especially as Uber has released a business platform which allows employees to charge their rides directly to the corporation's expense account. This poses a large threat to the car-rental industry, and this is evident from large car rental companies like Hertz and Avis experiencing depreciating share value. However, there is positives for the industry. Rental car companies like Hertz have partnered with Uber to rent older cars to Uber drivers unable to afford a car. Thus Hertz can secure rentals on older cars they would typically sell. Although the additional revenues may offset some lost revenues caused by Uber, the same cannot be said for travel intermediaries. Flight Centre only receives commissions from their travel clients renting cars, thus the substitution for the more cost-effective Uber, will decrease the commission potential from the car rental revenue stream of FLT.
Sources: Certify. (2016). Certify SpendSmart Reports. The Changing State of Business Travel. Retrieved from https://www.certify.com/Infograph-SpendSmart-Full-Year-2015.aspx Goldman Sachs. (2016). 2,000 US Consumers – Goldman Sachs Global Investment Research. Retrieved from http://www.goldmansachs.com/what-we-do/research/ Kurtz. M. (2014). HVS Reports. In Focus: Airbnb’s Inroads into the Hotel Industry. Retrieved from http://www.hvs.com/article/6952/in-focus-airbnbs-inroads-into-the-hotel-industry/. Wu. T. (2016). IBISWorld Industry Report OD4216. Travel Insurance in Australia. Retrieved from http://www.ibisworld.com.au
8.10%
48.70%54.70%
37.30%
37.20%
14%
0.00%
10.00%
20.00%
30.00%
40.00%
50.00%
60.00%
Q1 2014 Q3 2014 Q1 2015 Q3 2015 Q1 2016
Market Share of Total Rides
Ride Hailing Car Rental Taxi
Source: Certify Report
0100200300400500600
2012 2013 2014 2015 2016 Est.
2017 Est.
2018 Est.
2019 Est.
2020 Est.
No
Nig
hts
Book
ed (M
il)
AirBnB Number of Nights Booked
Source: Cowen &Company ; Team Estimates
48.70%
37.30%
14%
Market Share of Total Rides (Q2 2016) (US)
Ride Hailing
Car Rental
Taxi
Source: Certify Report
20
40
60
80
Jul-15 Sep-15 Nov-15 Jan-16 Mar-16 May-16
Major Car Rental Companies: Stock Performance
Avis (CAR.US)
Hertz (HTZ.US)
Source: Bloomberg
51%
39%
10%
63%
30%
7%
0% 15% 30% 45% 60% 75%
Airbnb more satisfactory
Airbnb about the same
Airbnb less satisfactory
Airbnb Satisfaction Vs. Hotels
Leisure
Corporate
Source: Cowen &Company ; Goldman Sachs.

14
tg2016 | CFA Institute Research Challenge
Appendix 4: Travel Disintermediation The intensity of competition between intermediaries and direct suppliers is predicted to continue to intensify particularly in the airline and hotel sales sub-sectors. Hotels are constantly overwhelmed by the market power, and thus reliance on travel intermediaries. Thus Hotels have low negotiating power which corresponds to high commission for travel agents. Consequently, they have been active in their direct distribution with strategies like loyalty programs, social media interaction, metasearch channels and review sites. These strategies are working, and are expected to cause a comparable increase in their bookings through disintermediated marketing. Airlines are also in large competition and thus suffer from low negotiating power with travel agents. These non-negotiable costs from commissions can impose on profit expansion. Additionally, airlines have a problem marketing ancillary services with travel intermediation, as sales are typically a standard seat with no up-selling potential. Thus airlines are adapting online and re-utilising commission payments into offering customers increased flexibility, additional services as well as rewards for customers booking directly. Thus by 2018 we predict the inflow of customers for hotels and airlines will increasingly come from direct online bookings, with intermediation sales remaining stagnant. A study by the European Journal of Tourism Research was conducted to analyse the preferences out of 5, and thus favourability towards the disintermediation when making hotel reservations. The following key points were derived:
• The internet is preferred for convenience goods and low-involvement products, while traditional channels (travel agents) are preferred for complex products. But the complexities are progressively being relieved with further online innovation.
• Occasional travellers preference travel agent interaction, while frequent buyers prefer online booking services, thus disintermediation.
• Most respondents are open to further utilising direct online bookings if the process becomes more flexible, cost-effective, convenient and available 24/7. Which is continually coming to fruition.
Source: Source: Del Chiappa, G., Lorenzo-Romero, C., & Gallarza, M. G. (2015). Attitudes towards disintermediation in hotel reservations: Spanish travellers' profile. European Journal of Tourism Research, 9, 129-143.
Appendix 5: Big Data Analytics With a Targeting Advertising system, tourism operators can advertise directly to interested consumers with a history of relevant travel searches. As the ads are targeted, the cost are lower as there is no need for a
globalised mass marketing strategy. A once competitive advantage of selling contracts to large travel agencies able to mass market. Google is forever progressing to a complete online service. Therefore there recent induction into travel intermediation is in line with this objective. The launch of Google Hotel Finder and Google Flights although currently a slow-growing utility, still possesses potential with ever expanding service functionality. Thus Google, will shake-up the travel industry and play a large part in its future. Evident in countless industries Google has entered.
Facebook is the largest Social media platform, and is important for the travel industry in marketing to consumers. Facebook is a key tool in the inspiration
and willingness to travel due to the photo and experience sharing functionality. Thus it is beneficial to the travel industry. However, the capacity for hotels and airlines to directly market to their customers as well as create a continual customer engagement is stimulating disintermediation, leaving travel agents irrelevant. The ever expanding member growth is further incentivising travel operators to adopt this marketing strategy and this is represented by the increasing advertising revenues of Facebook.
TripAdvisor is the world’s largest online platform offering travel reviews on hotels, restaurants, attractions and destinations.
With 340 million unique monthly visitors interacting with 350 million reviews and opinions covering 6.5 million accommodations, restaurants and attractions, the site is a large data tool within the travel industry. With the review platform being the foundation of the site there is more reliable and transparent services directed to clients. Additionally the site offers a metasearch function which compares the prices of these travel options with the added benefit of reviews and opinions. The site has thus become a travel intermediary, with the utility of huge data analytics. The comparative metasearch function enhances the competitive landscape between airlines, hotels as well as internal intermediaries, ultimately reducing margins across the globalised industry. The
0.0
40.0
80.0
Billio
ns o
f $U
SD
Facebook Advertising Revenue
Source: Bloomberg
0.0
40.0
80.0
120.0Bi
llions
of $
USD
Google Advertising Revenue
Source: Bloomberg
0.0
1.0
2.0
3.0
Billio
ns o
f $U
SD
TripAdvisor Revenue Growth
Source: Bloomberg

15
tg2016 | CFA Institute Research Challenge
increased revenues of Trip Advisor is indicating these travel services are advertising more directly to their consumers online through a review-based large-data platform rather than using a travel agent.
Appendix 6: TTV and EBIT Breakdown
EBIT values are non-statutory and unreconciled. All figures are displayed in AUD
Appendix 7: Segment Margin Break-downs by country 2016: Displayed in Millions Australia US & Mexico Europe Rest of the World TTV 10,045.9 3,003.3 2,164.4 3,732.5 Revenue 1,323.6 333.2 331.4 467.8 Revenue Margin 13.2% 11.1% 15.3% 12.5% Statutory EBIT 280.0 9.0 50.3 38.9 Profit Margin 21.2% 2.7% 15.2% 8.3% 2015: Displayed in Millions Australia US & Mexico Europe Rest of the World TTV 9,561 2,454 1,893 3,413 Revenue 1,234.6 287.0 285.9 417.5 Revenue Margin 12.9% 11.7% 15.1% 12.2% Statutory EBIT 271.7 22.1 52.4 33.3 Profit Margin 22.0% 7.7% 18.3% 8.0%
Appendix 8: Financial Statement Forecasts
Total Transaction Value
($'000,000) FY 2012
FY 2013
FY 2014
FY 2015
FY 2016 2017F 2018F 2019F 2020F
TTV 13,238 14,359 16,049 17,598 19,305 20,608 21,879 23,095 24,234 Australia 7,845 8,516 9,116 9,561 10,046 10,347 10,606 10,818 10,980 Rest of the World 2,410 2,670 3,117 3,413 3,732 4,031 4,333 4,637 4,938 US & Mexico 1,684 1,727 2,089 2,454 3,003 3,454 3,937 4,449 4,983 United Kingdom & Europe 1,154 1,188 1,533 1,893 2,164 2,381 2,571 2,726 2,835 Other Segment 145 159 195 276 359 395 431 465 498 Income Statement ($'000,000) Revenue 1,786.8 1,950.5 2,212.4 2,367.4 2640.3 2877.8 3057.6 3221.5 3371.7 Australia 1,023 1,112 1,222 1,235 1,324 1,357 1,393 1,422 1,438 Margin 13.0% 13.1% 13.4% 12.9% 13.2% 13.1% 13.1% 13.1% 13.1%
Rest of the World 300 333 367 406 434 485 519 550 587

16
tg2016 | CFA Institute Research Challenge
Margin 12.4% 12.5% 11.8% 11.9% 11.6% 12.0% 12.0% 11.9% 11.9%
US & Mexico 204 208 247 287 333 406 460 517 577 Margin 12.1% 12.1% 11.8% 11.7% 11.1% 11.8% 11.7% 11.6% 11.6%
United Kingdom & Europe 157 174 224 268 314 341 372 393 407 Margin 13.6% 14.7% 14.6% 14.2% 14.5% 14.3% 14.5% 14.4% 14.4%
Other Segment 144 159 184 201 262 288 314 339 363 Margin 99.8% 99.9% 94.3% 72.7% 72.9% 73.0% 73.0% 73.0% 73.0%
Operating Expenses 1,460 1,565 1,820 1,955 2,231 2,421 2,599 2,749 2,890 Growth 7.2% 16.3% 7.4% 14.2% 11.26% 12.28% 11.27% 12.24% Salaries Wages and Employee Benefits 952 1,038 1,152 1,284 1,433 1,590 1,718 1,821 1,912
Growth 9.1% 11.0% 11.4% 11.6% 11.00% 8.00% 6.00% 5.00% Rental Expense 114 116 129 143 159 172 183 188 194 Growth 2.4% 10.6% 11.2% 10.7% 8.7% 6.0% 3.0% 3.0% Other 396 418 483 529 621 659 698 740 784 Growth 5.6% 15.8% 9.4% 17.5% 6.0% 6.0% 6.0% 6.0% EBITDA 327 386 392 413 409 456 459 473 482 EBITDA Margin 18.2% 19.8% 17.7% 17.4% 15.5% 15.9% 15.0% 14.7% 14.3%
Capital Expenditure 45 41 46 73 94 105 117 130 145 Growth 12.1% -8.5% 13.2% 56.9% 29.5% 11.5% 11.5% 11.5% 11.5% Dep & Amort 49 49 54 54 66 76 87 98 111 EBIT 277.8 336.4 338.2 358.8 343.0 380.2 372.2 374.2 371.0 Total Non-Operating Loss -13 -13 15 -7 -2 -4 -2 0 -3
Pretax Income 289.4 349.3 323.7 366.3 345.0 384.3 374.6 374.5 374.3 Income Tax Expense 90 103 117 110 100 112 109 109 109 Tax rate 31.21% 30.19% 30.76% 30.06% 29.13% 29.12% 29.12% 29.12% 29.12%
Net Income 200 246 207 257 245 272 265 265 265 Net profit Margin 11.20% 12.62% 9.35% 10.84% 9.26% 9.47% 8.68% 8.24% 7.87% Growth 23.0% -16.0% 24.0% -4.7% 11.4% -2.5% 0.0% -0.1%
Balance sheet
($'000,000) FY 2012
FY 2013
FY 2014
FY 2015
FY 2016 2017F 2018F 2019F 2020F
Total Current Assets 1,554 1,785 1,888 2,153 2,263 2,477 2,711 2,968 3,249 Total Noncurrent Assets 561 588 523 635 738 808 884 968 1,059 Total Assets 2,115 2,373 2,410 2,788 3,001 3,001 3,001 3,001 3,001 Total Current Liabilities 1,149 1,288 1,261 1,453 1,567 1,715 1,877 2,055 2,249 Total Noncurrent Liabilities 108 59 51 65 89 Total Liabilities 1,258 1,346 1,313 1,518 1,655 1,812 1,983 2,171 2,376 Total Equity 857 1,026 1,098 1,270 1,346 1,473 1,612 1,765 1,932 Total Liabilities & Equity 2,115 2,373 2,410 2,788 3,001 3,285 3,596 3,936 4,308
Assumptions and Notes
<1 139.17
1 to 5 337.04
6 to 7 178.08
Total Commitments 654.29PV of Commitments 528.72
Converting Lease agreements into Debt
Commitment ($'000,000)
2. Pre-tax cost of debt is used as discount rate to compute PV = 6%
1. Commitments between 1 to 5 and 6 to 7 years are averged in order to compute present value
3. Lease commitments are from end of 2016 Financial Year
Year Commitment ($'000,000)
Present Value ($'000,000)
1 139.167 131.292 84.261 74.993 84.261 70.754 84.261 66.745 84.261 62.966 89.0415 62.777 89.0415 59.22
Total 654.294 528.72Stated Operating income 241.2+ PV of Lease commitments 528.72* Pretax cost of debt 6%
= 272.92
Present Value of Future Lease Commitments

17
tg2016 | CFA Institute Research Challenge
Appendix 9: Du-Pont Breakdown
2012 2013 2014 2015 2016 Net Profit Margin 11.20% 12.62% 9.35% 10.84% 9.26% Asset Turnover 0.88x 0.87x 0.93x 0.91x 0.91x ROA 9.90% 10.97% 8.65% 9.87% 8.45% Asset / Equity 2.53x 2.38x 2.25x 2.20x 2.21x ROE 25.04% 26.13% 19.48% 21.67% 18.70%
Appendix 10: ROA Comparison
2012 2013 2014 2015 2016 FLIGHT CENTRE 9.9% 11.0% 8.7% 9.9% 8.5% CORPORATE TRAVEL MANAGEMENT
16.6% 11.3% 8.7% 7.7% 8.2%
WEBJET LTD 25.3% 6.9% 14.4% 10.5% 11.3% Average 17.3% 9.7% 10.6% 9.4% 9.3%
Appendix 11: Significant Valuation Variables Explanation 1. Capital Asset Pricing Model (CAPM). This report utilises CAPM to determine FLT’s cost of equity a) Beta. Regression of FLT’s weekly returns against ASX200 using 2-
year data. Adjusting the raw beta (0.892) to reflect future beta under assumption that security’s true beta will move towards to market average of 1 over time. Formula used in adjustment: 0.67 x Raw Beta + 0.33 x 1 = 0.928
b) Risk-Free Rate. 10-year Australia government bond yield was chosen as reference rate. Given that 10Y government bond yield has been decreasing dramatically and there are still more uncertainties on future cash rate, we decide to combine the average of past two-year and five-year average yield to represent future risk free rate.
10Y Australia Government Bond Historical Average Yield
2-Year Average 5-Year Average Weighted Yield 2.64% 3.26% 2.95%
Source: Bloomberg
c) Market Premium. The market Premium was extracted from ‘KPMG Valuation Practices Survey 2015’ and ‘Social Science Research Network’, all of which indicate a 6% premium of Australia equity market. Furthermore, potential volatility of market premium has been incorporated into sensitivity analysis.
Source: KPMG
2. Terminal Growth Rate
CAPM Explanation Beta 0.928 (a) Risk-Free Rate 2.95% (b) Market Premium 6.00% (c) Cost of Equity 8.51%
Source Social Science Research Network
18
tg2016 | CFA Institute Research Challenge
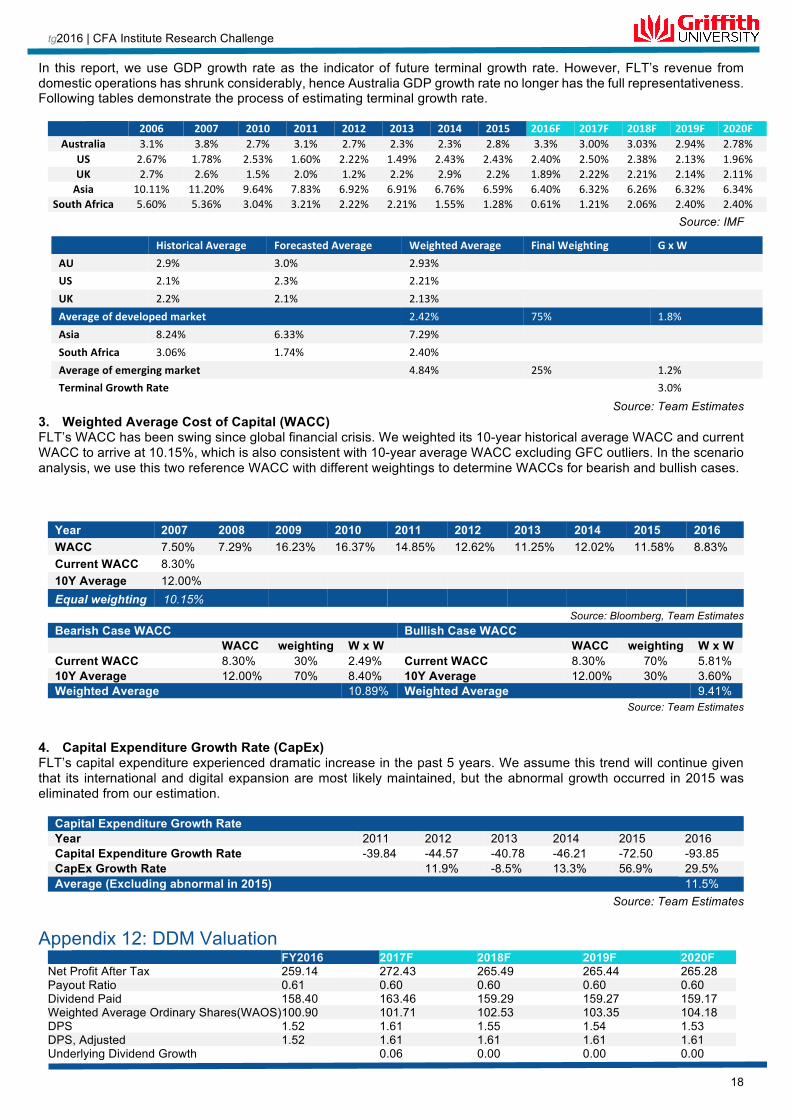
In this report, we use GDP growth rate as the indicator of future terminal growth rate. However, FLT’s revenue from domestic operations has shrunk considerably, hence Australia GDP growth rate no longer has the full representativeness. Following tables demonstrate the process of estimating terminal growth rate.
2006 2007 2010 2011 2012 2013 2014 2015 2016F 2017F 2018F 2019F 2020FAustralia 3.1% 3.8% 2.7% 3.1% 2.7% 2.3% 2.3% 2.8% 3.3% 3.00% 3.03% 2.94% 2.78%
US 2.67% 1.78% 2.53% 1.60% 2.22% 1.49% 2.43% 2.43% 2.40% 2.50% 2.38% 2.13% 1.96%UK 2.7% 2.6% 1.5% 2.0% 1.2% 2.2% 2.9% 2.2% 1.89% 2.22% 2.21% 2.14% 2.11%Asia 10.11% 11.20% 9.64% 7.83% 6.92% 6.91% 6.76% 6.59% 6.40% 6.32% 6.26% 6.32% 6.34%
SouthAfrica 5.60% 5.36% 3.04% 3.21% 2.22% 2.21% 1.55% 1.28% 0.61% 1.21% 2.06% 2.40% 2.40%Source: IMF
Source: Team Estimates 3. Weighted Average Cost of Capital (WACC) FLT’s WACC has been swing since global financial crisis. We weighted its 10-year historical average WACC and current WACC to arrive at 10.15%, which is also consistent with 10-year average WACC excluding GFC outliers. In the scenario analysis, we use this two reference WACC with different weightings to determine WACCs for bearish and bullish cases.
Year 2007 2008 2009 2010 2011 2012 2013 2014 2015 2016 WACC 7.50% 7.29% 16.23% 16.37% 14.85% 12.62% 11.25% 12.02% 11.58% 8.83% Current WACC 8.30% 10Y Average 12.00% Equal weighting 10.15%
Source: Bloomberg, Team Estimates Bearish Case WACC Bullish Case WACC WACC weighting W x W WACC weighting W x W Current WACC 8.30% 30% 2.49% Current WACC 8.30% 70% 5.81% 10Y Average 12.00% 70% 8.40% 10Y Average 12.00% 30% 3.60% Weighted Average 10.89% Weighted Average 9.41%
Source: Team Estimates
4. Capital Expenditure Growth Rate (CapEx) FLT’s capital expenditure experienced dramatic increase in the past 5 years. We assume this trend will continue given that its international and digital expansion are most likely maintained, but the abnormal growth occurred in 2015 was eliminated from our estimation.
Capital Expenditure Growth Rate Year 2011 2012 2013 2014 2015 2016 Capital Expenditure Growth Rate -39.84 -44.57 -40.78 -46.21 -72.50 -93.85 CapEx Growth Rate 11.9% -8.5% 13.3% 56.9% 29.5% Average (Excluding abnormal in 2015) 11.5%
Source: Team Estimates
Appendix 12: DDM Valuation FY2016 2017F 2018F 2019F 2020F Net Profit After Tax 259.14 272.43 265.49 265.44 265.28 Payout Ratio 0.61 0.60 0.60 0.60 0.60 Dividend Paid 158.40 163.46 159.29 159.27 159.17 Weighted Average Ordinary Shares(WAOS) 100.90 101.71 102.53 103.35 104.18 DPS 1.52 1.61 1.55 1.54 1.53 DPS, Adjusted 1.52 1.61 1.61 1.61 1.61 Underlying Dividend Growth 0.06 0.00 0.00 0.00
HistoricalAverage ForecastedAverage WeightedAverage FinalWeighting GxWAU 2.9% 3.0% 2.93% US 2.1% 2.3% 2.21% UK 2.2% 2.1% 2.13% Averageofdevelopedmarket 2.42% 75% 1.8%Asia 8.24% 6.33% 7.29% SouthAfrica 3.06% 1.74% 2.40% Averageofemergingmarket 4.84% 25% 1.2%TerminalGrowthRate 3.0%

19
tg2016 | CFA Institute Research Challenge
Terminal Value 30.08 Present Value 1.48 1.37 1.26 22.85 Intrinsic Value Intrinsic Value (2016/6/30) 26.96 Target Price(2016/08/30) 27.33 Current Price(2016/08/30) 36.85 Downside Potential -26%
Source: Team Estimates
Appendix 13: DCF Valuation Forecast FY2016 2017F 2018F 2019F 2020F Cash From Operating Activities Receipts From Customers 2680.2 2849.05 3028.54 3219.34 3422.16 Payments To Suppliers And Employees -2213.90 -2362.23 -2520.50 -2689.37 -2869.56 Cash Paid For Taxes -108.5 -121.23 -135.45 -151.34 -169.09 Cash Paid For Interest -28.85 -29.59 -30.35 -31.12 -31.92 Interest Received 27 27.46 27.94 28.42 28.91 Total Cash Flows From Operations 355.95 363.47 370.18 375.92 380.49 Free Cash Flow to Firm Year FY2016 2017F 2018F 2019F 2020F CFO 355.95 363.47 370.18 375.92 380.49 Interest Expense 28.85 29.59 30.35 31.12 31.92 (1-Tax) 0.71 0.71 0.71 0.71 0.71 CapEx 93.90 104.70 116.74 130.16 145.13 FCFF 282.50 279.74 274.95 267.82 257.98 Terminal Value 3716.41 Present Value 253.96 226.62 200.40 2699.81 Intrinsic Value Sum of PV 3380.78 Debt 76.80 Value of Equity 3303.98 WAOS 101.00 Intrinsic Value(2016/06/30) 32.71 Target Price (2016/08/31) 33.10 Current Price 36.85 Upside potential -10%
Source: Team Estimates & Bloomberg
Appendix 14: Multiple Pricing Model Assumptions
1. Weighting between domestic and International is based off forecasted proportion of FLT's domestic and international revenue 2. Forecasted peer multiples sourced from Bloomberg L.P, Earnings & Estimates 3. Historical date contains outliers and therefore medians are used to determine discounts 4. Target Price calculations are based off pro forma financial statements Earnings Multiplier (P/E) Ticker 2011 2012 2013 2014 2015 2016 2017F
Domestic Webjet Ltd WEB AU 13.84 17.97 50.92 9.98 13.62 25.88 24.27 Helloworld HLO AU 16.03 29.84 8.97 — — 162.11 25.29 Corporate Travel Management CTD AU 14.44 11.9 27.52 33.79 36.69 32.41 31.64
S&P/ASX 200 Consumer Discretionary Index
AS51COND Index 19.99 24.99 36.79 1,149.25 19.74 18.08
Industry Median for each year 15.235 17.97 26.255 33.79 36.69 29.145 24.78
Flight Centre Travel Group FLT AU 15.44 9.46 16.01 21.6 13.39 14.38 Historical Premium/Discount 1% -47% -39% -36% -64% -51%
Historical Median Discount -43%
International 2011 2012 2013 2014 2015 2016 2017F

20
tg2016 | CFA Institute Research Challenge
CTRIP CTRIP US 20.89 28.33 45.11 178.43 42.21 129.2 44.13 Priceline Group PCLN US 22.94 22.23 31.65 24.91 26.01 21.06 17.88 Expedia EXPE US 11.9 22.73 33.2 25.62 73.35 22.91 17.3 MSCI World Consumer Discretionary Index MXWO0CD 14.72 18.04 18.9 18.38 18.79 16.76 14.86
Industry Median for each year 17.805 22.48 32.425 25.265 34.11 21.985 17.59
Flight Centre Travel Group FLT AU 15.44 9.46 16.01 21.6 13.39 14.38 Historical Premium/Discount -13% -58% -51% -15% -61% -35%
Historical Median Discount -43% Target Price (P/E) 2017F Domestic International P/E peers median 24.78 17.59 Discount 43.19% 42.61% Target P/E 14.08 10.10 EPS 2.69 2.69 Target Price 37.94 27.21 Weighting 47% 53% Weighted Target price 32.27 EV/EBITDA Ticker 2011 2012 2013 2014 2015 2016 2017F Domestic Webjet Ltd WEB AU 8.64 11.05 23.74 5.86 6.4 20.84 15.24 Helloworld HLO AU 9.84 10.98 3.76 3.1 — — 7.62 Corporate Travel Management CTD AU 9.86 7.43 16.69 20.53 20.39 19.17 19.92
S&P Consumer Discretionary Index
AS51COND Index 9.11 36.95 12.93 14.37 17.95 14.49 13.32
Industry Median for each year 9.475 11.015 14.81 10.115 17.95 19.17 14.28
Flight Centre Travel Group 5.21 2.79 7.07 8.19 4.89 5.98 Historical Premium/Discount -45% -75% -52% -19% -73% -69%
Historical Median Discount -61% International Ticker 2011 2012 2013 2014 2015 2016 2017F CTRIP CTRIP US 13.88 22.48 35.64 1198 213.6 — 43.55 Priceline Group PCLN US 14.63 14.42 21.7 18.06 18.97 17.18 14.76 Expedia EXPE US 6.1 11.15 12.13 13.28 22.86 11.62 9.34 MSCI World Consumer Discretionary Index MXWO0CD 7.54 8.4 9.81 10.05 9.85 9.79 8.16
Industry Median for each year 10.71 12.785 16.915 15.67 20.915 11.62 12.05
Flight Centre Travel Group 5.21 2.79 7.07 8.19 4.89 5.98 Historical Premium/Discount -51% -78% -58% -48% -77% -49%
Historical Median Discount -55% Target Price (EV/EBITDA) 2017F Domestic International EVEBITA peers 14.28 12.05 Discount 60.53% 54.78% Target EV/EBITDA 5.64 5.45 EBITDA 456 456 Implied EV (BB) 2572 2487 less Debt 1812 1812 Add Cash & Cash Eq 1600 1600 Value of Equity 2360 2275 Outstanding Shares (million) 101 101
Target Price 23.35 22.51 Weighting 47% 53% Weighted Target price 22.90

21
tg2016 | CFA Institute Research Challenge
P/Sales Ticker 2011 2012 2013 2014 2015 2016 2017F Domestic Webjet Ltd WEB AU 3.53 4.29 4.6 2.02 2.04 3.79 4.71 Helloworld HLO AU 0.92 0.46 0.44 0.42 0.58 0.93 1.58 Corporate Travel Management CTD AU 2.57 2.15 4.02 4.88 4.89 5.24 5.37
S&P Consumer Discretionary Index
AS51COND Index 1 1.18 1.57 1.42 1.57 1.59 1.8
Industry Median for each year 1.785 1.665 2.795 1.72 1.805 2.69 3.255
Flight Centre Travel Group 1.18 1.06 2.02 2.02 1.45 1.21 Historical Premium/Discount -34% -36% -28% 17% -20% -55%
Historical Median Discount -30.81% International Ticker 2011 2012 2013 2014 2015 2016 2017F CTRIP CTRP US 6.06 4.65 7.34 5.27 8.33 7.77 5.73 Priceline Group PCLN US 5.33 5.88 8.71 7.06 7.04 6.64 5.73 Expedia EXPE US 1.14 2.05 1.97 1.91 2.42 1.92 1.68 MSCI World Consumer Discretionary Index MXWO0CD 0.73 0.84 1.15 1.14 1.19 1.08 1.03
Industry Median for each year 3.235 3.35 4.655 3.59 4.73 4.28 3.705
Flight Centre Travel Group 1.18 1.06 2.02 2.02 1.45 1.21 Historical Premium/Discount -64% -68% -57% -44% -69% -72%
Historical Median Discount -65.94% Target Price P/Sales In Millions except per share Domestic International P/Sale peers 3.26 3.71 Discount 31% 66% Target P/SALES 2.25 1.26 Sales 2878 2878 Outstanding Shares (millions) 101 101 Sales Per Share 28.47 28.47 Target Price 64.11 35.92 Weighting 47% 53% Weighted Target price 49.22
Appendix 15: Sensitivity Analysis
DDM Sensitivity Analysis DCF Sensitivity Analysis Scenario 1: Payout Ratio & Cost of Equity Scenario 1: CapEx Growth Rate & WACCRationals: Rationals
27.33 7.50% 8.00% 8.51% 9.00% 9.50% 33.10 10.5% 11.0% 11.5% 12.0% 12.5%50% 33.13 29.84 27.10 24.90 23.00 11.0% 30.10 29.84 29.58 29.31 29.04
Payout 55% 33.26 29.97 27.22 25.03 23.13 WACC 10.5% 32.12 31.84 31.56 31.27 30.9860% 33.38 30.09 27.35 25.15 23.25 10.2% 33.70 33.40 33.10 32.80 32.5065% 33.51 30.22 27.47 25.28 23.38 9.5% 37.08 36.75 36.42 36.09 35.7570% 33.64 30.34 27.60 25.40 23.50 9.0% 40.18 39.82 39.46 39.10 38.73
Scenario 2: Cost of Equity & Terminal Growth Rate Scenario 2: WACC & Long Term Growth Rationals:
2. Cost of equity could rise when company increase leverage
27.33 7.50% 8.00% 8.51% 9.00% 9.50% 33.10 2.5% 2.7% 3.0% 3.3% 3.5%2.5% 30.5 27.7 25.4 23.5 21.9 11.0% 28.19 28.73 29.58 30.50 31.15
Growth 2.7% 31.6 28.63 26.15 24.15 22.4 WACC 10.5% 29.96 30.57 31.56 32.62 33.383.0% 33.4 30.09 27.35 25.15 23.3 10.2% 31.34 32.02 33.10 34.29 35.143.3% 35.5 31.74 28.68 26.26 24.2 9.5% 34.26 35.08 36.42 37.89 38.953.5% 37.0 33.0 29.7 27.1 24.8 9.0% 36.90 37.88 39.46 41.21 42.48
Long Term Growth
CapEx Growth Cost of Equity
Cost of Equity
1. Terminal growth rate could be in line with historical sustainable growth rate
1. Company could change dividend payout ratio either upward or downward due to potential furure better off or distress
2. FLT's cost of equity could increase or decrease due to high volatility or depreciation of aggregate risk free rate
1. WACC could rise if either increase in cost of equity or substantial use of debt

22
tg2016 | CFA Institute Research Challenge
Appendix 16: Residual Income Valuation FY2016 2017F 2018F 2019F 2020F
Book Value 13.34 14.39 15.46 16.44 17.40 EPS 2.57 2.68 2.59 2.57 2.55 Dividend 1.52 1.61 1.61 1.61 1.61 Residual Income 1.43 1.45 1.27 1.17 1.07 Terminal value 19.92 PV 1.34 1.08 0.92 15.14 Intrinsic Value 31.82 Target Value 32.25 Current Price 36.85 Downside Potential 14%
Earnings Multiplier (P/E) EV/EBITDA Scenario 1: Discount & EPS Scenario 2: Debt & EBITDARationals: Rationals:
1.FLT can increase or decrease their debt levels 2. FLT's Earnings may increase or decrease
2. FLT's Earnings may increase or decreaseDomestic Domestic
Discount Debt37.94 39% 41% 43% 45% 48% 23.35 1631 1721 1812 1902 19932.43 36.74 35.44 34.14 32.85 31.55 411 22.60 21.70 20.80 19.91 19.01
2.56 38.78 37.41 36.04 34.67 33.30 434 23.87 22.97 22.08 21.18 20.28
EPS 2.69 40.82 39.38 37.94 36.50 35.05 EBITDA 456 25.14 24.24 23.35 22.45 21.56
2.83 42.86 41.35 39.83 38.32 36.81 479 26.41 25.52 24.62 23.72 22.83
2.96 44.90 43.32 41.73 40.15 38.56 502 27.68 26.79 25.89 25.00 24.10
International International Discount Debt
27.21 0.38 0.40 0.43 0.45 0.47 28.04 1631 1721 1812 1902 19932.43 26.30 25.39 24.48 23.58 22.67 411 26.82 25.92 25.03 24.13 23.23
2.56 27.76 26.80 25.85 24.89 23.93 434 28.32 27.43 26.53 25.64 24.74
EPS 2.69 29.23 28.22 27.21 26.20 25.19 EBITDA 456 29.83 28.93 28.04 27.14 26.25
2.83 30.69 29.63 28.57 27.51 26.44 479 31.34 30.44 29.55 28.65 27.75
2.96 32.15 31.04 29.93 28.81 27.70 502 32.84 31.95 31.05 30.16 29.26
1. Changes to industry comparables can cause the discount rate to increase further or become a premium
P/SalesScenario 3: Discount & SalesRationals:1.FLT can increase or decrease their debt levels 2.FLT's earnings can increase or decrease Domestic
Discount 64.11 27.73% 29.27% 30.81% 32.35% 33.89%2590 $60.27 $58.99 $57.70 $56.42 $55.132734 $63.62 $62.26 $60.91 $59.55 $58.19
Sales 2878 $66.97 $65.54 $64.11 $62.68 $61.263022 $70.32 $68.82 $67.32 $65.82 $64.323166 $73.66 $72.09 $70.52 $68.95 $67.38
International Discount
35.92 59.35% 62.64% 65.94% 69.24% 72.54%2590 38.59 35.46 32.33 29.20 26.072734 40.73 37.43 34.13 30.82 27.52
Sales 2878 42.88 39.40 35.92 32.45 28.973022 45.02 41.37 37.72 34.07 30.423166 47.17 43.34 39.51 35.69 31.86

23
tg2016 | CFA Institute Research Challenge
Appendix 17: Monte Carlo Simulation Variables Mean St.Dev Distribution Receipts 2017F 2849.053 85.47 Normal 2018F 3028.543 90.86 Normal 2019F 3219.341 96.58 Normal 2020F 3422.16 102.66 Normal Payments 2017F -2362.23 70.87 Normal 2018F -2520.5 75.62 Normal 2019F -2689.37 80.68 Normal 2020F -2869.56 86.09 Normal CapEx Growth Rate 11.50% 0.35% Normal WACC 10.15% 0.30% Normal LGR 3.00% 0.09% Normal
Appendix 18: Scenario Analysis
In addition to the scenario analysis for DCF, we further extend this DDM and RV (P/E) to arrive the weighted average intrinsic value under each case. The chart on the left briefly present the final aggregate scenario analysis
Bearish case has a value of AUD23.45, while bullish case has a price at AUD40.71. This represents 25% probability downside and 30% probability upside potential in accordance with Monte Carlo simulation distribution. However, overall, there would be more than 60% probability that the stock price will below current price.
Forecast: Target Price Statistics: Forecast values Trials 20,000 Base Case 33.1 Mean 33.61 Median 33.29 Standard Deviation 13.82 Variance 190.98 Skewness 0.1685
Kurtosis 2.84 Coeff. of Variation 0.4111

24
tg2016 | CFA Institute Research Challenge
Appendix 19: Australia Short-term Outbound Travel Modelling & Stock Return Volatility Modelling
1. Multiplicative SARIMA (Seasonal Autoregressive
Moving Average Model) FLT generates half of its annual revenue within Australia, on which outbound travel has a significant impact. Therefore we forecast the next 5-year outbound travel movement by using a multiplicative SARIMA to model this essential growth driver. The graph on the right demonstrates the trend of movements, and the table below illustrates the forecasted future outbound travel growth.
2. GARCH (Generalized Autoregressive Conditional
Heteroskedasticity) Although FLT is currently traded with a relatively lower beta, it is necessary to examine its time-varying volatility. By running GARCH model, we found the GARCH effect is significant indicating its time-varying riskiness. This result further support our argument relating to the potential up/downward cost of equity and WACC. The graph on right side presents the time-varying standard deviation of FLT’s stock since its IPO in comparison with historical return standard deviation
Appendix 20: Recent Acquisitions
Student Universe Overview Student Universe is currently the world’s leading travel booking service for students and youth. They offer special student online rate on flights, hotels and tours. The company is in association with dozens of World-class partners and over 70 Airlines. Student Universe launched in 2000 and has branches in Boston, London, Toronto, New York and the Philippines. Details of the Acquisition The Acquisition was made on the 21st December 2015 for $US 28 million after 18 months of negotiations. The agreement states that student universe will operate under the management of Flight Centres Americas President.
Acquisition SWOT Analysis Strengths Weaknesses
• Enhanced economies of scale power • Strong Online Platform • Leading youth travel booking service
• Intense online competition • Concentrated international competition • Heavily US Based • Overvalued acquisition
Opportunities Threats • Expand Online Presence • Access Niche Market (Key Demographic in
Travel) • Student and Youth Market is one of Travel’s
fastest growing sectors.
• Alternative Management leading to inefficiencies • Online Market Saturation • Unrecognized revenue expectations
Australia Short-term Outbound Travel (In Thousand) Year 2016 2017 2018 2019 2020 2021 Outbound 9685 10180 10823 11442 12068 12711 Growth Nil 5.1% 6.3% 5.7% 5.4% 5.3% 2016-2020 average 5.5%
Acquisitions Date Currency Price Stake Main Objective Student Universe 21st December US$ $28m 100% Expand Online Platform BYO Jet 21st December AUD$ $2.52+ 70% Entry into Low-cost Market Business Travel Development
14th March € Unknown 100% Expansion into European Market

25
tg2016 | CFA Institute Research Challenge
BYOJET Overview BYO Jet is an Australian family owned and operated travel agency that operates in Australia, New Zealand, Singapore and South Africa. Launch in 2010, the company is an online booking service which offers the lowest price guarantee on over 300 worldwide airlines. Details of the Acquisition Flight Centre Acquired a 70% stake of BYOjet on the 21st of December, after 3 months of negotiation. Flight Centre will pay BYOjet's parent company Professional Performance Systems $2.52 million upfront, plus a second payment for 70 per cent of 6 times the online business' 2016 financial year EBIT, less the original amount. There has also been placed call and put options, so that Flight Centre may control 100% of the company in 2018. Acquisition SWOT Analysis
Strengths Weaknesses • Enhanced economies of scale power • Decreased competition • Expanded employee base
• Undefined cost of Acquisition creates additional risk • Intense online competition • Concentrated international competition
Opportunities Threats • Financial options to acquire remaining 30% in
2018. • Expand Online Presence • Better exposure to Asia Markets • Exposure into low-cost market
• Alternative Management leading to inefficiencies • Enhanced EBIT of BYOjet may lead to expensive
acquisition • Online Market Saturation • Low-cost sales can cannibalise full service revenues.
Business Travel Development (FCM Travel Solutions) Overview Business Travel Development was a Dutch Travel Agency with a store-based operation. They specialised in full-service corporate travel for business clients. They have had a lengthy relationship with Flight Centre, having been the network’s independent licensee in the Netherlands since 2005. Details of the Acquisition Flight Centre has acquired 100% of Business Travel Development to continue operations in the Netherlands. The company originally named Business Travel Development will now operate under the Flight Centre corporate brand FCM Travel Solutions. This new business will be overseen by Flight Centres UK office. The cost of this acquisition is currently undisclosed. Acquisition SWOT Analysis
Strengths Weaknesses • New exposure into Europe • Larger Corporate travel coverage • Access to Netherlands Market • Low-risk and cost-effective entry into
Netherlands market
• New competition in unknown market • New branding has very low market awareness
Opportunities Threats • Better exposure to European Markets • Diversify Corporate Travel operations
• Undisclosed price is alarming to shareholder sentiment • Alternative Management leading to inefficiencies • Decreasing Corporate travel passenger growth
Acquisitions since 2010
Year Company Announced Total Value
Details Based in
2010 FCm Travel Solutions India Private Ltd
$15 million Purchase of remaining 44% interest India
Gapyear.com N/A Social Networking Business UK Garber’s Travel Services Inc $10.4 million Purchase of the remaining 74% interest in Garber to
the 26% FLT acquired in 2007; Corporate Travel Provider
US
2012 GoVolountouring Ltd A$130,000 Online community for volunteers, overseas teachers, and learners' abroad
Canada
2014 Travelplan Corp Ltd A$2.07 million Corporate travel business UK (Ireland) Top Deck Tours Ltd US$15.9 million Specialized in tour operations UK 2015 Koch Overseas de Mexico US$1.4 million Corporate travel management business Mexico Travelonomy ltd US$28 million Studentuniverse.com (Appendix 19) US

26
tg2016 | CFA Institute Research Challenge
Professional Performance Systems Pty Ltd
US$1.81 million Owners and operators of BYOjet Group which is an online travel agent specialized in ultra low cost airfares
AUS
2016 Professional Performance Systems Pty Ltd
US$0.5 million AUS
AVMIN Pty Ltd A$1.224 million Aircraft charter and logistics specialist AUS Worldwide Aviation Services
(WAS) A$297,000 Small corporate travel business MY
Maya Events A$361,000 Event management and production company HK Business Travel Development A$2.649 million Corporate Travel Agency based in the Netherlands NL
Source: Bloomberg and Company Information
Appendix 21: Credit Rating
Credit Rating - Cash, Cash Equivalents & AFS Financial Assets
2014 2015 2016 % $'000 % $'000 % $'000
At 30th June $'000 AA and Above 0.75% 9,756 0.00% 2 0.01% 189 AA to A- 91.25% 1,188,912 88.74% 1,289,933 87.14% 1,324,926 BBB+ to BBB 5.20% 67,724 8.94% 130,023 10.45% 158,828 Non-investment grade/ unrated 2.80% 36,530 2.32% 33,688 2.40% 36,566 Total 1,302,922 1,453,646 1,520,509
Appendix 22: Foreign Payable and Receivable Exposure
Trade and other payable 2014 2015 2016 Trade & Other
Receivables 2014 2015 2016
Australia 763,308 622,162 1,003,462 Australia 555183 648182 646677 Us Dollar 92,249 251,862 332146 US Dollar 15954 21816 20567 British Pounds 11,323 14,811 24519 British Pound 674 858 707 Euro 24,345 30,361 54284 Euro 1705 8468 1034 Thai Baht 17,974 19,408 798 Fijian Dollar 334 778 770 Fijian Dollar 23,709 25,706 20099 New Zealand 720 796 976 New Zealand Dollar 10,680 11,105 14232 Other 1902 2142 1445 Canadian Dollar 5,865 6,089 9097 Total Trade and other
receivables 576472 683040 672176 Hong Kong Dollar 4,270 4,226 4666 Singapore Dollar 8,491 9,261 9760 Total Foreign Trade
and other receivables
21289 34858 25499 United Arb Emirates Dirham 3,966 3,998 1325
Other 14,384 14,179 2706 Increase/Decrease of foreign exposure between 2014 & 2016 19.78%
Total Trade and other payable liabilities 980,564 1,013,168 1,477,094 Source:FlightCentreTravelGroup,2015 Total Foreign Trade and other Payable Liabilities
217,256 391,006 473,632
Increase/Decrease of foreign exposure between 2014 & 2016
118.01% 391,006
Appendix 23: FLT Foundation
Bush Heritage Australia is a non-profit organisation and is based in Melbourne, Australia. It does purchase land to manage wildlife reserves in perpetuity. In this way they do protect native plants and endangered species to ensure Australia’s biodiversity. The Cambodian Children’s Trust works to empower vulnerable children to escape the cycle of poverty through family preservation, education and deinstitutionalisation. It is a local NGO with more than 90% of the staff are from Cambodia. Foodbank is the largest non-profit organisation in Australia which distributed food to those who have difficulty purchasing enough food to avoid hunger. In 2015 they provided enough food for 40 million meals.

27
tg2016 | CFA Institute Research Challenge
The Kokoda Track Foundation is an aid organisation with the objective to improve the education, health and community services in Papa New Guinea. FLT supports the Education Bilong Olgeta Program contributing to teacher training and development, salaries and school resources for the Elementary School in Kokoda and the Kou Kou Pre-school. Redkite is an Australian cancer charity which provides support to children and young people with cancer. Furthermore, it supports their families and support networks. FLT assists Redkite’s Diagnosis Support Pack program which includes vital care and comfort as well as critical information to help along their journey. Furthermore, it provides information and age-appropriate items for teenagers and young adults up to the age of 24. Youngcare assists people between the ages of 18 to 65 with high care needs. Their programs focus on supporting young people with a disability by providing greater choice in housing and care options. FLT supports Youngcare Connect which is a free national information and support line which helps families navigate through the often confusing healthcare system.
Source: Company Data
Appendix 24: SWOT Analysis
The SWOT analysis was created to establish a better understanding of FLT's position within the travel industry. The analysis is built around a series of categories within each of the four SWOT sections and ranked on a scale to three according to their likely impact on FLT. Furthermore, this point system was used to determine the overall performance of FLT in the respective category which can be seen in the chart above.
Strengths Weaknesses • Diversification of services: complete and tailored experience
across different sectors like flights, hotels, cruises, currency, car rental, visa assistance
• Multiple segments: leisure, online, wholesale and corporate. • Expansive Growth Strategy • Large Market Share domestically • Existing distribution and sales networks
• Dependency on Australian Market: 74% of EBIT derived in AU
• Inefficient capital structure • Cost structure: High operating expenses • Insufficient online presence
Opportunities Threats • Strategic Acquisitions • Brand Strength: Allows for easier integration into the
online/physical business dynamic
• Diseases, Terrorism, Economic downturns • Brandjacking: online diversion of search traffic • Increasing online travel service competition • Disintermediation: especially domestically • Backward integration from Airline suppliers due to
online pricing • Small board and missing diversity
Total Strengths
Total Weaknesses
Total Opportunities
Total Threats 1015202530

28
tg2016 | CFA Institute Research Challenge
Appendix 25: Thomson Reuters Asset4 To investigate Flight Centre’s environmental, social and corporate governance performance, the Asset4 Database by Thomson Reuters was used. Moreover, local and international peers have been selected to evaluate FLT’s current performance.
Appendix 26: Gender diversity Studies from Desvaux & Devillard (2008), Campbell & Mínguez-Vera (2008), Smith, Smith, &Verner (2006) and TCAM (2009) showed, that gender diversity on company boards improve company performance. A study conducted by Joy, Carter, Wagner, & Narayanan, S. (2007) found out that companies with more women on board outperformed their rivals with 42% higher returns in sales, 66% higher returns on invested capital and 53% higher returns on equity. A gender-balanced board is furthermore more likely to pay attention to managing and controlling risk. (TCAM, 2009)
05
1015202530
2013 2014 2015
Environmental Score
0
1
2
3
Financial Resources
Reputation
Market Leadership
Economies of Scale
Competitive Pressure
Proprietary Technology
Marketing Effectiveness
Service Development
Management
Cost/Price
Strengths Rating
0102030405060
2013 2014 2015
Social Score
0102030405060
2013 2014 2015
Axis
Titl
e
Axis Title
Flight Centre Travel Group Ltd.Local Peers
International Peers
0
1
2
3Strategy
Profitability
Cost Structure
Marekting
Brand Image
Service Line
Internal Operations
Property Development
Management
Facilities
Weaknesses Rating
0
1
2
3Expansions
Target Market
Service Enhancement
Vertical Integration
Expansion of Facilities
Rival complacency
Market Growth
International Expansion
Regulatory Overhead
Prospects
Opportunities Rating
0
1
2
3Pricing
Substitute Products
Market Stagnation
Regulatory Overhead
Business Cycle
Buyer/Supplier Power
Market Requirements
Demographics
Entry Barriers
Technology
Threats Rating

29
tg2016 | CFA Institute Research Challenge
Other findings of relevant studies include: • Women control about 70% of global consumer spending. Consequently, women can provide a broader insight in
economic behaviour which leads to market share gains through the creation of services and products that are more respondent to costumer’s needs (Bloomberg, 2009).
• The quality of the corporate governance and ethical behaviour is high in companies with high shares of women on boards (Brown & Brown, 2002).
• The quality of decision making increases with diversity on boards as adding complementary knowledge, skills and experience means a gain of innovation and creativity (European Commission, 2012).
• The number of women as independent directors is positively associated with a firm’s CSR ratings (Hyun, Yang, & Jung, Hong, 2016).
Furthermore, the European commission made a legislative proposal in 2012 with the focus of improving the gender balance among non-executive directors of companies listed on stock exchanges and related measures (European Commission, 2012). The proposal targets companies to increase the number of board members of the under-represented sex to 40% by the 1st of January 2020. However, there will be no sanctions for not reaching this goal. Sources:
Bloomberg. (2009). Women Controlling Consumer Spending Sparse Among Central Bankers. Derived from http://www.bloomberg.com/news/2011-07-24/women-controlling-70-of-consumer-spending-sparse-in-central-bankers-club.html Brown, D. A., Brown, D. L., & Anastasopoulos, V. (2002). Women on boards: Not just the right thing... but the" bright" thing. Conference Board of Canada. Campbell, K., & Mínguez-Vera, A. (2008). Gender diversity in the boardroom and firm financial performance. Journal of business ethics, 83(3), 435-451. Desvaux, G., & Devillard, S. (2008). Women Matter 2: Female leadership, a competitive edge for the future. Study, McKinsey & Company, Paris. European Commission. (2012). Women in economic decision-making in the EU: Progress report Luxembourg. Hyun, E., Yang, D., Jung, H., & Hong, K. (2016). Women on boards and corporate social responsibility. Sustainability, 8(4), 300-300 Joy, L., Carter, N. M., Wagner, H. M., & Narayanan, S. (2007). The bottom line: Corporate performance and women’s representation on boards. Catalyst, 3, 619-625. Smith, N., Smith, V., & Verner, M. (2006). Do women in top management affect firm performance? A panel study of 2,500 Danish firms. International Journal of productivity and Performance management, 55(7), 569-593. TCAM. (2009). Diversity and Gender Balance in Britain plc: a study by TCAM in conjunction with The Observer and as part of the Good Companies Guide, London
Appendix 27: Corporate Governance The ASX corporate governance principles have been used to evaluate FLT’s corporate governance. The only principle FLT does not fulfil completely is principle 2 (a): structure the board to add value. The reason for this is that they have not a separated their nomination committee from their remuneration committee. By calculating corporate governance scores, different weightings were given to the ASX principles. Higher weightings were given for the composition of the board and a fair and responsible remuneration. To have a benchmark, FLT’s competitor Corporate Travel Management implements all eight ASX corporate governance principles and has therefore a higher score than FLT based on our estimations.
Board of Directors Career Background Independent Graham Turner Managing Director/CEO
Graham Turner is one of the Co-Founders of Flight Centre and was appointed as a member of the board at the IPO in 1995. He is the head of the company and in the role of the CEO for more than 20 years (with a pause in 2005). Additionally, he is the Director of the Australian Federation of Travel Agents Limited.
No
Gary Smith Non-Executive Director Chairman
Mr. Smith has been a Director of Flight Centre since 2007. He is the the founder and managing director of Tourism Leisure Corporation and in addition he manages the Kingfisher Bay Resort Group. From 2003 to 2007, Gary was an independent Director of the then publicly listed Tourism Company S8 Limited. In November 2012, he was appointed as a Non-Executive Director to the Board
Yes
ASX Principles Score Weightings FLT Corp. Travel
1. Lay solid foundations for management and oversight 5 5 12%
2. Structure the board to add value 2 5 17% 3. Act ethically and responsibly 5 5 12% 4. Safeguard integrity in corporate reporting 5 5 9%
5. Make timely and balanced disclosure 5 5 11%
6. Respect the rights of security holders 5 5 11% 7. Recognise and manage risk 5 5 13% 8. Remunerate fairly and responsibly 5 5 15%
Weighted final Score (out of five) 4.49 5

30
tg2016 | CFA Institute Research Challenge
of Michael Hill International Limited (MHI). He has an active role in the tourism and travel industry Australia’s for 20 years.
John Eales Non-Executive Director
Mr. Eales has been appointed to the board of Flight Centre in 2012. Furthermore, he currently sits on the board of GRM International, International Quarterback, Fuji Xerox – DMS and the Australian Rugby Union. He was the Co-founder of the Mettle Group in 2003, which was acquired by Chandler MacLeod in 2007.
Yes
Robert Baker Non-Executive Director
Robert Baker has been a non-executive Director of Flight Centre since 2013. He has had a successful career at PricewaterhouseCoopers (PwC) in leading their Office in Brisbane, providing professional services to clients and in being a member of PwC’s Board from 2008 to 2013. Mr. Baker is also in the function of the chairman in four other companies (John Goodman & Co Ltd since 2014, International Justice Fund Limited since 2015, Employment Office Australia Pty Ltd since 2015, Audit and Risk Committee of the Australian Catholic University Limited since 2015). Furthermore, Robert is an advisory board member and Audit and Risk Committee member for the Catholic Development Fund, Archdiocese of Sydney since 2011.
Yes
Cassandra Kelly* Non-Executive Director *resigned on the 2nd of August 2016
Cassandra Kelly has been appointed to the board of Flight Centre in 2014. She is the Co-founder and chair of corporate advisory Pottinger, deputy chairwoman of Treasury Corporation of Victoria, chairwoman of Allpress International and director of UNSW Foundation Limited. However, she resigned her role on the board of FLT effective with the 2 August 2016 due to her current living situation in the USA and because she wants to spend more time with her family.
Yes
Appendix 28: Insitutional Investors Top 20 Institutional Shareholders %
1. Gainsdale PTY LTD 15.06% 2. GeharPTY LTD 14.53% 3. James Management Services 12.87% 4. Bennelong Fund Management 6.11% 5. Airlie Fund Management Pty Ltd 4.78% 6. Vanguard Group 3.33% 7. Blackrock 3.19% 8. Friday Investments Pty Ltd 2.79% 9. Lazard Ltd 2.32%
10. Perennial Value Management 1.67% 11. Norges Bank 1.62% 12. Schroders Plc 1.52% 13. Investment Mutual Ltd 1.36% 14. FMR LLC 1.00% 15. Commonwealth Bank of Australia 0.96% 16. AQR Capital Management LLc 0.94% 17. State Street Corp 0.93% 18. Trinity Holding Ltd 0.74% 19. Morgan Stanlet 0.73% 20. Perpetual Ltd 0.62%
* Turner Graham 15.10%

Disclosures: Ownership and material conflicts of interest: The author(s), or a member of their household, of this report does not hold a financial interest in the securities of this company. The author(s), or a member of their household, of this report does not know of the existence of any conflicts of interest that might bias the content or publication of this report. Receipt of compensation: Compensation of the author(s) of this report is not based on investment banking revenue. Position as a officer or director: The author(s), or a member of their household, does not serve as an officer, director or advisory board member of the subject company. Market making: The author(s) does not act as a market maker in the subject company’s securities. Disclaimer: The information set forth herein has been obtained or derived from sources generally available to the public and believed by the author(s) to be reliable, but the author(s) does not make any representation or warranty, express or implied, as to its accuracy or completeness. The information is not intended to be used as the basis of any investment decisions by any person or entity. This information does not constitute investment advice, nor is it an offer or a solicitation of an offer to buy or sell any security. This report should not be considered to be a recommendation by any individual affiliated with CFA Society Sydney, CFA Institute or the CFA Institute Research Challenge with regard to this company’s stock.
CFA Institute Research Challenge