cf i stability under storage - tsapps at nist
TRANSCRIPT

NIST Technical Note 1452
CF3I Stability Under Storage
Michelle K. DonnellyRichard H. Harris
Jiann C. Yang

CF3I Stab
NIST Technical Note 1452 XXXX
ility Under StorageMichelle K. Donnelly
Richard H. HarrisJiann C. Yang
Building and Fire Research LaboratoryGaithersburg, MD 20899
January 2004
Phillip J. Bond,
National Institu
U.S. Department of CommerceDonald L. Evans, Secretary
Technology AdministrationUnder Secretary for Technology
te of Standards and TechnologyArden L. Bement, Jr., Director

Certain commercial entities, equipment, or materials may be identified in this document in order to describe an experimental procedure or concept adequately. Such
identification is not intended to imply recommendation or endorsement by the National Institute of Standards and Technology, nor is it intended to imply that the entities, materials, or equipment are necessarily the best available for the purpose.
For saInter
National Institute of Standards and Technology Technical Note 1452Natl. Inst. Stand. Technol. Tech. Note 1452, 40 pages (January 2004)
CODEN: NTNOEF
_____
le by the Superintendent of Dnet: bookstore.gpo.gov — Ph
Ma
U.S. GOVERNMENT PRINTING OFFICEWASHINGTON: 2004
____________________________________
ocuments, U.S. Government Printing Officeone: (202) 512-1800 — Fax: (202) 512-2250il: Stop SSOP, Washington, DC 20402-0001

ABSTRACT
This research investigates the stability of iodotrifluoromethane (CF3I) during storage. For CF3I to be used as a fire extinguishing agent, it must be able to be stored for long periods of time at high pressure in metal containers without degrading and losing its effectiveness. For these experiments, CF3I was placed into cylinders, along with various metal coupons. The cylinders were stored, some at elevated temperatures in an oven, for three years and then placed into storage at ambient temperature for five more years. Infrared spectroscopy was used to analyze the cylinder contents and concentrations at various times during the storage. This report focuses on changes to the cylinder contents during the final five year storage at ambient temperature by comparing spectra taken before storage to spectra collected after storage. Analyses of the spectra showed the volume fraction of CF3I agent remained stable to within the measurement uncertainty of ± 0.012 during the five years of storage at ambient temperature. For the infrared-active compounds that could be measured with the spectrometer, no new peaks developed in the spectra during ambient temperature storage. Evaluations of the other components showed that the amount of CO2 present in the cylinders decreased by 63 % or more and the amount of CF3H decreased by 29 % or more. No new F-alkene peaks developed, and changes to existing F-alkene peaks did not significantly affect the CF3I mass. The combination of both copper and elevated temperatures caused degradation of CF3I, and the presence of other metals affected the severity of this degradation. In particular, the combination of copper and Nitronic 40 resulted in a complete breakdown of the CF3I agent during storage at 150 ˚C. INTRODUCTION
This set of experiments is a continuation of an effort to determine the viability of using
alternative agents to extinguish fires. These alternative agents are needed because production of the commonly used halon 1301 was stopped in 1994 due to its adverse effects on the environment. Consequently, a number of replacement fire extinguishing agents were identified, including iodotrifluoromethane (CF3I). The Building and Fire Research Laboratory of the National Institute of Standards and Technology conducted a series of investigations to evaluate the performance and characteristics of CF3I and other replacement agents (Grosshandler et al., 1994, Gann, 1995). One important attribute that was investigated was the long-term stability of an agent during storage.
Halon 1301 remains stable and effective as a fire extinguishing agent during years of storage in metal containers. For CF3I to work effectively as an extinguishing agent, it must also remain stable under storage. If the agent reacts with impurities in the system or with the storage container, it may degrade and could become ineffective and/or produce toxic byproducts. A study of CF3I agent stability during storage was originally investigated in 1994 (Peacock et al., 1994) and continued in 1995 (Harris, 1995). The tests examine the compatibility of CF3I with a variety of metals that may be used to store agents. The four metals selected for these tests were C4130 alloy steel, Ti-15-3-3-3 titanium alloy, Nitronic 40 stainless steel, and Inconel 625 nickel alloy. All of the storage containers were stainless steel cylinders with a volume of one liter and lined with polytetrafluoroethylene. Metal coupons made from one of the four test metals listed above were inserted in the cylinders. The coupons had roughly the same surface area as the inside of the cylinders to simulate the agent contact area if the cylinder had been made of that metal. Some cylinders were left without metal coupons as a control. In addition to the test
1
metals, half of the cylinders received metal coupons made of copper (type CDA 110) as a variable, since copper reacts with iodine to form the nearly insoluble cuprous iodide. Another variable was the moisture content. While some cylinders contained only dry materials, some cylinders received 100 µL of distilled water. The cylinders were then filled with a mixture of CF3I vapor and nitrogen to a pressure of 4.13 MPa as measured at 23 ˚C. A detailed description of the cylinder preparation and filling is described in Harris (1995). During the initial testing period, from 1993 to 1997, each cylinder was stored at its assigned temperature of either 100 ˚C, 150 ˚C, or ambient temperature (approximately 23 ˚C).
The gas samples were evaluated using Fourier transform infrared (FTIR) spectroscopy. This process measures the ratio of the intensity of infrared radiation passed through a sample to the intensity of incident radiation as a function of frequency. The ratio is used to create an infrared spectrum of the sample, from which compounds and their concentrations may be determined. The FTIR analysis method was chosen as a simple and accurate way to evaluate the cylinder contents and determine if changes were occurring (Peacock et al., 1994).
A preliminary investigation was conducted to examine the results of storage for one month at elevated temperatures (Peacock et al., 1994). Based on these results, a long-term evaluation was initiated. Samples were prepared in February and March of 1994 and were tested on a continuous basis through May 1995. Many of the cylinders kept at either 100 ˚C or 150 ˚C during the initial storage showed decomposition of the CF3I agent (Harris, 1995). Most of these cylinders developed CF3H peaks and many developed peaks attributed to partially fluorinated alkenes (F-alkenes) during the heated storage (Harris, 1995).
In March 1997 interim measurements of these samples were made, but no formal report was issued at that time. Thus the salient findings are summarized here. The most notable result of the 1997 measurements was that the CF3I peak was completely gone for the cylinders stored at 150 ˚C and containing both copper and Nitronic 40 coupons. This is in contrast to the cylinder containing both copper and Nitronic 40 stored at ambient temperature, which showed no decrease in CF3I peak area. The 1997 results also showed the contents of cylinders stored at 150 ˚C and that contained only copper or copper plus Inconel 625 had CF3I peak decreases of 30 % to 60 %. The cylinders stored at 150 ˚C with copper and Ti-15-3-3-3, or copper and C4130 alloy steel had decreases in CF3I peak size of less than 15 %. The cylinders stored at 150 ˚C without copper, the cylinders stored at 100 ˚C, and the cylinders stored at ambient temperature did not experienced a measurable change in CF3I peak area.
After the 1997 interim measurements were collected, all of the cylinders were placed into storage at ambient temperature until the final testing in March 2002. This paper focuses on comparisons between the 1997 spectra and the 2002 spectra to identify if further changes occurred to the contents of the CF3I cylinders. EXPERIMENTAL PROCEDURE
For this investigation FTIR spectroscopy was again used to identify the type and concentration of components in the samples. In the previous investigation, a Galaxy Series 7000 FTIR Spectrometer was used to perform the analyses. Since those tests were completed, this spectrometer was damaged and no longer available, so a MIDAC Illuminator FTIR spectrometer was used for the data collection in March 2002. Because the infrared spectrum of a compound is assumed to be unique, spectral data collected with the two different FTIR spectrometers may be compared. The MIDAC instrument covers a spectral range from 600 cm-1 to 4500 cm-1.
2

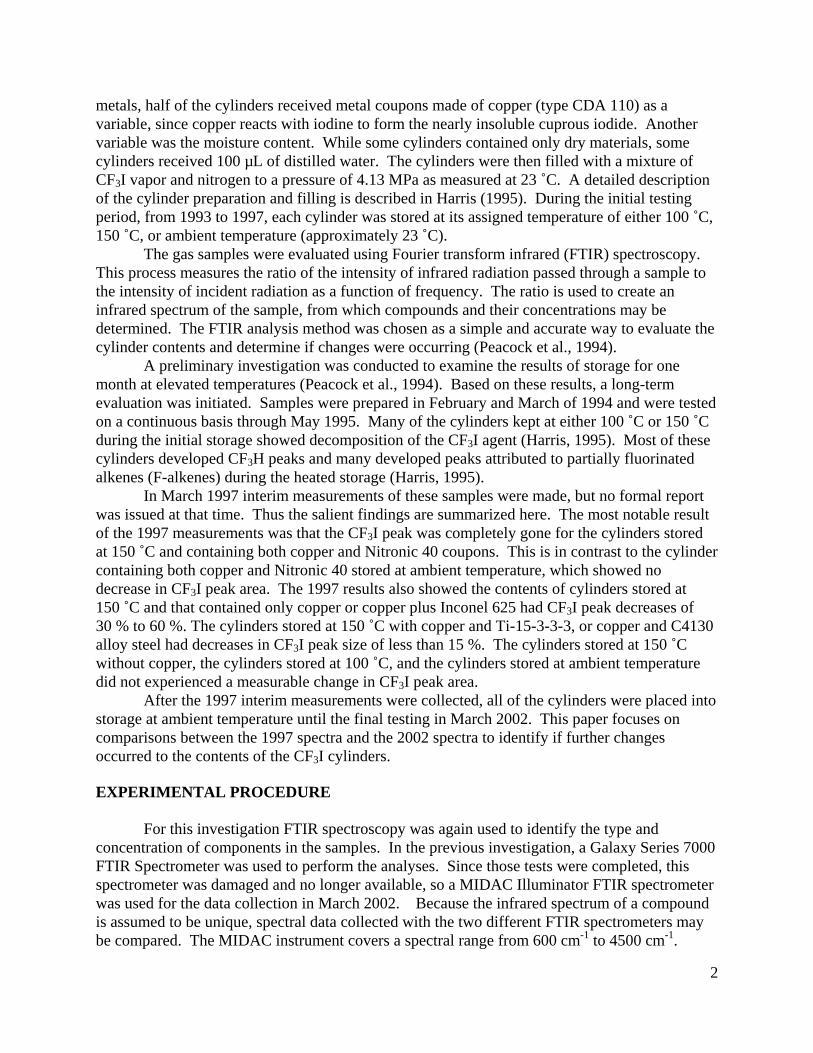
The samples were measured inside a 5.4 liter gas cell with a path length of 10 m. The cell was heated to 105 ˚C ± 1 ˚C. The procedure was to evacuate the gas cell and then place a small amount of the sample gas into the cell. The spectrometer was then used to send an infrared signal through the gas cell and a spectrum was obtained for each gas sample. A diagram of the testing assembly is shown in Figure 1. The cylinder to be tested was attached to the inlet valve of the cell. The cylinder valve was kept tightly closed while the inlet valve and micro-metering valve were opened to allow for evacuation of the tubing between the cylinder valve and the inlet valve. The gas cell and its connections were filled to atmospheric pressure with nitrogen and then evacuated to below 0.01 kPa three times. Following this, nitrogen was allowed to flow through the cell for 45 s to flush any residual contaminants. The gas cell system was again evacuated to below 0.01 kPa. The micro-metering valve was then closed while the inlet valve remained open. The cylinder valve was slowly opened and the micro-metering valve was used to control the flow of gas sample into the cell. The cell was filled to 0.05 kPa with the cylinder contents. One spectrum consisting of 128 scans was collected for the sample in the cell. The cell was then evacuated below 0.01 kPa, refilled to 0.05 kPa, and another spectrum collected. This was then repeated for a total of three fills at 0.05 kPa. These low-pressure fills flushed the cell with the actual sample to help obtain an accurate reading for the final spectrum. After the third scan at 0.05 kPa, more of the sample was added until the cell pressure reached 5.33 kPa. A final spectrum of 128 scans was taken for this higher fill amount. The cylinder valve was closed tightly and the cell system was then evacuated and flushed with nitrogen as described above to prepare for the next sample. To avoid any exposure to the cylinder contents, the connected cylinder cell was not removed until after nitrogen flushing was completed. A new cylinder was put in place, and the entire process, including cell evacuation and nitrogen flushing, was repeated for each cylinder.
During the 1997 testing phase of the project, some of the cylinder valves for the cylinders stored at elevated temperatures experienced failures and once opened, these valves could not be closed again. As a result, some or all of the agent inside was lost. Due to the loss of contents, and the inability to test some cylinders without the remainder of the contents escaping, these cylinders were not included in the 2002 study. Because of the many variables studied, there was enough overlapping information to draw conclusions from the cylinders that could be tested. In the final testing phase of the project in 2002, more cylinder valves experienced failure. The valve failures occurred after the samples were tested and did not result in further loss of data. All of the valve failures occurred in cylinders initially stored at 100 ˚C or 150 ˚C. The elevated temperatures may have exacerbated the incompatibility between CF3I and the valve elastomer and prevented the valves from resealing. Valve materials should be selected to avoid adverse reactions with CF3I and its products. Results of elastomer interactions with CF3I are reported in McKenna et al. (1995).
3
Pressure Gage
Gas Cell
Cylinder
Emitter
Nitrogen Inlet
FTIR Spectrometer
Detector
Vent to Hood
Vacuum Pump
Micro-metering Valve
Cylinder Valve
Inlet Valve Exit Valve
Figure 1. Diagram of the testing assembly.
4

RESULTS
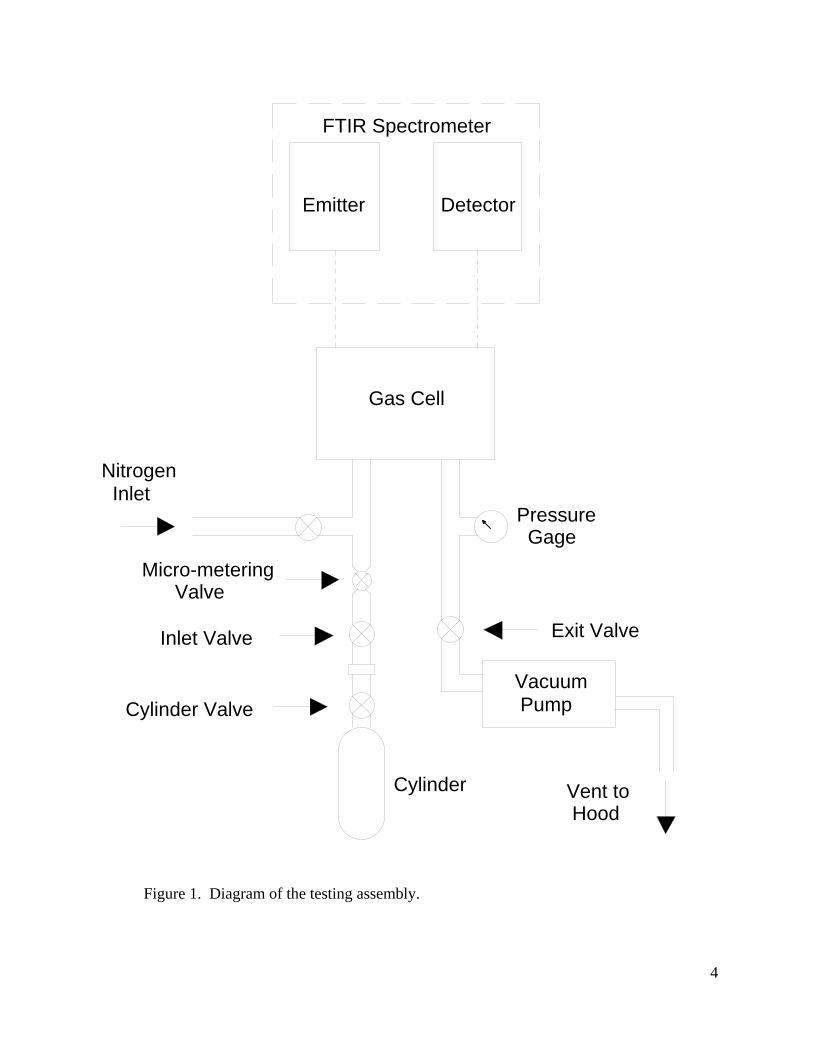
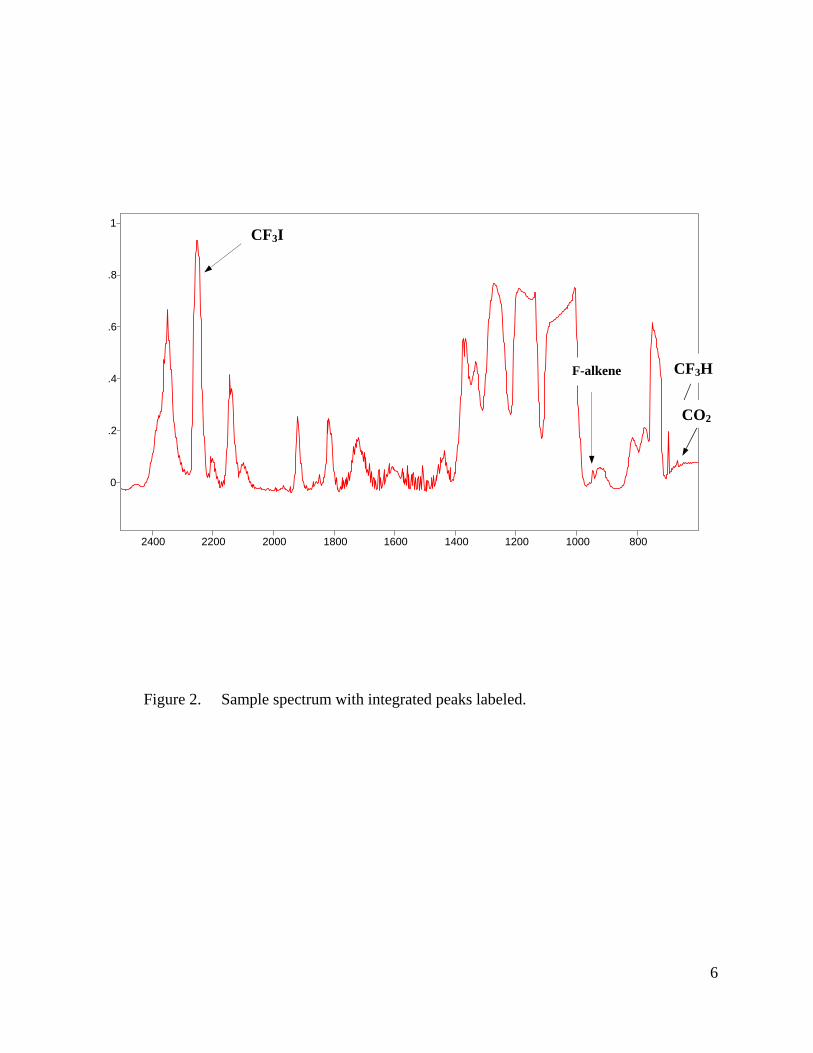
The main objective of this analysis is to determine if changes occurred to the contents of the CF3I cylinders during storage at ambient temperature by comparing the spectra collected in 2002 to the spectra measured in 1997 for each cylinder. Figure 2 shows a sample spectrum with the peaks that were integrated in this study labeled. Plots of all of the spectral files for scans conducted at 5.33 kPa are included in the Appendix. The spectra were also examined for new peaks, since the development of new peaks is a key factor to indicate chemical changes in the cylinder and determine if any degradation of the agent is occurring. Within the detection limits of the spectrometer, no new peaks were found to have developed during the storage at ambient temperature.
FTIR does have some limitations as to which species it can identify. In particular, three probable products of CF3I degradation, of interest because they are toxic, could not be detected in this study: I2 because it has no dipole moment, and HI and HF because they do not absorb in the wavenumber range of the spectrometer used here. CF3I agent peak
To analyze the spectra for changes to the CF3I agent, the representative peak centered at wavenumber 2250 cm-1 was integrated and this evaluation was used to compute the volume fraction of CF3I remaining in the cylinders. Table 1 lists the volume fraction of CF3I measured for each cylinder in 1997 and 2002 as well as the volume fraction change during that time period. For all of the cylinders, the measured change in volume fraction of the agent is slightly less than the combined standard uncertainty, uc, of ± 0.012 for the change in the volume fraction. Since the measured change in agent is within the uncertainty of the measurements, this indicates that no significant change occurred in any of the samples during the storage at ambient temperature. The overall standard deviation in the change of the volume fraction for all the cylinder measurements is 0.05. Other chemical peaks
In addition to the CF3I agent peak, three other chemical peaks were integrated. These are the same peaks examined in the previous analyses. CO2 and CF3H were identified by integrating the CO2 peak centered at 670 cm-1 and the CF3H peak centered at 700 cm-1. Both were impurities found in the initial cylinder fillings, and had increased during the earlier testing. A partially fluorinated alkene (F-alkene) peak centered at 950 cm-1 had emerged for some of the spectra during the previous phase of the project and was also evaluated. These three substances were present in small quantities, with CO2 and CF3H each less than 2 % of the volume, and the F-alkene less than 5 % of the volume as compared to the CF3I agent. For these three peaks, the volume fraction of the substance was not computed, only the relative change in the peak was measured. Table 2 shows the relative percent change in CO2, CF3H and F-alkene content from 1997 to 2002 for each of the cylinders. The combined standard uncertainty, uc, for the measured change is ± 11 % for each of the three.
5
0
.2
.4
.6
.8
1
2400 2200 2000 1800 1600 1400 1200 1000 800
F-alkene
CF3I
Figure 2. Sample spectrum with integrated peaks labeled.
CF3H
2
CO6

Table 1. CF3I Agent Volume Fraction
CF3I Volume Fraction Initial
Storage Temperature
(˚C)
Moisture Content
Metal
Coupons 1997 (uc ± 0.006)
2002 (uc ± 0.006)
Change (uc ± 0.012)
23 dry none 0.109 0.098 -0.011 23 dry Ti 0.110 0.102 -0.008 23 dry I625 0.113 0.106 -0.007 23 dry C4130 0.112 0.111 -0.001 23 dry Cu 0.109 0.103 -0.006 23 dry Cu/Nit 0.105 0.097 -0.008 23 dry Cu/Ti 0.108 0.108 0.000 23 dry Cu/I625 0.110 0.107 -0.003 23 dry Cu/C4130 0.107 0.104 -0.003 100 dry none 0.109 0.108 -0.001 100 wet none 0.104 0.103 -0.001 100 dry Ti 0.107 0.104 -0.003 100 dry I625 0.110 0.105 -0.005 100 dry C4130 0.110 0.099 -0.011 100 wet Cu 0.104 0.104 0.000 150 wet none 0.104 0.101 -0.003 150 wet Nit 0.109 0.101 -0.008 150 wet C4130 0.088 0.089 +0.001 150 dry Cu 0.059 0.064 +0.005 150 wet Cu 0.053 0.058 +0.005 150 wet Cu/Nit 0.000 0.000 0.000 150 dry Cu/Ti 0.086 0.084 -0.002 150 wet Cu/Ti 0.083 0.088 +0.005 150 dry Cu/I625 0.039 0.043 +0.004 150 wet Cu/I625 0.073 0.079 +0.006 150 wet Cu/C4130 0.095 0.090 -0.005
Key Nit : Nitronic 40 Ti : Ti-15-3-3-3 I625 : Inconel 625 C4130 : C4130 alloy steel Cu : Copper, type CDA 110
Overall Standard Deviation computed as: ∑1997
1tionVolumeFrac
ChangeN
= 0.05
7

Table 2. Changes in Peak Areas of Decomposition Products
Percent Change from 1997 to 2002
uc ± 11%
Initial
Storage Temperature
(˚C)
Moisture Content
Metal
Coupons
CO2
CF3H
F-alkene
23 dry none -100 -100 No peak 23 dry Ti -74 No peak No peak 23 dry I625 -86 -29 No peak 23 dry C4130 No peak No peak No peak 23 dry Cu -63 -100 No peak 23 dry Cu/Nit -100 -100 No peak 23 dry Cu/Ti -87 -100 No peak 23 dry Cu/I625 -91 -31 No peak 23 dry Cu/C4130 No peak No peak No peak 100 dry none -93 -30 +21 100 wet none -92 -37 -26 100 dry Ti -89 -31 +18 100 dry I625 -75 No peak +14 100 dry C4130 -83 No peak 0 100 wet Cu -90 -4 -45 150 wet none -92 -49 +17 150 wet Nit -90 -39 +16 150 wet C4130 -97 -68 +3 150 dry Cu -100 -84 -100 150 wet Cu -100 -70 No peak 150 wet Cu/Nit -100 -81 No peak 150 dry Cu/Ti -100 -78 No peak 150 wet Cu/Ti -97 -64 +15 150 dry Cu/I625 -100 -77 No peak 150 wet Cu/I625 -100 -72 +27 150 wet Cu/C4130 -95 -62 +2
Key Nit : Nitronic 40 Ti : Ti-15-3-3-3 I625 : Inconel 625 C4130 : C4130 alloy steel Cu : Copper, type CDA 110
8

CO2 peak CO2 was one of the impurities measured in small concentrations (26 to 460 µL/L) when
the cylinders were initially filled with the CF3I agent (Harris, 1995). During the testing through 1997, the CO2 peak centered at 670 cm-1 had increased for all of the cylinders stored at elevated temperatures, while there was no measurable change to the cylinders at ambient temperature. In the most recent analysis of the CO2 peak, which looked at changes during the ambient storage from 1997 to 2002, there was a significant decrease in peak area for all of the cylinders. The results as reported in Table 2 show that almost all of the CO2 that had previously existed was no longer present. For more than half of the cylinders the peak was reduced by at least 90 % and for a third of the cylinders, the CO2 peak was completely gone. These peak decreases are much greater than the standard uncertainty of ± 11 % and represent significant reduction of the amount of CO2. These results indicate a loss in both the initial CO2 impurities and the additional CO2 that had formed. The CO2 may have adhered to the walls of the cylinder and/or it may have dissolved in the moisture in the cylinders. CF3H peak
For the cylinders that were originally exposed to elevated temperatures, the amount of the CF3H impurity had increased during the heated storage, as indicated by an increase in the peak centered at 700 cm-1. The increase in CF3H was the result of the weak C-I bond in the CF3I breaking at elevated temperatures and CF3 recombining with H to form CF3H. Comparisons of the 1997 spectra with the 2002 spectra show significant decreases to the CF3H peaks during the storage at room temperature. The CF3H peak decreased by more than 39 % for all of the cylinders originally kept at 150 ˚C. This peak also decreased by 30 % to 37 % in three of the four cylinders originally at 100 ˚C that had CF3H peaks. The two cylinders continuously stored at ambient temperature and containing Inconel 625 (one with only Inconel 625 and the other with both Inconel 625 and copper) behaved like the cylinders stored initially at 100 ˚C. They developed small CF3H peaks during the initial testing and these peaks decreased by about 30 % during the ambient storage. The remainder of the cylinders stored exclusively at ambient temperature did not have a CF3H peak in 1997 and did not ever develop a CF3H peak.
One cylinder stored originally at 100 ˚C and containing copper, had a negligible change to the CF3H peak. In all other cases the CF3H peaks that were present had significant decreases of 29 % or more compared to the combined standard uncertainty of ± 11 % during the five year ambient temperature storage. F-alkene peak
The F-alkene peak centered at 950 cm-1 was the only new peak that had emerged during the previous testing cycles. It is located in the region of C=C bond stretch, and presumably it reflected condensation of CF3I molecules. The peak is an unresolved combination of contributions from one or more fluorinated alkenes. No attempt was made to positively identify the alkenes. While no exact quantitative measurement of concentration was possible, the lack of substantial change in the area of the CF3I peak indicated that the F-alkene concentration was no more than 5 % of that of CF3I. The F-alkene peak only developed in some of the heated cylinders. None of the cylinders stored constantly at ambient temperature showed an F-alkene peak in 1997, and none of them developed an F-alkene peak by 2002. In addition, four of the cylinders stored initially at 150 ˚C had no F-alkene peak in either 1997 or 2002.
9
Table 2 lists the relative percent change from 1997 to 2002 for the cylinders with an F-alkene peak. Most of these peaks had increases of less than 20 % during the storage at ambient temperature. These peak changes barely exceed the combined standard uncertainty of ± 11 % for these measurements. Only three of the cylinders showed decreases to the F-alkene peak. For the cylinder with copper and moisture originally at 100 ˚C the peak decreased by 45 %, while the F-alkene peak that developed in 1997 for the dry copper containing cylinder originally at 150 ˚C was completely gone in 2002. The cylinder containing only CF3I and moisture (no metals) originally stored at 100 ˚C showed a 26 % decrease in F-alkene peak area from 1997 to 2002. CONCLUSIONS During the 5-year ambient temperatures storage period from 1997-2002:
• The CF3I agent remained stable to within the measurement uncertainty of a volume fraction of ± 0.012. (Note that the combination of elevated temperatures and copper had already caused serious degradation of the CF3I in some vessels during the earlier 36 months of storage.)
• No new peaks in the spectra were observed. • CO2 decreased significantly for all of the cylinders. • For the cylinders that had a CF3H impurity peak, it decreased by 30 % or more. • Some existing F-alkene peaks had small increases and others had decreases, but
these changes did not significantly affect the CF3I agent mass. ACKNOWLEDGMENTS This research is part of the Department of Defense’s Next Generation Fire Suppression Technology Program, funded by the DoD Strategic Environmental Research and Development Program (SERDP). The authors would like to thank Dr. Marc Nyden for his assistance with the spectrometer operation, data analysis, and his expert advice regarding the project.
10
REFERENCES Gann, R. G., Editor, Fire Suppression System Performance of Alternative Agents in Aircraft
Engine and Dry Bay Laboratory Simulations. Volumes 1-2. National Institute of Standards and Technology, Gaithersburg, MD. NIST SP 890; 789 pp, November 1995.
Grosshandler, W. L., Gann, R. G., Pitts, W. M., Evaluation of Alternative In-Flight Fire
Suppressants for Full-Scale Testing in Simulated Aircraft Engine Nacelles and Dry Bays. National Institute of Standards and Technology, Gaithersburg, MD. NIST SP 861; 859 pp, April 1994. Grosshandler, W. L.; Gann, R. G.; Pitts, W. M., Editors, 1994.
Harris, R. H., Jr., “Agent Stability Under Storage.” Fire Suppression System Performance of Alternative Agents in Aircraft Engine and Dry Bay Laboratory Simulations. National Institute of Standards and Technology, Gaithersburg, MD. NIST SP 890; November 1995. Gann, R. G., Editor, Volume 1, Section 7, 249-406 pp, 1995.
McKenna, G. B., Horkay, F., Verdier, P. H., Waldron, W. K., Jr., “Interactions of Agents with
Elastomers and Lubricants.” Fire Suppression System Performance of Alternative Agents in Aircraft Engine and Dry Bay Laboratory Simulations. National Institute of Standards and Technology, Gaithersburg, MD. NIST SP 890; November 1995. Gann, R. G., Editor, Volume 1, Section 6, 201-247 pp, 1995.
Peacock, R. D., Cleary, T. G., Harris, R. H., Jr., “Agent Stability Under Storage and Discharge
Residue.” Evaluation of Alternative In-Flight Fire Suppressants for Full-Scale Testing in Simulated Aircraft Engine Nacelles and Dry Bays. National Institute of Standards and Technology, Gaithersburg, MD. NIST SP 861; April 1994. Grosshandler, W. L., Gann, R. G., Pitts, W. M., Editors, Section 6, 643-668 pp, 1994.
11

12
APPENDIX: FTIR Spectra

0
.2
.4
.6
.8
Abs
orba
nce
4000 3000 2000 1000 Wavenumber (cm-1)
2002
0
.2
.4
.6
.8
Abs
orba
nce
4000 3000 2000 1000 Wavenumber (cm-1)
1997
Appendix FTIR Spectrum 1 Initial storage temperature: 23 °C
Metal coupon: none Moisture added :no
13

0
.2
.4
.6
.8
Abs
orba
nce
4000 3000 2000 1000 Wavenumber (cm-1)
2002
0
.2
.4
.6
.8
Abs
orba
nce
4000 3000 2000 1000 Wavenumber (cm-1)
1997
Appendix FTIR Spectrum 2 Initial storage temperature: 23 °C
Metal coupon: Ti-15-3-3-3 Moisture added :no
14

0
.2
.4
.6
.8
Abs
orba
nce
4000 3000 2000 1000 Wavenumber (cm-1)
2002
0
.2
.4
.6
.8
Abs
orba
nce
4000 3000 2000 1000 Wavenumber (cm-1)
1997
Appendix FTIR Spectrum 3 Initial storage temperature: 23 °C
Metal coupon: Inconel 625 Moisture added :no
15
0
.2
.4
.6
.8
Abs
orba
nce
4000 3000 2000 1000 Wavenumber (cm-1)
2002
0
.2
.4
.6
.8
Abs
orba
nce
4000 3000 2000 1000 Wavenumber (cm-1)
1997
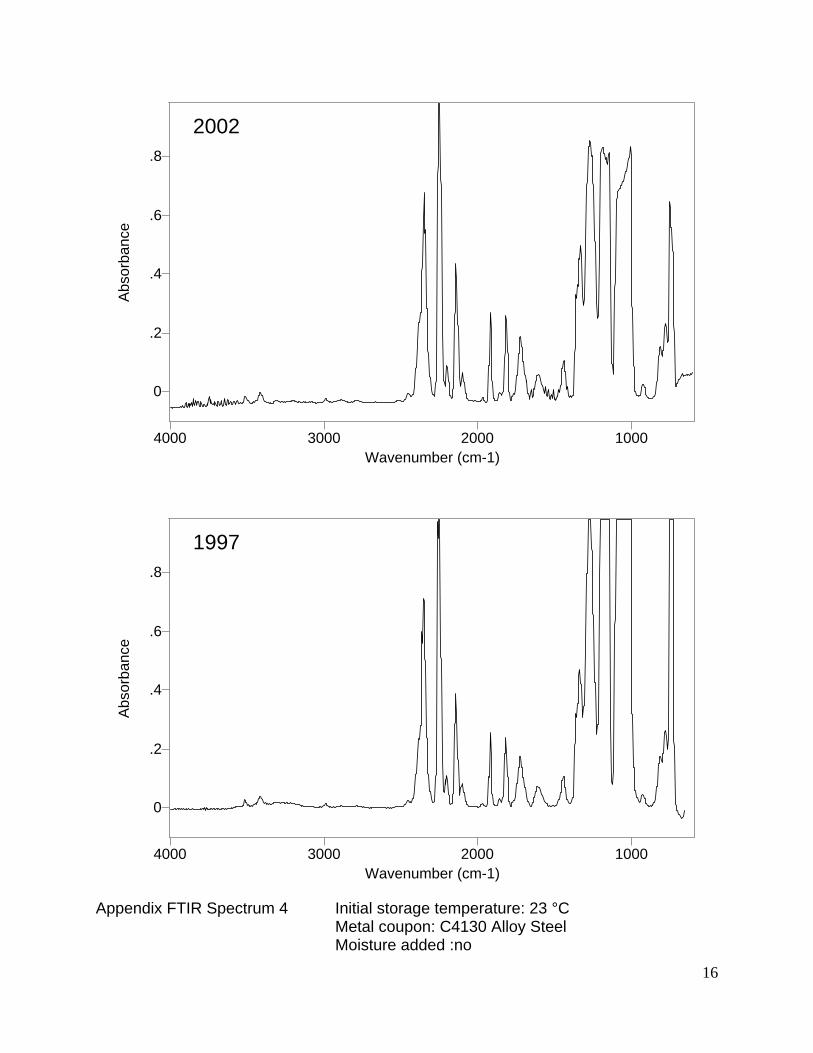
Appendix FTIR Spectrum 4 Initial storage temperature: 23 °C
Metal coupon: C4130 Alloy Steel Moisture added :no
16
0
.2
.4
.6
.8
Abs
orba
nce
4000 3000 2000 1000 Wavenumber (cm-1)
2002
0
.2
.4
.6
.8
Abs
orba
nce
4000 3000 2000 1000 Wavenumber (cm-1)
1997
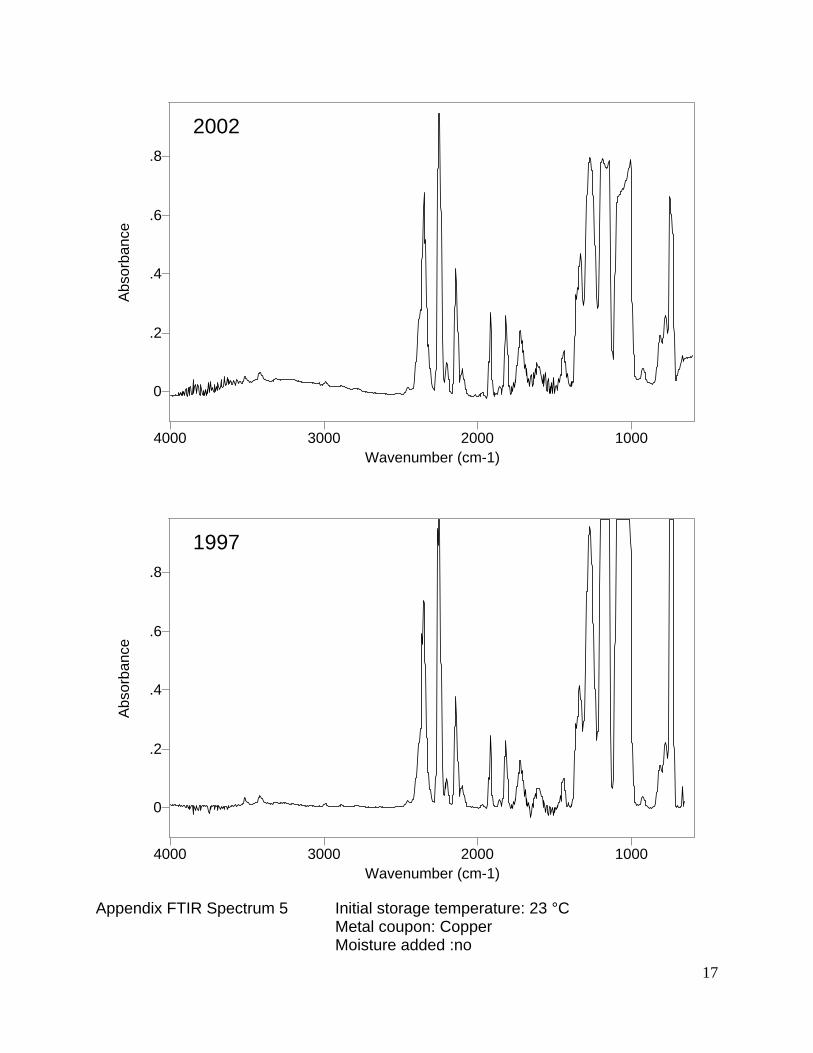
Appendix FTIR Spectrum 5 Initial storage temperature: 23 °C
Metal coupon: Copper Moisture added :no
17
0
.2
.4
.6
.8
Abs
orba
nce
4000 3000 2000 1000 Wavenumber (cm-1)
2002
0
.2
.4
.6
.8
Abs
orba
nce
4000 3000 2000 1000 Wavenumber (cm-1)
1997
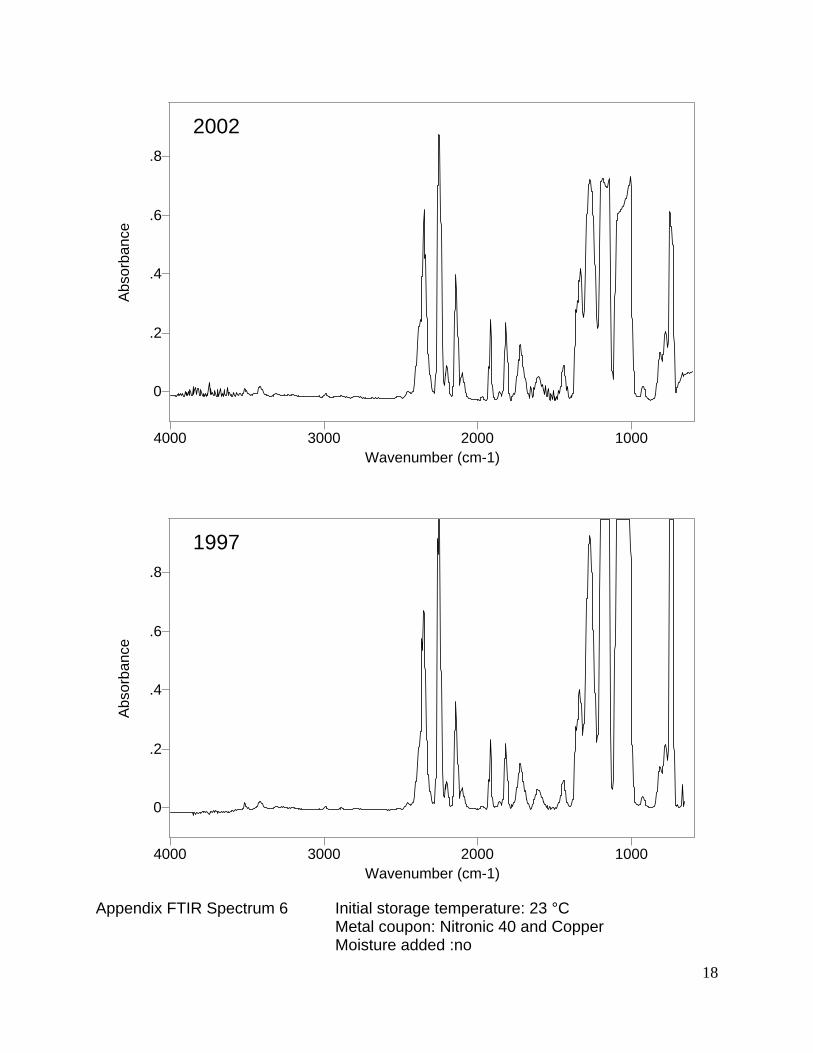
Appendix FTIR Spectrum 6 Initial storage temperature: 23 °C
Metal coupon: Nitronic 40 and Copper Moisture added :no
18

0
.2
.4
.6
.8
Abs
orba
nce
4000 3000 2000 1000 Wavenumber (cm-1)
2002
0
.2
.4
.6
.8
Abs
orba
nce
4000 3000 2000 1000 Wavenumber (cm-1)
1997
Appendix FTIR Spectrum 7 Initial storage temperature: 23 °C
Metal coupon: Ti-15-3-3-3 and Copper Moisture added :no
19
0
.2
.4
.6
.8
Abs
orba
nce
4000 3000 2000 1000 Wavenumber (cm-1)
2002
0
.2
.4
.6
.8
Abs
orba
nce
4000 3000 2000 1000 Wavenumber (cm-1)
1997
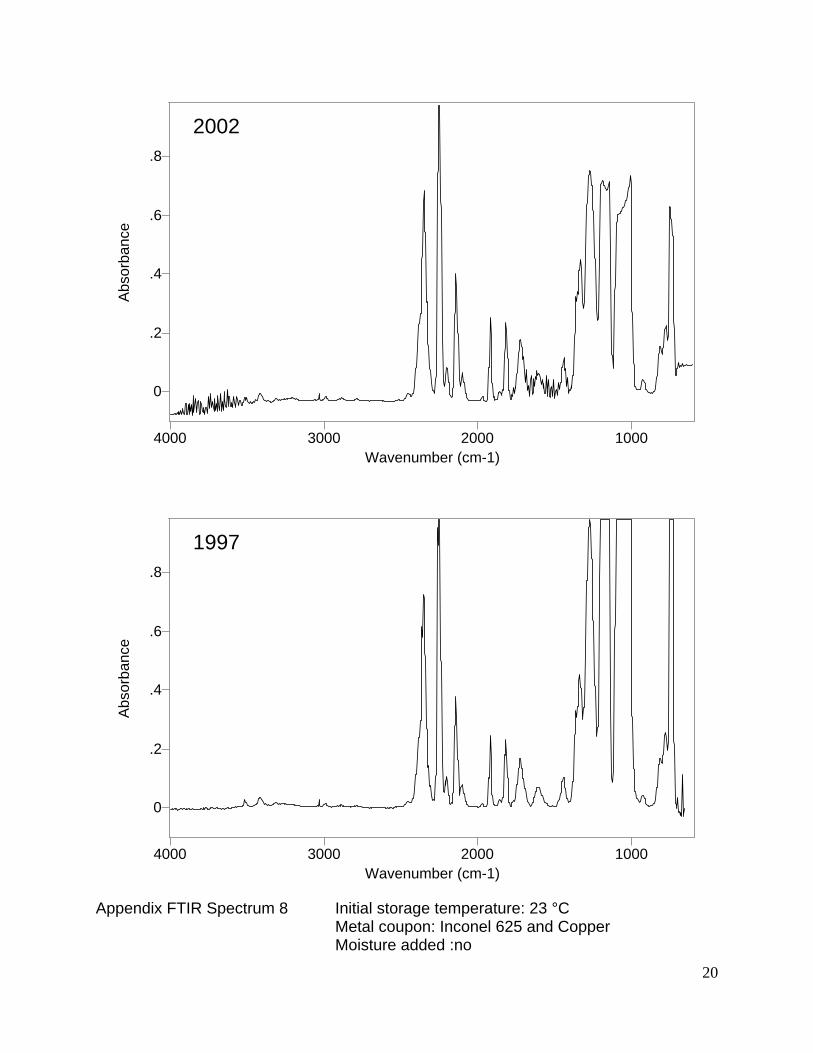
Appendix FTIR Spectrum 8 Initial storage temperature: 23 °C
Metal coupon: Inconel 625 and Copper Moisture added :no
20

0
.2
.4
.6
.8
Abs
orba
nce
4000 3000 2000 1000 Wavenumber (cm-1)
2002
0
.2
.4
.6
.8
Abs
orba
nce
4000 3000 2000 1000 Wavenumber (cm-1)
1997
Appendix FTIR Spectrum 9 Initial storage temperature: 23 °C
Metal coupon: C4130 Alloy Steel and Copper Moisture added :no
21
0
.2
.4
.6
.8
Abs
orba
nce
4000 3000 2000 1000 Wavenumber (cm-1)
2002
0
.2
.4
.6
.8
Abs
orba
nce
4000 3000 2000 1000 Wavenumber (cm-1)
1997
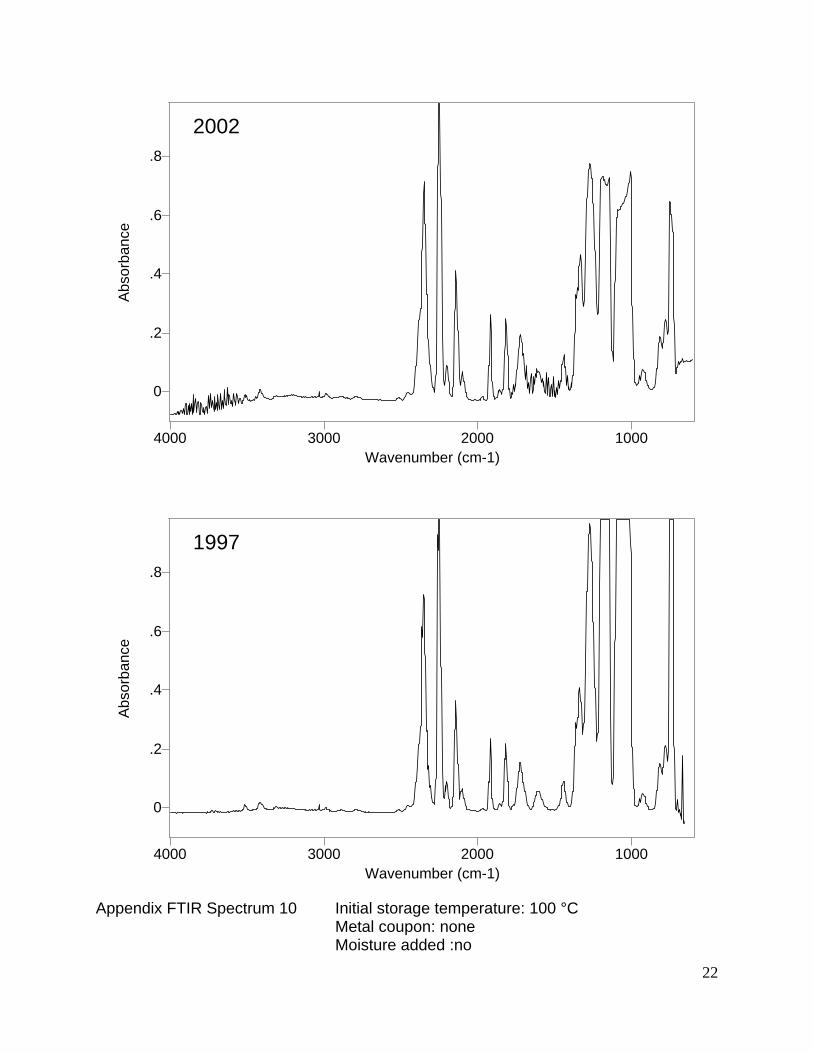
Appendix FTIR Spectrum 10 Initial storage temperature: 100 °C
Metal coupon: none Moisture added :no
22

0
.2
.4
.6
.8
Abs
orba
nce
4000 3000 2000 1000 Wavenumber (cm-1)
2002
0
.2
.4
.6
.8
Abs
orba
nce
4000 3000 2000 1000 Wavenumber (cm-1)
1997
Appendix FTIR Spectrum 11 Initial storage temperature: 100 °C
Metal coupon: none Moisture added :yes
23

0
.2
.4
.6
.8
Abs
orba
nce
4000 3000 2000 1000 Wavenumber (cm-1)
2002
0
.2
.4
.6
.8
Abs
orba
nce
4000 3000 2000 1000 Wavenumber (cm-1)
1997
Appendix FTIR Spectrum 12 Initial storage temperature: 100 °C
Metal coupon: Ti-15-3-3-3 Moisture added :no
24

0
.2
.4
.6
.8
Abs
orba
nce
4000 3000 2000 1000 Wavenumber (cm-1)
2002
0
.2
.4
.6
.8
Abs
orba
nce
4000 3000 2000 1000 Wavenumber (cm-1)
1997
Appendix FTIR Spectrum 13 Initial storage temperature: 100 °C
Metal coupon: Inconel 625 Moisture added :no
25
0
.2
.4
.6
.8
Abs
orba
nce
4000 3000 2000 1000 Wavenumber (cm-1)
2002
0
.2
.4
.6
.8
Abs
orba
nce
4000 3000 2000 1000 Wavenumber (cm-1)
1997
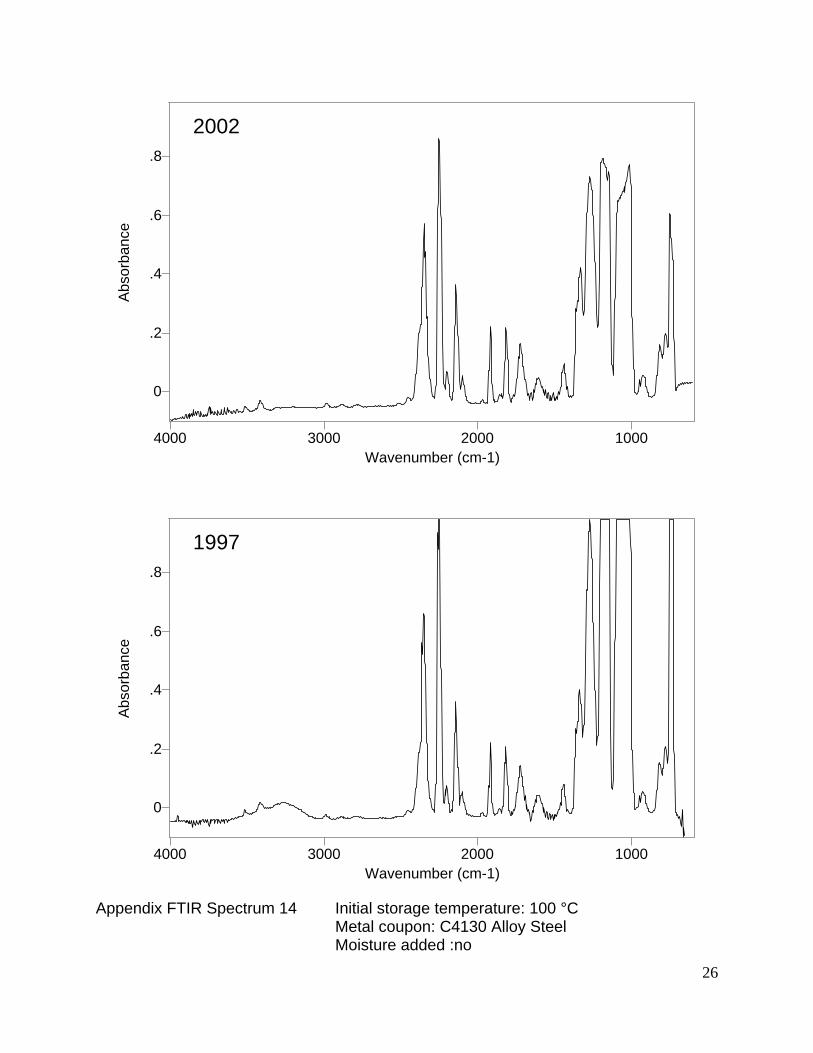
Appendix FTIR Spectrum 14 Initial storage temperature: 100 °C
Metal coupon: C4130 Alloy Steel Moisture added :no
26

0
.2
.4
.6
.8
Abs
orba
nce
4000 3000 2000 1000 Wavenumber (cm-1)
2002
0
.2
.4
.6
.8
Abs
orba
nce
4000 3000 2000 1000 Wavenumber (cm-1)
1997
Appendix FTIR Spectrum 15 Initial storage temperature: 100 °C
Metal coupon: Copper Moisture added :yes
27
0
.2
.4
.6
.8
Abs
orba
nce
4000 3000 2000 1000 Wavenumber (cm-1)
2002
0
.2
.4
.6
.8
Abs
orba
nce
4000 3000 2000 1000 Wavenumber (cm-1)
1997
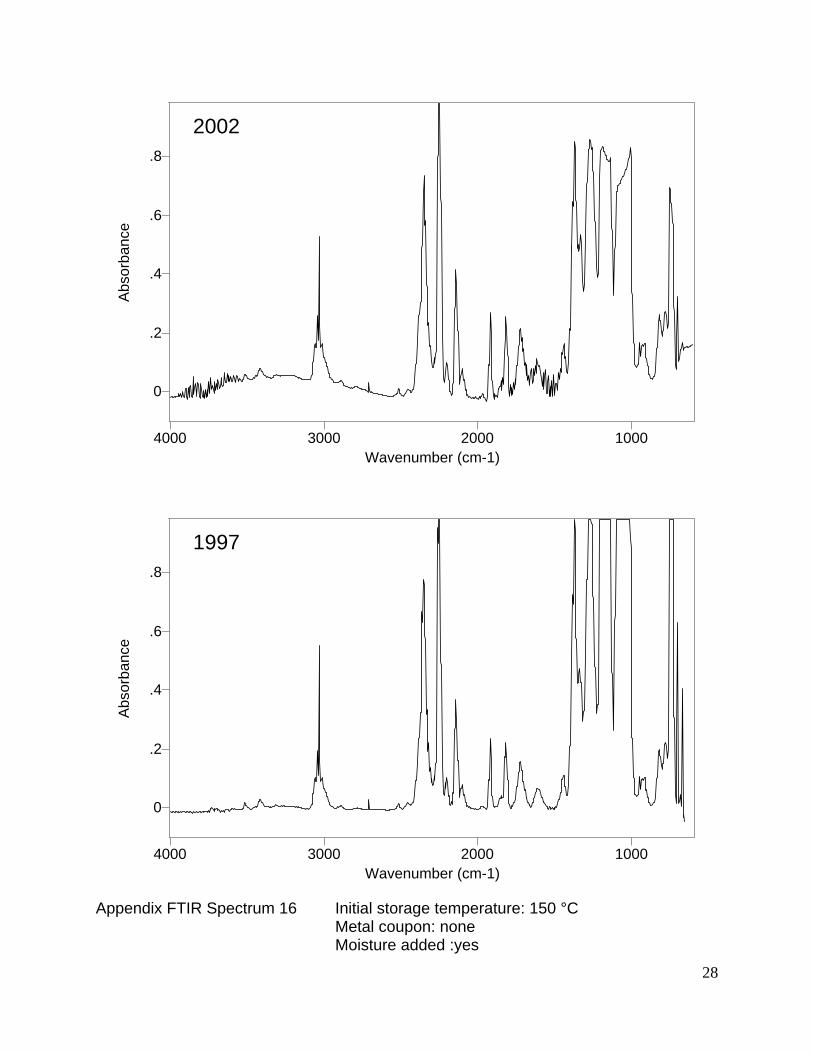
Appendix FTIR Spectrum 16 Initial storage temperature: 150 °C
Metal coupon: none Moisture added :yes
28

0
.2
.4
.6
.8
Abs
orba
nce
4000 3000 2000 1000 Wavenumber (cm-1)
2002
0
.2
.4
.6
.8
Abs
orba
nce
4000 3000 2000 1000 Wavenumber (cm-1)
1997
Appendix FTIR Spectrum 17 Initial storage temperature: 150 °C
Metal coupon: Nitronic 40 Moisture added :yes
29
0
.2
.4
.6
.8
Abs
orba
nce
4000 3000 2000 1000 Wavenumber (cm-1)
2002
0
.2
.4
.6
.8
Abs
orba
nce
4000 3000 2000 1000 Wavenumber (cm-1)
1997
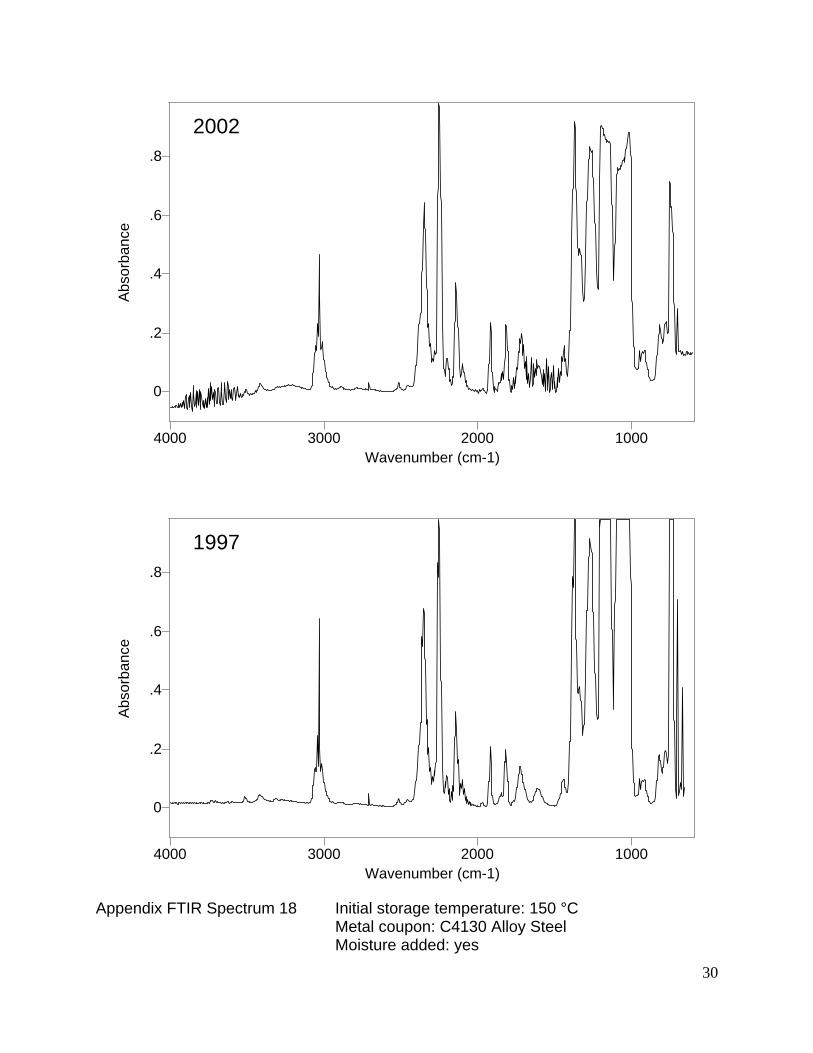
Appendix FTIR Spectrum 18 Initial storage temperature: 150 °C
Metal coupon: C4130 Alloy Steel Moisture added: yes
30
0
.2
.4
.6
.8
Abs
orba
nce
4000 3000 2000 1000 Wavenumber (cm-1)
2002
0
.2
.4
.6
.8
Abs
orba
nce
4000 3000 2000 1000 Wavenumber (cm-1)
1997
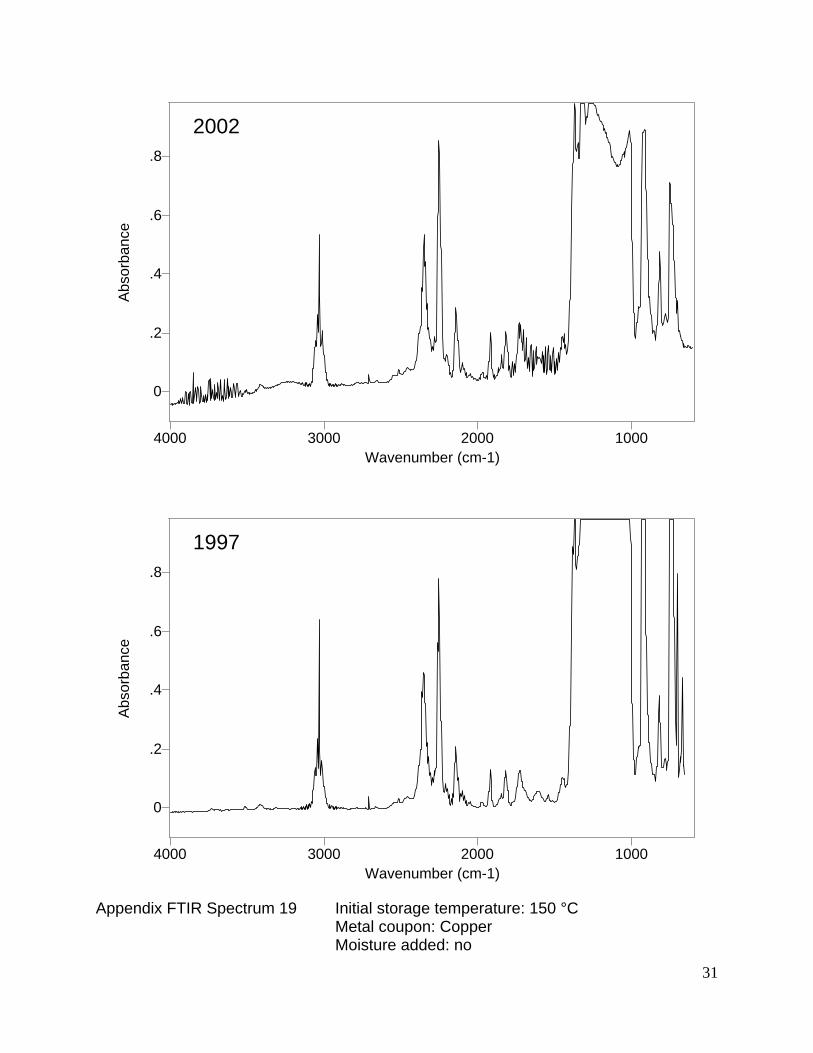
Appendix FTIR Spectrum 19 Initial storage temperature: 150 °C
Metal coupon: Copper Moisture added: no
31
0
.2
.4
.6
.8
Abs
orba
nce
4000 3000 2000 1000 Wavenumber (cm-1)
2002
0
.2
.4
.6
.8
Abs
orba
nce
4000 3000 2000 1000 Wavenumber (cm-1)
1997
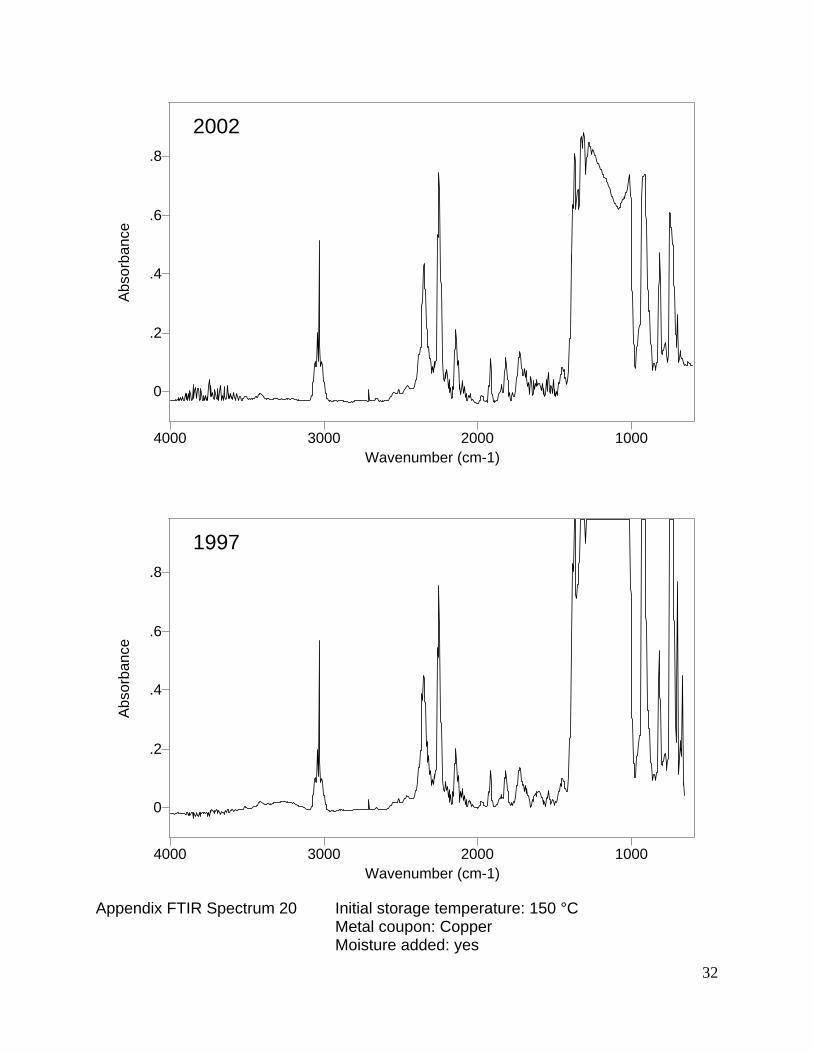
Appendix FTIR Spectrum 20 Initial storage temperature: 150 °C
Metal coupon: Copper Moisture added: yes
32

0
.2
.4
.6
.8
Abs
orba
nce
4000 3000 2000 1000 Wavenumber (cm-1)
2002
0
.2
.4
.6
.8
Abs
orba
nce
4000 3000 2000 1000 Wavenumber (cm-1)
1997
Appendix FTIR Spectrum 21 Initial storage temperature: 150 °C
Metal coupon: Nitronic 40 and Copper Moisture added: yes
33
0
.2
.4
.6
.8
Abs
orba
nce
4000 3000 2000 1000 Wavenumber (cm-1)
2002
0
.2
.4
.6
.8
Abs
orba
nce
4000 3000 2000 1000 Wavenumber (cm-1)
1997
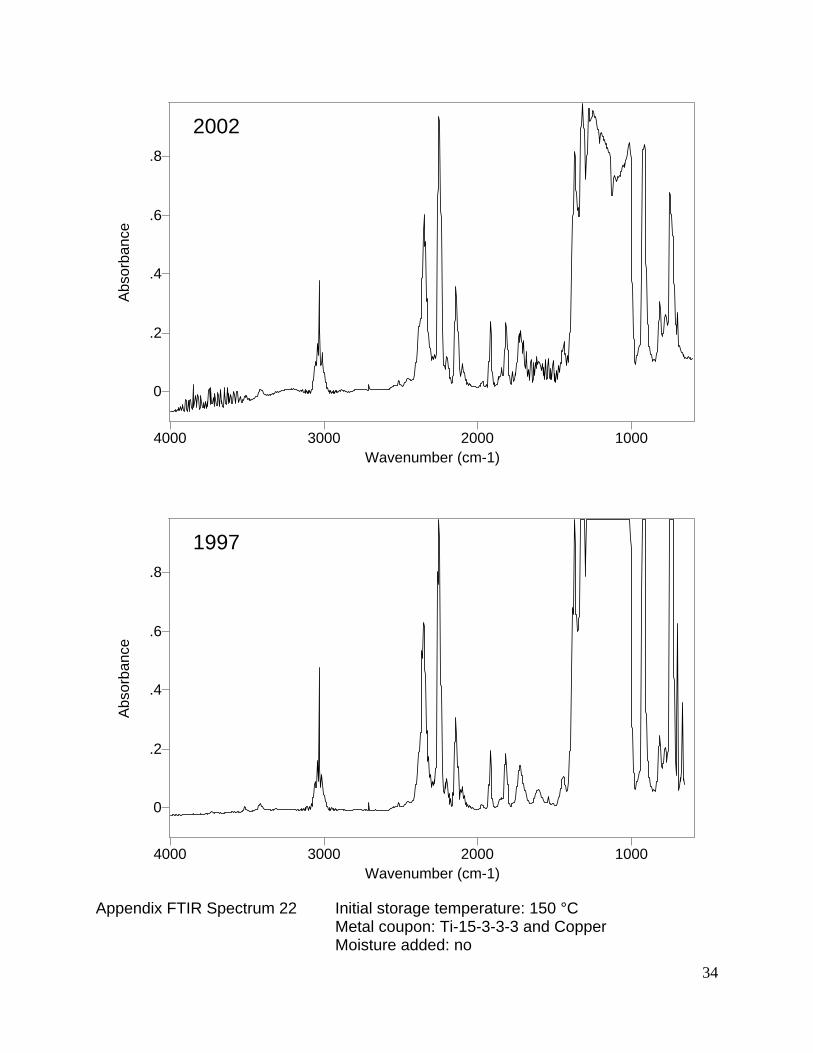
Appendix FTIR Spectrum 22 Initial storage temperature: 150 °C
Metal coupon: Ti-15-3-3-3 and Copper Moisture added: no
34
0
.2
.4
.6
.8
Abs
orba
nce
4000 3000 2000 1000 Wavenumber (cm-1)
2002
0
.2
.4
.6
.8
Abs
orba
nce
4000 3000 2000 1000 Wavenumber (cm-1)
1997
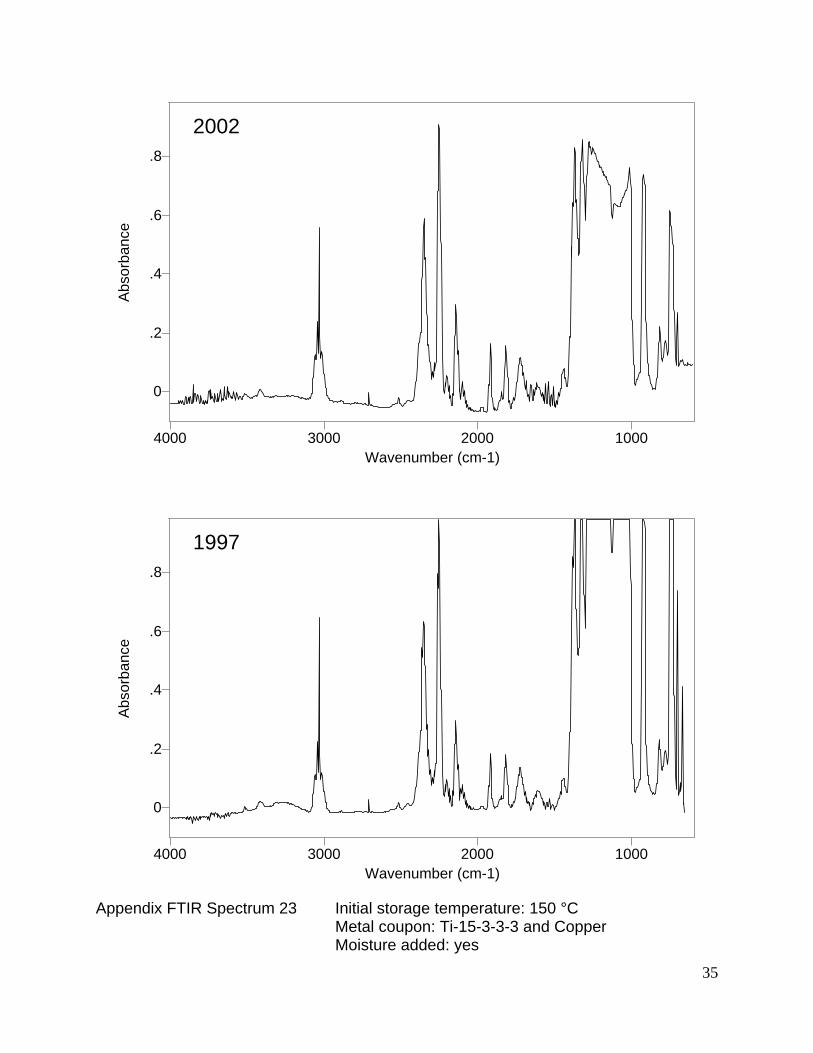
Appendix FTIR Spectrum 23 Initial storage temperature: 150 °C
Metal coupon: Ti-15-3-3-3 and Copper Moisture added: yes
35

0
.2
.4
.6
.8
Abs
orba
nce
4000 3000 2000 1000 Wavenumber (cm-1)
2002
0
.2
.4
.6
.8
Abs
orba
nce
4000 3000 2000 1000 Wavenumber (cm-1)
1997
Appendix FTIR Spectrum 24 Initial storage temperature: 150 °C
Metal coupon: Inconel 625 and Copper Moisture added :no
36

0
.2
.4
.6
.8
Abs
orba
nce
4000 3000 2000 1000 Wavenumber (cm-1)
2002
0
.2
.4
.6
.8
Abs
orba
nce
4000 3000 2000 1000 Wavenumber (cm-1)
1997
Appendix FTIR Spectrum 25 Initial storage temperature: 150 °C
Metal coupon: Inconel 625 and Copper Moisture added :yes
37
0
.2
.4
.6
.8
Abs
orba
nce
4000 3000 2000 1000 Wavenumber (cm-1)
2002
0
.2
.4
.6
.8
Abs
orba
nce
4000 3000 2000 1000 Wavenumber (cm-1)
1997
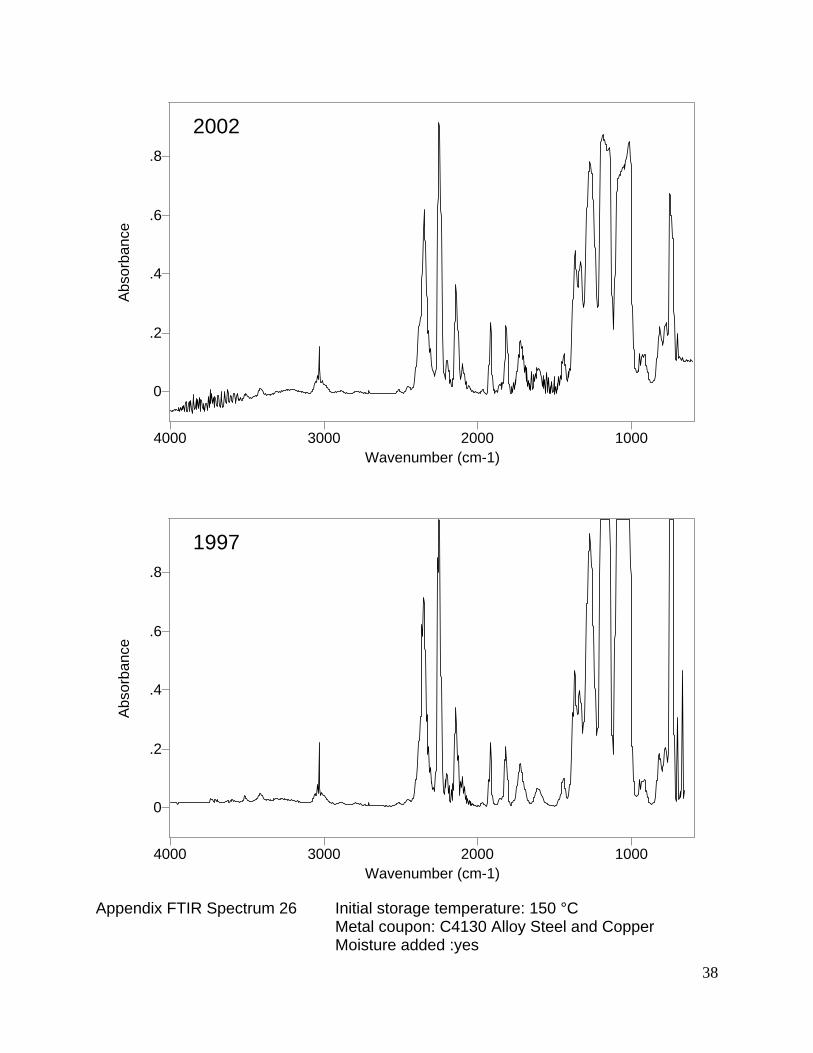
Appendix FTIR Spectrum 26 Initial storage temperature: 150 °C
Metal coupon: C4130 Alloy Steel and Copper Moisture added :yes
38