certified professional midwife (cpm) - arizona department of
TRANSCRIPT

THE EFFECTS OF GLUCOSAMINE AND CHONDROITIN ON THE VISCOSITY OFSYNOVIAL FLUID IN PATIENTS WITH OSTEOARTHRITIS
By
BRYAN PRESTON CONRAD
A THESIS PRESENTED TO THE GRADUATE SCHOOLOF THE UNIVERSITY OF FLORIDA IN PARTIAL FULFILLMENT
OF THE REQUIREMENTS FOR THE DEGREE OFMASTER OF ENGINEERING
UNIVERSITY OF FLORIDA
2001

Copyright 2001
by
Bryan Preston Conrad

Not only my words and my works, but my entire life I dedicate to Suzanne.
iv
ACKNOWLEDGMENTS
I extend my sincerest gratitude to Dr. Roger Tran-Son-Tay for his thoughtful and
caring guidance throughout my graduate career. He has taught me much about research
and even more about life. I would also like to acknowledge the contribution of my
supervisory committee: Dr. Cristescu, Dr. Fregly and Dr. Horodyski. I am indebted to
Dr. Cristescu for his immense abilities in the area of theoretical fluid analysis. Dr. Fregly
has always been ready with encouragement and enthusiasm. By never settling for
mediocrity, Dr. Horodyski has challenged me to explore the greater depths of learning
and always challenged me to determine the relevance of my research. Because of their
input, advice and challenges I have matured as a researcher and as a student. I would
also like to extend my gratitude to Dr. Levy for his help in aspirating the synovial fluid.
During my research I had the pleasure of working in two different labs, in orthopaedics
and biorheology. With the help of my coworkers and friends even the tedium became
bearable. I thank Randy, Tim, Butch, Joanne, Suny, Narcisse, Becky, Cecile and Wil. I
extend a special thanks to my family Mom, Dad and Annie. They have definitely been
encouraging me for the longest! They will always be dear to my heart. I would be
negligent to not mention the contributions and sacrifices of my wife, Suzanne. Through
all of my research and studies she has endured the ups and downs and has never faltered
in her support and encouragement. Her love lifts me. I thank God for all He has done for
me.

v
TABLE OF CONTENTS
page
ACKNOWLEDGMENTS...................................................................................................iv
LIST OF TABLES .............................................................................................................vii
LIST OF FIGURES...........................................................................................................viii
ABSTRACT.........................................................................................................................x
CHAPTERS
1 INTRODUCTION .........................................................................................................1
What is Osteoarthritis?.................................................................................................. 1Why is Synovial Fluid Important? ................................................................................ 2Specific Aims ................................................................................................................ 2Study Design ................................................................................................................. 2
2 BACKGROUND............................................................................................................4
Anatomy and Physiology of the Synovial Joint............................................................ 4Subchondral Bone ................................................................................................... 4Synovium................................................................................................................. 5Articular Cartilage ................................................................................................... 6Synovial Fluid ......................................................................................................... 7
Normal Structure and Function of Synovial Fluid........................................................ 7Pathology of Osteoarthtitis............................................................................................ 9Pathologic Synovial Fluid ........................................................................................... 12Management and Treatment of Osteoarthritis............................................................. 16Outcome Measures in Osteoarthritis Research and Clinical Practice......................... 19
Radiographic Analysis .......................................................................................... 20Pain Questionnaires............................................................................................... 20Magnetic Resonance Imaging............................................................................... 21Proteoglycan Assay............................................................................................... 21Viscosity................................................................................................................ 21
3 MATERIALS AND METHODS.................................................................................22
Experimental Setup ..................................................................................................... 22

vi
Strength Testing...................................................................................................... 23Magnetic Resonance Imaging............................................................................... 23Pain Questionnaire ................................................................................................ 23Proteoglycan Assay............................................................................................... 23Viscosity................................................................................................................ 24
Microrheometer........................................................................................................... 25Background ........................................................................................................... 25Apparatus .............................................................................................................. 26Experiments........................................................................................................... 28
4 RESULTS.....................................................................................................................31
Microrheometer Validation......................................................................................... 31Clinical Data................................................................................................................ 35
5 DISCUSSION..............................................................................................................38
Microrheometer........................................................................................................... 38Clinical........................................................................................................................ 38
6 CONCLUSION............................................................................................................44
APPENDICES
A FALLING CYLINDER THEORY ..............................................................................47
Formulation of the Problem......................................................................................... 47Velocity Profile for Open Tube................................................................................... 50Velocity Profile for Closed Tube ................................................................................ 52
B RAW DATA................................................................................................................55
LIST OF REFERENCES ...................................................................................................64
BIOGRAPHICAL SKETCH..............................................................................................69

vii
LIST OF TABLES
Table Page
1. Summary of studies analyzing synovial fluid viscosity. ...................................................15
2. Newtonian fluids tested on both the microrheometer (MR) and thecone-plate rheometer (CP). N is the number of samples tested onthe MR. SD is the standard deviation of the MR viscositymeasurement. Accuracy = ((MR-CP)/CP*100%). Variability =SD/MR viscosity*100%.............................................................................................32
3. Non-Newtonian HA fluid tested on both the microrheometer (MR) andcone-plate viscometer (CP). MR shear rate is given for themeasured viscosity. HA was tested over a range of shear rates inthe CP.........................................................................................................................32
4. Changes in synovial fluid viscosity between first and last sample (cone-plate viscometer, shear rate = 1/s) for both experimental groups.Effect size = change/baseline viscosity. a Two subjects in theplacebo group withdrew from the study, one to due a TKA, theother due to lack of benefit from study medication. b Effect size isnot statistically different (t=0.45)...............................................................................36
5. Change in synovial fluid viscosity between week 0 and 4. c Onesubject in placebo group withdrew due to TKA. d Effect size is notstatistically different (p=0.50)....................................................................................36
6. Raw data from synovial fluid............................................................................................55

viii
LIST OF FIGURES
Figure Page
1. Diagram of the structures of the knee ...............................................................................5
2. Schematic of Microrheometer (a – sample tube, b –cylinder, c – piezoelectric crystal, d – ultrasoundtransducer, e – water jacket, f – electromagnet).........................................................27
3. Main bang is the large signal on the left, the echo of the cylinder is thesmaller signal on the right (tf – time of flight, time for ultrasoundpulse to travel to the cylinder and back to the transducer.)........................................28
4. Oscilloscope plot of the cylinder’s displacement vs. time as it fallsthrough the sample tube. The arrow indicates the path of thecylinder. From this output the speed of sedimentation (of fallingvelocity) of the cylinder is measured. ........................................................................30
5. Viscosity plotted against shear rate for non-newtonian HA samplestested on the cone-plate viscometer (log-log plot).....................................................33
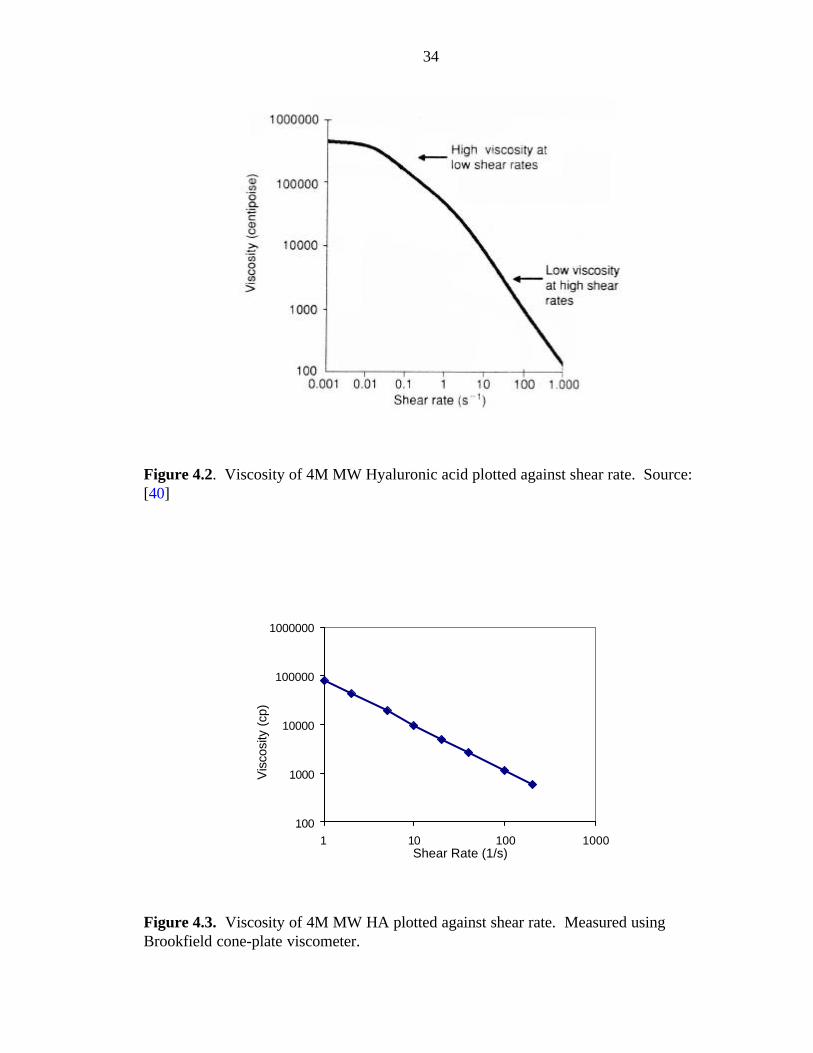
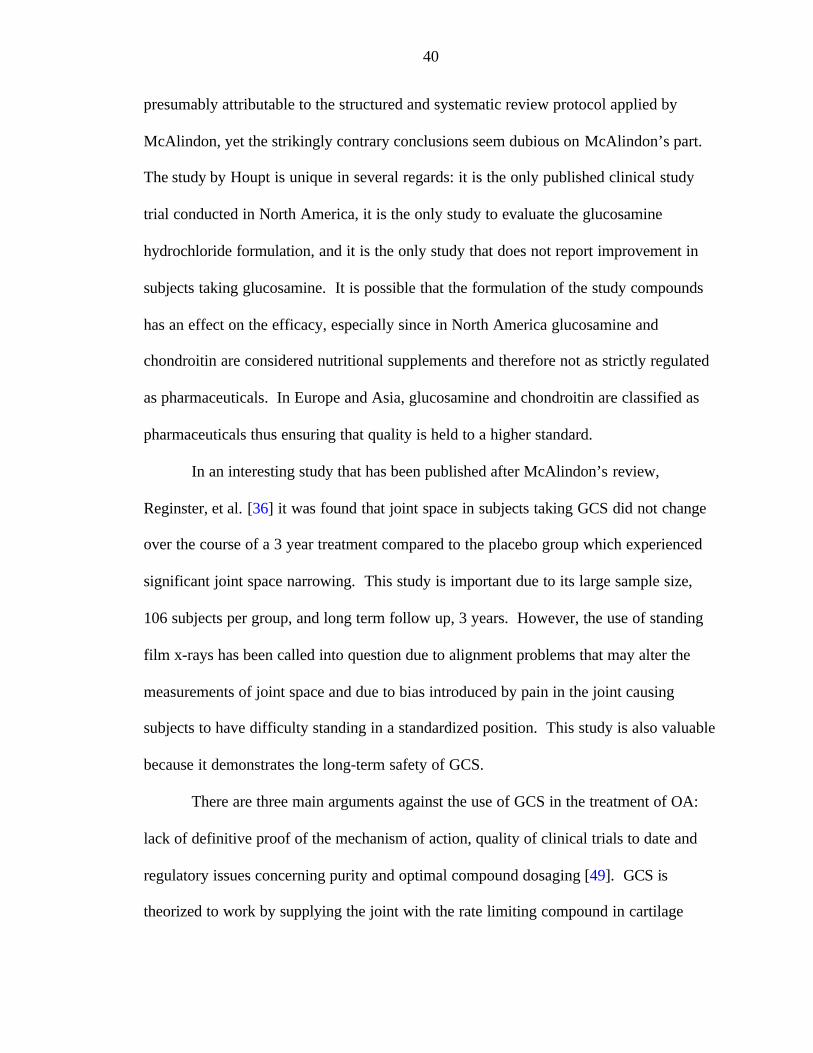
6. Viscosity of 4M MW Hyaluronic acid plotted against shear rate.....................................34
7. Viscosity of 4M MW HA plotted against shear rate. Measured usingBrookfield cone-plate viscometer. .............................................................................34
8. Shear rate versus viscosity for a subject in GCS group. This particularsubject experienced a decrease in viscosity the first 12 weekswhich somewhat recovered by week 23. Notice that the fluiddisplays newtonian behavior at low shear rates at week 12.......................................37
9. Viscosity versus shear rate for patient ld. .........................................................................57
10. Viscosity versus shear rate for patient fh (fh withdrew from study dueto receiving a total knee replacement after week 4)...................................................57
11. Viscosity versus shear rate for patient ka........................................................................58
12. Viscosity versus shear rate for patient fr.........................................................................58

ix
13. Viscosity versus shear rate for patient jd. .......................................................................59
14. Viscosity versus shear rate for patient aa........................................................................59
15. Viscosity versus shear rate for patient wz (the only patient for whomsynovial fluid samples are available at all four time points)......................................60
16. Viscosity versus shear rate for patient dw.......................................................................60
17. Viscosity versus shear rate for patient cm (Patient withdrew fromstudy due to lack of efficacy of treatment).................................................................61
18. Viscosity versus shear rate for patient jb. .......................................................................61
19. Viscosity versus shear rate for patient ss. .......................................................................62
20. Viscosity versus shear rate for patient w.........................................................................62
21. Viscosity versus shear rate for patient a..........................................................................63

x
Abstract of Thesis Presented to the Graduate Schoolof the University of Florida in Partial Fulfillment of theRequirements for the Degree of Master of Engineering
THE EFFECTS OF GLUCOSAMINE ANDCHONDROITIN ON THE VISCOSITY OF SYNOVIAL
FLUID IN PATIENTS WITH OSTEOARTHRITIS
By
Bryan Preston Conrad
August 2001
Chairman: Dr. Roger Tran-Son-TayMajor Department: Biomedical Engineering
Osteoarthritis (OA), a disease resulting in the degeneration of articular cartilage,
is a debilitating condition afflicting millions of people around the world. Current
therapeutic approaches using non-steroidal anti-inflammatory drugs are ineffective in
altering the course of the disease and are known to cause severe side effects in some
patients. There is a dire need for treatments that stop or at least delay the degeneration of
articular cartilage. Healthy synovial fluid is highly viscous allowing it to act as a natural
lubricant in the joint. In persons with OA, the synovial fluid has been shown to have a
decreased viscosity and thus has less effective lubrication.
The objective of this thesis was to evaluate whether glucosamine and chondroitin
sulfate (GCS) are effective in treating OA. Efficacy will be determined by measuring the
changes in the viscosity of synovial fluid with an increase in viscosity demonstrating a

xi
positive response to the treatment. A secondary goal was to establish a method for
measuring highly viscous fluid at different shear rates using a cylinder microrheometer.
Twenty-six osteoarthritic subjects were randomized into one of two groups, either
to receive GCS or placebo. Treatments were blinded to both the investigator and the
patient. Synovial fluid was aspirated from the subjects’ knee at weeks 0, 4, 12 and 20.
The viscosity of the synovial fluid was measured using a Brookfield cone-plate
viscometer and the microrheometer.
At four weeks, patients taking GCS had a higher synovial fluid viscosity than
patients on placebo. Also, at later time points it was found that patients on placebo had a
decreased viscosity while patients taking GCS had not changed. However these
differences are not statistically significant (p= about 0.5). In addition it was noted that
synovial fluid exhibits shear thinning behavior.
The results indicate a need for a study with a larger number of subjects. The trend
observed, nevertheless, suggests that GCS may have a beneficial effect on some patients,
resulting in an initial increase in viscosity over the first month of treatment and
eventually returning to pretreatment condition after that. By demonstrating that viscosity
can be used to track changes in osteoarthritis, this thesis provides an important tool for
future OA research. The next step of this research will be to correlate the synovial fluid
viscosity with other clinical parameters, such as pain, function, and joint space
narrowing. This finding could have a great impact on the evaluation of treatments for
OA and in the assessment of its severity.

1
CHAPTER 1INTRODUCTION
What is Osteoarthritis?
Osteoarthritis (OA) is a disease characterized by erosion of articular cartilage,
which becomes soft, frayed and thinned with outgrowths of marginal osteophytes
(nodules of bone forming on the joint surface). The most common symptoms are pain
and loss of function. OA mainly affects weight-bearing joints and is more common in
overweight and older persons [1]. However, such a concise definition of OA belies its
complex and multifaceted nature. In recent years OA has become a generic term for a
variety of “overlapping and distinct diseases” [2] that affect the entire joint, not only the
articular cartilage. Due to many interwoven factors, it is difficult to predict the individual
possibility for a patient’s disease to progress.
Osteoarthritis (OA) is the most prevalent disease associated with aging, affecting
the quality of life of approximately 10 million Americans. However, diagnosing OA can
be an enigmatic process in itself. There are many definitions of OA and clinicians
dispute which signs and symptoms truly signify the onset or progression of OA. While it
is widely accepted that end stage OA is represented by full thickness loss of articular
cartilage, early OA is much more ambiguous. OA can be defined by any combination of
the following: joint pain, crepitus on active motion (noisy joints), morning stiffness, joint
space narrowing, presence of osteophytes at joint margin, sclerosis (thickening) of
subchondral bone, subchondral cysts and loss of function.
2
Why is Synovial Fluid Important?
Synovial fluid is a highly viscous plasma-like fluid excreted by cells that line the
joint. One of its functions is to aid in lubrication of the joint. In the healthy joint,
synovial fluid lubrication does an excellent job of protecting the articular cartilage from
wear. However in the diseased joint, synovial fluid becomes less viscous and therefore
less effective in lubrication. In fact, diseases can be differentiated by measuring the
viscosity of synovial fluid (rheumatoid arthritis < osteoarthritis < normal). It is
postulated that by monitoring the viscosity of synovial fluid, one can track the
progression of joint disease.
Specific Aims
The specific aims of this thesis are to:
1. Validate the use of a custom-built small-volume rheometer (microrheometer) inmeasuring the viscosity of synovial fluid from patients with OA.
2. Determine whether orally administered glucosamine and chondroitin sulfate has aneffect on the viscosity of synovial fluid in patients with osteoarthritis of the knee.
Study Design
The microrheometer will be evaluated in two steps. First, the viscosity of four
newtonian oils will be measured on both the microrheometer and on a standard cone-
plate viscometer (Brookfield Inc., MA). By comparing the values gathered from the two
devices, it will be determined whether the microrheometer yields comparable results with
the standard cone-plate viscometer. Second, the viscosity of four non- newtonian fluids

3
will be measured at various shear rates on the cone-plate viscometer and compared to the
values calculated from the microrheometer. This step is vital since synovial fluid has
demonstrated a shear thinning effect; that is it has a lower viscosity at higher shear rates.
A clinical study will be conducted to evaluate the effectiveness of glucosamine
and chondroitin (GCS). Twenty-six osteoarthritic subjects will be enrolled in the study
and randomized into one of two groups (GCS or placebo). At baseline (week 0) all
subjects will have a synovial fluid sample drawn from their study knee. Subjects will
return to the clinic at weeks 4, 12 and 20 for follow-up. At each return visit, an
additional synovial fluid sample will be collected from all subjects. The viscosity of fluid
samples with a volume of greater than 0.5 mL will be measured on both the
microrheometer and the cone-plate viscometer. Since the cone-plate viscometer requires
0.5 mL of fluid to test, samples less than 0.5 mL will only be measured on the
microrheometer. The change in viscosity between week 0 and week 20 will be used to
determine the effect of GCS. It is hypothesized that GCS will have a beneficial effect on
OA. Additionally it is expected that this beneficial effect will be accompanied by an
increase in synovial fluid viscosity.

4
CHAPTER 2BACKGROUND
Anatomy and Physiology of the Synovial Joint
Synovial joints are found in locations that require a wide range of motion. In the
human body knee, hip, ankle and shoulder joints fall into this category. These joints
consist of a closed system made up of the two articulating surfaces surrounded by a
capsule and bathed in fluid. The following section will describe how the mechanical and
biological properties of the tissues of the knee that enable it to be an extremely effective
joint under a wide range of loads over millions of cycles. In particular, the tissues that
will be discussed will be the subchondral bone, synovium, articular cartilage, and
synovial fluid, Figure 2.1. Although there are many complex biochemical interactions at
work in the knee, they will not be addressed in great detail in this thesis. The purpose of
this background is to justify the methods employed in the experimental section of this
work.
Subchondral Bone
Between articular cartilage and underlying cancellous bone is a thin plate of
subchondral bone. With a Young’s modulus between 1.0-15.0 GPa, the material
properties of subchondral bone lie between those of cortical and cancellous bone [3]. It is
thought that by pairing the compliant cancellous bone with the denser and stiffer
subchondral bone allows optimal congruence of the joint under high loads [4].

5
Figure 2.1. Diagram of the structures of the knee. Source: [3].
Synovium
Surrounding the knee joint is a tough cartilage capsule that creates a closed
system. This capsule is lined with fluid producing mesenchymal cells called the
synovium [5]. The synovium secretes the synovial fluid that bathes the joint. Since
articular cartilage is devoid of a blood supply, the joint relies on the well vascularized
synovium to import raw materials and remove waste products from the joint.

6
Articular Cartilage
Articular cartilage is a biphasic material consisting of a type II collagen matrix
infused with water and proteoglycans [6]. This unique structure enables articular
cartilage to function as both a shock absorber and as a superb load bearing surface. One
of the main tasks of the articular cartilage is to provide a near frictionless bearing surface
as the femur and tibia articulate. This is no easy task considering the large loads the joint
experiences in even ordinary activity such as walking (3-5 times body weight) and the
enormous number of cycles that the joint will experience in a lifetime (well over 50
million). Yet despite these severe conditions the joint performs the task admirably and
undergoes remarkably little wear [3, 7].
One primary difference between biological joints and engineering bearings is that
the body utilizes self repair mechanisms that enable microdamage to be repaired before it
progresses to cause failure of the joint. There is a continuous balance between damage
accumulation and repair and until instances of microfractures begin to outpace the
biologic repair, the joint will remain healthy and effective. In articular cartilage,
chondrocytes are responsible for responding to various stimuli and synthesizing new
cartilage. The precise stimuli and how they signal chondrocytes is an active area of
research.
Cartilage is also designed to provide attenuation of impact loads, thereby reducing
the stress that is transmitted to the bones. It accomplishes this task because of its
biphasic nature and the high concentration of high molecular weight polymers trapped in
the collagen matrix. The viscoelastic properties of cartilage are very important in this
task in that the tissue response is determined by the rate of loading. Since mechanical

7
insults are known to be risk factors for osteoarthritis it is important that the joint retain its
ability to both lubricate and cushion in order to maintain health.
Synovial Fluid
Normal synovial fluid is a clear to yellow highly viscous fluid composed
primarily of serum [8], which is similar to blood plasma except there are fewer proteins.
Long chains of hyaluronic acid give synovial fluid many beneficial rheological properties
[9, 10]. Synovial fluid is non-newtonian, in that it demonstrates a shear thinning effect,
normal stress effect perpendicular to the shear direction and an elastic component [11].
The viscoelastic properties that synovial fluid exhibits are particularly well suited to the
joint since the fluid is highly viscous at low shear rates such as during gait, and highly
elastic during high shear rates, such as a in jumping or trauma. The joint’s synovial fluid
is at work in many complex mechanisms within the joint to maintain efficient motion.
Synovial fluid is a primary component of the lubrication process. In both boundary layer
and fluid film theories it is essential that synovial fluid provide necessary lubricating
molecules and viscous properties, respectively. Synovial fluid and articular cartilage are
closely linked in providing lubrication and changes in either will have an effect on the
performance of the joint.
Normal Structure and Function of Synovial Fluid
Healthy joints contain hyaluronic acid (HA) with a molecular weight between 1
and 10 million [12-15]. In 1953 Ogston and Stanier showed that HA concentration has a
marked influence on the rheological properties of synovial fluid [11]. They also
postulated that it is the HA that facilitates both the static and dynamic lubrication in the
joint. Through a unique experiment Ogston and Stanier were also able to demonstrate

8
that as synovial fluid is compressed it behaves in a very elastic manner up to a point at
which it will no longer compress under a given load, thus preventing the two loading
surfaces from coming in contact. This effect, presumably due to the presence of HA, has
significant implications in the lubricating ability of synovial fluid and will be discussed in
greater detail later. By engineering standards, the efficiency of the human knee joint is
astounding, with a coefficient of friction lower than ice on ice or Teflon on Teflon. There
are few man made materials that even approach the low coefficient of friction that has
been measured between articulating cartilage. Synovial fluid further enhances the
lubricating abilities of the knee joint. Synovial fluid is extremely viscous at low shear
rates and extremely elastic at high shear rates. Additionally it contains lubricating
molecules that contribute to even lower frictional properties. These properties allow
synovial fluid to act as an ideal lubricant to prevent friction and wear of cartilage surfaces
[16].
The study of the interactions during motion at the joint surfaces is known as
tribiology, which encompasses friction, lubrication and wear. Two theories have been
developed to describe the lubrication mechanisms that occur at the joint surface. These
two models are boundary lubrication and fluid film lubrication. In boundary
layer lubrication a monolayer of glycoproteins (most likely lubricin, a component of
synovial fluid) [17] is absorbed into the articular cartilage thus reducing the friction as the
opposing surfaces articulate across each other [3]. Due to solid-solid contact, this theory
does not depend on the viscosity of synovial fluid. However, experiments have shown
that the coefficient of friction predicted by this model alone is one to two orders of
magnitude greater than what has been measured in vitro. Because of this it is expected
that another mechanism is at work as well. Fluid film lubrication theory is more useful

9
for explaining the extremely low coefficient of friction that is observed in fluid film
lubrication, a thin layer of viscous fluid is present between the ends of bones and when
joint loads force the ends closer together, the fluid is squeezed out of the joint space thus
inducing a pressure that acts to support the bones. There are several hypotheses for fluid-
film lubrication, including hydrodynamic lubrication, self-generating mechanism,
squeeze-film lubrication, hydrostatic lubrication and boosted lubrication [3]. In reality
the joint probably experiences phases during which each theory is valid (as during gait).
One composite of these two theories is that as articular cartilage is deformed, pocket of
fluid may be trapped creating areas of solid-solid contact as well as areas that are
separated by a thin fluid film [3].
Pathology of Osteoarthtitis
Osteoarthritis (OA) is the most prevalent disease associated with aging [6, 18].
The quality of life of approximately 10 million Americans is adversely affected by OA
with about 70% of these individuals in the 65 and over age group [19]. Approximately
80% of people over the age of 55 show radiographic evidence of OA. An alarming
statistic considering the swelling elderly population is that the frequency of OA increases
with advancing age and does so exponentially after the age of 50 [20]. Perhaps the most
ubiquitous risk factor for OA is age itself. Over 80% of individuals over the age of 60
have radiographic evidence of OA [20]. However, there are subtle differences between
natural degradation associated with aging and true OA and without careful analysis, the
distinction can be difficult to make [21].
Current research has focussed on the mechanical insults that can contribute to the
initiation and progression of OA [22-24]. In knees, repetitive high impact loading and

10
traumatic loading are two sources that have relatively clear ties to initiating OA.
Increased loading can have two effects on the joint: 1) The long-term repetition will
increase the density of the subchondral bone thereby making it less effective in absorbing
future impacts and in turn transferring more stress to the articular cartilage. 2) Traumatic
loading can damage the underlying bone of the joint and lead to incongruencies of the
joint surface that may eventually become stress concentrations. Other risk factors include
obesity, genetics (although no genetic linkage has been found in idiopathic knee and hip
OA), gender, race, high bone density, estrogen deficiency and nutritional deficiency
(vitamins D and C).
The primary characteristic of OA is cartilage degeneration, sometimes referred to
as wear and tear of the joint [18]. One theory for articular cartilage degeneration is that
repeated high impact loads cause localized remodeling of the subchondral bone.
Evidence of this remodeling can be seen radiographically in the form of subchondral
sclerosis, or thickening. During remodeling of the subchondral bone layer it is possible
for areas of increased stiffness to develop. Since these areas alter the compliance and
congruency of the joint their presence tends to result in stress concentrations. Increased
stresses in certain areas of the joint are then transferred to the articular cartilage which,
when subjected to high stress, begins to deteriorate. Additionally, as articular cartilage
degenerates, even greater forces are transmitted to the underlying bone thus causing
accelerated remodeling [26].
OA generally progresses in three stages: damage to the cartilage matrix, response
of the chondrocytes to damage and the decline of tissue synthesis and the degeneration of
tissue [26] . In the first stage, as the matrix is compromised, it becomes more infused
with water at the same time the concentration and length of glycosaminoglycan (GAG)

11
chains decreases. The main GAGs in articular cartilage are keratan sulfate and
chondroitin 4- and 6-sulfates [26]. As the water concentration in articular cartilage
increases, the matrix becomes less stiff and more susceptible to mechanical damage [26].
It is the synovial fluid, in conjunction with articular cartilage, which acts as a
lubricating, cushioning, and protective barrier between the ends of the bones [10].
Specifically, it is the presence of long chains of hyaluronic acid produced by the cartilage
matrix that gives the fluid its beneficial viscoelastic properties [15]. Damage to the
cartilage matrix will result in decreased molecular weight and concentration of HA and
eventually result in deficient rheological properties in the joint. There are at least three
factors that act to dilute the concentration of HA. One cause is that the joints increase
production of HA in response to the degradation, however the fluid is produced under
abnormal conditions and contains primarily low molecular weight HA, thus leading to a
dilution of the concentration of normal, high molecular weight hyaluronan in synovial
fluid [13]. Another cause is that the release of enzymes, such as
matrixmetalloprotienases, by the damaged articular cartilage will result in the digestion of
long hyaluronan chains, leaving shorter molecules [26]. A third cause is the mechanical
destruction of long HA chains causing them to be torn into smaller fragments. All of
these factors will lead to the result of decreased viscoelastic properties of the synovial
fluid and therefore less effective in protecting against mechanical forces especially in the
model of fluid film lubrication. As the synovial fluid is degraded, a feedback cycle is
initiated resulting in more damage to the articular cartilage.
Although in the normal joint wear is minimal even over long periods, the
conditions in an arthritic joint accelerate the process. There are two main mechanisms
for wear in the joint: fatigue and interfacial [3]. Fatigue wear is a result of accumulation

12
of small cracks caused by the everyday repeated loading of the joint. If the cracks build
up faster than the chondrocytes can synthesize new cartilage, eventually the damage will
reach to the surface of the cartilage and manifest itself as fibrillation. Interfacial wear is a
result of the contact between the two surfaces of the joint and can be subdivided into two
classes: abrasive and adhesive. Abrasive wear occurs when a soft material comes in
contact with a harder one which cuts the soft material. Adhesive wear occurs when two
surfaces come into contact with each other and form a bond that is stronger than the bond
within either material. When the surfaces are separated, material is pulled off of the
softer material resulting in pitting [3]. Fatigue wear does not depend on the lubricating
properties of the joint, so it is unaffected by changes in synovial fluid viscosity, but
adhesive wear is influenced by the joint lubrication and may be accelerated by changes in
synovial fluid viscosity.
Pathologic Synovial Fluid
Interest in the rheologic properties of synovial fluid has been documented back to
1925 [25]. Even when using a rather unsophisticated capillary viscometer, Schneider was
able to conclude that chronic illnesses were associated with a lower than normal
viscosity. However, due to his study population and test methods he encountered large
variation. Over the past 80 years, there has been considerable discussion about whether
synovial fluid viscosity is altered in patients with OA. At the 1968 Hebreden Society
meeting [27] several scientists reported successfully measuring the viscosity of
pathological fluids including rheumatoid arthritis (RA) and OA. However, no one had
been able to accurately determine the viscosity of healthy synovial fluid. The problem
was the fact that healthy people generally do not have a large volume of synovial fluid
13
(around 0.3 mL) whereas diseased joints are typically effusive (1-5 mL). Therefore, the
researchers were forced to make comparisons based on the properties of normal bovine
synovial fluid, which has a lower viscosity than normal human fluid [7] leading some
researchers to mistakenly conclude that there are no differences between normal and OA
synovial fluid.
By 1976 at least two papers reported results comparing normal and pathological
synovial fluid [10, 30]. Unfortunately, Wright and Dowson do not give any indication of
the source of their data, so it is not possible to discuss their methods of classifying
“normal” and “pathological”. Reimann boldly stated that “in all pathological joints there
is something wrong with the synovial fluid.” In his series of experiments, Reimann used
a custom made rheometer to show that there are significant differences in the viscosity of
synovial fluid from patients that had RA, OA (mostly damaged cartilage) and torn
meniscus (mostly normal cartilage). Riemann also noticed a correlation between the
boundary lubricating ability of synovial fluid and the degree of degeneration of articular
cartilage. Although Reimann claims that viscosity of synovial fluid plays a role in
boundary lubrication, it seems unlikely due to the evidence that hyaluronic acid, the main
component of synovial fluid viscosity, has no effect on this form of lubrication [15]. It
seems probable that synovial fluid plays a more vital role in fluid film lubrication,
especially in light of the viscoelastic properties demonstrated by Ogston and Stanier.
In 1978, Davis and collegues somewhat contradicted Reimann by reporting that
that the viscosity of the fluid was not well correlated to the level of joint degeneration
[28]. However, in their population, all fluid was taken post-mortem and most of the
subjects had been ambulatory prior to dying suddenly opposed to Reimann’s groups of
severely osteoarthritic patients. Additionally, it has been shown repeatedly that there is

14
no correlation between observable joint condition and clinical symptoms, which casts
doubt about whether Davis’ subjects ever complained of OA before their deaths.
The subject of normal versus pathological synovial fluid was again addressed in
1979 by Anadere and collegues [16]. They used an oscillating capillary viscometer to
compare the viscous and elastic components of viscoelasticity from patients with various
joint diseases to “normal” knees (patients with meniscus tears). Both components were
decreased in the diseased fluids with the most pronounced changes observed in fluids
from rheumatic and traumatic knees and somewhat more moderated changes noted in OA
fluids. Unfortunately it is unclear what criteria these researchers used to differentiate
patients with OA.
Schurz and Ribitsch made further contributions to the field of synovial fluid
rheology in 1987 [29]. They evaluated more than 200 knee joints to determine the
rheological properties of normal and pathologic synovial fluids. Measurements were
carried out on a Contraves low shear rotational viscometer and indicated a decrease of
about one order of magnitude between normal and pathological synovial fluid. The
authors in this study did not they describe their criteria for diagnosis of pathological
fluids. Additionally, the normal fluids were gathered post-mortem but no mention was
made concerning the selection of “normal” subjects. In conclusions similar to Reimann
(1976); Schurz and Ribitisch claim that synovial fluid viscosity can be used to
differentially diagnose degenerative and inflammatory joint disease. A summary of the
literature reviewed is provided in Table 2.1. An excellent review of the early synovial
fluid research (1925-1971) is presented by Blair [25].

15
Table 2.1. Summary of studies analyzing synovial fluid viscosity.Study Temp
(C)Viscometer Source of
FluidSubjectCondition
Shear Rate(1/s)
Viscosity(cp)
Normal 10 1000Wright (1975)[10]
? ? ?
OA 10 80-150
Davis (1978)[28]
35 Couette Post-mortem OA 40 85-505
Post-mortem Normal 10 1000-40,000Schurz (1987)[29]
25 ContravesRotational
Diseasedhuman knee
OA 10 100-1000
Caygill (1969)[8]
28 WeissenbergRheogoniometer
Post-mortem Normal 0.05-0.08 20,000-60,000
Patients withtorn meniscus
NearNormal
.15-2.5 30-170(complex)
Reimann(1976)[30]
22 Custom made
Diseasedhuman knee
OA .15-2.5 22-108(complex)
Patients withmeniscusdefects
NearNormal
10 40(complex)
Anadere(1979)[16]
23 OscillatingCapillary
DiseasedHuman knee
OA 10 31(complex)
Arthroscopynot related toOA (ACL,meniscus)
Normal 2 366-513(complex)
Safari (1990) 27 Bohlin VORParallel Plate
Diseasedhuman knee
OA 2 137-262(complex)
Ogston (1953)[11]
25 CouetteViscometer
Bovine Normal 10 8,000-80,000
Traditionally laboratory analysis of synovial fluid has consisted of determining
the type and number of cells present in the fluid, the volume of fluid aspirated and
qualitative analysis of rheologic behavior of the fluid. While it has been shown that there
is an association between viscosity and joint pathology [10, 16, 29, 30, 31], clinical use of
viscosity in diagnosis remains minimal. One reason why more clinicians do not utilize
viscosity is the lack of easy to use low volume viscometers in the clinical setting.
Despite the lack of precise instrumentation some physicians have found it useful to
describe the qualitative properties of synovial fluid. In the process of “synovialysis”, a
qualitative measure of fluid viscosity is one of the tools used to differentially diagnosis
joint disease [32].

16
Currently it is feasible to collect sufficient amounts of pathological fluid for
analysis, yet in patients with good health to mild OA, it is sometimes impossible to
collect enough fluid to perform a viscosity measurement. This limitation has prevented
viscosity from becoming a more widely accessible outcome measure for OA. Some
researchers have noted that some patients may have sufficient fluid at the onset of clinical
trials, but will have little synovial fluid volume if the experimental treatment is effective
(Personal communication, Dr. Philip Brand 2000). It is because of this problem that the
microrheometer is such a valuable tool in the study of synovial fluid.
It has long been suspected that HA is responsible for the viscoelastic properties of
synovial fluid and in pathological conditions it has a noticeably lower molecular weight,
which in turn results in lower viscosity. Considerable rheological data were amassed
concerning HA over the decades and for nearly half a century it has been controversial as
to whether destruction of HA macromolecules is a cause of OA or merely a consequence
of the disease. The controversy is partly rooted in how one interprets the lubrication of
the joint. If it is assumed that boundary lubrication is the primary mechanism, then there
is no reason to draw a link between lack of viscosity (due to HA breakdown) and OA
progression. However, as discussed earlier it is dubious to rely on boundary lubrication
alone, and numerous studies have shown that at least some phases of gait are better
explained by fluid film lubrication. Therefore, if one accepts the plausibility of fluid film
lubrication, then the viscosity, and the HA size, is inherently linked to the healthy motion
of the joint.
Management and Treatment of Osteoarthritis
While OA is not life threatening, it can certainly be a debilitating condition. The
cost of OA is significant because the disease is both widespread and has at least a

17
moderate impact on the affected individual. Pain and loss of function resulting from OA
can lead to direct costs of treatment and also to substantial indirect cost due to lost wages.
In a study of the economic impact of musculoskeletal diseases in the US, it was found
that arthritis carries a burden of $13 billion in direct costs and $42 billion in indirect costs
[19]. The national costs are expected to rise as the median age of the population
increases.
Weight loss and physical therapy are generally prescribed to treat mild OA.
Traditionally more advanced OA is treated with non-steroidal anti-inflammatory drugs
(NSAIDS) until the drugs no longer provide relief from pain at which point the treatment
usually progresses to surgery. While NSAIDS are the most commonly prescribed
medications for OA, they do not seem to alter the natural course of the disease and they
produce significant gastrointestinal side effects due to their inhibition of gastric
prostaglandin synthesis [6]. These severe gastric side effects have recently led to the
development of a new class of drugs know as cyclooxygenase-2 (cox-2) inhibitors. Cox-
2 inhibitors are intended to act on only the pathways that cause pain and decrease effects
on the gastrointestinal tract. Current surgical techniques include load reducing
osteotomy, tenotomy, hemiarthroplasty, and total joint replacement. There are also
inherent risks associated with surgery. The risk for dangerous side effects from this
standard of care has led to the use and development of many new and not so new
treatments for OA.
There are a growing number of non-traditional approaches becoming used
throughout the world. In Europe and Asia, glucosamine and chondroitin sulfate (GCS)
have long been used to treat arthritis. In Europe GCS is regulated as a pharmaceutical,
thus subject to strict quality standards and requiring a prescription. Glucosamine is a

18
constituent of glycosaminoglycans (GAGs) and proteoglycans that are naturally found in
cartilage and synovium. It is also a building block for hyaluronic acid, which forms the
backbone of the proteoglycans embedded in the articular cartilage. Chondroitin 4- and 6-
sulfates are the main GAGs of articular cartilage [26]. In theory, by providing the
building blocks for healthy articular cartilage, the joint will be able to repair and
regenerate cartilage, but this ability of chondroprotection is unproven. Clinical studies
evaluating GCS have suggested that they are effective in relieving symptoms but have
been criticized for reporting bias and low quality [34]. American physicians have been
slow to adopt the use of dietary supplements. However, there seems to be a changing
opinion among both clinicians and researchers that the use of nutraceuticals might be
beneficial for some patients [35-37]. Despite decades of anecdotal evidence and at least a
dozen clinical studies, very little is known about the actual mechanisms through which
GCS may work. In studies of radioisotope labeled GCS, it has been shown that when
orally ingested GCS does indeed reach the joint. But it is not known what the effective
levels must be in the joint to attain clinical improvement nor is it clear what happens to
the compounds ounce they are in the joint.
Another non-surgical treatment for OA is intraarticular injections of hyaluronic
acid (HA) known as viscosupplementation (VS). Balazs [13] has advocated the use of
artificial synovial fluid since 1960’s and is truly a pioneer in the field. VS is a procedure
in which a hyaluronic acid derivative is injected directly into the affected joint. The goal
of viscosupplementation is to recreate the environment of a healthy joint in an effort to
encourage the joint to escape the negative feedback cycle of OA progression. Once
normal viscoelastic properties are returned to the joint fluid, the cartilage lining the joint
will increase production of healthy synovial fluid. Initially the mode of action is mainly

19
mechanical, but it is suspected that additional biologic benefits are eventually levied.
The half-life of the injected fluid is only a few days. Therefore after one week there is no
longer a significant amount of artificial fluid in the joint. However, clinical studies have
shown that the benefits of viscosupplementation can last from 6 months up to a year after
the last injection [37]. Researchers are attempting to elucidate the mechanism by which
VS provides intermediate-term benefits. It is believed that because of the transient nature
of the HA within the joint, it is not actually the restoration of joint viscosity that is the
cause of the noted changes. [38] More likely, the benefits observed in VS are due to
interactions on the molecular level between the HA and pain receptors in the joint.
However, since the cause for the initial onset of arthritis is not addressed (subchondral
sclerosis, varus/valgus deformity, obesity) the benefits of viscosupplementation are not
and will never be long term. Studies evaluating the use of repeated HA injection over
long periods of time are not yet completed.
Outcome Measures in Osteoarthritis Research and Clinical Practice
In many studies OA populations are determined through radiographic diagnosis
(joint space narrowing, presence of osteophytes at joint margin, sclerosis of subchondral
bone, subchondral cysts [36]. . However, many of these subjects have no other symptoms
of OA, and only 10-20% have any limitations in function due to OA. Alternatively, in
some patients that have joint pain most days of the month, there is no radiographic
evidence of OA [6]. Therefore, several procedures have been developed to screen for
OA. One popular and well-validated tool is the WOMAC (Western Ontario and
McMaster Universities) [36, 39] scale which utilizes a combination of visual analog pain
scales and functional ability scores to arrive at a quantitative index of level of OA. Other

20
algorithms use risk factors such as age, obesity and level of activity in conjunction with
clinical, radiographic and laboratory findings to determine levels of OA.
Radiographic Analysis
The use of radiographic analysis is perhaps the most widely used indicator of OA
progression. Using this method is advantageous because there are at least four criteria
that can be observed on an x-ray image.
1. Joint space narrowing can be measured as either the mean distance between
the femur and tibia as determined by computerized image analysis or by
measuring the minimum distance between the bones manually.
2. Subchondral sclerosis can be recognized as an area of low radiolucency
signifying the presence of dense bone.
3. Subchondral cysts can form within the cancellous bone around the joint.
4. Osteophytes may be observed at the periphery of the joint, another symptom
of the hypertrophic conditions in the joint.
Pain Questionnaires
Questionnaires are a well validated clinical tool for assessing the functionality of
patients and the pain associated with routine tasks such as standing up from a chair and
going up and down stairs. Various test utilize different form of functionality
measurement but the most popular is the visual analog scale (VAS) in which a patient
places a vertical mark on a 10 cm horizontal line corresponding to their level of pain or
functionality.

21
Magnetic Resonance Imaging
Magnetic resonance imaging is an excellent tool for analyzing the soft tissues of
the joint. Currently there are experiments underway at our institution attempting to
quantify the microstructure of articular cartilage using a 3T magnet.
Proteoglycan Assay
Synovial fluid aspirations can be analyzed for their molecular content. Important
markers such as chondroitin (4- and 6-) sulfate, keratin sulfate and
matrixmetalloprotienases (MMP) can signify that the joint is experiencing high levels of
catabolism due to cartilage damage.
Viscosity
It has been shown that pathologic changes in joints will result in alterations in the
synovial fluid viscosity [30]. However, in very few studies has viscosity been used as an
outcome measure for OA treatment [9, 14]. If, according to Peyron and Balazs, the loss
of viscoelasticity is directly related to the severity of OA and that by restoring the
viscoelasticity, the joint function can be improved, then viscosity should be a good
correlation to the level of disease. One limitation of viscosity measurements is the
availability of synovial fluid. Pathological joints generally produce larger amounts of
fluid (2-5 mL) than normal joints (0.3 - 1 mL) but the amount available for aspiration is
highly variable even for the same patient. Therefore it would be useful to have access to
a specialized low-volume viscometer to perform viscosity analysis. Such a device has
been developed in our laboratory.

22
CHAPTER 3MATERIALS AND METHODS
Experimental Setup
In this double blind placebo controlled randomized clinical study, 26 subjects
were recruited from a population of patients at the VA. The inclusion criteria were:
1. Diagnosis of OA based on loss of motion associated with pain and loss of joint space
on x-rays compared to the contralateral knee.
2. Currently taking NSAIDs with no relief.
Subjects were excluded if they had surgery on their study knee within ten years prior to
enrollment in study or were currently taking GCS supplements. After providing
informed consent, subjects were randomly assigned to one of two experimental groups,
GCS or Placebo. A commercial formulation of GCS containing 500 mg glucosamine
hydrochloride and 400 mg chondroitin sulfate (GCS; Osteo-Bi-flex®, Sundown
Vitamins®, Boca Raton, FL) was used. The placebo was also manufactured by Sundown
Vitamins® and was identical in appearance to the GCS capsule. Beginning week 0,
subjects were instructed to take three capsules daily. NSAID use was not restricted, but
subjects were asked to keep a “pill diary” to record their level of pain and NSAID
consumption daily.
At the time of enrollment (week 0), all subjects had an MRI taken of their study
knee, filled out SF-36 (pain and functionality questionnaire), performed strength testing
and had their joint aspirated. Aspirations were collected and stored at 0oC for testing at a

23
later date. Subjects returned to the study center at weeks 4, 12, and 20 for follow up, at
each return visit subjects had their knee aspirated and performed strength evaluation. On
the first and last visits, subjects received a MRI of the study knee. In this thesis only the
preliminary viscosity data will be analyzed and discussed.
Strength Testing
Prior to strength testing, range of motion was collected from subjects in the supine
position. Subjects were then allowed to sit in a chair and comfortably restrained to
prevent injury during strength testing. Concentric/concentric knee exercises were
performed on both the study knee and the contralateral knee using a BTE Primus testing
machine. Each test consisted of three sets of five repetitions (knee extension and flexion
= 1 repetition). The resistance of the testing machine for each set was randomly
determined prior to testing using a Latin square method. The peak force exerted and
average work done for each set was recorded.
Magnetic Resonance Imaging
Subjects received a 3T MRI of their study knee. The MRI’s were read by an
experienced radiologist for quantification of articular cartilage microstructure and
documentation of structural changes
Pain Questionnaire
A pain and functionality questionnaire was used to determine the quality of life
change that the subjects experienced.
Proteoglycan Assay
Synovial fluid aspirates was analyzed for proteoglycan content using ELISA
techniques. Proteoglycans are released into the joint by articular cartilage at an
accelerated rate in patients with OA.

24
Viscosity
The viscosity of subjects with less than 0.5 mL synovial fluid was tested using a
unique microrheometer that has been developed in our lab. In subjects that provided
more than 0.5 mL of synovial fluid aspirate, viscosity measurements were also performed
on a Brookfield cone-plate viscometer. Microrheometer measurements were made with a
1.01 mm diameter magnetic iron cylinder (Fisher Scientific) and a 1.61 mm inner
diameter glass sample tube also at 25o C. All cone-plate measurements were made with a
cp-52 cone (3o angle, 0.5 mL fluid) at 25o C. Viscosity was measured at 6 different shear
rates on the cone-plate viscometer to evaluate non- newtonian behavior of the synovial
fluids. The most relevant difference between the two rheometers is that the
microrheometer applies a known force to a cylinder (gravity) and measures the change in
shear rate (falling velocity), whereas the cone-plate viscometer applies a known shear
rate to the sample and measures the torque response through the spindle. Therefore, for
non-newtonian fluids, a correction must be made to compare the apparent viscosity
derived from the microrheometer and that measured from cone-plate viscometer. To
compensate for the difference, the viscosity versus shear rate curve plotted from the cone-
plate viscometer must be extrapolated to the shear rate of the microrheometer and at that
shear rate the two values can be compared. The microrheometer is discussed in much
further detail in the next section.
To validate and calibrate the results from the microrheometer, the viscosity of
standardized newtonian and non-newtonian fluids of known properties was measured
with both the microrheometer and the cone-plate viscometer and the results were
compared. The accuracy of the microrheometer was based on its correlation to the cone-
plate viscometer. The known newtonian fluids tested were standardized oils of differing

25
viscosity. Non- newtonian samples of four different molecular weight (MW) hyaluronic
acids were tested on both devices to determine the feasibility of measuring non-
newtonian viscosity using the microrheometer.
Microrheometer
Background
The Microrheometer is a unique device that was designed to measure the viscosity
and viscoelasticity of small samples of biological fluids. Often in medical applications it
is difficult, if not impossible, to collect large volumes of samples for testing. In response
to this challenge, Tran-Son-Tay [51] developed an acoustically tracked falling ball
rheometer. The theory for this rheometer is based on the Navier-Stokes solution for a
ball falling through a finite tube. By tracking the displacement of the ball with an
ultrasound transducer, the falling velocity can be calculated. Since the diameter of the
ball, the diameter of the tube, the density of the ball and the density of the fluid are
known, the viscosity can be calculated. By oscillating the ball with an electromagnet, the
phase shift between the input current to the magnet and the motion of the ball can be
determined and correlated to the viscoelastic components of the fluid. The
microrheometer setup has recently been modified by replacing the ball with a magnetic
cylinder to allow for more consistent applied shear rate.
The most common viscometers and rheometers presently in use are those based
on the measurement of stress on a fixed surface while a parallel or opposing surface is
moved with a known applied strain rate. However, as already mentioned, these devices
require fairly large sample volumes. Often in medical applications it is difficult, if not
26
impossible, to collect large volumes of samples for testing. The Microrheometer (Figure
3.1) is a unique device that was designed to measure the viscosity and viscoelasticity of
small samples of biological fluids by using a spherical steel ball that is concentrically
located in a small cylindrical tube with a volume of about 20 µL. The ball falls either
under the force of gravity or is levitated and oscillated with a force produced by a
magnetic field. The position of the ball is tracked by ultrasonic pulse-echo method.
Furthermore, the small volume permits accurate temperature control and rapid
temperature changes to be effected in the sample under study. Recent modifications have
been made to the microrheometer so that a constant shear rate will be exhibited across the
fluid, that is, a falling cylinder is used in place of a ball.
Apparatus
A 20 µL sample is loaded, by retrograde injection, into a disposable glass tube
with an inner diameter of 1.6 mm and a height of 10 mm. Once loaded, the tube is
centered inside a cylindrical, Plexiglas, water-jacket chamber. The ultrasonic transducer
is housed at the bottom center of the Plexiglas chamber. An O-ring forms a watertight
seal with the base of the sample tube and with the transducer. A plastic cap is screwed
into place at the top of the chamber and provides a seal that completely protects the
sample. A schematic of the microrheometer is given in Figure 3.1.

27
Figure 3.1. Schematic of Microrheometer (a – sample tube, b – cylinder, c –piezoelectric crystal, d – ultrasound transducer, e – water jacket, f – electromagnet).
A small electromagnet coupled with a micromanipulator is used to position and
drop a 1.01 mm diameter cylinder in the center of the tube, where the strongest echo
occurs. The pulse-echo mode is used to locate and track the falling cylinder. A single
sound pulse is transmitted into the fluid medium by pulsing an ultrasound transducer that
also acts as a receiver. Any returning echoes from the cylinder cause a voltage rise
across the transducer that is amplified by the ultrasonic pulser/receiver unit (Panametrics
5052 PR). Figure 3.2 shows the main bang followed by a pulse reflected from the top of
the cylinder. The time for the sound waves to travel to and back from the cylinder, and

28
the speed of sound in the fluid are measured. From that information, the distance
between the transducer and the cylinder, i.e., the location of the falling cylinder, is
determined.
Figure 3.2. Main bang is the large signal on the left, the echo of the cylinder is thesmaller signal on the right (tf – time of flight, time for ultrasound pulse to travel to thecylinder and back to the transducer.)
Experiments
Two types of measurements can be performed with the microrheometer: (1) a
speed-of-sound evaluation, and (2) a steady state viscosity. The parameters of interest
are c, the local speed of sound in the medium and η, the bulk suspension viscosity.
Speed of Sound. In order to measure the speed of sound in the fluid, the
instrument needs to be calibrated. To accomplish this, the sample chamber is first filled

29
to the top with distilled water and then capped with a glass cover slip to assure a fixed
sample height h. This distance is given by
222 )( ohohf CT
h∗
= (3.1)
where )( 2ohfT is the measured time of flight for the sound to travel to the top of the sample
chamber and back in distilled water, and ohC2
is the known speed of sound in water.
Once the chamber height is determined, the water is removed and replaced by the fluid
sample. The local speed of sound in the medium Cf is then determined by the
relationship
ff T
hC
∗=
2(3.2)
where Tf is the measured time of flight in the fluid sample.
Viscosity. The fluid viscosity is determined from the speed of sedimentation of
the falling cylinder, Figure 3.3. The method used to determine the falling velocity of the
cylinder is presented in Appendix A.

30
Figure 3.3. Oscilloscope plot of the cylinder’s displacement vs. time as it falls throughthe sample tube. The arrow indicates the path of the cylinder. From this output the speedof sedimentation (of falling velocity) of the cylinder is measured.

31
CHAPTER 4RESULTS
Microrheometer Validation
Results from the preliminary calibration and validation experiments that were
carried out on the microrheometer and the Brookfield cone-plate viscometer are
presented in Tables 4.1 and 4.2. The viscosities determined from both devices are quite close
to the specified standards for each fluid. The microrheometer has greater measurement
variability than the cone-plate viscometer. Shear rate, γ& , for the microrheometer was
calculated based on the falling velocity, ν , and the gap between the cylinder and the
sample tube wall, h, using the following equation: hν
γ =& . Due to the inherent properties
of the microrheometer, it is not possible to control shear rate therefore each fluid will be
sheared at a different rate. The accuracy of the microrheometer was established by
comparing it to measurements of the same fluids made with the cone-plate rheometer. In
the newtonian fluids, summarized in Table 4.1, the viscosity is independent of shear rate.
However in the non-newtonian fluids Table 4.2 confirms the dramatic effect of shear
thinning, where the viscosity decreases as the shear rate increases. Shear rate is plotted
against viscosity for four non-newtonian HA samples (Hylan A, Biomatrix, NJ) in Figure
4.1. The viscosity of non- newtonian HA samples measured on the cone-plate viscometer
correlates well to what has been reported in the literature Figures 4.2 and 4.3.

32
Table 4.1. Newtonian fluids tested on both the microrheometer (MR) and the cone-platerheometer (CP). N is the number of samples tested on the MR. SD is the standarddeviation of the MR viscosity measurement. Accuracy = ((MR-CP)/CP*100%).Variability = SD/MR viscosity*100%.Fluid CP Viscosity
(cp)N MR Viscosity
(cp)SD Accuracy % Variability %
1000 1005 16 1067 87 6.16 8.15
3000 3085 17 3274 241 6.13 7.36
10000 9549 37 9442 1564 -1.12 16.56
12500 12120 16 10560 960 12.87 9.09
Table 4.2. Non-Newtonian HA fluid tested on both the microrheometer (MR) and cone-plate viscometer (CP). MR shear rate is given for the measured viscosity. HA was testedover a range of shear rates in the CP.
MR CPShear Rate (1/s)
Fluid ShearRate (1/s)
Viscosity(cp)
1 2 5 10 20 40 100 200
0.75M MWHylan A(1.1%PolymerContent)
4.82 296.5 393.2 294.9 275.2 275.2 265.4 250.7 214.3 179.9
2M MW HylanA (1.0%PolymerContent)
0.162 8985 10810 8650 5780 3952 2536 1558 792.3 466.9
4M MW HylanA (1.0%PolymerContent)
0.0105 170200 79030 43350 18830 9339 4925 2644 1121 581
5M MW HylanA (1.0%PolymerContent)
0.0064 244000 81890 46690 20960 10640 5583 3018 1292 670.4

33
Figure 4.1. Viscosity plotted against shear rate for non-newtonian HA samples tested onthe cone-plate viscometer (log-log plot).
High molecular weight HA samples showed significant shear thinning effects,
however, the 0.75 M molecular weight fluid displayed nearly newtonian behavior. It is
expected that the rheological properties of high molecular weight HA solutions are
representative of synovial fluid from healthy joints.
1
10
100
1000
10000
100000
1 10 100 1000
Shear rate (1/s)
Vis
cosi
ty (
cp)
0.75 M MW
2 M MW
4 M MW
5 M MW
34
Figure 4.2. Viscosity of 4M MW Hyaluronic acid plotted against shear rate. Source:[40]
100
1000
10000
100000
1000000
1 10 100 1000Shear Rate (1/s)
Vis
cosi
ty (
cp)
Figure 4.3. Viscosity of 4M MW HA plotted against shear rate. Measured usingBrookfield cone-plate viscometer.

35
Clinical Data
This thesis is a preliminary evaluation of the synovial fluid viscosity from the first
14 subjects enrolled in the study. A summary of the results from synovial fluid testing on
the cone-plate viscometer is presented in Table 4.3. In some patients it was impossible to
draw any volume of fluid, thus there is no way to determine synovial fluid viscosity at
those time points. Due to these missing data points, all subjects could not be compared
over all time points. This problem was dealt with in the following method: treatment
effect was defined as the change in viscosity (cone-plate, 1/s) between the earliest and the
latest time available time point divided by the earliest viscosity. Treatment effect was
calculated for each patient. Positive values mean that the synovial fluid viscosity
increased and negative values mean that the synovial fluid viscosity decreased. A second
analysis was made of only subjects from which both week 0 and week 4 data were
available. This analysis is presented in Table 4.4.
Viscosity data from a representative subject is shown in Figure 4.2 (the only subject
from whom synovial fluid was obtained at each visit). Notice that the viscosity initially
decreases over the fist 12 weeks, but then increases over the next 11 weeks.

36
Table 4.3. Changes in synovial fluid viscosity between first and last sample (cone-plateviscometer, shear rate = 1/s) for both experimental groups. Effect size = change/baselineviscosity. a Two subjects in the placebo group withdrew from the study, one to due aTKA, the other due to lack of benefit from study medication. b Effect size is notstatistically different (t=0.45).
GCS(n=8)
Placebo a
(n=3)Increased 25.0% 0.0%
No Change 12.5% 66.6%
Decreased 62.5% 33.3%
Effect Size b
Mean (SD)0.04 (0.83) -0.29 (0.51)
Table 4.4. Change in synovial fluid viscosity between week 0 and 4. c One subject inplacebo group withdrew due to TKA. d Effect size is not statistically different (p=0.50).
GCS(n=5)
Placebo c
(n=2)Increased 40.0% 0.0%
No Change 20.0% 100.0%
Decreased 40.0% 0.0%
Effect Size d
Mean (SD)0.22 (0.867) 0.0 (0.0)

37
1
10
100
1000
1 10 100 1000
Shear Rate (1/s)
Vis
cosi
ty (c
p)
week 0
week 4
week 12
week 23
Figure 4.2. Shear rate versus viscosity for a subject in GCS group. This particularsubject experienced a decrease in viscosity the first 12 weeks which somewhat recoveredby week 23. Notice that the fluid displays newtonian behavior at low shear rates at week12.

38
CHAPTER 5DISCUSSION
Microrheometer
The validation of the microrheometer revealed that the device is fairly accurate in
measuring the viscosity of newtonian fluids, as compared to a cone-plate rheometer. An
unexpected improvement for the microrheometer was conceived during testing on highly
viscous fluids. A new method was created in to adjust the shear rate at which fluids are
tested. By generating an external magnetic field, an increased force can be applied to the
magnetic cylinder. Varying the current that supplies the electromagnet will allow the
shear rate to be adjusted. This concept was included in the theory for a closed form
solution for a falling cylinder [41] as a “local density” term (Appendix A). In most
samples (29 out of 34) it was possible to evaluate the synovial fluid using the cone-plate
viscometer, which allowed accurate plotting of viscosity versus shear rate measurements.
Clinical
At four weeks, patients taking GCS had a 22% increase in synovial fluid viscosity
compared to no change in patients on placebo. Also, at later time points it was found that
patients on placebo had a decreased viscosity while patients taking GCS had not changed.
However these differences are not statistically significant (p= 0.5, p=0.45 respectively).
In addition it was noted that synovial fluid exhibits shear thinning behavior.

39
The results indicate a need for a study with a larger number of subjects. The trend
observed, nevertheless, suggests that GCS may have a beneficial effect on some patients,
resulting in an initial increase in viscosity over the first month of treatment and
eventually returning to pretreatment condition after that
These results fit well with what has been reported elsewhere. Glucosamine and
chondroitin are touted as a “cure for arthritis” in the lay literature [42]. Theodasakis is
partly responsible for the current vogue of GCS supplements for OA. In his popular
book, he extols the benefits of GCS and supplies bountiful anecdotal evidence of their
effectiveness. Indeed, a number of clinical trials have found that GCS supplements have
at least a modest effect on the symptoms of OA [39, 43-48], but the scientific community
remains divided concerning the efficacy of GCS [49]. In a recent review by McAlindon
and colleagues [34] 17 clinical trials evaluating either glucosamine or chondroitin were
identified in the literature. They analyzed the quality of 15 of the studies using
standardized methods and compared the effects of treatment using predetermined
significant outcomes. McAlindon found that clinical trials demonstrate glucosamine and
chondroitin to have a modest to large effect, but cautioned that methodological flaws may
exaggerate the benefit. In particular a trend developed that higher quality studies
reported smaller effects compared to lower quality studies. This has been a common
theme in the criticism of GCS clinical studies. It is interesting to note McAlindon’s
treatment of the one clinical trial conducted in North America [39]. In this study, Houpt
concludes that glucosamine hydrochloride is not effective in relieving OA pain as
compared to placebo. However in the McAlindon meta-analysis, the Houpt study is
presented as having a small to moderate effect on improving pain. This discrepancy is
40
presumably attributable to the structured and systematic review protocol applied by
McAlindon, yet the strikingly contrary conclusions seem dubious on McAlindon’s part.
The study by Houpt is unique in several regards: it is the only published clinical study
trial conducted in North America, it is the only study to evaluate the glucosamine
hydrochloride formulation, and it is the only study that does not report improvement in
subjects taking glucosamine. It is possible that the formulation of the study compounds
has an effect on the efficacy, especially since in North America glucosamine and
chondroitin are considered nutritional supplements and therefore not as strictly regulated
as pharmaceuticals. In Europe and Asia, glucosamine and chondroitin are classified as
pharmaceuticals thus ensuring that quality is held to a higher standard.
In an interesting study that has been published after McAlindon’s review,
Reginster, et al. [36] it was found that joint space in subjects taking GCS did not change
over the course of a 3 year treatment compared to the placebo group which experienced
significant joint space narrowing. This study is important due to its large sample size,
106 subjects per group, and long term follow up, 3 years. However, the use of standing
film x-rays has been called into question due to alignment problems that may alter the
measurements of joint space and due to bias introduced by pain in the joint causing
subjects to have difficulty standing in a standardized position. This study is also valuable
because it demonstrates the long-term safety of GCS.
There are three main arguments against the use of GCS in the treatment of OA:
lack of definitive proof of the mechanism of action, quality of clinical trials to date and
regulatory issues concerning purity and optimal compound dosaging [49]. GCS is
theorized to work by supplying the joint with the rate limiting compound in cartilage
41
synthesis. By increasing the amount of building blocks of cartilage, it is assumed that the
production of cartilage will increase. Since most GCS studies have only evaluated the
oral formulation of the compound, it also must be clearly demonstrated that the active
agents can be absorbed by the intestine, without being degraded, and then reach the joint
in significant amounts. Clinical trial quality has been questioned primarily because
nearly all have been sponsored by GCS manufacturers. In fact most have been sponsored
by the same Italian pharmaceutical company, Rotta. In response to this issue, the
National Institutes of Health has recently funded a clinical trial of GCS, which will most
likely be of the highest quality. Due to its classification as a dietary supplement is the
US, GCS is not regulated by the Food and Drug Administration as are pharmaceuticals.
Therefore until universal standards are adopted and enforced, the quality of GCS
products sold in the US cannot be ensured.
As mentioned earlier, the high viscosity of synovial fluid is caused by the
presence of long chains of chains of hyaluronic acid (HA). In a diseased joint, where
cartilage is being destroyed, enzymes are released that break down HA, thus reducing the
viscosity of synovial fluid. Since glucosamine is a constituent of HA, providing more
glucosamine to the joint may increase the production of HA. However, this mechanism
has not been definitively proven and the mechanism of action, indeed if any, of GCS
remains unclear. In addition to beneficial viscoelastic properties, HA is thought to also
have an analgesic effect by insulating the pain fibers in the synovium [50]. Although at
this time it appears as if the synovial fluid viscosity is not affected by GCS, it is possible
that other symptoms, such as pain and joint space may respond to treatment.

42
Since this is the first trial to use viscosity as an outcome measure in a GCS study,
there is no data in the literature available to compare. In fact there have only been two
studies identified that used viscosity as a measurement for any treatment. In one trial, the
viscosity of fluid from four joints was measured before and one week after HA (Healon)
injections [9]. They found that the viscosity increased by about 15% after treatment. In
this study no placebo was used. Synovial fluid from normal donors was also tested
however, all but three of these samples had to be pooled due to low volume.
Additionally, this study only measured the intrinsic viscosity of the fluid. Intrinsic
viscosity is measured at a defined shear rate on consecutively diluted samples and is the
value obtained by extrapolating the resulting curve to 0 concentration [38]. The intrinsic
viscosity is useful in measuring the rheological properties that are not dependent on
concentration, but it is difficult to relate this value to what has been reported elsewhere.
In the second study that examined viscosity [14] viscosity was measured in 20 patients
before and after receiving 5 weekly injections of HA (Hyalgan) or saline. The viscosity
of the HA group increased relative to baseline, but was unaltered in the saline group.
During the course of the trial two subjects have withdrawn. Both were in the
placebo group. One subject received a total knee arthroplasty in the study knee. The
second subject withdrew due to lack of efficacy of treatment. This subject had an 88%
decrease in synovial fluid viscosity, the largest decrease in either group. No adverse
events were reported for either group.
This study has several limitations. The population that was selected for this study
consisted of patients with severe OA, to the point that their physician has suggested a
total knee arthroplasty. It is generally accepted that GCS is most effective in subjects

43
with mild OA. Therefore, the disease state of this population may have progressed
beyond the realm of efficacy of GCS before the study began. Another limitation of this
study is that at some time points it was impossible to aspirate any of synovial fluid from
the subjects (in only one subject was synovial fluid collected at all time points), thus
making viscosity testing impossible at those time point. This loss of data led to
incomplete analysis over the total 20-week course of the study. Since this thesis is an
interim analysis of the data, it is likely that during the conclusion of the trial additional
data will be collected, thus providing a more complete picture of the effects of GCS. The
synovial fluid collected before July 1, 2000 was stored in plain plastic test tubes. All
later synovial fluid was stored in EDTA tubes. An analysis was done to determine if the
EDTA had an effect on viscosity. GCS and placebo groups were equally mixed between
the two different tubes. There was no difference between the mean viscosity (cone-plate,
1/s) of synovial fluid in the plain tubes and that in the EDTA tubes (p=0.45). At this time
only the viscosity data has been analyzed, therefore it is not yet possible to evaluate the
clinical effects of GCS. It will be interesting to determine how the viscosity data relates
to clinical parameters such as pain and joint space. To date there have been no studies
that have attempted to correlate viscosity to clinical symptoms of OA, making this
contribution significant.

44
CHAPTER 6CONCLUSION
From this study two primary conclusions can be drawn. Although not statistically
different, there are observable changes to the synovial fluid viscosity after GCS
consumption at this interim analysis. More patients need to be enrolled to allow stronger
conclusions. Also, the microrheometer has been shown to be a valuable instrument for
measuring viscosity when only small fluid volumes are available. The novel concept of
altering the shear rate of the microrheometer using an external magnetic field promises to
be a valuable development in the analysis of synovial fluid due to its non- newtonian
nature. This research demonstrates the feasibility of using synovial fluid viscosity as an
outcome measure for OA trials.
Obviously the next step in this research is to compete enrollment of subjects for
the current study and to evaluate the remainder of the data at study conclusion. At that
time all of viscosity data will be compiled and re-analyzed. A more complete picture of
the efficacy of GCS will be drawn once all clinical outcomes are analyzed.
Modifications are being made to the microrheometer that will enable the measurement of
viscoelastic properties of synovial fluid. Viscoelasticity can be calculated by oscillating
the magnetic cylinder within the fluid using a function generator wired to an
electromagnet and measuring the phase shift between the applied current to the
electromagnet and the response of the magnetic cylinder. This will be an important step,

45
since viscoelastic properties of synovial fluid may play an even greater role in joint
mechanics and lubrication than viscosity. A separate improvement is being developed
that will allow the shear rate of the microrheometer to be adjusted. This will be
accomplished by pulling the magnetic cylinder through the fluid in the sample tube with
an electromagnet. By adjusting the current supplied to the electromagnet, the force by
which the magnet is pulled can be changed thus changing the shear rate. The difference
in applied electromagnetic force from that of gravity will be accounted for in a “magnetic
density’ term in the viscosity equation derived Cristescu [41].
Further clinical trials need to be conducted to establish viscosity as a reliable
outcome measure for OA. It remains to be determined how sensitive viscosity is to
changes in clinical symptoms. It would be interesting to track the changes in synovial
fluid viscoelasticity over the natural course of disease to better determine how abnormal
lubrication relates to cartilage degeneration. In future work it would useful to complete
more in depth analysis on normal synovial fluid in an attempt to elucidate the properties
that enable it to be such an effective lubricant. The variation in normal and diseased fluid
needs to be examined more closely, so that significant changes in viscosity can more
accurately be detected. In order to accomplish this, it will be necessary to do long term
studies on large groups.
Due to the questions that have been raised concerning many of the previously
conducted clinical trials, much work remains to be done to complete high quality, long
term, independent trials with reliable outcome measures. The NIH has recently funded
such trials and the results will be received with great interest. Considerable work also
remains to elucidate the precise mechanism of action of GCS. Specifically, the
46
biochemical interactions that take place at the cellular level between GCS and
chondrocytes, synoviocytes and fibroblasts must be explained. Also, the roles of
aggrecan, lubricin and HA are only crudely understood and it must be determined if their
synthesis is affected by GCS. The process of cartilage regeneration is an important area
in the search for a cure for OA and whether GCS is capable of stimulating synthesis or
whether it is merely an analgesic compound is an important question. Such studies will
most likely involve animal models, and therefore more reliable animal models need to be
developed. The current gold standard OA animal model, ligamentously unstable dogs, is
unlikely to accurately reflect the progression of the disease in humans.

47
APPENDIX AFALLING CYLINDER THEORY
Formulation of the Problem.
In what follows we use cylindrical coordinates and bodies the
notations shown on the figure we use: cρ - cylinder density, ρ - fluid density, v1 -
velocity of cylinder.
Assumptions made are:
A1. The flow is laminar and telescopic; the velocity components are
)r(fvv,vv zr ==== 0θ (A.1)
with 22 yxr += .
A2. The boundary conditions at the cylinder wall
( ) 1110 vRv:Rr,t −==≥ (A.2)
i.e. the fluid adhere to the cylinder wall.
A3. The boundary condition at the tube wall:
( ) 00 22 ==≥ Rv:Rr,t (A.3)
i.e., the fluid adhere to the tube wall.
A4. The fluid is a Newtonian viscous fluid:
ij'
ij DT η2= (A.4)

48
where 'ijT is the Cauchy stress deviator, ijD is the strain rate tensor and η the
viscosity coefficient, may be depending on z, if the fluid is nonhomogeneous.
Taking into account (A.1) the only nonzero strain rate component is
( )r'fDrz 21
= (A.5)
and from (A.4) we get for the stresses
( ) ( )r'fzT,TT,TTT rzrzzzrr ησ θθθθ ====== 0 . (A.6)
Since v is varying with r and assuming that this variation is of the kind shown in
Fig.A.1, we expect for rzT :
orrRifpositive <<1
( ) isrv
zTrz ∂∂
= η 2Rrrinnegative o << (A.7)
orrfor =0
if at orr = the velocity reaches a maximum and the stress rzT is zero.
From the equilibrium equations written in cylindrical coordinates, since the
problem is with cylindrical symmetry, follows for our case:
,r
0=∂∂
=∂∂
θσσ
0=++∂∂
+∂
∂z
rzrz br
Tzr
Tρ
σ(A.8)
where zb is the body force component. Thus ( )zσ depends on z alone, and
from the last equation (A.8) and (A.6) we get

49
( ).rb
zdd
dr'frd
z 0=
++ ρ
ση (A.9)
Integrating once with respect to r, we get
rCr
bzd
dT zrz
1
2+
+−= ρ
σ(A.10)
Integrating a second time with respect to r we obtain
21
2
4CrlnC
rb
zdd
f z +=
++ ρ
ση . (A.11)
The integration constants can be determined from the boundary conditions A2 and
A3
1
2
21
22
1
1
4
RR
ln
RRb
zdd
v
Cz
−
++
=
ρσ
η
,
2
1
2
21
22
122
2 lnln
44
R
RR
RRb
zdd
vR
bzd
dC
z
z
−
++
−
+=
ρσ
η
ρσ
(A.12)
Thus the velocity distribution is obtained as
2Rrln
4
21R2
2Rzb
zdd
1v
1R2R
ln
14
2r22R
zbzd
dv
−
+++
−
+= ρ
σηρση (A.13)
if the viscosity coefficient is known and zd/dσ is the pressure gradient along
the tube.

50
Let us write now a global equilibrium condition for the cylinder: the projection on
the z-axis of all forces acting on the cylinder are zero; i.e. gravitational force + buoyancy
force + shearing force on the cylinder wall = 0. Thus
rzT ? 1R = ( )mcg21R
+− ρρ (A.14)
with m the “local density” of the magnetic force. With (A.9) this relation
becomes
( )[ ]mcg1R2R
ln2
21R
4
21R2
2R
1R2R
ln2
21R
zbzd
d1v +−+
−−
+= ρρρση (A.15)
which is a relation between 1vη , zbzd
dρ
σ+ and m.
Velocity Profile for Open Tube
First let us consider an open vertical tube (or an “infinite” tube) in which can
move a heavy cylinder and a pressure gradient exists. Let us assign various values to the
pressure gradient zd/d σ in order to find out the various possible velocity profiles.
Example 1. From (A.14) follows that if the pressure gradient satisfies the relation
( )[ ]
4
21R2
2R
1R2R
ln2
21R
mcg1R2R
ln2
21R
bzd
d
−−
+−−=+
ρρρ
σ (A.16)

51
the cylinder is stationary ( 01v = ). In other words under this pressure gradient the
shearing forces of the fluid flowing upwards will keep stationary the cylinder. Figure A.2
shows an example computed for 2/005.1 msN=η (1005 cP) and
zbzd
dρ
σ+ 141036.9 −×= mPa . (A.17)
The velocity distribution shown was obtained with (A.12).
Example 2. If the pressure gradient is greater than that obtained from (A.16), the
shearing force of the fluid flowing up is able to move upwards the cylinder. In order to
give an example, Figure A.3 is showing the velocity profile of the fluid for
.102.1 15 −××=+ mPabzd
dzρ
σ If this term reaches the value 1mPa6101 −×× the
velocity of the fluid in contact with the cylinder is equal with that of the cylinder itself.
This case can be obtained from (A.12) by putting the condition that the maximum
velocity of the fluid be reached for 1Rr = .
Example 3. This example considers the most common case when term
( ) zbzd/d ρσ + has a smaller value than that obtained from (A.15). Figure A.4 shows an
example obtained with the value ( ) zbzd/d ρσ + = 14100.8 −× mPa and same η as
before. In this case most of the fluid is moving upwards, but a thin layer of fluids
neighboring the cylinder, the fluid is moving downwards. In the present example ? 1v ?
= 0.000528 m/s (down) is obtained from (A.14).

52
Example 4. The last example corresponds to very small values for
( ) zbzd/d ρσ + . Let us consider the case when the pressure gradient is zero .0zd/d =σ
Introducing this value in (A.14) together with
×= 2s2m/(kg310807.9gρ and same
value for η as above, we get
smv /00363.01 −= (down). The velocity profile follows from (A.12). This time
the falling cylinder induces into the fluid a shearing stress which will put it to flow
downwards (see Figure A.5). The velocity of the fluid in contact with the tube is
certainly zero.
Velocity Profile for Closed Tube
Let us consider now the case when the bottom of the tube is closed and the
pressure gradient is generated by the falling cylinder (Figrs.A.6 and A.7). We can write
down the condition that the volume of the fluid displaced by the falling cylinder is equal
to the volume of the fluid flowing (up and down) between the cylinder and the tube:
211
2
1
2 RvdrrvR
R
ππ =∫ . (A.18)
Introducing here )( fv = from (A.11) we get
21121
32
1
ln4
2RvdrrCrrC
rb
zddR
Rz =
++
+−∫ ρ
ση
(A.19)
with the values of 1C and 2C from (A.14) and the notations

53
( )2
1
2
221
22
21
22
2212
122
2
1
2
21
22
41
42 ln
ln82441
2ln
41
2ln
ln416R
RRRRRRRR
RR
R
RRRRRR −
−−
+
−−
−
−+
−−=Σ
22ln
ln41
2ln
41
2ln
ln
1 21
21
22
1
2
2121
222
1
2
RRR
RRRR
RR
R
RR
V +−
+
−−
−−= (A.20)
we finally obtain
1vV
bzd
dz ηρ
σΣ
=+ (A.21)
which established another relationship between 1vη and ( ) zbdzd ρσ +/ ,
obtained from a kinematic assumption. However, the term 1vη as obtained from (A.21)
and from (A.15) must be equal. From this condition follows
( )[ ]
4ln
2
ln2
21
22
1
221
1
22
1
RRRRR
V
mgRRR
bzd
d c
z −+−
Σ
+−=+
ρρρ
σ(A.22)
This relation determines zbzdd ρσ +)/( . The magnetic force is involved as a
“local density”, i.e. if pushing down it is equivalent with a heavier cylinder. After
calibration, this observation will be used to speed up some tests with very viscous fluids,
and using the very same magnetic cylinder. Introducing this value into (A.21) we obtain a
formula for the determination of the viscosity coefficient
+
Σ= zb
zdd
vVρ
ση
1
. (A.23)
We can consider the expression

54
βα
4ln
2
ln2
21
22
1
22
1
1
221
RRRRR
V
RR
gR
V −+−
ΣΣ
= (A.24)
to be a viscometer constant. We have introduced β as a correction parameter,
mainly because the cylindrical magnet has sometimes no perfect cylindrical shape, and
also to take into account the end effects. Thus the formula for the determination of the
viscosity coefficient (A.23) writes
1v
mc +−=
ρραη . (A.25)

55
APPENDIX BRAW DATA
Table B.1. Raw data from synovial fluid.
Patient TreatmentStudy
NumberJoint Fluid
Volume Temp.
During Test Fluid Appearance Week Date - Aspiration 1 2 5 10 20 40 100 200
ld1 p 1 0 3/2/00ld2 p 1 4 3/27/00ld3 p 1 12 5/25/00ld4 p 1 10 ml 25.5
bright yel mostly clear 19 7/13/00 196.6 196.6 118 98.3 68.8 49.2 31.5 22.6
Changefh1 p 2 6.2 ml 25 light yel cloudy 0 3/2/00 196.6 294.9 157.3 118 78.6 59 35.4 26.5fh2 p 2 6.2 ml 24.5 light yel cloudy 4 3/27/00 196.6 196.6 118 98.3 59 44.2 29.5 21.6
fh3 ***** **** *** ***Drop Out due to TKA *** ***
Change 0 -98.3 -39.3 -19.7 -19.6 -14.8 -5.9 -4.9ka1 gcs 3 .5 ml 25.5 pale pink 0 4/4/00 1179.6 786.4 550.5 393.2 275.2 181.9 106.2 69.8ka2 gcs 3 1.5 ml 25.5 bright red 6 5/16/00 786.4 688.1 471.8 334.2 235.9 157.3 92.4 60.9ka3 gcs 3 13 7/17/00ka4 gcs 3 20 9/7/00Change -393.2 -98.3 -78.7 -59 -39.3 -24.6 -13.8 -8.9
fr1 gcs 4 tracered dry not enough to test 0 4/4/00
fr2 gcs 4 8.2 ml 25pale yel. Slightly cloudy 6 5/16/00 393.2 294.9 196.6 137.6 88.5 59 37.4 25.6
fr3 gcs 4 2.3 cm 25.5 pale yel. Clear 26 9/19/00 196.6 196.6 118 98.3 68.8 49.2 33.4 23.6Change -196.6 -98.3 -78.6 -39.3 -19.7 -9.8 -4 -2jd1 gcs 5 1-2 drops reddish MR 0 4/13/00jd2 gcs 5 4.5 ml 25.5 yel. Fairly clear 12 6/22/00 393.2 393.2 275.2 196.6 137.6 98.3 61 41.3jd3 gcs 5 1.3 cm 26 yel. Very clear 21 9/7/00 196.6 98.3 78.6 59 49.2 34.4 27.5 20.6Change -196.6 -294.9 -196.6 -137.6 -88.4 -63.9 -33.5 -20.7aa1 gcs 6 0 0 4/18/00aa2 gcs 6 5.0 ml 24.5 pale translu. Yel. 6 6/1/00 983 688.1 471.8 314.6 196.6 122.9 68.8 45.2aa3 gcs 6 2.8 cm 26.5 pale translu. Yel. 14 7/31/00 196.6 196.6 118 98.3 78.6 63.9 43.3 31.5Change -786.4 -491.5 -353.8 -216.3 -118 -59 -25.5 -13.7aa4 gcs 6 2.8 cm 25.5 pale translu. Yel. 19 8/29/00 196.6 196.6 117.96 98.3 88.47 63.6 45.22 33.4Change -786.4 -491.5 -353.8 -216.3 -108.1 -59.3 -23.58 -11.8
Shear RateViscosity1

56
wz l - non study knee 8 9 ml 25.5 light yel 0 5/2/00 196.6 196.6 118 78.6 59 44.2 27.5 19.7
wz1 gcs 8 7.7 ml 24.5 light yel 0 5/2/00 983 688.1 471.8 314.6 196.6 122.9 68.8 45.2wz2 gcs 8 5.5 ml 25.5 light yel 4 6/6/00 786.4 491.5 353.9 235.9 147.5 98.3 57 37.4Change -196.6 -196.6 -117.9 -78.7 -49.1 -24.6 -11.8 -7.8
wz3 gcs 8 5.1 cm 24light yel, ver slight pink tinge 12 8/15/00 196.6 196.6 157.3 118 88.5 68.8 45.2 31.5
Change -786.4 -491.5 -314.5 -196.6 -108.1 -54.1 -23.6 -13.7wz4 gcs 8 3.5 cm 26 light yel 23 10/12/00 786.4 589.8 393.2 255.6 167.1 108.1 61 40.3Change -196.6 -98.3 -78.6 -59 -29.5 -14.8 -7.8 -4.9
dw1 gcs 9 3.8 ml 26pale yel. Slightly cloudy 0 5/4/00 598.8 393.2 314.6 216.3 137.6 93.4 57 38.3
dw2 gcs 9 1.5 ml 26 very pale yel. Clear 4 6/1/00 786.4 688.1 432.5 314.6 206.4 132.7 74.7 49.2Change 187.6 294.9 117.9 98.3 68.8 39.3 17.7 10.9dw3 gcs 9 0 8 6/30/00
dw4 gcs 9 .5 cm 26.5
pale yel. Clear. Bubbles due to small volume 19 9/14/00 1376.2 983 598.8 373.5 245.8 152.4 84.5 55
Change 777.4 589.8 284.2 157.2 108.2 59 27.5 16.7bm1 gcs 11 0 0 6/6/00
bm2 gcs 11 .3 cmred clear must test on MR 4 7/10/00
bm3 gcs 11 .4 cm
red some what clear must test on MR 13 9/19/00
bm4 gcs 11 .4 cmpale yel clear must be tested on MR 20 11/14/00
cm1 p 12 1.7 ml 25light pink somewhat cloudy 0 6/20/00 1769.4 1277.9 786.4 530.8 353.9 226.1 125.8 80.6
cm2 p 12 1.7 cm 25yel/orange slighty cloudy 11 9/1/00 196.6 196.6 118 118 88.5 73.7 53.1 41.3
cm4 ***** **** *** ***Drop Out at request of patient *** ***
Change -1572.8 -1081.3 -668.4 -412.8 -265.4 -152.4 -72.7 -39.3
jb1 p .7 cm 26pale yel clear *reused for MR 0 4/12/01 786.4 589.8 353.9 255.6 176.9 118 68.8 45.2
jb2 p .6 cm 25.5 pale yel clear 4 5/10/01 786.4 589.8 393.2 275.2 186.8 122.9 74.7 49.2Change 0 0 39.3 19.6 9.9 4.9 5.9 4ss1 gcs 1.2 cm 26 pale orange clear 0 4/12/01 589.8 393.2 275.2 176.9 118 78.6 45.2 30.5ss2 gcs 2.2 cm 25.5 pale orange clear 4 5/10/01 589.8 393.2 235.9 176.9 108.1 73.7 43.3 29.5Change 0 0 -39.3 0 -9.9 -4.9 -1.9 -1w1 p 15 .7 cm 26 pale yel. Clear 0 4/13/01 196.6 196.6 157.3 118 88.5 63.9 39.3 28.5
w2 p 15 .4 cmvery pale yel. Clear must test on MR 4 5/11/01
a1 gcs 17 .6 cm 25.5
bright red some bubbles due to small vol 0 4/13/01 589.8 393.2 235.9 176.9 108.1 73.7 43.3 29.5
a2 gcs 17 1.0 cm 25 red/orange clear 4 1376.2 1081.3 707.8 471.8 304.7 191.7 106.2 66.8Change 786.4 688.1 471.9 294.9 196.6 118 62.9 37.3

57
1
10
100
1000
1 10 100 1000
Shear Rate (1/s)
Vis
cosi
ty (c
p)
Week 19
Figure B.1. Viscosity versus shear rate for patient ld.
1
10
100
1000
1 10 100 1000
Shear Rate (1/s)
Vis
cosi
ty (
cp)
week 0week 4
Figure B.2. Viscosity versus shear rate for patient fh (fh withdrew from study due toreceiving a total knee replacement after week 4).

58
1
10
100
1000
10000
1 10 100 1000
Shear Rate (1/s)
Vis
cosi
ty (c
p)
week 0week 6
Figure B.3. Viscosity versus shear rate for patient ka.
1
10
100
1000
1 10 100 1000
Shear Rate (1/s)
Vis
cosi
ty (c
p)
week 6week 26
Figure B.4. Viscosity versus shear rate for patient fr.

59
1
10
100
1000
1 10 100 1000
Shear Rate (1/s)
Vis
cosi
ty (c
p)
week 12week 21
Figure B.5. Viscosity versus shear rate for patient jd.
1
10
100
1000
1 10 100 1000
Shear Rate (1/s)
Vis
cosi
ty (c
p)
week 6week 14week 19
Figure B.6. Viscosity versus shear rate for patient aa.

60
1
10
100
1000
1 10 100 1000
Shear Rate (1/s)
Vis
cosi
ty (
cp)
week 0week 4week 12week 23
Figure B.7. Viscosity versus shear rate for patient wz (the only patient for whomsynovial fluid samples are available at all four time points).
1
10
100
1000
10000
1 10 100 1000
Shear Rate (1/s)
Vis
cosi
ty (
cp)
week 0week 4week 19
Figure B.8. Viscosity versus shear rate for patient dw.

61
1
10
100
1000
10000
1 10 100 1000
Shear Rate (1/s)
Vis
cosi
ty (c
p)
week 0week 11
Figure B.9. Viscosity versus shear rate for patient cm (Patient withdrew from study dueto lack of efficacy of treatment).
1
10
100
1000
1 10 100 1000
Shear Rate (1/s)
Vis
cosi
ty (
cp)
week 0week 4
Figure B.10. Viscosity versus shear rate for patient jb.

62
1
10
100
1000
1 10 100 1000
Shear Rate (1/s)
Vis
cosi
ty (c
p)
week 0week 4
Figure B.11. Viscosity versus shear rate for patient ss.
1
10
100
1000
1 10 100 1000
Shear Rate (1/s)
Vis
cosi
ty (c
p)
Week 0
Figure B.12. Viscosity versus shear rate for patient w.

63
1
10
100
1000
10000
1 10 100 1000
Shear Rate (1/s)
Vis
cosi
ty (c
p)
week 0week 4
Figure B.13. Viscosity versus shear rate for patient a.

64
LIST OF REFERENCES
1. Stedman, T.L., Stedman's Medical Dictionary. 26th ed. 1995, Baltimore:Williams & Wilkins.
2. Keuttner, K. and Goldberg, V., Osteoarthritic Disorders., ed. G.V. Keutttner K.Vol. xxi-xxv. 1995, Rosemont, Ill: AAOS.
3. Mow, V.C. and Hayes, W.C., Basic Orthopaedic Biomechanics. 2nd ed. 1997,Philadelphia: Lippincott-Raven.
4. Mital, M.A. and Millington, P.F., Osseous pathway of nutrition to articularcartilage of the human femoral head. Lancet, 1970. 1(7651): p. 842.
5. Price, F.M., Levick, J.R., and Mason, R.M., Changes in glycosaminoglycanconcentration and synovial permeability at raised intra-articular pressure inrabbit knees. J Physiol, 1996. 495(Pt 3): p. 821-33.
6. Moskowitz, R.W., Osteoarthritis : diagnosis and medical/surgical management.2nd ed. 1992, Philadelphia: Saunders. xxii, 761.
7. Linn, F.C. and Radin, E.L., Lubrication of animal joints. 3. The effect of certainchemical alterations of the cartilage and lubricant. Arthritis Rheum, 1968. 11(5):p. 674-82.
8. Caygill, J.C. and West, G.H., The rheological behavior of synovial fluid and itspossible relation to joint lubrication. Med Biol Eng, 1969. 7(5): p. 507-16.
9. Peyron, J.G. and Balazs, E.A., Preliminary clinical assessment of Na-hyaluronateinjection into human arthritic joints. Pathol Biol (Paris), 1974. 22(8): p. 731-6.
10. Wright, V. and Dowson, D., Lubrication and cartilage. J Anat, 1976. 121(1): p.107-18.
11. Ogston, A. and Stanier, J., The physiological function of hyaluronic acid insynovial fluid: viscous, elastic and lubricant properties. J. Physiol., 1953. 119: p.244.
12. Aviad, A.D. and Houpt, J.B., The molecular weight of therapeutic hyaluronan(sodium hyaluronate): how significant is it? J Rheumatol, 1994. 21(2): p. 297-301.

65
13. Balazs, E.A., Viscoelastic properties of hyaluronic acid and biologicallubrication. Univ Mich Med Cent J, 1968: p. 255-9.
14. Mensiteri, M., Ambrosio, L., Nicolas, L., Bellini, D., and O’Regan, M.,Viscoelastic Properties Modulation of a Novel Hyaluronic Acid Polymer. J.Materials Sci. Mater. Medicine, 1996. 7: p. 695–698.
15. Swann, D.A., Radin, E.L., Nazimiec, M., Weisser, P.A., Curran, N., andLewinnek, G., Role of hyaluronic acid in joint lubrication. Ann Rheum Dis, 1974.33(4): p. 318-26.
16. Anadere, I., Chmiel, H., and Laschner, W., Viscoelasticity of "normal" andpathological synovial fluid. Biorheology, 1979. 16(3): p. 179-84.
17. Swann, D.A., Silver, F.H., Slayter, H.S., Stafford, W., and Shore, E., Themolecular structure and lubricating activity of lubricin isolated from bovine andhuman synovial fluids. Biochem J, 1985. 225(1): p. 195-201.
18. Brandt, K., Diagnosis and Nonsurgical Management of Osteoarthritis. 2000:Caddo, OK: Professional Communications Inc.
19. Anderson, J.J. and Felson, D.T., Factors associated with osteoarthritis of the kneein the first national Health and Nutrition Examination Survey (HANES I).Evidence for an association with overweight, race, and physical demands of work.Am J Epidemiol, 1988. 128(1): p. 179-89.
20. Lawrence, R.C., Hochberg, M.C., Kelsey, J.L., McDuffie, F.C., Medsger, T.A.,Jr., Felts, W.R., and Shulman, L.E., Estimates of the prevalence of selectedarthritic and musculoskeletal diseases in the United States. J Rheumatol, 1989.16(4): p. 427-41.
21. Buckwalter, J.A., Martin, J., and Mankin, H.J., Synovial joint degeneration andthe syndrome of osteoarthritis. Instr Course Lect, 2000. 49: p. 481-9.
22. Arokoski, J.P., Jurvelin, J.S., Vaatainen, U., and Helminen, H.J., Normal andpathological adaptations of articular cartilage to joint loading. Scand J Med SciSports, 2000. 10(4): p. 186-98.
23. Sharma, L., Lou, C., Cahue, S., and Dunlop, D.D., The mechanism of the effect ofobesity in knee osteoarthritis: the mediating role of malalignment. ArthritisRheum, 2000. 43(3): p. 568-75.
24. Dequeker, J., Mokassa, L., and Aerssens, J., Bone density and osteoarthritis. JRheumatol Suppl, 1995. 43: p. 98-100.

66
25. Blair, S., An Introduction to Biorheology. 1974, New York: Elsevier ScientificPub. Co.
26. Buckwalter, J.A. and Mankin, H.J., Articular cartilage: tissue design andchondrocyte-matrix interactions. Instr Course Lect, 1998. 47: p. 477-486.
27. Hebreden Society Clinical Meeting. 1968. Glasgow, Scotland.
28. Davis, W.H., Jr., Lee, S.L., and Sokoloff, L., Boundary lubricating ability ofsynovial fluid in degenerative joint disease. Arthritis Rheum, 1978. 21(7): p. 754-6.
29. Schurz, J. and Ribitsch, V., Rheology of synovial fluid. Biorheology, 1987. 24(4):p. 385-99.
30. Reimann, I., Pathological human synovial fluids. Viscosity and boundarylubricating properties. Clin Orthop, 1976(119): p. 237-41.
31. Safari, M., Bjelle, A., Gudmundsson, M., Hogfors, C., and Granhed, H., Clinicalassessment of rheumatic diseases using viscoelastic parameters for synovial fluid.Biorheology, 1990. 27(5): p. 659-74.
32. Gatter, R.A., A practical handbook of joint fluid analysis. 1984, Philadelphia: Lea& Febiger. xvii, 105.
33. Johnson, K.A., Hulse, D.A., Hart, R.C., Kochevar, D., and Chu, Q., Effects of anorally administered mixture of chondroitin sulfate, glucosamine hydrochlorideand manganese ascorbate on synovial fluid chondroitin sulfate 3B3 and 7D4epitope in a canine cruciate ligament transection model of osteoarthritis.Osteoarthritis Cartilage, 2001. 9(1): p. 14-21.
34. McAlindon, T.E., LaValley, M.P., Gulin, J.P., and Felson, D.T., Glucosamine andchondroitin for treatment of osteoarthritis: a systematic quality assessment andmeta-analysis. Jama, 2000. 283(11): p. 1469-75.
35. Buckwalter, J.A., Stanish, W.D., Rosier, R.N., Schenck, R.C., Jr., Dennis, D.A.,and Coutts, R.D., The increasing need for nonoperative treatment of patients withosteoarthritis. Clin Orthop, 2001(385): p. 36-45.
36. Reginster, J.Y., Deroisy, R., Rovati, L.C., Lee, R.L., Lejeune, E., Bruyere, O.,Giacovelli, G., Henrotin, Y., Dacre, J.E., and Gossett, C., Long-term effects ofglucosamine sulphate on osteoarthritis progression: a randomised, placebo-controlled clinical trial. Lancet, 2001. 357(9252): p. 251-6.

67
37. Wobig, M., Dickhut, A., Maier, R., and Vetter, G., Viscosupplementation withhylan G-F 20: a 26-week controlled trial of efficacy and safety in theosteoarthritic knee. Clin Ther, 1998. 20(3): p. 410-23.
38. Brandt, K.D., Smith, G.N., Jr., and Simon, L.S., Intraarticular injection ofhyaluronan as treatment for knee osteoarthritis: what is the evidence? ArthritisRheum, 2000. 43(6): p. 1192-203.
39. Houpt, J.B., McMillan, R., Wein, C., and Paget-Dellio, S.D., Effect ofglucosamine hydrochloride in the treatment of pain of osteoarthritis of the knee. JRheumatol, 1999. 26(11): p. 2423-30.
40. Denlinger, J.L., Hyaluronan and its derivatives as viscoelastics in medicine, inThe Chemistry, Biology and Medical Applications of Hyaluronan and itsDerivatives, T.C. Laurent, Editor. 1998, London: Portland Press. p. 235-242.
41. Cristescu, N., Conrad, B., and Tran-Son-Tay, R., A Closed Form Solution forFalling Cylinder Viscometers. Accepted for publication: Int J Eng Sci, 2001.
42. Theodosakis, J., Adderly, B., and Fox, B., The Arthritis Cure. 1997, New York:St. Martin's Press.
43. Bourgeois, P., Chales, G., Dehais, J., Delcambre, B., Kuntz, J.L., and Rozenberg,S., Efficacy and tolerability of chondroitin sulfate 1200 mg/day vs chondroitinsulfate 3 x 400 mg/day vs placebo. Osteoarthritis Cartilage, 1998. 6 Suppl A: p.25-30.
44. Bucsi, L. and Poor, G., Efficacy and tolerability of oral chondroitin sulfate as asymptomatic slow-acting drug for osteoarthritis (SYSADOA) in the treatment ofknee osteoarthritis. Osteoarthritis Cartilage, 1998. 6 Suppl A: p. 31-6.
45. Mazieres, B., Combe, B., Phan Van, A., Tondut, J., and Grynfeltt, M.,Chondroitin sulfate in osteoarthritis of the knee: a prospective, double blind,placebo controlled multicenter clinical study. J Rheumatol, 2001. 28(1): p. 173-81.
46. Pujalte, J.M., Llavore, E.P., and Ylescupidez, F.R., Double-blind clinicalevaluation of oral glucosamine sulphate in the basic treatment of osteoarthrosis.Curr Med Res Opin, 1980. 7(2): p. 110-14.
47. Uebelhart, D., Thonar, E.J., Delmas, P.D., Chantraine, A., and Vignon, E., Effectsof oral chondroitin sulfate on the progression of knee osteoarthritis: a pilot study.Osteoarthritis Cartilage, 1998. 6 Suppl A: p. 39-46.

68
48. Towheed, T.E., Anastassiades, T.P., Shea, B., Houpt, J., Welch, V., andHochberg, M.C., Glucosamine therapy for treating osteoarthritis (CochraneReview). Cochrane Database Syst Rev, 2001. 1.
49. Buckwalter, J.A. and Schenck, R.C., Jr., Argument against use of food additivesfor osteoarthritis of the hip. Clin Orthop, 2000(381): p. 88-90.
50. Simon, L.S., Viscosupplementation therapy with intra-articular hyaluronic acid.Fact or fantasy? Rheum Dis Clin North Am, 1999. 25(2): p. 345-57.
51. Tran-Son-Tay, R., Beaty, B.B., Acker, D.N., Horchmuth, R.M. MagneticallyDriven, Acoustically tracked, translating-ball Rheometer for Small OpaqueSamples. Reviews of Scientific Instruments, 1988. 59: p. 1399-1404.

69
BIOGRAPHICAL SKETCH
The author was born in Little Rock, Arkansas to an Air Force navigator and an
emergency room nurse. He has one very special sibling, an incredibly intelligent and
beautiful sister named Annie. After the wonderful experience of living overseas for four
years, the author’s family settled down in Charleston, South Carolina. It was here that
the author was introduced to many of the things that have shaped his life. He turned to
Jesus Christ as his personal Savior and was later baptized at Old Fort Baptist Church. It
was at this church that he met his future wife, Suzanne. The author was married on May
27, 2000, midway through his graduate school studies. His wife has been a constant
source of inspiration and a fountain of encouragement. Blessings may come and go out
with the tide but her love will always be by my side.