certification of three nist renewal soil standard ... · 2 nist special publication 260-172...
TRANSCRIPT

NIST Special Publication 260-172
Certification of Three NIST Renewal Soil Standard Reference Materials for
Element Content: SRM 2709a San Joaquin Soil, SRM 2710a Montana
Soil I, and SRM 2711a Montana Soil II
E.A. Mackey S.J. Christopher
R.M. Lindstrom
S.E. Long
A.F. Marlow
K.E. Murphy
R.L. Paul
R.S. Popelka-Filcoff
S.A. Rabb
J.R. Sieber
R.O. Spatz
B.E. Tomlin
L.J. Wood
J. H. Yen
L.L. Yu
R. Zeisler S.A. Wilson
M.G. Adams
Z.A. Brown
P.L. Lamothe
J.E. Taggart
C. Jones
J. Nebelsick

2
NIST Special Publication 260-172
Certification of Three NIST Renewal Soil
Standard Reference Materials for Element Content: SRM 2709a San Joaquin Soil, SRM
2710a Montana Soil I, and SRM 2711a Montana Soil II
E.A. Mackey, S.J. Christopher, R.M. Lindstrom, S.E. Long, A.F. Marlow, K.E. Murphy, R.L. Paul, R.S. Popelka-Filcoff, S.A. Rabb, J.R. Sieber, R.O. Spatz, B.E. Tomlin, L.J. Wood, L.L. Yu, and R. Zeisler
Chemical Science and Technology Laboratory Analytical Chemistry Division
J. H. Yen
Information Technology Laboratory Statistical Engineering Division
S.A. Wilson, M.G. Adams, Z.A. Brown, P.L. Lamothe, and J.E. Taggart,
U.S. Geological Survey Branch of Geochemistry
C. Jones
Shaw Environmental and Infrastructure Group
J. Nebelsick
US EPA Washington, DC
June 2010
U.S. Department of Commerce
Gary Locke, Secretary
National Institute of Standards and Technology Patrick D. Gallagher, Director

3
Certain commercial entities, equipment, or materials may be identified in this
document in order to describe an experimental procedure or concept adequately. Such identification is not intended to imply recommendation or endorsement by the National Institute of Standards and Technology, nor is it intended to imply that the entities, materials, or equipment are necessarily the best available for the purpose.
National Institute of Standards and Technology Special Publication 260-172 Natl. Inst. Stand. Technol. Spec. Publ. 260-172, 39 pages (June 2010)
CODEN: NSPUE2

4
Abstract For the past 20 y, the National Institute of Standards and Technology has provided three soil Standard Reference Materials certified for element content: SRM 2709 San Joaquin Soil (Baseline Trace Element Concentrations); SRM 2710 Montana Soil I (Highly Elevated Trace Element Concentrations); and SRM 2711 Montana Soil II (Moderately Elevated Trace Element Concentrations). These materials have been used worldwide for quality assurance by a variety of laboratories involved in the determination of major, minor, and trace element content of soils and similar materials. Stocks of these original SRMs were depleted by 2008, and replacement SRMs were produced which became available in 2009. This paper describes, in detail, the process for the renewal of these three soil SRMs including soil collection and preparation methods, homogeneity assessment, experimental design, and the element analysis and data evaluation methods used to provide certified, reference, and information mass fraction values for 44 to 48 major, minor, and trace element constituents. For each SRM, the acid-extractable amount content of selected elements was determined by participants in the US Environmental Protection Agency’s Contract Laboratory Program, and summaries of those method-specific results are included as addenda to the Certificates of Analysis. Keywords: Certified Reference Material; Contaminants; Soil; Element Analysis; Standard Reference Material®; Trace Elements. Acknowledgments The authors gratefully acknowledge the participants of the US EPA Contract Laboratory Program for their contribution to this work and to the Certificates of Analysis. The authors gratefully acknowledge the cooperation of the facility operations staff at the NIST Center for Neutron Research without whom the INAA and PGAA work would not have been possible.

5
Table of Contents 1. Introduction.............................................................................................................................. 7 2. Materials and Methods............................................................................................................. 8 3. Experimental Design................................................................................................................ 9 4. Analytical Methods................................................................................................................ 11 5. Results and Discussion .......................................................................................................... 18 6. Summary and Conclusions .................................................................................................... 27 7. References.............................................................................................................................. 27 Appendix....................................................................................................................................... 29
Table A0. List of Abbreviations for Analytical Methods (used in Tables A1-A9) .................. 29 Table A1. Results from NIST Analyses of SRM 2709a: results from individual NIST methods used to calculate certified values (also shown)......................................................................... 30 Table A2. Results from analyses of SRM 2709a: NIST reference values based on individual NIST methods and USGS results from analyses performed before regrinding........................ 31 Table A3. Results from Analyses of SRM 2709a: Results from individual NIST methods used to provide Information Values and USGS results from analyses before regrinding, used to confirm NIST information values............................................................................................. 32 Table A4. Results from Analyses of SRM 2710a: results from individual NIST methods used to calculate certified values (also shown). ................................................................................ 33 Table A5. Results from Analyses of SRM 2710a: NIST reference values based on individual NIST methods and USGS results from analyses performed before regrinding........................ 34 Table A6. Results from Analyses of SRM 2710a: results from individual NIST methods used to provide information values for the Certificate of Analysis and USGS results from analyses before regrinding, used to confirm NIST information values................................................... 35 Table A7. Results from Analyses of SRM 2711a: results from individual NIST methods used to calculate certified values (also shown). ................................................................................ 36 Table A8. Results from Analyses of SRM 2711a: NIST reference values based on individual NIST methods and USGS results from analyses performed before regrinding........................ 38 Table A9. Results from Analyses of SRM 2711a: Information Values ................................... 39

6
List of Tables Table 1. Analytical methods used at NIST for analyses of SRMs 2709a, 2710a, and 2711a………………………………..…....... 10 Table 2. Example Evaluation of Material Heterogeneity for SRM 2711a………… 19 Table 3. Certifieda, referenceb, and informationc mass fraction values for SRM 2709a San Joaquin Soil, SRM 2710a Montana I Soil, and SRM 2711a Montana II Soil. ………………………………..………….. 21 Table 4. USEPA CLP Results for acid-extractable element amount content: range of mass fraction values and average percentage of total element content. ………………………………..……………………..… 23 Table 5. Comparison of Mass Fraction Ratio Values in Original and New Soil SRMs………………………………..…..…………………….. 24
List of Figures Figure 1. Range of values obtained by laboratories participating in the USEPA Contract Laboratory Program using USEPA methods for determination of acid extractable elements expressed as a percentage of total element content for SRMs 2709a, 2710a and 2711a……………………………………………………………… 25 Figure 2. Comparison of mass fraction values in the original soil SRMs with that in the renewal SRMs: ratios of mass fraction values in the new SRMs to that in the original SRMs for each element determined in the three soil materials.………………………………………………… 26

1. Introduction Knowledge of the element content of soil is an essential component of determining soil quality, detecting soil contamination, and monitoring contamination events from accidental spills or atmospheric deposition. Element content together with other soil properties is used to assess soil health and suitability for crops. A great deal of research has been performed to determine element uptake by plants and crops from soils (see, e.g., Ref. 1-4) and the efficacy of a variety of soil remediation technologies that specifically target bioavailability of metals and nutrients (see, e.g., Refs. 5-7). Metal content of substances such as fertilizers and biosolids (or sewage sludge) that are applied to agricultural soils are regulated in the United States, the European Union, and other countries. In addition, contamination events are often detected and monitored by measuring the element content of environmental samples of air, water, and soil. Following a contamination event, proof of remediation also relies on accurate analytical measurements of soil samples. Whether for determination of soil quality and health, suitability for crop use, assessment of contamination, or for environmental monitoring, analyses of soils are performed routinely by a variety of commercial, government, and university laboratories around the US and the world. Beginning in 1992, the National Institute of Standards and Technology (NIST) provided three soil Standard Reference Materials (SRMs) intended for use in method development, method validation, and routine quality assurance in the analysis of element content of soils. The three materials, SRM 2709 San Joaquin Soil, SRM 2710 Montana Soil I, and SRM 2711 Montana Soil II represented a baseline agricultural soil, a highly contaminated soil, and a moderately contaminated soil, respectively. They were developed to provide representative agricultural soils with certified mass fraction values for the elements of interest. Three different soil materials were produced in order to provide mass fraction values that would cover the relevant element levels. The original SRM soils were each provided with certified and information values (then designated as “non-certified” values) for approximately 50 elements. These three SRMs were also analyzed by several collaborating laboratories to determine the acid-extractable element content based on U.S. Environmental Protection Agency (USEPA) Methods. These values expressed both as mass fraction values and as percent recoveries (calculated based on comparison with NIST certified values) were included as addenda to the Certificates of Analysis for each SRM. The three original soil SRMs were widely used and demand for the three SRMs was typically in excess of 800 units per year. Stocks of these SRMs were sufficient to meet the needs of the soil analysis community for ten to fifteen years, so work was begun in 2006 to develop replacement or renewal SRM soils. The goals for the renewal materials were to provide three SRMs that would be very similar, though not identical, to the original materials and to provide both total element content and the USEPA method-based acid-extractable content for selected elements, again as addenda to the Certificates of Analysis. Emphasis was placed on determination of major element constituents such as Si and Ca, soil nutrients such as B, P, and K, rare earth elements, and on USEPA criteria and priority pollutant elements (e.g., Ag, As, Cd, Cr, Cu, Hg, Ni, Pb, Se, Sb, Tl, and Zn). This paper describes, in detail, the process for the renewal of the three soil SRMs including: soil collection and preparation methods; homogeneity assessment; experimental design; element analysis and data evaluation methods used to provide certified,

8
reference, and information mass fraction values for constituent elements; and results of determinations of acid-extractable element content by laboratories participating in the USEPA Contract Laboratory Program (CLP). A comparison of the renewal SRM soils with the original SRMs is presented as well.
2. Materials and Methods Collection and Preparation of SRM Soils The agricultural soil used to prepare SRM 2709a was collected and processed with assistance from the U.S. Bureau of Reclamation’s Sacramento CA office. This soil was collected from a fallow field, in the central California San Joaquin Valley. Three separate collection sites were used to obtain the necessary amount of material. Each collection site covered an area of approximately 4 m2. Prior to sample collection the area was scraped clean of surface vegetation. Collected material was transferred to 20 plastic-lined five-gallon plastic buckets and shipped to the U.S. Geological Survey (USGS) Denver laboratory for processing. The original collection site used for SRM 2710 was no longer available due to remediation efforts by the Montana Department of Environmental Quality. An alternative nearby site, located within the flood plain of the Silver Bow Creek, was selected for collection of the soil used to prepare SRM 2710a. The site is approximately five miles west of Butte, Montana. Vegetation in the general area is limited to occasional low growth bushes. Soil for SRM 2710a was placed in 22 plastic-lined five-gallon buckets using a common garden spade. The soil used to prepare SRM 2711a was collected from an active agricultural field recently tilled for winter wheat. Soil was collected from the top ten to twelve centimeters and from an area approximately 8m2. The site was located near a site formerly used by a smelting plant, in east Helena, Montana. The soil material was stored in twenty plastic-lined five-gallon buckets which were sealed and shipped to the USGS laboratory for processing. Each SRM soil was processed separately at the USGS laboratory. Each soil was dried in 80 kg batches, at room temperature, disaggregated gently in 1 kg batches using a rotating ceramic auger and bowl, and then sieved to remove coarse material (≥ 2 mm). The resulting soils were ball-milled in 50 kg portions, and then the entire batch of soil was transferred to a cross-flow V-blender for mixing. For SRM 2710a the resulting soil was ball-milled in 50 kg portions together with an amount of lead oxide sufficient to achieve a mass fraction of 0.55 % lead in the final product. No chemicals were added to either SRM 2709a or SRM 2711a. For each SRM the blended soils were radiation sterilized prior to bottling. In the final preparation step the blended material was split into containers using a custom-designed spinning riffler, which was used to divide the material into smaller batches, and then used to apportion approximately 50 g into each pre-cleaned glass bottle. Preliminary analyses to assess material homogeneity indicated that additional grinding was needed to improve material homogeneity and to achieve a final particle size distribution similar to the original SRMs. Again each SRM was processed separately to avoid cross contamination

9
among the three SRMs. The material from all bottles of one SRM was combined, and then ground in batches using a horizontal grinder with 20 cm x 20 cm ceramic plates for a time sufficient to produce a powder of which ≥95%, by mass, passed through a 200 mesh (or 74 µm) sieve. The resulting powder was blended, and 50 g portions were dispensed into bottles using the spinning riffler. These procedures resulted in the preparation of 2650 bottles of SRM 2709a, 2018 bottles of SRM 2710a, and 2510 bottles of SRM 2711a. Determination of the Dry-Mass Basis To minimize uncertainty in analytical results due to changes in moisture content of the SRM over time and as the material from any given bottle is used, all mass fraction values in the Certificates of Analysis are expressed on a dry-mass basis. To determine the dry-mass basis, separate portions from each bottle used for analysis were subjected to oven drying at 110 °C for 2 h. Masses of empty clean, dry glass weighing vials were recorded, as were the masses of the vials containing 1 g portions of soil before and after oven drying. Results indicated that at the time of analysis SRM 2709a contained approximately 3.0 % (mass fraction) moisture, and SRMs 2710a and 2711a each contained approximately 2 % (mass fraction). To avoid possible losses of potentially volatile elements such as As, Hg and Se, instructions to SRM users recommend that analysts perform drying studies on separate portions rather than on those used for analysis. To account for changes in the mass basis as the material is exposed to moisture in the laboratory atmosphere with each use, it is recommended that the dry mass-basis be determined at each use.
3. Experimental Design The certification plan called for provision of certified values for all elements regulated by USEPA for land application purposes (As, Cd, Cr, Cu, Pb, Hg, Mo, Ni, Se, Zn) and, where possible, for other USEPA regulated elements such as those designated as priority pollutant elements under the Clean Water Act (Be, Cr, Ni, Cu, Zn, As, Se, Ag, Cd, Sb, Hg, Tl, Pb), and those covered by the Clean Air Act (hazardous air pollutant elements As, Be, Cd, Cr, Co, Hg, Pb, Mn, Ni, and Se). Mass fraction values for additional major, minor, and trace element constituents were provided where feasible. The experimental design for certification of most elements in SRMs 2709a, 2710a, and 2711a was based on the use of two or more independent analytical techniques performed at NIST with confirmation of these results by analyses performed at the USGS Denver Laboratories. Certification of Cd, Hg, and Pb was based on use of one method, isotope dilution inductively coupled plasma mass spectrometry (ID-ICP-MS) coupled with cold vapor generation (CV-ID-ICP-MS) used for Hg determinations. For other elements, where only one NIST analytical technique was available, reference or information mass fraction values rather than certified values were provided. For a complete discussion of certified, reference, and information values provided by NIST, see Ref. 8. The elements and analytical techniques used to determine the mass fraction values are listed in Table 1. Emphasis was placed on the use of non-destructive multi-element techniques, instrumental neutron activation analysis (INAA) and X-ray fluorescence spectrometry (XRF), both of which are well suited for analysis of silicate matrix materials. Two additional analytical techniques, inductively coupled plasma optical emission spectrometry (ICP-OES) and ICP-MS

10
with or without collision cell technology (CCT-ICP-MS) were used where detection limits of the non-destructive methods were insufficient or where a second analytical method was needed. The sampling plan for homogeneity assessment of the soils required analyses of duplicate portions from 12 bottles selected in a stratified random manner from the entire batch. For homogeneity assessment using short-lived INAA, 170 mg portions were used, for long-lived INAA, 250 mg portions were used. For certification analyses, the recommended analytical portion size was 250 mg, though due to method-specific constraints, actual masses used ranged from 170 mg to 750 mg, depending on the technique. For each of the other techniques, analyses of a minimum of one portion from each of six bottles, also selected in a stratified random manner, were used for certification analyses. Actual number of portions and portion sizes used for certification analyses are listed for each analytical method in the following sections. Table 1. Analytical methods used at NIST for analyses of SRMs 2709a, 2710a, and 2711a.
Method SRM 2709a SRM 2710a SRM 2711a CCT-ICP-MS Se As, Se Se CV-ID-ICP-MS Hg Hg Hg ICP-MS Cu, Ni, Sb, Tl, U Ni, Sb, Tl, U Cu, Ni, Sb, Tl, U ICP-OES Ba, Co, Cu, Ni, P, Sr Co, Ni, P, Sr Ba, Co, Cu, Ni, P, Sr ID-ICP-MS Cd, Pb Cd, Pb Cd, Pb
INAA
Short-lived: Al, Ca, Dy, K, Mg, Mn, Na, Ti, V;
Short-lived: Al, Ca, Cu, In, K, La, Mg, Mn, Na, Sm, V;
Short-lived: Al, As, Ca, Dy, In, K, La, Mg, Mn, Na, Sm, Ti, V;
Intermediate/ Long-lived: Ag, As, Au, Ba, Ce, Co, Cr, Cs, Eu, Fe, Hf, La, Nd, Rb, Sb, Sc, Se, Sm, Sr, Ta, Tb, Th, U, Yb, Zn
Intermediate/Long-lived: Ag, As, Au, Ba, Ce, Co, Cr, Cs, Eu, Fe, Hf, La, Nd, Rb, Sb, Sc, Sm, Ta, Tb, Th, U, W, Yb, Zn
Intermediate/Long-lived: Ag, As, Au, Ba, Ce, Co, Cr, Cs, Eu, Fe, Hf, La, Nd, Rb, Sb, Sc, Sm, Sr, Ta, Tb, Th, U, Yb, Zn, Zr
PGAA B, Si, K, Ti, Mn, Fe, Cd, Gd
B, Si, K, Ti, Mn, Fe, Cd, Gd
B, Si, K, Ti, Mn, Fe, Cd, Sm, Gd
XRF
Na, Mg, Al, Si, P, S, K, Ca, Ti, V, Cr, Mn, Fe, Ni, Cu, Zn, As, Sr, Zr, Ba, Pb
Na, Mg, Al, Si, P, S, K, Ca, Ti, V, Cr, Mn, Fe, Ni, Cu, Zn, As, Sr, Zr, Ba, Pb
Na, Mg, Al, Si, P, S, K, Ca, Ti, V, Cr, Mn, Fe, Ni, Cu, Zn, As, Sr, Zr, Ba, Pb

11
4. Analytical Methods
INAA INAA for products of neutron capture with short half-lives (t1/2 ≤ 24 h) was used to determine Al, Au, Ca, Dy, K, Mg, Mn, Na, Ti, and V and for intermediate-lived (1 d ≤ t1/2 ≤ 14 d) and long-lived (t1/2 ≥ 14 d) products was used to determine As, Ba, Ce, Co, Cr, Cs, Eu, Fe, Hf, La, Lu, Nd, Rb, Sb, Sc, Sm, Sr, Ta, Tb, Yb, Zn, and Zr. In preparation for INAA, portions of soil from each bottle selected for analysis were formed into disks using a hydraulic press and stainless steel die. Triplicate 170 mg portions were prepared for determination of short-lived products and duplicate 250 mg portions were prepared for intermediate- and long-lived INAA. The masses of each disk were recorded to ± 0.01 mg using an analytical balance. Two or more portions of SRM 2709, SRM 2710, SRM 2711, or SRM 1633b Coal Fly Ash were prepared in the same manner and included in the analytical scheme for the purpose of quality control. Element standards consisted of pure metals, pure compounds or filter papers containing known amounts of the elements of interest prepared by quantitative deposition of solutions onto individual filters. Filter papers were formed into disks using a hydraulic press and stainless steel die. Element standard solutions were prepared from metals or compounds of known purity, or from single element NIST SRM Spectrometric Solutions. Each SRM soil sample and each element standard were doubly encapsulated in heat-sealed polyethylene bags prior to neutron irradiation. All gamma-ray spectrometry was carried out using intrinsic germanium detectors with appropriate signal-processing electronic modules. For determination of short-lived nuclides, irradiations were performed using pneumatic tube RT-2 of the NIST Center for Neutron Research at a reactor power of 20 MW, which corresponds to a neutron flux of approximately 3.3 x 1013 cm-2s-1. Each sample was irradiated for 30 s together with one filter paper standard and one metal foil or disk of a pure compound and one titanium neutron flux monitor foil. Samples were packaged at the center of the irradiation container with the disks oriented perpendicular to the axis of the irradiation container. The pipetted standards were always placed facing the core, followed by the metal foils/pure elements and the sample in the distal position. Gamma-ray spectrometry was carried out using spectrometers equipped with loss free counting (LFC) modules. The short-lived assays were performed after decay times of 10 min and 20 min. For SRM 2709a a third count for a duration of 20 min was performed after several hours decay, and a fourth count for 2 h after ≥ 24 h decay. For INAA determination of longer-lived nuclides, samples, standards, controls, neutron flux monitors (iron foil disks), and polyethylene bag blanks were placed into polyethylene irradiation containers and irradiated for 2 h in pneumatic tube RT-1 of the NIST reactor at a reactor power of 20 MW corresponding to a neutron fluence rate of approximately 1.2 x 1014 cm-2·s-1. Halfway through the irradiation, containers were flipped end-over-end. This procedure serves to minimize sample-to-sample differences in neutron exposure over the length of the container resulting from a nearly linear gradient in neutron flux as a function of distance from the reactor core. For determination of intermediate-lived nuclides (those with t1/2 values on the order of hours or a few days) samples and element standards, gamma ray spectrometry was performed using results from two to four different counts after one to two weeks of decay, at a distance of 20 cm from a spectrometer equipped with a loss free counting (LFC) module. Two or more additional counts
12
to determine longer-lived nuclides were performed after approximately one month and two months of decay, with each sample or element standard counted at a distance of 5 cm from a standard gamma-ray germanium spectrometer. PGAA Prompt gamma-ray activation analysis was used for the determination of H, B, Si, K, Ti, Mn, Fe, Cd and Gd in one 750 mg portion from each of six bottles. Element standards used for Si, K, Ti, and Fe consisted of pure elements or compounds of known purity. For other elements, standards were prepared by mixing substances of known composition and purity: SRM 951 Boric Acid mixed with graphite (B) ; a solution containing a known amount of Cd deposited onto disks formed from a mixture of silica and cellulose powders (Cd); SRM 912a Urea and a series of disks prepared from a mixture of this SRM with graphite (H); a mixture of Mn3O4 with graphite (Mn); a weighed amount of SRM 3118a Spectrometric Solution absorbed on a mixture of cellulose and graphite (Gd). For analysis by PGAA, each soil sample, standard, or soil control material was irradiated individually, under vacuum, in vertical beam tube, VT-5, of the NIST reactor at a reactor power of 20 MW, which provided a thermal neutron fluence rate of approximately 3.0 x 10⁸
cm-2s-1. Gamma radiations were collected using a high purity germanium detector combined with a bismuth germanate Compton suppressor and associated electronics. A complete description of this instrument including its detection system can be found in Ref. 9. All SRMs were irradiated for 16 h to 27 h; element standards were irradiated for times sufficient to obtain uncertainties associated with counting statistics ≤0.7 %. Once or twice each day a Ti foil was irradiated to monitor small fluctuations in neutron fluence over the course of the experiment. To determine the contribution to the spectra from gamma-ray lines present in the background (due to neutron capture reactions in the surrounding support and shielding materials and Teflon bag), PGAA was performed on a Teflon bag in the sample holder with the sample chamber evacuated. Elements present in the background and Teflon spectrum included: H, B, C, F, Al and Fe. For B, an additional correction was required to account for a direct interference from another isotope in the matrix. Count rates for 10B were corrected for an interfering gamma-ray from 23Na at 472 keV. Element mass fractions were calculated based on comparison with element standards using measured count-rates corrected for analyzer dead time, effects of pulse-pileup, differences in effective neutron exposure among samples and standards, and any contribution to the peak areas from background counts or direct gamma-ray line interferences. ICP-OES and ICP-MS In preparation for ICP-OES determination of Ba, Sr, P, Ni, Co and Cu and for ICP-MS determination of Cu, Ni, Sb, Tl and U, two 0.35 g portions were taken from each of six bottles and placed into Teflon microwave vessels along with concentrated HNO3 and HF. For samples intended for ICP-OES analysis, portions of SRM 3124a Indium Spectrometric Solution and SRM 3148a Scandium Spectrometric Solution were added to each vessel for use as internal standards which improves the precision of the instrumental measurements. Six reagent blanks were prepared in the same manner. Samples were digested using a microwave sample preparation system programmed to ramp to 215 °C over a time of 10 min, to maintain 215 °C for 40 min, and then to cool for 25 min. After microwave digestion, the samples were transferred to Teflon

13
beakers, concentrated HClO4 was added to each, and the solutions were covered and heated on a hot plate with a surface temperature of 200 °C for 4h. Covers were removed and the solutions heated until the volume was reduced to dryness. Solutions were diluted with 1.5 % volume fraction HNO3. If the solutions were visibly clear, the samples were transferred to polyethylene bottles and diluted to 25 g with 1.5 % volume fraction HNO3. If the solutions were not clear, additional HClO4 was added and the dry down and reconstitution steps were repeated until the solution was clear. Samples intended for ICP-MS analysis were digested by using the same procedure, except that no internal standard was added in the digestion. For ICP-OES measurements, two sets of serial dilutions, 1:1 (used for Ba and Sr determinations) and 1:40 (used for P, Ni, Co and Cu determinations), were prepared from the original digests using 2 % HNO3 (volume fraction). The spikes of the elements of interest were added gravimetrically. The spike solutions were prepared from SRMs 3104a Barium Standard Solution, 3153a Strontium Standard Solution, 3139a Phosphorus Standard Solution, 3136 Nickel Standard Solution, 3113 Cobalt Standard Solution and 3114 Copper Standard Solution. The ICP-OES instrument was used with integration times of 0.100 s and read times of 6.00 s. Each digest was measured two different times, and each time using five replicates. For ICP-MS measurements, the Agilent 7500cs ICP mass spectrometer was equipped with a Peltier-cooled, inert sample introduction system. Set up and tuning of the ICP-MS instrument was performed according to routine procedures designed to assure that the instrument and plasma conditions met the criteria established for optimal use. Preliminary measurements were made on digests of each candidate SRMs and controls to investigate the presence or absence of interferences in the measurement and to determine the dilution factor and the internal standard mass fraction optimized for the determination of each analyte. Indium was chosen as an internal standard for quantitative measurements of each analyte and was prepared from SRM 3124a Indium Spectrometric Solution. Samples were measured at masses 65 u, 60 u, 121 u, 205 u, 238 u, and 115 u, for determination of analytes Cu, Ni, Sb, Tl, U, and the In internal standard, respectively. All analytes were determined using a procedure consisting of a single-point standard addition with an internal standard. CCT-ICP-MS For determination of As in SRM 2710a and Se in all three SRMs, CCT-ICP-MS was used. In preparation for CCT-ICP-MS, 0.5 g portions of each soil were spiked with an internal standard, and half were spiked with standards containing As and Se. Samples were digested in Teflon vessels containing 7 mL of HNO3 and 3 mL of HF using a microwave oven programmed at a power of 1200 W, with a temperature ramp to 210 °C over 20 min, followed by a temperature hold at 210 °C for 10 min. Post digestion, 1-butanol was added to all analytical samples (approximately 1 % volume fraction) in order to raise the amount of carbon in the samples to gain sensitivity for As and Se measurements and to mitigate sample-to-sample differences in carbon levels that impart differential ionization effects on these elements in ICP-MS sources. Resulting digests were diluted as appropriate for determinations of As and Se. All samples were measured on a Thermo Scientific X2 inductively coupled plasma mass spectrometer operating in collision cell mode with a collision cell gas of 8 % H2(g) in balance He(g), operating at a flow rate of 3.8 mL min-1. The collision cell mode served to reduce plasma and matrix-based polyatomic interferences. Data for As and Se were collected in separate experiments to account for the

14
different dilution factors required for measuring As and Se. Quantification was achieved by using the method of standard additions with internal standards. Quadrupole MS routines for As used peak jumping, with each of four replicate runs consisting of 180 sweeps (62 s acquisition time), with dwell times of 45 ms for As and 30 ms for internal standards, and one point per peak monitored for each isotope. Similar routines were applied to the selenium measurements; 295 sweeps, 60 s acquisition time, and 45 ms and 30 ms dwell times for Se and internal standards, respectively. ID-ICP-MS ID-ICP-MS was used for determination of Cd and Pb in the three soil materials. The sample preparation procedure consisted of adding isotopic spikes to each 0.25 g soil sample and blank, digesting the material, diluting the digest for Cd and Pb in the three soil materials, except for Cd in SRM 2709a. For analysis of Cd in SRM 2709a, a portion of the digest was passed through an anion exchange resin bed to separate Cd from interfering matrix elements Zr, Mo and Sn. Mass fractions of Pb and Cd were determined in separate ID-ICP-MS measurements based on intensity ratios of 206Pb/208Pb, and 111Cd/112Cd and 111Cd/114Cd respectively. NIST procedures for the ID-ICP-MS determination of Cd and Pb in CRMs of various matrices have been reported elsewhere [10, 11]. Details of the sample preparation and ID-MS procedures specific to analysis of these soils are included below. Soil subsamples were accurately weighed by difference into clean, 125-mL perfluoroalkoxy Teflon beakers. Known amounts of isotopically enriched 111Cd and 206Pb were added by mass difference to all samples, controls, and procedure blanks. In addition to spiked samples, an unspiked sub-sample of each material was carried through the analytical process to assess spectral interferences for Cd and to measure isotopic composition for Pb which is variable in nature and thus different for each material. Digestion was accomplished through addition of high-purity HNO3 and high-purity HF, reflux at medium heat overnight in a clean fume hood after which solution volumes were reduced and samples were cooled. Additional HF was added, followed by perchloric acid (HClO4) and samples were heated until fumes of HClO4 were observed. Samples were refluxed in HClO4 for 48 h and then taken gently to dryness using two water washes to completely remove the residual HClO4. A solution containing 5 % mass concentration HNO3 was added to dried samples and heated gently until, clear, light yellow colored solutions formed. For SRMs 2710a and 2711a, ID-ICP-MS measurement of Cd and Pb was performed on separate dilutions of the digest so that the measured count rate of the major isotope in each case (111Cd or 206Pb) was 3 x 10⁵ s-1. For SRM 2709a, a portion of the digested, diluted sample solution was used for ID-ICP-MS analysis of Pb. The remaining solution was taken to dryness with concentrated hydrochloric acid (HCl), redissolved in a solution of 1.5 mol/L HCl/1 mol/L HF, and passed through 13 mL of 100 to 200 mesh anion exchange resin. Matrix components were eluted using three 20-g portions of a solution of 1.5 mol/L HCl and 1 mol/L HF, followed by 20 g of 0.02 mol/L HCl. The Cd fraction was eluted with 2.5 mol/L HNO3 which was taken to dryness and brought to volume with 2.5 mol/L HNO3. This procedure reduced but did not entirely eliminate interferences from Mo, Zr, and Sn. Mass spectrometric analyses were performed using a VG PlasmaQuad 3 operated at 1350 W using standard gas flows. Solution was introduced via a peristaltic pump into a low-flow (100 µL/min) micromist glass concentric nebulizer fitted to a water-cooled (4 °C) Cinnabar spray

15
chamber. Measurements were made using peak jump data acquisition with one point per peak. Five blocks of data each one min in duration were acquired per sample, and the mean ratios used for computations. Measured ratios were corrected for mass bias, drift, and detector dead-time, and for Cd, isobaric interference from Sn and the oxides and hydroxides of Mo and Zr. Detector dead-time (10 ns) was experimentally determined before and after each analysis using natural Cd and Pb solutions with concentrations spanning a wide count rate range. Keeping the count rate of the major isotope below 3 x 10⁵
s-1 minimized corrections for detector dead-time. A high-purity isotopic standard solution (for Cd, a solution of pure Cd metal and for Pb spiked samples, SRM 982 Equal Atom Lead) was used to measure the mass bias correction factor at the beginning of the analysis sequence. A spike calibration sample, which had an isotopic ratio similar to that of the analytical samples, was measured immediately afterward. This same calibration sample was re-measured throughout the analysis and was used to correct blanks, remaining calibration samples, and analytical samples for mass bias and any subsequent instrument drift. Signal intensities at 111Cd, 112Cd, and 114Cd were measured at dwell times of 10 ms, 20 ms, and 20 ms, respectively, and those at 90Zr, 94Zr, 95Mo, 96Mo, 98Mo and 118Sn were measured at dwell times of 10 ms each in order to correct for spectral interference on masses 111, 112, and 114. The measured count rate at mass 111 was corrected for 94Zr16O1H, 95Mo16O, and 94Mo16O1H, mass 112 was corrected for 96Zr16O, 95Mo16O1H, 96Mo16O, and 112Sn, and mass 114 was corrected for 97Mo16O1H, 98Mo16O, and 114Sn. Cd concentration was calculated from both the 111Cd/112Cd and 111Cd/114Cd ratios and the results compared as a check on the accuracy of the corrections for the various interferences which differed in magnitude. In all cases the Cd concentration calculated using the 111Cd/112Cd ratio was in agreement with the Cd concentration calculated using the 111Cd/114Cd ratio within the uncertainty of the ICP-MS ratio measurement (0.3 %, relative). As a result, the mean of the 111Cd/112Cd and 111Cd/114Cd concentration results was reported. For spiked Pb samples, masses 206 and 208 were measured at dwell times of 10 and 20 ms, respectively. For Pb composition samples, masses 202, 204, 206, 207, and 208 were measured at dwell times of 5 ms, 5 ms, 20 ms, 20 ms, and 10 ms, respectively. The intensity at mass 202 was measured to determine the correction for isobaric interference from 204Hg on 204Pb. CV-ID-ICP-MS In preparation for CV-ID-ICP-MS for the determination of Hg in the three soil SRMs, approximately 0.25 g of sample from each bottle was accurately weighed by difference into a clean 50 mL quartz microwave cell. Each sample was then spiked with an accurately weighed aliquot of solution containing approximately 1 µg/g of the 201Hg enriched isotope. Six g of high-purity HNO3 were added to each cell. The cells were sealed and the contents digested in a high-pressure microwave oven (Multiwave, Anton PAAR, Graz, Austria), using a default factory temperature program (consisting of 100W applied power for 300 s, ramping to 600 W applied power and holding for 300 s, followed by ramping to 1000 W applied power and holding for 600 s). The resulting digests were allowed to cool, the vessels pressure-vented, and the contents transferred to clean 50-mL polypropylene centrifuge tubes. The contents of the tubes were diluted with quartz-distilled water and maintained at 4 °C overnight to allow degassing of excess NO2 and CO2, resulting from the oxidation process. These solutions were further diluted to produce concentrations suitable for measurement by CV-ID-ICP-MS. Analytical measurements were completed within one day of dilution to reduce the potential for external Hg contamination or losses from solutions during storage. In addition to the samples and controls, three process

16
blanks containing an aliquot of the 201Hg spike only, were carried through the entire sample processing and measurement scheme. The overall mean of these blank measurements was used to correct the sample measurement data. Mercury measurements were made using CV Hg generation coupled with ICP-MS isotope ratio measurements. The Hg vapor was generated using SnCl2 reductant (10 % mass volume fraction in 7 % volume fraction HCl) and separated from the liquid phase using a commercial glass reaction/separator cell. The vapor was transferred to a Thermo X7 ICP-MS system with 1/16" id Viton™ tubing, using an Ar carrier gas flow rate of approximately 100 mL/min. This gas stream was mixed with the plasma injector gas stream using a plastic T piece. The ICP was operated in a dry plasma mode, which necessitated slight re-tuning of the ion lenses relative to an aqueous aerosol sample introduction system. The 201Hg and 202Hg isotopes were monitored in a pulse counting Time-Resolved-Analysis mode (TRA) to recover the individual ion count rates. The isotope-time profiles were used to calculate background corrected 201Hg/202Hg ratios. Instrument mass discrimination and instrument detector deadtime (37 ns) were measured by generation of Hg vapor from a calibration standard (SRM 1641d). The working 201Hg isotopic spike solution was prepared by accurate gravimetric dilution of a master stock solution and calibrated by reverse isotope dilution using a high-purity primary standard (SRM 1641d). Two separate stock solutions were prepared by serial dilution of the standard. Two spike calibration mixtures were prepared from each solution, and these were measured using CV-ICP-MS. Spike mixtures were run in the same batch as the samples to minimize the effects of mass discrimination, mass discrimination drift and other temporal effects. XRF For quantitative X-ray fluorescence spectrometry, 3 g soil samples were prepared by borate fusion. Calibrants were prepared from primary reference materials including high-purity compounds and SRM spectrometric solutions. Calibration ranges were designed to closely bracket the composition of the soil with at least four synthetic standards, thereby eliminating the need for corrections for matrix absorption effects. The compositions of the synthetic standards were closely matched to the unknown beads to make it possible to use straight-line calibration curves without introducing inter-element corrections. For additional information on XRF at NIST for certification of SRMs, see Refs. 12, 13, 14. Details of the borate fusion sample preparation and WDXRF methods used for the work are given below. A platinum crucible was weighed empty, and weighed amounts of flux consisting of a mixture of Li2B4O7 and LiBO2, sample, and Li2CO3 were added to the crucible followed by a second portion of flux placed on top of the 3 g sample. All masses were recorded to the nearest 0.01 mg. Oxidizer was added only to the soil samples, not to the synthetic calibrants. A commercially available automated bead preparation machine was used to fuse and cast samples as 40 mm diameter beads. The fusion program consisted of the following steps: drying at 200 ºC for 120 s; heating at 600 ºC for 360 s to calcine the ingredients; ramping the temperature to 975 ºC in 180 s to melt the flux and begin the fusion; and mixing for 0.5 h at 975 ºC. At this point, each melt was cooled to room temperature and two or three drops of a non-wetting agent (0.25 g LiI/g solution) were added. A final fusion step of heating at 975 ºC with mixing for 0.5 h was followed by casting in one of two platinum dishes. Because the two casting dishes produced different shape surfaces on the beads, all beads were ground flat using 180-grit SiC paper on a water-cooled

17
wheel. A Philips model PW2404 WDXRF spectrometer was used to measure the K-L2,3 characteristic X-ray lines of Na, Mg, Al, Si, P, S, K, Ca, Ti, V, Cr, Mn, Fe, Ni, Cu, Zn, Sr, and Zr. For As, the K-M2,3 line was measured, for Ba, the L3-M4,5 line was measured, and for Pb, the L2-M4 line was measured. In addition to the elements of interest, the Rh K-L Compton scatter line from the X-ray tube used as an internal reference to compensate for the effects of differences in bead mass thickness. The I L2-M4 line was measured for use as a line overlap correction for I L3-M4,5 on Ti K-L2,3. All measurements for quantitative analyses were performed in a vacuum environment (< 5 Pa) with the generator operated at 3.6 kilowatts of power. Counting times were chosen to obtain relative counting statistical uncertainties of approximately 0.25 % to 1.0 % for the count rate of each element. A sample changer was programmed to load and to unload beads into the spectrometer and to hold them in the measurement position using a single sample holder with a Cu centering ring. The mask between the sample and the collimator was set to view a 37 mm diameter circular area centered on each borate bead. For the final quantitative analyses, the beads were measured in a batch composed of all synthetic standards and unknown samples. Total time required for the measurements was less than 12 h. Therefore, no corrections were needed for spectrometer drift because the drift has been demonstrated to be < 0.05 % over a 12 h period. Calibration curves were prepared by linear regression in the PW2404 operating system software. For the elements Al, Si, K, Ca, and Fe, the measured gross count rates were used. For the elements Na, Mg, P, S, Ti, V, Cr, Ni, Cu, Zn, As, Sr, Zr, and Pb, the measured net count rates were used. For the elements Fe, Ni, Cu, Zn, As, Sr, Zr, and Pb, the net count rates were divided by the measured count rate from the Rh K-L Compton scatter line. Line overlap factors were calculated from the empirical data for Zn on Na, Ca and As on Mg, Ti on V, V on Cr, and Sr on Zr. The overlap of I on Ti was corrected using a factor determined in a separate experiment. Most regression calculations were done without weighting the data. For Cu, Zn, As, and Pb, weighting was based on the square root of the mass fraction with an added factor of 0.01000 mass fraction (%) to increase the influence of the lowest concentration calibrants on the fitted equation because these four elements are present near their limits of quantification. The calibrations were used to determine the mass fractions of constituents in the fused specimens and results were converted to mass fractions for the soil using dry soil sample and bead masses. USGS Analytical Methods At the USGS laboratories in Denver, CO, several different analytical methods were used to determine mass fractions of approximately 60 elements in the three renewal soil SRMs. The methods used were: ICP-AES, ICP-MS, energy- and wavelength-dispersive XRF, and INAA. In addition, cold-vapor atomic absorption spectrometry (CVAAS) was used for Hg determinations; AAS with hydride generation for Se and a combustion method for total C. Methods are described in USGS Open File Report 02-0223 [15]. Results from these analyses were used to confirm results from NIST.

18
5. Results and Discussion Homogeneity Assessment The non-destructive analytical technique INAA was used for assessment of homogeneity through a simple comparison of the observed sample-to-sample variation with the variation that could be attributed to the combination of counting statistics and any irradiation or counting geometry differences among the samples. Based on the assumption that the observed sample-to-sample variation is composed of these sources of variation combined in quadrature, and that any additional variation is due to material heterogeneity, the component attributed to heterogeneity may be calculated. Uncertainties associated with counting statistics varied from element to element. The uncertainty associated with differences in irradiation geometry was estimated to be 0.5% relative at the 1s level for short-lived INAA using individual irradiations for each sample, was considered negligible for long-lived INAA in which all samples and standards are irradiated together, and counting geometry uncertainty was estimated to be 0.5% relative at the 1s level for all INAA experiments. Only results for which the 1s values of the average were >1% were evaluated for heterogeneity. Evaluations based on results of short-lived INAA using 170 mg portions were normalized to results based on analyses using the recommended sample size of 250 mg. The 1s values were scaled by the ratio of the square root of the masses (i.e., √170/√250 = 0.825), based on the theory that the observed variation scales as the inverse of the square root of the mass [16]. An example of the results and calculations used to estimate the component of the observed variation that may be attributed to heterogeneity is shown in Table 2. Evaluation of the results from short-lived INAA of 170 mg portions and from long-lived INAA of 250 mg portions of SRM 2709a indicated that there were a few elements for which the observed variation was in excess of that which could be attributed to counting statistics and geometry effects. For 250 mg sized samples, 1 % of the observed variation may be attributed to heterogeneity for Al, K, Mn and Na; 2 % for Ca and 3 % for Cr. Additional uncertainty components for heterogeneity were added to the uncertainties of the certified values for these elements. No variations in excess of those attributable to counting statistics and geometry effects were observed for the other elements that were certified in SRM 2709a. As noted above, gross heterogeneity was observed for Hg in this material; both the range of values (0.84 mg/kg to 1.08 mg/kg) and an average (0.9 mg/kg) with a prediction interval (0.2 mg/kg) are included in the COA for this element. Evaluation of the INAA results for SRM 2710a indicated no detectable material heterogeneity for any certified elements. Variation in excess of that attributable to the combined uncertainties associated with counting statistics and geometry effects was observed for Au, Hf, Sm, Ta, and Th. All of these elements were provided as information values with only one significant figure reported and with no accompanying uncertainty values. Evaluation of the results SRM 2711a indicated that for Sb, Mg, and Zn, a component for material heterogeneity of 1 %, relative, at the 1s level was needed. This was included in the expanded uncertainties of the certified values for these elements. Other elements for which the observed variation exceeded that which could be attributed to counting statistics and geometry effects were Ag, Hf, and Th. Values for Hf and Th were provided as reference values with uncertainty

19
values that incorporate a component for measurement replication which reflects material heterogeneity. The value for Ag is provided as an information value with one significant figure and no uncertainty value. Table 2. Example Evaluation of Material Heterogeneity for SRM 2711a.
Element Mn Sb Zn Mass Fraction (mg/kg) 676 24.8 415
1s (mg/kg) 13 0.4 6.4 1s (%) for 170 mg 1.9% 1s (%) for 250 mg 1.6% 1.5% 1.5%
Counting statistics 1s (%) 0.6% 0.30% 0.20% Geometry 1s (%) 0.71% 0.50% 0.50%
Estimated Heterogeneity 1s 1.3% 1.4% 1.4% Stability Evaluation There is ample evidence in the literature supporting stability of inorganic components of radiation sterilized soils, stored at room temperature (see, for example, Refs. 17 and 18). Portions of the original three soil SRMs (2709, 2710, and 2711) were included with analyses of the new materials for the purpose of quality control. In general, results from these analyses showed no significant differences from certified values or any evidence of change in the mass basis. NIST will monitor the stability of the three renewal SRMs to assure material stability for the shelf-life of the SRMs. Assignment of Certified, Reference, and Information Values Results from the various methods, shown in Table 1, were used to provide certified, reference or information values for each element in each material, listed in Table 3. Data were qualified for use in certified values based on results obtained from analyses of certified reference materials, typically one or more of the three original soil SRMs. In four cases, results for a given element by a given method did not agree with certified values for the control SRMs; however, results from the second method, or second and third methods used were in agreement with certified values. In those four cases, those results for those elements were disqualified for use in certification and only results from (the) method(s) which provided the correct values for the original SRMs were used in the certification of the new SRMs. Where no certified values were available, results were compared with reference values, information values, and results from other techniques or from analyses performed previously. Use of those data to provide certified, reference, or information values was based on the confirming data and the number of methods used [8]. If there were no confirming data either from the analysis of the certified reference materials or by results from analyses by using other methods, values were reported as information only. Certification was based on the use of one primary method (ID-ICP-MS), or two or three independent analytical methods performed at NIST. Where multiple methods were used, certified values represent the equally weighted means. The uncertainty listed with each value is

20
an expanded uncertainty about the mean. The expanded uncertainty is calculated as U = kuc, where uc is intended to represent, at the level of one standard deviation, the combined effect of between-method and within-method components of uncertainty, as described in Ref. 19, consistent with the approach described in Refs. 20 and 21. A component for material heterogeneity was incorporated into the uncertainties for several elements, as discussed above, and as listed on each of the Certificates of Analysis [22, 23, 24]. The coverage factor (k) was determined from the Student's t-distribution corresponding to the appropriate associated degrees of freedom and approximately 95 % confidence for each analyte. Where ID-ICP-MS was used and the material homogeneity was acceptable, certification was based on this single primary method, often with confirmation from results obtained using another NIST method or a USGS method. Certified values for Cd and Pb in SRM 2709a, Pb and Hg in SRM 2710a, and Cd, Pb, and Hg in SRM 2711a were each results from ID-ICP-MS, for which a complete evaluation of all sources of uncertainty was performed. Uncertainties for the certified values for these elements represent expanded uncertainties with a coverage factor of 2, with uncertainty components combined following the guidelines in Refs. 20 and 21. For SRM 2710a, the certified value for Cd was based on the equally weighted mean of the ID-ICP-MS and PGAA results and uncertainties were calculated as described above. In cases where only one NIST analytical method was available, where material homogeneity was insufficient, or where results from two techniques did not agree sufficiently well, reference values were provided. Again, results were confirmed by USGS analyses where data were available. Reference values for most elements represent the average value obtained from analysis of replicate portions using one analytical method performed at NIST. Uncertainties for reference values represent the expanded uncertainties which include the combined Type A and Type B with a coverage factor of 2, following the approach described in Refs. 20 and 21. For Hg in SRM 2709a, a reference value was provided because material heterogeneity was insufficient to provide a certified value; values ranged from 0.8 mg/kg to 1.1 mg/kg. The reference value for Hg, 0.9 mg/kg represents the average value from analysis of portions from six bottles using cold vapor ID-ICP-MS and the uncertainty value (0.2 mg/kg) is in the form of a prediction interval. Reference values were also provided in cases where results from two different techniques did not agree sufficiently well to provide a certified value. Reference values for Ni in SRM 2710a represent the equally weighted means of results from two analytical methods, ICP-MS and ICP-OES. The uncertainty listed is an expanded uncertainty about the mean, calculated as U = kuc, as described by Levenson et al. [19]. Reference values for Cr and V in SRM 2710a were based on results from two different methods, INAA and XRF. For these elements in SRM 2710a, values represent a weighted mean calculated based on the DerSimonian-Laird method [25], which incorporates an estimate of the between-method variance into the weights. The expanded uncertainty listed with these values is calculated as U = kuc, where k = 2, and uc is intended to represent, at the level of one standard deviation, the combined effect of between-method and within-method components of uncertainty. Weighted means were used in this case due to large differences in precision between the two methods for these elements at these levels. All information values represent results from a single NIST technique and, typically, those results were not confirmed by other methods. Information values are reported to one significant figure, and do not have uncertainty values.

21
All data that were used to provide the certified, reference and information values are included in an appendix to this paper. Results from individual methods for each element are shown together with the expanded uncertainties reported by the analysts for each technique. Results from USGS used to confirm NIST results for reference and information values are presented as well. The results for SRM 2709a are in Tables A1- A3, for SRM 2710a, Tables A4-A6 and for SRM 2711a, Tables A7-A9. Table 3. Certifieda, referenceb, and informationc mass fraction values for SRM 2709a San Joaquin Soil, SRM 2710a Montana I Soil, and SRM 2711a Montana II Soil
Element Units SRM 2709a mass fraction ± U
SRM 2710a mass fraction ± U
SRM 2711a mass fraction ± U
Aluminum % 7.37 ± 0.16 5.95 ± 0.05 6.72 ± 0.06 Antimony mg/kg 1.55 ± 0.06 52.5 ± 1.6 23.8 ± 1.4 Arsenic mg/kg 10.5 ± 0.3 1540 ± 10 107 ± 5 Barium mg/kg 979 ± 28 792 ± 36 730 ± 15 Boron mg/kg 74 20 50 Cadmium mg/kg 0.371 ± 0.002 12.3 ± 0.3 54.1 ± 0.5 Calcium % 1.91 ± 0.09 0.964 ± 0.045 2.42 ± 0.06 Cerium mg/kg 42 ± 1 60 70 Cesium mg/kg 5.0 ± 0.1 8.25 ± 0.11 6.7 ± 0.2 Chromium mg/kg 130 ± 9 23 ± 6 52.3 ± 2.9 Cobalt mg/kg 12.8 ± 0.2 5.99 ± 0.14 9.89 ± 0.18 Copper mg/kg 33.9 ± 0.5 3420 ± 50 140 ± 2 Dysprosium mg/kg 3 3 5 Europium mg/kg 0.83 ± 0.02 0.82 ± 0.01 1.1 ± 0.2 Gadolinium mg/kg 3.0 ± 0.1 3.0 ± 0.1 5 Gold mg/kg 0.2 Hafnium mg/kg 4 7 9.2 ± 0.2 Indium mg/kg 7 1 Iron % 3.36 ± 0.07 4.32 ± 0.08 2.82 ± 0.04 Lanthanum mg/kg 21.7 ± 0.4 30.6 ± 1.2 38 ± 1 Lead % 0.00173 ± 0.00001 0.552 ± 0.003 0.140 ± 0.001 Lutetium mg/kg 0.3 0.31 ± 0.01 0.5 Magnesium % 1.46 ± 0.02 0.734 ± 0.038 1.07 ± 0.06 Manganese mg/kg 529 ± 18 2140 ± 60 675 ± 18 Mercury mg/kg 0.9 ± 0.2 9.88 ± 0.21 7.42 ± 0.18 Neodymium mg/kg 17 22 ± 2 29 ± 2 Nickel mg/kg 85 ± 2 8 ± 1 21.7 ± 0.7 Phosphorus % 0.0688 ± 0.0013 0.105 ± 0.004 0.0842 ± 0.0011 Potassium % 2.11 ± 0.06 2.17 ± 0.13 2.53 ± 0.1 Rubidium mg/kg 99 ± 3 117 ± 3 120 ± 3 Samarium mg/kg 4 4.0 ± 0.2 5.93 ± 0.28 Scandium mg/kg 11.1 ± 0.1 9.9 ± 0.1 8.5 ± 0.1 Selenium mg/kg 1.5 1 2

22
Silicon % 30.3 ± 0.4 31.1 ± 0.4 31.4 ± 0.7 Silver mg/kg 40 6 Sodium % 1.22 ± 0.03 0.894 ± 0.019 1.2 ± 0.01 Strontium mg/kg 239 ± 6 255 ± 7 242 ± 10 Tantalum mg/kg 0.7 0.9 1 Terbium mg/kg 0.5 0.5 0.8 Thallium mg/kg 0.58 ± 0.01 1.52 ± 0.02 3 Thorium mg/kg 10.9 ± 0.2 18.1 ± 0.3 15 ± 1 Titanium % 0.336 ± 0.007 0.311 ± 0.007 0.317 ± 0.008 Tungsten mg/kg 190 Uranium mg/kg 3.15 ± 0.05 9.11 ± 0.3 3.01 ± 0.12 Vanadium mg/kg 110 ± 11 82 ± 9 80.7 ± 5.7 Ytterbium mg/kg 2 2 3 Zinc mg/kg 103 ± 4 4180 ± 20 414 ± 11 Zirconium mg/kg 195 ± 46 200
a Uncertainties for certified value represent expanded uncertainties, U = kuc: see text. b Uncertainties for reference values represent expanded uncertainties, U = kuc: see text. c No uncertainty estimates are provided for information values. Results from USEPA Contract Laboratory Program A large number of the soil analyses performed by commercial laboratories are intended to determine the extent to which soil samples are contaminated with EPA regulated metals or the extent to which remediation efforts have been successful in removal of these metals. Many of these routine soil analyses are performed using EPA methods such as EPA Method 200.7 USEPA SW-846 Method 3050B. These methods involve acid extraction of metals from the soils rather than total dissolution and use ICP-OES for determination of metals in the acid extracts. These methods are convenient to use, and involve use of less acid and fewer acids than are required for total dissolution. In addition, some scientists use these methods to assess or approximate bioavailability of metals in soils; see, for example, references [28, 29]. To assist laboratories that use these EPA methods, information on the amount of acid-extractable metal content was provided in appendices to the Certificates of Analyses for the original SRMs (2709, 2710 and 2711) and also is provided in Certificates of Analyses for the renewal soil SRMs. The three NIST renewal soil SRMs were used as test materials for quarterly blind laboratory round robin exercises conduced under the auspices of the USEPA CLP. For SRM 2709a, eight laboratories participated, seven of which used USEPA Method 200.7 [26], the remaining laboratory used USEPA SW-846 Method 3050B for preparation of soil samples [27]. Six of the eight laboratories provided individual results from duplicate portions, and these results were averaged together to provide one result for each element from each participating laboratory. For SRMs 2710a and 2711a, six laboratories participated, five of which used USEPA Method 200.7; the remaining laboratory used USEPA SW-846 Method 3050B for preparation of soil samples. All laboratories involved in the analysis of SRMs 2710a and 2711a provided individual results from duplicate portions, and these results were averaged together to provide one result for each element from each participating laboratory. For all three SRMs, the elements were determined in leachates by ICP-OES. Results rejected as outliers for the purposes of the USEPA CLP were not included.

23
Results from the USEPA CLP study are summarized in Table 4 and Figure 1. The ranges of mass fraction values, median values (to two significant figures), and the number of results included for each are given for 23 elements. The % recovery values were calculated based on the ratios of the median values to the total element content as determined by methods used to provide the certified, reference, or information values listed in the Certificate of Analysis. These results are provided as addenda to the Certificates of Analysis for each material. The three elements that showed the greatest variation in these results were Sb, Se and Tl. The variation observed for Sb is likely due to incomplete and variable extractions, as values ranged from about 20 % to 90 % relative to the total amount present in the soils. The variation observed for Se and Tl are more likely due to the low levels present, especially for Se. The total amount of Se in these soils was very near the detection limits for most laboratories. Table 4. USEPA CLP Results for acid-extractable element amount content: range of mass fraction values and average percentage of total element content.
SRM 2709a SRM 2710a SRM 2711a Element n Range (mg/kg) Avg. %
Recovery n Range (mg/kg) Avg. %
Recovery n Range
(mg/kg) Avg. %
Recovery Aluminum 7 13000–17000 22% 6 8200–12000 17% 6 9800 – 15000 19% Antimony 2 1.2 – 1.5 88% 6 5.0–12 18% 6 2.8–7.2 21% Arsenic 8 6.4 – 10 74% 6 1300–1600 92% 6 81–110 85% Barium 8 350 – 400 39% 6 490–540 65% 6 170–200 25%
Beryllium 0.50 – 072 -- 0.24–0.51 -- 0.73–1.1 Cadmium 5 0.33 – 0.66 110% 5 9.6–12 86% 6 43–56 90% Calcium 8 12000 – 14000 65% 6 1700–2000 19% 6 14000–17000 61%
Chromium 8 46 – 67 41% 6 9.2–11 41% 6 12–18 29% Cobalt 8 8.2 – 13 81% 6 2.8–5.2 64% 6 5.5–9.0 75% Copper 7 24 – 28 81% 6 3100–3500 95% 6 120–160 95%
Iron 8 22000 – 26000 70% 6 30000–36000 79% 6 14000–18000 54% Lead 7 8.1 – 11 53% 6 4700–5800 93% 6 1100–1400 91%
Magnesium 7 9700 – 11000 71% 6 3200–3600 48% 6 5000–6600 54% Manganese 8 380 – 450 79% 6 1500–1800 77% 6 450–580 71%
Mercury 8 0.79 – 0.92 97% 6 9.3–12 104% 6 6.3–8.3 100% Nickel 8 59 – 71 77% 5 4.8–6. 69% 6 13–18 72%
Potassium 8 2600 – 4000 14% 6 3800–4700 19% 6 3300–4600 16% Selenium 5 0.69 – 1.9 63% 2 1.5, 2.6 200% 5 1.4–1.9 85%
Silver 4 0.14 – 4.1 -- 6 31–39 91% 6 4.0–6.1 89% Sodium 7 460 – 610 4% 6 550–650 7% 5 140–210 1.5%
Thallium 2 0.74 – 1.6 200% 3 1.3–3.6 213% 5 0.71–3.1 68% Vanadium 8 43 – 71 44% 6 35–43 48% 6 24–34 36%
Zinc 8 69 – 87 77% 6 3300–4400 90% 6 310–380 85% Comparison with original materials The soils collected in 2005 that were used to prepare SRMs 2709a and 2711a were collected from the same locations as the original soils had been collected in the early 1990’s. It was expected that element levels would be similar, though not identical to those of the original soil SRMs. Because SRM 2710a was collected from a different location along Silver Bow Creek, it was expected that element concentrations in the new SRM would differ significantly from those

24
in the original material. Approximately 40 elements determined in the new soils had been determined in the original soils and mass fraction values were compared between the new and original soils for each of the three SRMs. A comparison of the new and original soil SRMs is presented as the number of elements in the new materials for which the content is within 10%, 20%, and 30% of the original values in Table 5. The ratios of the mass fraction values for each element are depicted in Figure 2 in which the shaded region represents elements for which the mass fraction values in the renewal material are within ± 50% of those in the original SRMs. Table 5. Comparison of Mass Fraction Ratio Values in Original and New Soil SRMs SRMs
Total Number of Elements
Compared (n)
0.9 < [x]/[x]<1.1 (±10%)
(n)
0.8 < [x]/[x]<1.2 (±20%)
(n)
0.7 < [x]/[x]<1.3 (±30%)
(n) 2709 and 2709a 39 30 33 36 2710 and 2710a 41 12 17 20 2711 and 2711a 40 25 32 40 For SRMs 2709 and 2709a, 39 elements were determined in both original and new soils. Of those, mass fraction values for 30 elements in the new soil are within 10% of those in the original soil; four elements (Dy, P, Yb and Zr) differ by more than 10% but overlap within either the reported uncertainties or are identical within the number of significant figures provided. The values for the remaining five elements were lower in the new SRM 2709a with Nd and Tl differing by 11% and 22%, respectively. Only As, Sb and Hg in SRM 2709a differ from the amounts in the original SRM 2709 by more than 30%. For SRMs 2711 and 2711a, 25 of 40 elements in SRM 2711a are within 10% of values for SRM 2711. Another four elements (Cr, Se, U and Yb) are identical within the significant figures reported. Mass fraction values for the remaining 11 elements were within 30% of those in the original SRM 2711. As expected, element mass fractions in SRM 2710a differ from those in SRM 2710 to a much greater extent than the other two SRMs differ from the original issues. Of 41 elements determined in both of the 2710 materials, only 12 elements in SRM 2710a are within 10% of those in SRM 2710. The average mass fraction value for one element, Ba, was identical to that in the original material within the reported uncertainty, and values for two elements Ag and Eu were identical in the two materials with the significant figures reported. Mass fraction values for an additional four elements in SRM 2710a were within 20% of values in SRM 2710, and the remaining 21 elements differed by more than 30%, with ratio values ranging from 0.1 to 2.5.

Figure 1. Range of values obtained by laboratories participating in the USEPA Contract Laboratory Program using USEPA methods for determination of acid extractable elements expressed as a percentage of total element content for SRMs 2709a, 2710a and 2711a.

26
0
0.5
1
1.5
2
2.5
SRM 2709a/2709SRM 2710a/2710SRM 2711a/2711
Alu
min
umAn
timon
yAr
seni
cBa
rium
Cadm
ium
Cal
cium
Cer
ium
Ces
ium
Chro
miu
mCo
balt
Copp
erDy
spro
sium
Euro
pium Gol
dH
afni
umIn
dium Iron
Lant
hanu
mLe
adM
agne
sium
Man
gane
seM
ercu
ryNe
odym
ium
Nic
kel
Phos
phor
usPo
tass
ium
Rubi
dium
Sam
ariu
mSc
andi
umSe
leni
umSi
licon
Silv
erSo
dium
Stro
ntiu
mTh
alliu
mTh
oriu
mTi
tani
umTu
ngst
enUr
aniu
mVa
nadi
umYt
terb
ium
Zinc
Zirc
oniu
m
Ratio
Element Figure 2. Comparison of mass fraction values in the original soil SRMs with that in the renewal SRMs: ratios of mass fraction values in the new SRMs to that in the original SRMs for each element determined in the three soil materials.

6. Summary and Conclusions The renewal soil SRMs were issued by NIST in 2009. These three materials provide the analytical community with three soils that cover the element mass fraction ranges that would be expected in typical soil samples analyzed by environmental laboratories. The material characteristics including soil type, homogeneity, and element content are similar to those of the previously issued SRMs. Heterogeneity was evaluated and where necessary and where necessary, a component for uncertainty associated with material heterogeneity was incorporated into the expanded uncertainty. The values for the component associated with material heterogeneity was typically 1% to 2 % relative at the 1s level. For 60% to 70% of the certified values in the new SRM soils, expanded uncertainties were lower than for the original SRMs. The goal of providing certified, reference or information values for EPA-regulated elements was achieved for most elements of concern in a soil matrix. Two notable exceptions were Be and Mo which were not determined by the NIST scientists for this work. Future work for this material will focus on determination of regulated elements such as Be and Mo that were not addressed in this certification campaign.
7. References
[1] Clemens S (2006) Toxic metal accumulation, responses to exposure and mechanisms of tolerance in plants. Biochimie 88:1707-1719
[2] Memon AR, Schroder P (2009) Implications of metal accumulation mechanisms to phytoremediation. Environ Sci Pollut R 16: 162-175
[3] Grant CA, Buckley WT, Bailey LD, Selles F (1998) Cadmium accumulation in crops. Can J Plant Sci 78:1-17
[4] Shanker AK, Cervantes C, Loza-Tavera H, Avudainayagam S (2005) Chromium toxicity in plants. Environ Int 31:739-753
[5] Jadia CD, Fulekar MH (2009) Phytoremediation of heavy metals: Recent techniques. Afr J Biotechnol 8:921-928
[6] Cherian S, Oliveira MM (2005) Transgenic plants in phytoremediation: Recent advances and new possibilities. Environ Sci Tech 39:9377-9390
[7] Pulford ID, Watson C (2003) Phytoremediation of heavy metal-contaminated land by trees - a review. Environ Int 29:529-540
[8] May, W.E.; Gills, T.E.; Parris, R.; Beck, II, C.M.; Fassett, J.D.; Gettings, R.J.; Greenberg, R.R.; Guenther, F.R.; Kramer, G.; MacDonald, B.S.; Wise, S.A.; Definitions of Terms and Modes Used at NIST for Value-Assignment of Reference Materials for Chemical Measurements, NIST Special Publication 260-136 (1999); available at http://www.cstl.nist.gov/nist839/NIST_special_publications.htm).
[9] Mackey EA, Anderson DL, Liposky PJ, Lindstrom RM, Chen-Mayer H, Lamaze GP (2004) New Thermal neutron prompt gamma-ray activation analysis instrument at the National Institute of Standard and Technology Center for Neutron Research. Nucl Instrum Meth B 226:426-440

28
[10] Murphy KE, Beary ES, Rearick MS, Vocke RD (2000) Isotope dilution inductively coupled plasma mass spectrometry (ID ICP-MS) for certification of lead and cadmium in environmental Standard Reference Materials. Fresen J Anal Chem 368: 362-370
[11] Murphy KE, Long SE, Vocke RD (2007) On the certification of cadmium at trace and ultra-trace levels in Standard Reference Materials using ID ICP-MS. Anal Bioanal Chem 387: 2453-2461.
[12] Sieber J (2002) Matrix-Independent XRF Methods for Certification of Standard Reference Materials, Adv X-Ray Anal 45:493-504
[13] Sieber J, Broton D, Fales C, Leigh S, MacDonald B, Marlow A, Nettles S, and Yen J (2002) Standard reference materials for cements, Cem Con Res 32:1899-1906
[14] Sieber, J.R., Yu, L.L., Marlow, A.F., and Butler, T.A. (2005), Uncertainty and traceability in alloy analysis by borate fusion and XRF, X-Ray Spectrom., 34, 153-159.
[15] Taggart JE (2002) US Geological Survey Open-File Report 02-0223, Analytical methods for chemical analysis of geologic and other materials, pp. 20
[16] Kurfürst U, Pauwels J, Grobecker K-H, Stoeppler M, Muntau H (1993) Micro-heterogeneity of trace elements in reference materials-- determination and statistical evaluation. Fresen J Anal Chem 345:112-120
[17] Gawlik BM, Bo F, Kettrup A, Muntau H (1999) Characterisation of a second generation of European reference soils for sorption studies in the framework of chemical testing - Part I: chemical composition and pedological properties. Sci Total Environ 229:99-107
[18] Traub H, Scharf H (2001) NH4NO3 extractable trace element contents of soil samples prepared for proficiency testing – a stability study Fresen J Anal Chem 370:270-274
[19] Levenson MS, Banks DL, Eberhardt KR, Gill LM, Guthrie WF, Liu HK, Vangel MG, Yen JH, Zhang NF (2000) J Res NIST 105:571-579
[20] ISO; Guide to the Expression of Uncertainty in Measurement, ISBN 92-67-10188-9, 1st ed.; International Organization for Standardization: Geneva, Switzerland (1993)
[21] Taylor, B.N.; Kuyatt, C.E.; Guidelines for Evaluating and Expressing the Uncertainty of NIST Measurement Results, NIST Technical Note 1297, U.S. Government Printing Office, Washington, DC (1994); available at http://physics.nist.gov/Pubs/.
[22] SRM 2709a Certificate of Analysis; https://www-s.nist.gov/srmors/view_cert.cfm?srm=2709A accessed September 2009
[23] SRM 2710a Certificate of Analysis https://www-s.nist.gov/srmors/view_cert.cfm?srm=2710A accessed September 2009
[24] SRM 2711a Certificate of Analysis; https://www-s.nist.gov/srmors/view_cert.cfm?srm=2710A accessed September 2009
[25] DerSimonian R, Laird N (1986) Metaanalysis in clinical-trials Controlled. Clin Trials 7:177-188
[26] US EPA ON-line Test Methods Chapter 3; www.epa.gov/waste/hazard/ testmethods/sw846/pdfs/chap3.pdf; accessed September 2009
[27] US EPA Method 200.7: Determination of Metals and Trace Elements in Waters and Wastes by Inductively Coupled Plasma-Atomic Emission Spectrometry http://www.epa.gov/sam/pdfs/EPA-200.7.pdf accessed September 2009
[28] Gibbs RJ, Guerra C; Metals of the bottom muds in Belize City Harbor, Belize. Environ Pollut 98:135-138
[29] Hamel SC, Heckman JR, Shilke-Gartley KL, Hoskins B. Lead extraction using three soil fertility tests and EPA Method 3050. Commun Soil Sci Plant 34:2853-2873
29
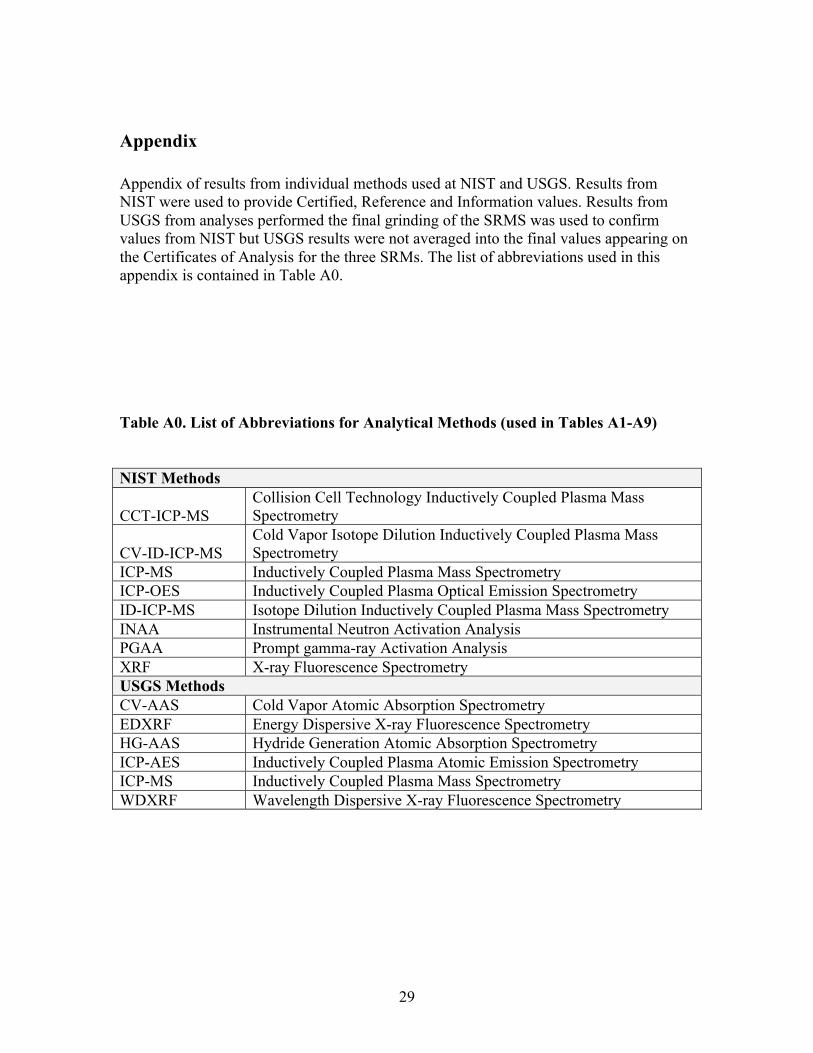
Appendix Appendix of results from individual methods used at NIST and USGS. Results from NIST were used to provide Certified, Reference and Information values. Results from USGS from analyses performed the final grinding of the SRMS was used to confirm values from NIST but USGS results were not averaged into the final values appearing on the Certificates of Analysis for the three SRMs. The list of abbreviations used in this appendix is contained in Table A0.
Table A0. List of Abbreviations for Analytical Methods (used in Tables A1-A9)
NIST Methods
CCT-ICP-MS Collision Cell Technology Inductively Coupled Plasma Mass Spectrometry
CV-ID-ICP-MS Cold Vapor Isotope Dilution Inductively Coupled Plasma Mass Spectrometry
ICP-MS Inductively Coupled Plasma Mass Spectrometry ICP-OES Inductively Coupled Plasma Optical Emission Spectrometry ID-ICP-MS Isotope Dilution Inductively Coupled Plasma Mass Spectrometry INAA Instrumental Neutron Activation Analysis PGAA Prompt gamma-ray Activation Analysis XRF X-ray Fluorescence Spectrometry USGS Methods CV-AAS Cold Vapor Atomic Absorption Spectrometry EDXRF Energy Dispersive X-ray Fluorescence Spectrometry HG-AAS Hydride Generation Atomic Absorption Spectrometry ICP-AES Inductively Coupled Plasma Atomic Emission Spectrometry ICP-MS Inductively Coupled Plasma Mass Spectrometry WDXRF Wavelength Dispersive X-ray Fluorescence Spectrometry

30
Table A1. Results from NIST Analyses of SRM 2709a: results from individual NIST methods used to calculate certified values (also shown).
Element NIST Method Value (U) Certified Value (U) Unit Al INAA 7.38 (0.11) BF-XRF 7.36 (0.05) 7.37 (0.16) % Ca XRF 1.94 (0.02) INAA 1.87 (0.05) 1.91 (0.09) % Cd ID-ICP-MS 0.371 (0.002) 0.371 (0.002) mg/kg Cr INAA 126.9 (3.4) XRF 132.5 (2.9) 130 (5) mg/kg Fe XRF 3.41 (0.10) PGAA 3.33 (0.041) INAA 3.33 (0.041) 3.36 (0.07) % K INAA 2.074 (0.040) PGAA 2.123 (0.032) XRF 2.147 (0.065) 2.11 (0.06) % Mg INAA 1.456 (0.032) XRF 1.464 (0.020) 1.46 (0.02) % Mn XRF 5301 (15) INAA 518.1 (9.1) PGAA 537.3 (7.2) 529 (18) mg/kg Na INAA 1.214 (0.024) XRF 1.233 (0.015) 1.22 (0.03) % Pb ID-ICP-MS 17.28 (0.09) 17.28 (0.09) mg/kg Si PGAA 30.27 (0.65) XRF 30.28 (0.20) 30.3 (0.4) % Ti XRF 0.338 (0.006) INAA 0.331 (0.007) PGAA 0.339 (0.007) 0.336 (0.007) % Sr XRF 236 (6.5) ICP-OES 243 (3.1) INAA 237 (8.8) 239 (6) mg/kg V INAA 105.7 (2.1) XRF 113 (18) 110 (11) mg/kg Ba XRF 957.1 (5.7) ICP-OES 986.8 (6.6) INAA 992 (22) 979 (28) mg/kg Co INAA 12.97 (0.15) ICP-OES 12.68 (0.17) 12.8 (0.2) mg/kg P XRF 0.0685 (0.0009) ICP-OES 0.0692 (0.0024) 0.0688 (0.0013) mg/kg Sb INAA 1.58 (0.05) ICP-MS 1.51 (0.05) 1.55 (0.06) mg/kg Zr INAA 201 (24) XRF 190 (42) 195 (46) mg/kg

31
Table A2. Results from analyses of SRM 2709a: NIST reference values based on individual NIST methods and USGS results from analyses performed before regrinding.
USGS results were used to confirm NIST values with the exception of the value for Sc (shown in the shaded box) which failed to confirm NIST results.
Element NIST Method Reference Value
(mg/kg) Estimated U
(mg/kg)
USGS
Method
Confirmatory Value (1s) (mg/kg)
As NIST-INAA 10.5 0.3 ICP-MS 10.8 (0.7) Ce INAA 42 1 ICP-AES 40.4 (1.3)
ICP-MS 42 (2) Cs INAA 5.0 0.1 ICP-MS 4.81 (0.18) Cu ICP-MS 33.9 0.5 ICP-AES 32.4 (0.8)
ICP-MS 34.3 (1.4) Eu INAA 0.83 0.02 ICP-MS 0.84 (0.02) Gd PGAA 3.0 0.1 ICP-MS 3.1 (0.1)
Hg* ID-CV-ICP-MS 0.9 0.2 CV-AAS 0.9 (0.2) La INAA 21.7 0.4 ICP-AES 22.0 (0.6)
ICP-MS 22.8 (0.9 Ni ICP-MS 85 2 Rb INAA 99 3 ICP-MS 95 (6) Sc INAA 11.1 0.1 ICP-AES 11.8 (0.2) Th INAA 10.9 0.2 Tl ICP-MS 0.58 0.01 ICP-MS 0.58 (0.02) U ICP-MS 3.15 0.05 ICP-MS 3.18 (0.13) Zn INAA 103 4 ICP-AES 101 (3)
ICP-MS 96 (4)

32
Table A3. Results from Analyses of SRM 2709a: Results from individual NIST methods used to provide Information Values and USGS results from analyses before regrinding, used to confirm NIST information values.
The value for Se shown in the shaded box failed to confirm NIST results.
Element NIST Method
Value (U) (mg/kg)
Information Value (mg/kg)
USGS
Method
Confirmatory Value (1s) (mg/kg)
B PGAA 75 (2) 75 Dy INAA 2.9 (0.1) 3 ICP-MS 2.7 (0.1) Nd INAA 16.5 (1.7) 17 ICP-AES 19 (0.5)
ICP-MS 16.2 (0.4) Hf INAA 4.4 (0.2) 4 ICP-MS 4.0 (0.4) Lu INAA 0.30 (0.01) 0.3 ICP-MS 0.29 (0.1) Se CCT-ICP-MS 1.53 (0.05) 1.5 HG-AAS 1.3 (0.1) Sm INAA 3.7 (0.1) 4 ICP-MS 3.5 (0.1) Ta INAA 0.71 (0.03) 0.7 Tb INAA 0.49 (0.03) 0.5 ICP-MS 0.47 (0.01) Yb INAA 1.82 (0.04) 2 ICP-AES 1.62 (0.05)
ICP-MS 1.70 (0.03)

33
Table A4. Results from Analyses of SRM 2710a: results from individual NIST methods used to calculate certified values (also shown).
Element NIST Method Value (U) Certified Value (U) Unit Al INAA 5.961 (0.064) 5.95 (0.05) % XRF 5.947 (0.073) % As INAA-longs 1602 (41) 1550 (100) mg/kg CCT-ICP-MS 1542 (69) mg/kg XRF 1490 (29) mg/kg Ba INAA-longs 809 (37) 792 (36) mg/kg XRF 774 (41) mg/kg Ca INAA-shorts 9870 (270) 0.964 (0.045) % XRF 9410 (300) Cd ID-ICP-MS 12.0 (0.1) 12.3 (0.3) mg/kg PGAA 12.5 (0.2) Co INAA-longs 6.09 (0.07) 5.99 (0.14) mg/kg ICP-OES 5.88 (0.06) Cu INAA-shorts 3386 (80) 0.342 (0.005) % XRF 3440 (38) Fe INAA-longs 4.35 (0.05) 4.32 (0.08) % XRF 4.29 (0.10) PGAA 4.32 (0.04) K INAA-shorts 2.08 (0.03) 2.17 (0.13) % XRF 2.23 (0.15) PGAA 2.20 (0.03) La INAA-shorts 29.6 (0.6) 30.6 (1.2) mg/kg INAA-longs 31.5 (0.5) Mg INAA-shorts 0.737 (0.075) 0.734 (0.038) % XRF 0.730 (0.015) Mn INAA-shorts 0.211 (0.002) 0.214 (0.006) % PGAA 0.215 (0.005) XRF 0.217 (0.004) Na INAA-shorts 0.888 (0.010) 0.894 (0.019) % XRF 0.900 (0.033) P ICP-OES 0.1065 (0.0023) 0.105 (0.004) % XRF 0.1025 (0.0024) Sb INAA-longs 53.6 (0.8) 52.5 (1.6) mg/kg ICP-MS 51.4 (0.9) Si XRF 31.0 (0.4) 31.1 (0.4) % PGAA 31.3 (0.4) Sr ICP-OES 258.1 (3.3) 255 (7) mg/kg XRF 251.3 (8.7) Ti PGAA 0.313 (0.004) 0.311 (0.007) % XRF 0.309 (0.012) U INAA-longs 9.16 (0.53) 9.11 (0.30) mg/kg ICP-MS 9.05 (0.13) Zn INAA-longs 4293 (84) 0.418 (0.015) % XRF 4062 (49)

34
Table A5. Results from Analyses of SRM 2710a: NIST reference values based on individual NIST methods and USGS results from analyses performed before regrinding.
USGS results were used to confirm NIST values with the exception of the value for Gd shown in the shaded box which failed to confirm NIST results.
Element NIST Method Reference Value
(mg/kg) Estimated U
(mg/kg)
USGS
Method
Confirmatory Value (1s) (mg/kg)
Cs INAA 8.25 0.11 ICP-MS 7.7 (0.2) Cr Combined 23 6 INAA 25.6 0.5 XRF 19.7 2.2
Eu INAA 0.82 0.01 ICP-MS 0.84 (0.05) Gd PGAA 3.0 0.1 ICP-MS 3.5 (0.1) Lu INAA 0.31 0.01 ICP-MS 0.32 (0.02) Nd INAA 22 2 ICP-MS 21 (1) Ni Combined 8 1 ICP-MS 8.0 (0.2)
ICP-MS 8.3 0.2 ICP-OES 7.4 0.1
Rb INAA 117 3 ICP-MS 109 (3) Sc INAA 9.9 0.1 ICP-AES 9.9 (0.1) Sm Combined: 4.0 0.2
INAA-short 3.82 0.10 INAA-long 4.14 0.11
Tl ICP-MS 1.52 0.02 ICP-MS 1.56 (0.5) Th ICP-MS 18.3 0.3 ICP-MS 18.6 (0.4) V Combined 82 9 ICP-MS 80 (2) INAA 79 2 ICP-AES 81.4 (0.6) XRF 88 9

35
Table A6. Results from Analyses of SRM 2710a: results from individual NIST methods used to provide information values for the Certificate of Analysis and USGS results from analyses before regrinding, used to confirm NIST information values.
Element NIST Method Value (U) (mg/kg)
Information Value (mg/kg)
USGS
Method
Confirmatory Value (1s) (mg/kg)
B PGAA 18.8 (0.3) 20 Ce INAA 58 (1) 60 Dy INAA 3.1 (0.4) 3 Au INAA 0.21 (0.01) 0.2 Hf INAA 6.9 (0.2) 7 ICP-MS 6.5 (0.9) In INAA 7.3 (0.2) 7 ICP-MS 8.2 (0.3) Se CCT-ICP-MS 1.3 (0.1) 1 HG-AAS 4.1 (0.2) Ag INAA 43 (1) 40 ICP-AES 39.4 (0.5) Ta INAA 0.91 (0.03) 0.9 ICP-MS 0.8 Tb INAA 0.53 (0.01) 0.5 ICP-MS 0.52 (0.10) W INAA 191 (5) 190 Yb INAA 2.0 (0.1) 2
Zr XRF 230 (50) 200 ICP-MS WDXRF
200 (20) 220 (10)

36
Table A7. Results from Analyses of SRM 2711a: results from individual NIST methods used to calculate certified values (also shown).
Element Method Value (U) Certified Value (U) Unit Al INAA 6.69 (0.08) 6.72 (0.06) % XRF 6.74 (0.05) % As INAA 102.6 (1.6) mg/kg INAA 107.3 (1.8) 107 (5) mg/kg XRF 110.4 (2.4) mg/kg Ba ICP-OES 719 (6) mg/kg INAA 736 (21) 730 (15) mg/kg XRF 734 (16) mg/kg Ca INAA 2.45 (0.05) 2.42 (0.06) % XRF 2.40 (0.10) % Cd ID-ICP-MS 54.1 (0.5) 54.1 (0.5) mg/kg Co ICP-OES 9.85 (0.22) 9.89 (0.18) mg/kg INAA 9.93 (0.26) mg/kg Cr INAA 50.6 (1.4) 52.3 (2.9) mg/kg XRF 53.9 (2.9) mg/kg Cu ICP-OES 139.9 (1.7) 140 (2) mg/kg ICP-MS 140.8 (2.9) mg/kg Fe INAA 2.83 (0.03) % PGAA 2.79 (0.04) 2.82 (0.4) % XRF 2.83 (0.03) % Hg CV-ID-ICP-MS 7.42 (0.18) 7.42 (0.18) mg/kg K INAA 2.47 (0.03) % PGAA 2.54 (0.03) 2.53 (0.10) % XRF 2.59 (0.11) % Mn INAA 676 (10) 675 (18) mg/kg XRF 674 (20) mg/kg Mg INAA 1.114 (0.043) 1.07 (0.06) % XRF 1.022 (0.024) % Na INAA 1.206 (0.015) 1.20 (0.01 % XRF 1.200 (0.022) % Ni ICP-OES 21.14 (0.41) 21.7 (0.7 mg/kg ICP-MS 22.26 (0.31) mg/kg P ICP-OES 0.0838 (0.0020) 842 (11) % XRF 0.0845 (0.0010) % Pb ID-ICP-MS 1405 (9) 0.140 (0.001) mg/kg Sb ICP-MS 22.72 (0.55) 23.8 (1.4) mg/kg INAA 24.8 (0.5) mg/kg Si PGAA 31.4 (0.5) 31.4 (0.7) % XRF 31.3 (0.2) % Sm INAA 5.84 (0.11) 5.93 (0.28) mg/kg INAA 6.13 (0.25) mg/kg PGAA 5.82 (0.08) mg/kg Sr ICP-OES 236.7 (2.8) mg/kg INAA 248 (14) 242 (10) mg/kg XRF 240.6 (3.3) mg/kg Ti INAA 0.318 (0.014) % PGAA 0.321 (0.006) 0.317 (0.008) % XRF 0.312 (0.004) % U ICP-MS 2.97 (0.09) 3.01 (0.12) mg/kg

37
INAA 3.06 (0.18) mg/kg V INAA 80.03 (1.29) 80.7 (5.7) mg/kg XRF 81.4 (5.1) mg/kg Zn INAA 415 (9) 414 (11) mg/kg XRF 412.5 (10.2) mg/kg

38
Table A8. Results from Analyses of SRM 2711a: NIST reference values based on individual NIST methods and USGS results from analyses performed before regrinding.
USGS results were used to confirm NIST values.
Element NIST Method Reference Value
(mg/kg) Estimated U
(mg/kg)
USGS
Method
Confirmatory Value (1s) (mg/kg)
Cs INAA 6.7 0.2 ICP-MS INAA
6.3 (0.1) 6.7 (0.2)
Eu INAA 1.1 0.2 INAA 1.10 (0.02) Hf INAA 9.2 0.2 INAA 9.0 (0.3)
La INAA 38 1
ICP-MS ICP-AES
INAA
38 (1) 36 (1) 38 (1)
Nd INAA 29 2
ICP-AES INAA
EDXRF
30 (1) 32 (2) 26 (5)
Rb INAA 120 4
ICP-MS INAA
EDXRF
114 (2) 117 (2) 118 (1)
Sc INAA 8.5 0.1
ICP-MS INAA
EDXRF
8.4 (0.2) 8.5 (0.1) 8.6 (0.2)
Th INAA 15 1
ICP-MS ICP-AES
INAA
14 (1) 13 (1) 15 (1)

39
Table A9. Results from Analyses of SRM 2711a: Information Values
Element NIST Method
Value (U) (mg/kg)
Information Value (mg/kg)
USGS
Method
Confirmatory Value (1s) (mg/kg)
Ag INAA
6.1 (0.3) 6 ICP-MS ICP-AES
5.9 (0.2) 5.8 (0.3)
B PGAA 50.5 (0.6) 50 Ce INAA 74 (2) 70 ICP-MS 66 (1)
ICP-AES 66(1) INAA 77 (2) EDXRF 62 (3)
Dy INAA 5.0 (0.2) 5 Gd PGAA 5.1 (0.1) 5 INAA 5.5 (0.1) In INAA 1.25 (0.06) 1 Lu INAA 0.52 (0.01) 0.5 INAA 0.5 Se CCT-ICP-MS 2.0 (0.1) 2 WDXRF 1.5 (0.1) Ta INAA 1.42 (0.03) 1 Tb INAA 0.83 (0.02) 0.8 Tl ICP-MS 2.93 (0.04) 3 ICP-MS 2.8 Yb INAA 3.2 (0.1) 3 ICP-AES 2.4 (0.1)
INAA 3.3 (0.1)