certification of standard reference material® 2386 avocado
TRANSCRIPT

NIST Special Publication 260-213
Certification of Standard Reference Material® 2386
Avocado Powder
Melissa M. Phillips Laura J. Wood
Joseph F. Browning George C. Caceres
Grace E. Hahm Mahboubeh Hanaee
Abigail Lee Karen E. Murphy
Rabia Oflaz Rick Paul
Benjamin J. Place Jeanice Brown Thomas
James H. Yen
This publication is available free of charge from: https://doi.org/10.6028/NIST.SP.260-213

This page intentionally blank.

NIST Special Publication 260-213
Certification of Standard Reference Material® 2386
Avocado Powder
Melissa M. Phillips Laura J. Wood
Joseph F. Browning George C. Caceres
Grace E. Hahm Mahboubeh Hanaee
Abigail Lee Karen E. Murphy
Rabia Oflaz (Retired) Rick Paul
Benjamin J. Place Jeanice Brown Thomas (Retired)
Chemical Sciences Division Material Measurement Laboratory
James H. Yen
Statistical Engineering Division Information Technology Laboratory
This publication is available free of charge from:
https://doi.org/10.6028/NIST.SP.260-213
October 2021
U.S. Department of Commerce Gina M. Raimondo, Secretary
National Institute of Standards and Technology
James K. Olthoff, Performing the Non-Exclusive Functions and Duties of the Under Secretary of Commerce for Standards and Technology & Director, National Institute of Standards and Technology

Certain commercial entities, equipment, or materials may be identified in this document in order to describe an experimental procedure or concept adequately.
Such identification is not intended to imply recommendation or endorsement by the National Institute of Standards and Technology, nor is it intended to imply that the entities, materials, or equipment are necessarily the best available for the purpose.
National Institute of Standards and Technology Special Publication 260-213 Natl. Inst. Stand. Technol. Spec. Publ. 260-213, 113 pages (October 2021)
CODEN: NSPUE2
This publication is available free of charge from: https://doi.org/10.6028/NIST.SP.260-213

v
This publication is available free of charge from: https://doi.org/10.6028/N
IST.SP.260 -213
Abstract
The National Institute of Standards and Technology (NIST) recently released Standard Reference Material (SRM) 2386 Avocado Powder which has value assignment for over 70 analytes. This material is intended to be used for the evaluation of methods for the determination of elements, vitamins, amino acids, fatty acids, and proximates in this and similar matrices. The material was purchased pre-packaged from a commercial vendor and data was obtained from NIST and interlaboratory comparison exercises. A description of the material, sample preparations, results, and data analysis are discussed in the following report.
Keywords:
Amino Acids; Avocado; Elements; Fat-Soluble Vitamins; Fatty Acids; Moisture; Proximates; Reference Material; Water-Soluble Vitamins.
Table of Contents 2.1 Acquisition & Packaging ........................................................................................................ 2 2.2 Irradiation ................................................................................................................................ 2 2.3 Storage ..................................................................................................................................... 3
3.1 NIST Methods and Procedures ............................................................................................... 4
Moisture Content .............................................................................................................. 4 3.1.1.1 Freeze Drying ............................................................................................................. 4 3.1.1.2 Desiccator Drying ...................................................................................................... 4 3.1.1.3 Forced Air Drying ...................................................................................................... 4 3.1.1.4 Moisture Calculation .................................................................................................. 4
Elements ........................................................................................................................... 5 3.1.2.1 ICP-OES Analysis ...................................................................................................... 5 3.1.2.2 ID ICP-MS Analysis .................................................................................................. 7 3.1.2.3 TNPGAA Analysis .................................................................................................. 10
Water-Soluble Vitamins and Related Measurands ......................................................... 11 3.1.3.1 Ascorbic Acid (Vitamin C) ...................................................................................... 11 3.1.3.2 B Vitamins ............................................................................................................... 12 3.1.3.3 Choline and Carnitine .............................................................................................. 16
Fatty Acids ...................................................................................................................... 18 3.2 GMA FIAC Interlaboratory Studies ...................................................................................... 21
Fall 2015 GMA Study .................................................................................................... 22 Spring 2016 GMA Study ................................................................................................ 23
3.3 Statistical Approaches for Value Assignment ....................................................................... 23 4.1 Moisture ................................................................................................................................ 25
NIST Results ................................................................................................................... 25 GMA Results .................................................................................................................. 27 Value Assignment and Dry-Mass Conversions .............................................................. 27
4.2 Elements ................................................................................................................................ 28 Boron .............................................................................................................................. 28 Cadmium ........................................................................................................................ 29

vi
This publication is available free of charge from: https://doi.org/10.6028/N
IST.SP.260 -213
Calcium, Copper, Iron, Potassium, Magnesium, Manganese, Sodium, Phosphorus, and Zinc 32
4.2.3.1 Calcium .................................................................................................................... 32 4.2.3.2 Copper ...................................................................................................................... 33 4.2.3.3 Iron ........................................................................................................................... 35 4.2.3.4 Potassium ................................................................................................................. 36 4.2.3.5 Magnesium ............................................................................................................... 37 4.2.3.6 Manganese ............................................................................................................... 38 4.2.3.7 Sodium ..................................................................................................................... 39 4.2.3.8 Phosphorus ............................................................................................................... 40 4.2.3.9 Zinc .......................................................................................................................... 41 4.2.3.10 Uncertainty Budget .................................................................................................. 42
Molybdenum ................................................................................................................... 42 Selenium ......................................................................................................................... 43 Value Assignment ........................................................................................................... 44
4.3 Vitamins ................................................................................................................................ 45 Vitamin C (Ascorbic Acid) ............................................................................................. 45 B Vitamins ...................................................................................................................... 46
4.3.2.1 Thiamine (Vitamin B1) ............................................................................................. 50 4.3.2.2 Riboflavin (Vitamin B2) ........................................................................................... 51 4.3.2.3 Niacinamide (Vitamin B3) ........................................................................................ 52 4.3.2.4 Niacin (Vitamin B3) ................................................................................................. 53 4.3.2.5 Total Vitamin B3 as Niacinamide ............................................................................ 54 4.3.2.6 Pantothenic Acid (Vitamin B5) ................................................................................ 55 4.3.2.7 Pyridoxal (Vitamin B6) ............................................................................................ 56 4.3.2.8 Pyridoxine (Vitamin B6) .......................................................................................... 57 4.3.2.9 Total Vitamin B6 ...................................................................................................... 58
Choline and Carnitine ..................................................................................................... 59 4.3.3.1 Choline ..................................................................................................................... 61 4.3.3.2 Carnitine ................................................................................................................... 62
Biotin .............................................................................................................................. 63 myo-Inositol .................................................................................................................... 63 Total Folate ..................................................................................................................... 63 Retinol (Vitamin A) ........................................................................................................ 64 β-Carotene ...................................................................................................................... 64 Tocopherols (Vitamin E) ................................................................................................ 65
Vitamin K ....................................................................................................................... 65 Value Assignment ........................................................................................................... 66
4.4 Fatty Acids ............................................................................................................................ 67 Lauric Acid (C12:0) ........................................................................................................ 68 Myristic Acid (C14:0) .................................................................................................... 69 Palmitic Acid (C16:0) ..................................................................................................... 70 Palmitoleic Acid (C16:1-9c) ........................................................................................... 71 Stearic Acid (C18:0) ....................................................................................................... 72 Oleic Acid (C18:1-9c) .................................................................................................... 73 Vaccenic Acid (C18:1-11c) ............................................................................................ 74 Total cis-C18:1 Fatty Acids ............................................................................................ 75 Total trans-C18:1 Fatty Acids ........................................................................................ 76
Linoleic Acid (C18:2-9,12c) ........................................................................................... 77 Total cis-C18:2 Fatty Acids ............................................................................................ 78

vii
This publication is available free of charge from: https://doi.org/10.6028/N
IST.SP.260 -213
Total trans-C18:2 Fatty Acids ........................................................................................ 79 γ-Linolenic Acid (C18:3-6,9,12c) .................................................................................. 80 α-Linolenic Acid (C18:2-9,12c) ..................................................................................... 81 Arachidic Acid (C20:0) .................................................................................................. 82 Total cis-C20:1 Fatty Acids ............................................................................................ 83 Eicosadienoic Acid (C20:2-11,14c) ............................................................................... 84 Behenic Acid (C22:0) ..................................................................................................... 85 Lignoceric Acid (C24:0) ................................................................................................. 86 Total ω-3 Fatty Acids ..................................................................................................... 87 Total ω-6 Fatty Acids ..................................................................................................... 88 Saturated Fat ................................................................................................................... 89 cis-Monounsaturated Fat ................................................................................................ 90 cis-Polyunsaturated Fat ................................................................................................... 91 Total trans-Fat ................................................................................................................ 92 Value Assignment ........................................................................................................... 93
4.5 Proximates ............................................................................................................................. 94 Total Fat (Sum of Fatty Acids as Triglycerides) ............................................................ 94 Ash .................................................................................................................................. 94 Protein ............................................................................................................................. 95 Carbohydrates ................................................................................................................. 95 Total Dietary Fiber ......................................................................................................... 96 Total Sugars .................................................................................................................... 96 Calories ........................................................................................................................... 97 Value Assignment ........................................................................................................... 97
4.6 Amino Acids ......................................................................................................................... 98 Fall 2015 GMA Study .................................................................................................... 98 Value Assignment ......................................................................................................... 100
Table of Tables Table 1. Methods Used for Elemental Determinations ......................................................................... 5 Table 2. Microwave Settings for Digestion of SRM 2386 Samples for Elemental Analysis ............... 6 Table 3. Standards and Approximate Mass Fractions for Determination of Elements ........................ 6 Table 4. ICP-OES Parameters Used to Measure Elements ................................................................... 7 Table 5. Instruments and Labware Used in the Analysis of Cadmium (Cd) ........................................ 8 Table 6. ICP-MS Dwell Times for Target and Interfering Ions ......................................................... 10 Table 7. Methods Used for Vitamin Determinations .......................................................................... 11 Table 8. LC Gradient Profile Used for Analysis of B Vitamins ......................................................... 13 Table 9. Calibration Materials used for Determination of B Vitamins ............................................... 14 Table 10. Isotopically Labelled Standards used for Determination of B Vitamins ............................ 14 Table 11. Multiple Reaction Monitoring Conditions for B Vitamins ................................................. 15 Table 12. LC Gradient Profile Used for Analysis of Choline and Carnitine ...................................... 17 Table 13. Multiple Reaction Monitoring Conditions for Choline and Carnitine ................................ 18 Table 14. Factors for Converting Fatty Acid Methyl Ester to Free Fatty Acid Percentages .............. 20 Table 15. Reported Usage of Hydrolysis and Derivatization Methods for Fatty Acids ..................... 21 Table 16. Participants in the Fall 2015 GMA Study ........................................................................... 22 Table 17. Participants in the Spring 2016 GMA Study ...................................................................... 23 Table 18. NIST Results for Moisture, % ............................................................................................ 25 Table 19. Fall 2015 GMA Study Results for Moisture, % ................................................................. 27

viii
This publication is available free of charge from: https://doi.org/10.6028/N
IST.SP.260 -213
Table 20. Summary of Results for Boron (B), mg/kg ........................................................................ 28 Table 21. Uncertainty Budget for TNPGAA Analysis of Boron (B) ................................................. 29 Table 22. Summary of Results for Cadmium (Cd), mg/kg ................................................................. 29 Table 23. Uncertainty Budget for ID ICP-MS Analysis of Cadmium (Cd) ....................................... 31 Table 24. Summary of Results for Calcium (Ca), mg/kg ................................................................... 32 Table 25. Summary of Results for Copper (Cu), mg/kg ..................................................................... 33 Table 26. Summary of Results for Iron (Fe), mg/kg .......................................................................... 35 Table 27. Summary of Results for Potassium (K), mg/kg .................................................................. 36 Table 28. Summary of Results for Magnesium (Mg), mg/kg ............................................................. 37 Table 29. Summary of Results for Manganese (Mn), mg/kg ............................................................. 38 Table 30. Summary of Results for Sodium (Na), mg/kg .................................................................... 39 Table 31. Summary of Results for Phosphorus (P), mg/kg ................................................................ 40 Table 32. Summary of Results for Zinc (Zn), mg/kg ......................................................................... 41 Table 33. Uncertainty Budget for ICP-OES Analysis of Ca, Cu, Fe, K, Mg, Mn, Na, P, and Zn ...... 42 Table 34. Summary of Results for Molybdenum (Mo), mg/kg .......................................................... 42 Table 35. Summary of Results for Selenium (Se), mg/kg .................................................................. 43 Table 36. Summary of Estimates for Elements in SRM 2386, mg/kg ................................................ 44 Table 37. Summary of NIST Results for Ascorbic Acid (Vitamin C), mg/kg ................................... 45 Table 38. Fall 2015 GMA Study Results for Ascorbic Acid (Vitamin C), mg/kg ............................. 46 Table 39. Summary of Results for Thiamine (Vitamin B1), mg/kg .................................................... 50 Table 40. Summary of Results for Riboflavin (Vitamin B2), mg/kg .................................................. 51 Table 41. Summary of Results for Niacinamide (Vitamin B3), mg/kg ............................................... 52 Table 42. Summary of Results for Niacin (Vitamin B3), mg/kg ........................................................ 53 Table 43. Summary of Results for Total Vitamin B3 as Niacinamide, mg/kg .................................... 54 Table 44. Summary of Results for Pantothenic Acid (Vitamin B5), mg/kg ....................................... 55 Table 45. Summary of Results for Pyridoxal (Vitamin B6), mg/kg .................................................... 56 Table 46. Summary of Results for Pyridoxine (Vitamin B6), mg/kg .................................................. 57 Table 47. Summary of Results for Total Vitamin B6, mg/kg ............................................................. 58 Table 48. Summary of Results for Choline, mg/kg ............................................................................ 61 Table 49. Summary of Results for Carnitine, mg/kg .......................................................................... 62 Table 50. Summary of Results for Biotin, mg/kg ............................................................................... 63 Table 51. Summary of Results for myo-Inositol, mg/kg ..................................................................... 63 Table 52. Summary of Results for Total Folate, mg/kg ..................................................................... 63 Table 53. Summary of Results for Retinol (Vitamin A), mg/kg ........................................................ 64 Table 54. Summary of Results for b-Carotene (Provitamin A), mg/kg .............................................. 64 Table 55. Summary of Results for Tocopherols (Vitamin E), mg/kg ................................................. 65 Table 56. Summary of Results for Vitamin K, mg/kg ........................................................................ 65 Table 57. Summary of Estimates for Vitamins in SRM 2386, mg/kg ................................................ 66 Table 58. Summary of Results for Lauric Acid, % ............................................................................ 68 Table 59. Summary of Results for Myristic Acid, % ......................................................................... 69 Table 60. Summary of Results for Palmitic Acid, % .......................................................................... 70 Table 61. Summary of Results for Palmitoleic Acid, % ..................................................................... 71 Table 62. Summary of Results for Stearic Acid, % ............................................................................ 72 Table 63. Summary of Results for Oleic Acid, % .............................................................................. 73 Table 64. Summary of Results for Vaccenic Acid, % ........................................................................ 74 Table 65. Summary of Results for Total cis-C18:1 Fatty Acids, % ................................................... 75 Table 66. Summary of Results for Total trans-C18:1 Fatty Acids, % ............................................... 76 Table 67. Summary of Results for Linoleic Acid, % .......................................................................... 77 Table 68. Summary of Results for Total cis-C18:2 Fatty Acids, % ................................................... 78 Table 69. Summary of Results for Total trans-C18:2 Fatty Acids, % ............................................... 79 Table 70. Summary of Results for γ-Linolenic Acid, % ..................................................................... 80
ix
This publication is available free of charge from: https://doi.org/10.6028/N
IST.SP.260 -213
Table 71. Summary of Results for α-Linolenic Acid, % .................................................................... 81 Table 72. Summary of Results for Arachidic Acid, % ....................................................................... 82 Table 73. Summary of Results for Total cis-C20:1 Fatty Acids, % ................................................... 83 Table 74. Summary of Results for Eicosadienoic Acid, % ................................................................ 84 Table 75. Summary of Results for Behenic Acid, % .......................................................................... 85 Table 76. Summary of Results for Lignoceric Acid, % ...................................................................... 86 Table 77. Summary of Results for Total ω-3 Fatty Acids, % ............................................................. 87 Table 78. Summary of Results for Total ω-6 Fatty Acids, % ............................................................. 88 Table 79. Summary of Results for Saturated Fat, % .......................................................................... 89 Table 80. Summary of Results for cis-Monosaturated Fat, % ............................................................ 90 Table 81. Summary of Results for cis-Polyunsaturated Fat, % .......................................................... 91 Table 82. Summary of Results for Total trans-Fat, % ........................................................................ 92 Table 83. Summary of Estimates for Fatty Acids in SRM 2386, % ................................................... 93 Table 84. Summary of Results for Total Fat, % ................................................................................. 94 Table 85. Summary of Results for Ash, % ......................................................................................... 94 Table 86. Summary of Results for Protein, % .................................................................................... 95 Table 87. Summary of Results for Carbohydrates, % ........................................................................ 95 Table 88. Summary of Results for Dietary Fiber, % .......................................................................... 96 Table 89. Summary of Results for Total Sugars, % ........................................................................... 96 Table 90. Summary of Results for Calories, kcal/100 g ..................................................................... 97 Table 91. Summary of Estimates for Proximates in SRM 2386 ......................................................... 97 Table 92. Summary of Results for Amino Acids, % .......................................................................... 98 Table 93. Summary of Estimates for Amino Acids in SRM 2386, % .............................................. 100
Table of Figures Figure 1. NIST adaptation of the AOAC food composition triangle. The white “+” depict the location of available food-matrix reference materials. ......................................................................... 1 Figure 2. Product Specification for Avopure Freeze-Dried Avocado Powder ..................................... 2 Figure 3. Certificate of Irradiation for SRM 2386 ................................................................................ 3 Figure 4. Exemplar LC-UV Chromatogram of Ascorbic Acid (Vitamin C) Avocado Powder ......... 12 Figure 5. Exemplar ID-LC-MS/MS Chromatogram for B Vitamins .................................................. 16 Figure 6. Exemplar ID-LC-MS/MS Chromatogram for Choline and Carnitine ................................. 18 Figure 7. Exemplar Chromatograms of Fatty Acids ........................................................................... 20 Figure 8. Change in Percent Moisture of SRM 2386 as a Function of Time in Desiccator ............... 25 Figure 9. Percent Moisture of SRM 2386 as a Function of Box Number .......................................... 26 Figure 10. Percent Moisture of SRM 2386 as a Function of Sample Weight .................................... 26 Figure 11. Boron (B) Dry-Mass Basis Mass Fraction as a Function of Box Number ........................ 28 Figure 12. Cadmium (Cd) Dry-Mass Mass Fraction as a Function of Box Number .......................... 30 Figure 13. Calcium (Ca) Mass Fraction as a Function of Box Number ............................................. 33 Figure 14. Copper (Cu) Mass Fraction as a Function of Box Number ............................................... 34 Figure 15. Iron (Fe) Mass Fraction as a Function of Box Number .................................................... 35 Figure 16. Potassium (K) Mass Fraction as a Function of Box Number ............................................ 36 Figure 17. Magnesium (Mg) Mass Fraction as a Function of Box Number ....................................... 37 Figure 18. Manganese (Mn) Mass Fraction as a Function of Box Number ....................................... 38 Figure 19. Sodium (Na) Mass Fraction as a Function of Box Number .............................................. 39 Figure 20. Phosphorus (P) Mass Fraction as a Function of Box Number .......................................... 40 Figure 21. Zinc (Zn) Mass Fraction as a Function of Box Number ................................................... 41 Figure 22. Ascorbic Acid (Vitamin C) Mass Fraction as a Function of Box Number ....................... 46 Figure 23. Optimization of Extraction Temperature and Number of Cycles for B Vitamins ............ 48 Figure 24. Thiamine (Vitamin B1) Mass Fraction as a Function of Box Number .............................. 50

x
This publication is available free of charge from: https://doi.org/10.6028/N
IST.SP.260 -213
Figure 25. Riboflavin (Vitamin B2) Mass Fraction as a Function of Box Number ............................ 51 Figure 26. Niacinamide (Vitamin B3) Mass Fraction as a Function of Box Number ......................... 52 Figure 27. Niacin (Vitamin B3) Mass Fraction as a Function of Box Number .................................. 53 Figure 28. Total Vitamin B3 Mass Fraction as a Function of Box Number ....................................... 54 Figure 29. Pantothenic Acid (Vitamin B5) Mass Fraction as a Function of Box Number ................. 55 Figure 30. Pyridoxal (Vitamin B6) Mass Fraction as a Function of Box Number .............................. 56 Figure 31. Pyridoxine (Vitamin B6) Mass Fraction as a Function of Box Number ............................ 57 Figure 32. Total Vitamin B6 Mass Fraction as a Function of Box Number ....................................... 58 Figure 33. Optimization of Microwave Hold Temperature for Choline and Carnitine Extraction .... 59 Figure 34. Optimization of Microwave Hold Time and Acid Mass Fraction for Choline and Carnitine Extraction ............................................................................................................................ 59 Figure 35. Impact of Post-Hydrolysis Enzyme Treatment on Recovery for Choline and Carnitine .. 60 Figure 36. Choline Mass Fraction as a Function of Box Number ...................................................... 61 Figure 37. Carnitine Mass Fraction as a Function of Box Number .................................................... 62 Figure 38. Lauric Acid Mass Fraction as a Function of Box Number ................................................ 68 Figure 39. Palmitic Acid Mass Fraction as a Function of Box Number ............................................. 70 Figure 40. Palmitoleic Acid Mass Fraction as a Function of Box Number ........................................ 71 Figure 41. Stearic Acid Mass Fraction as a Function of Box Number ............................................... 72 Figure 42. Oleic Acid Mass Fraction as a Function of Box Number ................................................. 73 Figure 43. Vaccenic Acid Mass Fraction as a Function of Box Number ........................................... 74 Figure 44. Total cis-C18:1 Mass Fraction as a Function of Box Number .......................................... 76 Figure 45. Linoleic Acid Mass Fraction as a Function of Box Number ............................................. 77 Figure 46. α-Linolenic Acid Mass Fraction as a Function of Box Number ....................................... 82 Figure 47. Total cis-C20:1 Mass Fraction as a Function of Box Number .......................................... 84

1
This publication is available free of charge from: https://doi.org/10.6028/N
IST.SP.260 -213
1 Introduction In 1997 and 2000, NIST held workshops to identify needs of the food industry and federal regulators. Among other things, NIST was asked to continue production of food-matrix SRMs in various sectors of the AOAC food composition triangle [1] for use by laboratories making measurements in support of nutrition labeling. These laboratories need a means for demonstrating method validity and accuracy when analyzing food products to generate data for nutrition labels. SRM 2386 fills a void in sector 2 of the food triangle as a high fat material with substantive nutritional content (Figure 1). In addition, SRM 2386 would be only the second powdered material in the upper sectors of the food triangle.
Figure 1. NIST adaptation of the AOAC food composition triangle. The white “+” depict the location of available food-matrix reference materials.
2
This publication is available free of charge from: https://doi.org/10.6028/N
IST.SP.260 -213
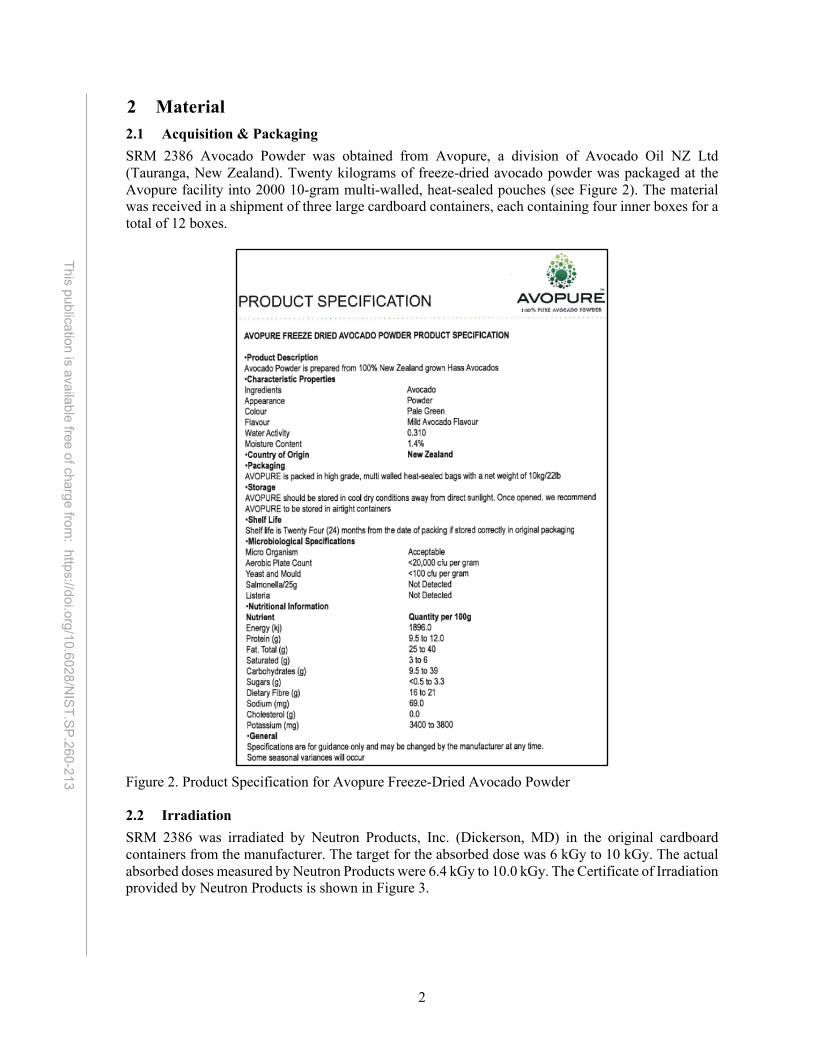
2 Material 2.1 Acquisition & Packaging SRM 2386 Avocado Powder was obtained from Avopure, a division of Avocado Oil NZ Ltd (Tauranga, New Zealand). Twenty kilograms of freeze-dried avocado powder was packaged at the Avopure facility into 2000 10-gram multi-walled, heat-sealed pouches (see Figure 2). The material was received in a shipment of three large cardboard containers, each containing four inner boxes for a total of 12 boxes.
Figure 2. Product Specification for Avopure Freeze-Dried Avocado Powder 2.2 Irradiation SRM 2386 was irradiated by Neutron Products, Inc. (Dickerson, MD) in the original cardboard containers from the manufacturer. The target for the absorbed dose was 6 kGy to 10 kGy. The actual absorbed doses measured by Neutron Products were 6.4 kGy to 10.0 kGy. The Certificate of Irradiation provided by Neutron Products is shown in Figure 3.

3
This publication is available free of charge from: https://doi.org/10.6028/N
IST.SP.260 -213
Figure 3. Certificate of Irradiation for SRM 2386
2.3 Storage The packets of SRM 2386 have been stored at room temperature (18 °C to 22 °C) at NIST since their receipt.

4
This publication is available free of charge from: https://doi.org/10.6028/N
IST.SP.260 -213
3 Experimental Procedures 3.1 NIST Methods and Procedures
Moisture Content Moisture content was determined at NIST using three independent methods. Independent, unopened samples from each of six boxes were used for the determination of moisture by freeze-drying and independent, unopened samples from each of 12 boxes were used for desiccator drying and forced air oven drying. A summary of drying results is shown in the results and discussion section. 3.1.1.1 Freeze Drying Two aliquots of material from each of six freshly opened packets of SRM 2386 were transferred to Pyrex weighing bottles that had been previously heated at 110 °C, cooled to constant weight, and weighed (mb). The weighing bottle was capped, and mass of the material plus weighing bottle was recorded (mw). All weighings were conducted on the same balance, the calibration of which was confirmed with calibrated masses prior to use. The bottles were passed through a static eliminator prior to each weighing. All weights were determined and recorded to ± 0.00001 g. Dryings were performed using a Virtis Advantage Plus Freeze Dryer (SP Scientific) using a standard drying program with a minimum temperature of -40 °C and approximate pressure of 2.66 Pa (200 mTorr). Uncapped samples were frozen at -40 °C for 20 h; the temperature was then increased to -10 °C and held for 7 d. At the end of the seven-day drying cycle, the vacuum was released, and the sample bottles were capped and transferred to a desiccator containing freshly opened magnesium perchlorate for at least one hour before weighing. Samples were removed from the desiccator, weighed, and the results (md) recorded. 3.1.1.2 Desiccator Drying Single aliquots from each of 12 freshly opened packets were placed in pre-weighed, glass weighing vessels (mb) to an approximate depth of 1 cm. The packets were rotated to mix prior to sampling. The vessels were again weighed (mw) and placed in a desiccator over magnesium perchlorate (Mg(ClO4)2). The samples were removed from the desiccator on day 7, weighed, returned to the desiccator, and the results (md) recorded. The samples were weighed and the weights recorded again on days 14, 21, and 28. All weighings were performed using the same balance serviced and calibrated annually by Mettler. Prior to each use, calibration is verified by using standard masses ranging from 0.5 g to 20 g that are traceable to the SI through the standard mass set maintained by the Inorganic Chemical Metrology Group. 3.1.1.3 Forced Air Drying Single aliquots from each of 12 freshly opened packets were placed in pre-weighed, glass weighing vessels (mb) to an approximate depth of 1 cm. The packets were rotated to mix prior to sampling. The vessels were again weighed (mw) and placed in a forced-air drying oven set at 80 °C with caps removed. After 1 h, the samples were removed, capped, and allowed to cool to room temperature in a desiccator. Cooled samples were removed from the desiccator, weighed, and the results (md) recorded. All weighings were performed using the same balance serviced and calibrated annually by Mettler. Prior to each use, calibration is verified by using standard masses ranging from 0.5 g to 20 g that are traceable to the SI through the standard mass set maintained by the Inorganic Chemical Metrology Group. 3.1.1.4 Moisture Calculation The overall moisture results were calculated assuming that all mass losses were due to loss of moisture alone using Equations 1 and 2:
5
This publication is available free of charge from: https://doi.org/10.6028/N
IST.SP.260 -213
Moisturecontent = 100!!"!"
!!"!# [1]
𝑈#$(Moisturecontent) = 2.24𝑢%& + 𝑢'(& + 𝑢'&& + 𝑢')& [2]
where ua is the standard deviation for the samples (n = 6 or n = 12) and ubi are the standard uncertainties of the three weighings, each estimated to be ± 0.01/√3 mg. For each ubi this value is converted to moisture content by division of the mean sample mass value. The expanded uncertainty value, U95, is expressed at an approximate confidence level of 95 % by choosing the expansion factor 2.2, calculated based on degrees of freedom.
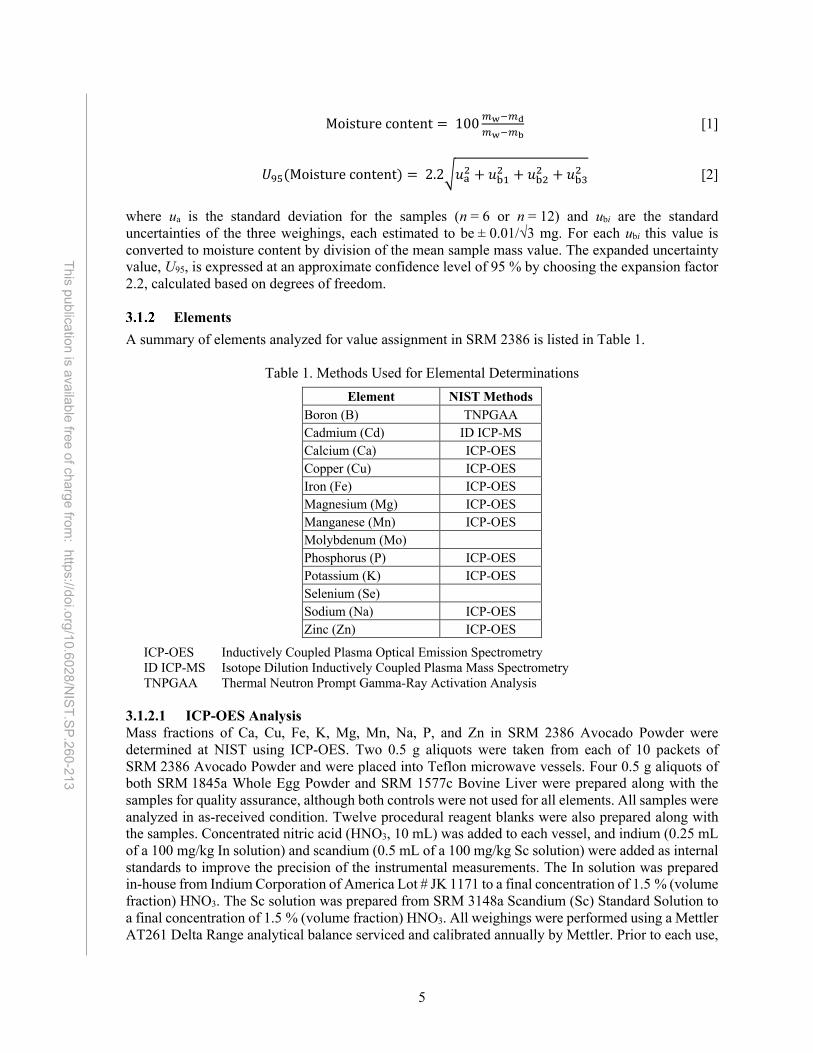
Elements A summary of elements analyzed for value assignment in SRM 2386 is listed in Table 1.
Table 1. Methods Used for Elemental Determinations
Element NIST Methods Boron (B) TNPGAA Cadmium (Cd) ID ICP-MS Calcium (Ca) ICP-OES Copper (Cu) ICP-OES Iron (Fe) ICP-OES Magnesium (Mg) ICP-OES Manganese (Mn) ICP-OES Molybdenum (Mo) Phosphorus (P) ICP-OES Potassium (K) ICP-OES Selenium (Se) Sodium (Na) ICP-OES Zinc (Zn) ICP-OES
ICP-OES Inductively Coupled Plasma Optical Emission Spectrometry ID ICP-MS Isotope Dilution Inductively Coupled Plasma Mass Spectrometry TNPGAA Thermal Neutron Prompt Gamma-Ray Activation Analysis
3.1.2.1 ICP-OES Analysis Mass fractions of Ca, Cu, Fe, K, Mg, Mn, Na, P, and Zn in SRM 2386 Avocado Powder were determined at NIST using ICP-OES. Two 0.5 g aliquots were taken from each of 10 packets of SRM 2386 Avocado Powder and were placed into Teflon microwave vessels. Four 0.5 g aliquots of both SRM 1845a Whole Egg Powder and SRM 1577c Bovine Liver were prepared along with the samples for quality assurance, although both controls were not used for all elements. All samples were analyzed in as-received condition. Twelve procedural reagent blanks were also prepared along with the samples. Concentrated nitric acid (HNO3, 10 mL) was added to each vessel, and indium (0.25 mL of a 100 mg/kg In solution) and scandium (0.5 mL of a 100 mg/kg Sc solution) were added as internal standards to improve the precision of the instrumental measurements. The In solution was prepared in-house from Indium Corporation of America Lot # JK 1171 to a final concentration of 1.5 % (volume fraction) HNO3. The Sc solution was prepared from SRM 3148a Scandium (Sc) Standard Solution to a final concentration of 1.5 % (volume fraction) HNO3. All weighings were performed using a Mettler AT261 Delta Range analytical balance serviced and calibrated annually by Mettler. Prior to each use,

6
This publication is available free of charge from: https://doi.org/10.6028/N
IST.SP.260 -213
calibration is verified by using standard masses ranging from 0.5 g to 20 g that are traceable to the International System of Units (SI) through the standard mass set maintained by the Inorganic Chemical Metrology Group. All prepared samples, controls, and blanks were digested using a CEM MARS microwave sample preparation system according to the microwave procedure in Table 2. After microwave digestion, solutions were transferred to Teflon beakers and were heated on a hot plate with a surface temperature of approximately 175 °C until the volume was reduced to near dryness. Samples were then diluted using 1.5 % (volume fraction) HNO3. Because the samples of SRM 2386 appeared to contain undigested fat, additional concentrated HNO3 and 1 mL of concentrated perchloric acid (HClO4) were added to each sample. The solutions were covered for a minimum of 4 h to reflux solutions then heated on a hot plate with a surface temperature of approximately 205 °C until the volume was reduced to near dryness. Samples were then diluted to 30 g using 1.5 % (volume fraction) HNO3 and transferred to polyethylene bottles. All samples were prepared using redistilled grade HNO3 from Veritas and ACS grade HClO4 from Mallinckrodt. Samples and acids were diluted using 18 MΩ·cm water. All dilute acid concentrations are expressed in volume fractions with respect to the concentrated acid.
Table 2. Microwave Settings for Digestion of SRM 2386 Samples for Elemental Analysis
Step Power
(W) Power Setting
(%) Ramp Time
(min) Control Pressure
(PSI) Temperature
(°C) Hold Time
(min) 1 800 100 25 800 150 25 2 1600 100 25 800 190 15
Analyte mass fractions were calculated by the method of standard additions to compensate for any matrix effects. Samples were diluted to approximate analyte mass fractions. From each dilution, two aliquots were taken, and a matrix matched spike was added to one. The sample mass fraction dilutions, mass fractions of the matrix matched spike solution added to the second aliquot, and the total mass fraction expected in the spiked solution are listed in Table 3. Standards and Approximate Mass Fractions for Determination of Elements.
Table 3. Standards and Approximate Mass Fractions for Determination of Elements
Element Symbol
Source SRM Mass Fraction in Sample Solution
(mg/kg)
Mass Fraction Added (Spike)
(mg/kg)
Total Mass Fraction in
Spiked Aliquot (mg/kg)
SRM Number
Lot Number
Calcium Ca 3109a 130213 0.3 0.4 0.7 Copper Cu 3114 120618 0.3 0.6 0.9 Iron Fe 3126a 51031 0.6 0.7 1.3 Potassium K 3141a 51220 0.9 1 1.9 Magnesium Mg 3131a 140110 0.3 0.5 0.8 Manganese Mn 3132 50429 0.2 0.4 0.6 Sodium Na 3152a 10728 1 1 2 Phosphorus P 3139a 60717 1.5 2 3.5 Zinc Zn 3168a 120629 0.6 1 1.6
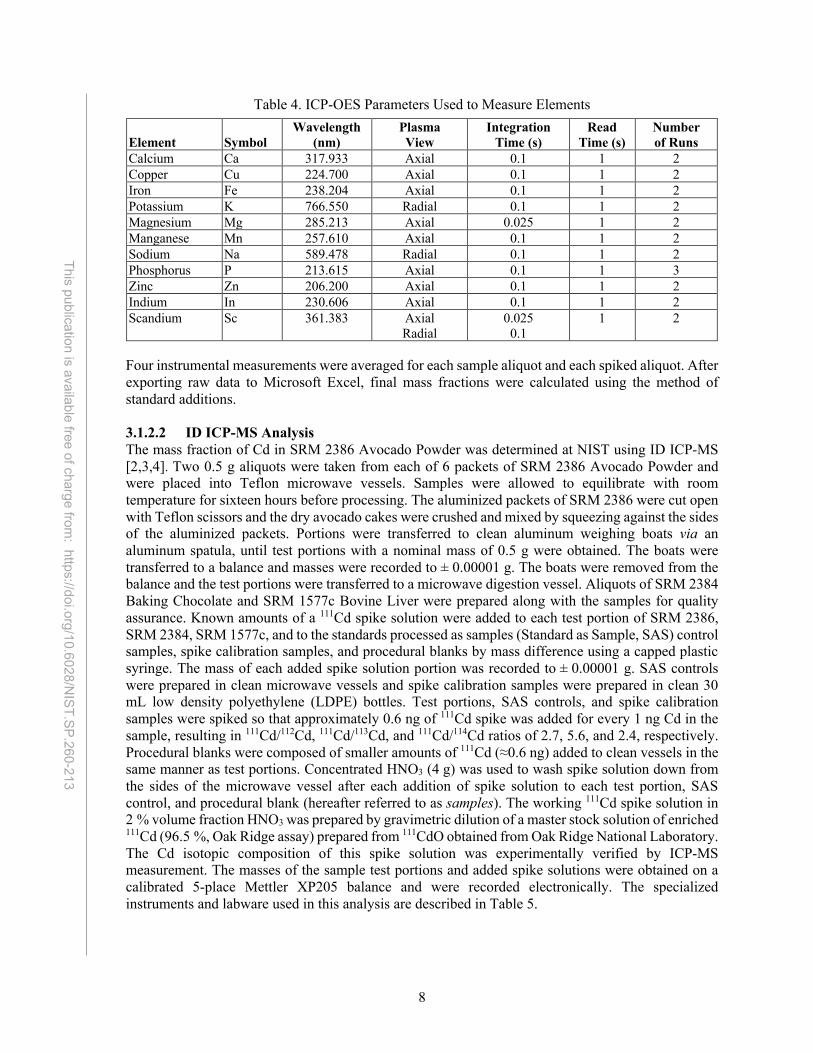
Two inductively coupled plasma optical emission spectrometers were used for analysis: A Perkin-Elmer Optima 3300 Dual View and a Perkin-Elmer Optima 5300 Dual View. The analytes in the
sample, control, and blank solutions were measured according to the parameters in
7
This publication is available free of charge from: https://doi.org/10.6028/N
IST.SP.260 -213
Table 4.
8
This publication is available free of charge from: https://doi.org/10.6028/N
IST.SP.260 -213
Table 4. ICP-OES Parameters Used to Measure Elements
Element Symbol Wavelength
(nm) Plasma View
Integration Time (s)
Read Time (s)
Number of Runs
Calcium Ca 317.933 Axial 0.1 1 2 Copper Cu 224.700 Axial 0.1 1 2 Iron Fe 238.204 Axial 0.1 1 2 Potassium K 766.550 Radial 0.1 1 2 Magnesium Mg 285.213 Axial 0.025 1 2 Manganese Mn 257.610 Axial 0.1 1 2 Sodium Na 589.478 Radial 0.1 1 2 Phosphorus P 213.615 Axial 0.1 1 3 Zinc Zn 206.200 Axial 0.1 1 2 Indium In 230.606 Axial 0.1 1 2 Scandium Sc 361.383 Axial
Radial 0.025 0.1
1 2
Four instrumental measurements were averaged for each sample aliquot and each spiked aliquot. After exporting raw data to Microsoft Excel, final mass fractions were calculated using the method of standard additions. 3.1.2.2 ID ICP-MS Analysis The mass fraction of Cd in SRM 2386 Avocado Powder was determined at NIST using ID ICP-MS [2,3,4]. Two 0.5 g aliquots were taken from each of 6 packets of SRM 2386 Avocado Powder and were placed into Teflon microwave vessels. Samples were allowed to equilibrate with room temperature for sixteen hours before processing. The aluminized packets of SRM 2386 were cut open with Teflon scissors and the dry avocado cakes were crushed and mixed by squeezing against the sides of the aluminized packets. Portions were transferred to clean aluminum weighing boats via an aluminum spatula, until test portions with a nominal mass of 0.5 g were obtained. The boats were transferred to a balance and masses were recorded to ± 0.00001 g. The boats were removed from the balance and the test portions were transferred to a microwave digestion vessel. Aliquots of SRM 2384 Baking Chocolate and SRM 1577c Bovine Liver were prepared along with the samples for quality assurance. Known amounts of a 111Cd spike solution were added to each test portion of SRM 2386, SRM 2384, SRM 1577c, and to the standards processed as samples (Standard as Sample, SAS) control samples, spike calibration samples, and procedural blanks by mass difference using a capped plastic syringe. The mass of each added spike solution portion was recorded to ± 0.00001 g. SAS controls were prepared in clean microwave vessels and spike calibration samples were prepared in clean 30 mL low density polyethylene (LDPE) bottles. Test portions, SAS controls, and spike calibration samples were spiked so that approximately 0.6 ng of 111Cd spike was added for every 1 ng Cd in the sample, resulting in 111Cd/112Cd, 111Cd/113Cd, and 111Cd/114Cd ratios of 2.7, 5.6, and 2.4, respectively. Procedural blanks were composed of smaller amounts of 111Cd (≈0.6 ng) added to clean vessels in the same manner as test portions. Concentrated HNO3 (4 g) was used to wash spike solution down from the sides of the microwave vessel after each addition of spike solution to each test portion, SAS control, and procedural blank (hereafter referred to as samples). The working 111Cd spike solution in 2 % volume fraction HNO3 was prepared by gravimetric dilution of a master stock solution of enriched 111Cd (96.5 %, Oak Ridge assay) prepared from 111CdO obtained from Oak Ridge National Laboratory. The Cd isotopic composition of this spike solution was experimentally verified by ICP-MS measurement. The masses of the sample test portions and added spike solutions were obtained on a calibrated 5-place Mettler XP205 balance and were recorded electronically. The specialized instruments and labware used in this analysis are described in Table 5.

9
This publication is available free of charge from: https://doi.org/10.6028/N
IST.SP.260 -213
The samples were pre-digested on a hot plate in a class 10 clean room for 2 h. Following predigestion, the vessels were cooled to ambient temperature and an additional 10 g HNO3 were added. Vessels were transferred to a MARS Microwave Reaction System and digested according to the parameters listed in Table 2. Vessels were cooled to ambient temperature, removed from the microwave oven, and the contents transferred back to the hot plates in order to boil off the digestion acid. Solutions appeared a deep blue color. The digests were evaporated to near dryness and re-dissolved in one to two drops of concentrated HNO3 followed by approximately 4 g of 2 % (volume fraction) HNO3 to produce clear solutions. Samples were quantitatively transferred to Nalgene bottles and diluted with 2 % (volume fraction) HNO3 to a mass fraction of approximately 3.5 μg/kg 111Cd.
Table 5. Instruments and Labware Used in the Analysis of Cadmium (Cd)
Instrument/Labware Manufacturer Isotemp Standard Laboratory Oven Fisher Scientific, Pittsburgh, PA XP205 balance Mettler-Toledo, Columbus, OH AT 20 balance Mettler-Toledo, Columbus, OH MARS Microwave Reaction System CEM, Mathews, NC Mars EasyPrep Vessels (TFM™-polytetrafluoroethylene Teflon) CEM, Mathews, NC
5 mL and 10 mL plastic syringe Henke Sass Wolf GmbH, Tuttlingen, Germany 30 mL LDPE bottles Nalge Nunc, Rochester, NY 4 mL HDPE scintillation vials Scientific Commodities, Lake Havasu City, AZ XseriesII ICP-MS ThermoFisher Scientific, Madison, WI ESI SC-2DX autosampler Elemental Scientific, Omaha, NE 100 μL/min PFA-ST microconcentric nebulizer Elemental Scientific, Omaha, NE Peltier-cooled impact bead spray chamber ThermoFisher Scientific, Madison, WI
HDPE High density polyethylene PFA Perfluoroalkoxy alkane All samples were prepared using optima grade (Thermo Fisher Scientific, Waltham, MA, USA) HNO3. High-purity water was prepared in-house by sub-boiling distillation using a conditioned, quartz still with deionized water as feedstock. All dilute acid concentrations are expressed in volume fractions with respect to the concentrated acid. SRM 3108 Cadmium (Cd) Standard Solution (lot # 130116) served as a primary standard by gravimetric dilution to obtain the desired Cd mass fraction. An additional primary standard solution was prepared from the high purity Cd of SRM 746 Cadmium-Vapor Pressure (99.999+ percent purity, NIST and vendor assay). A 0.3 g to 0.4 g piece of the metal was cleaned with an acid etch, dried, and weighed to ± 0.000005 g with a calibrated 6-place Mettler AT 20 balance. An air buoyancy correction of 0.999988 and a purity correction of 0.99999 were applied to the measured mass of the metal. The metal was dissolved quantitatively and diluted gravimetrically to obtain the desired mass fraction. The masses of the standard solution dilutions were obtained on a calibrated 5-place Mettler XP205 balance and were recorded electronically. The amount of 111Cd in the spike solution was calibrated against the primary Cd standards using reverse ID ICP-MS using the following functional relationship for calculations: 𝑐* =
(!$8𝑚+𝑐+ :
,(./+)%(2&')(3$/%)&'4"(./5)%(./5)$"(2&')(3$/%)&'(./+)$
;< [1]

10
This publication is available free of charge from: https://doi.org/10.6028/N
IST.SP.260 -213
In this expression, y refers to the spike, z refers to the standard, m to mass, Ab z to abundance of the reference isotope (i.e., 112Cd, 113Cd, 114Cd), Ab y to abundance of the spike isotope (i.e., 111Cd), k to the correction factor for mass bias, R to ratio, b’ to the spike calibration blend (standard spiked with enriched isotope) corrected for dead time, and c to amount content (μmol/g). Spike calibration samples were prepared concurrent with the analytical samples to have mass ratios similar to the analytical samples. The spike samples were diluted to produce the same ICP-MS count rate as the analytical samples. Two aliquots from each of two separate primary standard solution preparations were added to weighed spike solution aliquots resulting in four calibration samples. Mass spectrometric analyses were performed on a ThermoFisher Scientific X series II ICP-MS equipped with matrix tolerant (Xt) cones and operated at 1400 W. Solution was introduced via a peristaltic pump into a low-flow (100 μL/min) PFA microconcentric nebulizer. The nebulizer was fitted to an impact-bead spray chamber cooled to 2 °C. Samples were analyzed in both standard mode and collision cell kinetic energy discrimination mode (CC/KED mode). For CC/KED mode, a cell gas of 8 % mole fraction hydrogen in balance helium was introduced at a rate of 4.00 mL/min, the hexapole bias was operated at -20 V, and the quadrupole bias was set at -17 V. Measurements were conducted using peak jump data acquisition with one point per peak. Five blocks of data, each one minute in duration, were acquired per sample, and the mean intensity ratios were used for computations. Measured intensities were corrected for dead-time and interference (as required) and the intensity ratios were corrected for mass bias and drift. Detector dead-time was experimentally determined using natural Gd solutions with mass fractions that resulted in count rates spanning the count rate range from 1×10⁵ counts per second (cps) to 1×10⁶ cps. The measured dead time was 35 ns. For Cd, a solution of pure Cd with nominal natural isotopic composition was used to measure the mass bias correction factor. (Note: 111Cd and 112Cd are considered absolutely stable; 113Cd has a half-life of 7.6×10¹⁵ y and though 114Cd has been predicted to be radioactive, decay has not been observed due to an extremely long half-life). The mass bias factor was measured at the beginning of the analysis sequence. The mass bias factor was then used to correct the measured ratio of a spike calibration sample measured immediately afterward. The spike calibration sample had an isotopic ratio similar to the spiked test portions, was remeasured throughout the analysis, and was used to correct the blanks, remaining calibration samples, test portions and controls for mass bias and any subsequent instrument drift. Drift was assessed every three samples and a correction applied assuming temporal linearity. Signal intensities for Cd and interfering ions were measured at dwell times as described in Table 6. ICP-MS Dwell Times for Target and Interfering Ions. High-purity solutions of Zr, Mo, In, and Sn were also measured at the start of each analysis and used to evaluate and correct for spectral interference. For example, the measured count rate at mass 111 was corrected for the intensity of the 94Zr16O1H interference in the sample by multiplying the measured 91Zr signal intensity in the sample by the measured natural isotopic 94Zr/91Zr ratio and multiplying that by the 94Zr16O1H/94Zr ratio measured in the pure solution of Zr at the start of the analysis. The same process was followed to determine the intensity of the 95Mo16O, and 94Mo16O1H interferences at mass 111 in the sample. Likewise, masses 112, 113 and 114 were also corrected for potential interferences as described in Table 6. ICP-MS Dwell Times for Target and Interfering Ions. Cd mass fractions were calculated in the spiked samples from corrected 111Cd/112Cd, 111Cd/113Cd, and 111Cd/114Cd intensity ratios, and the results averaged.

11
This publication is available free of charge from: https://doi.org/10.6028/N
IST.SP.260 -213
Table 6. ICP-MS Dwell Times for Target and Interfering Ions
Ion Dwell time Potential Interferences 111Cd 10 ms 94Zr16O1H, 95Mo16O, 94Mo16O1H 112Cd 20 ms 96Zr16O, 95Mo16O1H, 96Mo16O, 112Sn 113Cd 20 ms 96Zr16O1H, 96Mo16O1H, 97Mo16O, 113In 114Cd 20 ms 97Mo16O1H, 98Mo16O, 114Sn 90Zr 5 ms 91Zr 5 ms
95Mo 5 ms 97Mo 5 ms 98Mo 5 ms 115In 5 ms 117Sn 5 ms 118Sn 5 ms
The functional relationship below was used to calculate the ID ICP-MS mass fraction results: 𝑐6 =
(!)8𝑚5𝑐5 :
(./5)$"(2&)(3$/))&(./7)$,(./7))(2&)(3$/))&4"(./5))
; − 𝑏𝑙𝑎𝑛𝑘< [2]
In this expression, x refers to the sample, y refers to the spike, m to mass, Ab x to abundance of the reference isotope (i.e., 112Cd, 113Cd, 114Cd), Ab y to abundance of the spike isotope (i.e., 111Cd), k to the correction factor for mass bias, R to ratio, b to the sample blend (sample spiked with enriched isotopes) corrected for dead time and interference, blank to procedure blank (μmol), and c to amount content (μmol/g). The amount content in μmol/g was converted to mass fraction (mg/kg) by multiplying by the atomic weight [5]. A third nominal 1 g test portion was sampled from each of the SRM 2386 packets for moisture determination. The moisture determination samples were weighed directly into clean, dry glass weighing bottles for which the tare mass had been recorded. The portions of SRM 2386 were dried for 1 h in a forced air convection oven at 80 °C. Samples were cooled to room temperature in a desiccator and the loss in mass measured. The SRM 2386 samples were dried a second time under the same conditions to confirm that the samples had reached a constant mass. For Cd mass fractions reported on a dry mass basis, results from test portions were corrected for moisture using the mean mass loss measured for each respective packet. The mass loss after 1 h of drying did not differ significantly from the mass loss measured after an additional hour of drying (absolute average difference of 0.077 % loss) and so the two results were averaged. 3.1.2.3 TNPGAA Analysis The mass fraction of B in SRM 2386 Avocado Powder was determined at NIST using TNPGAA [2,3,4]. Two 0.75 g aliquots were taken from each of 6 packets of SRM 2386 Avocado Powder and were pressed into pellets using a 13 mm stainless steel die and hydraulic press at 10,000 pounds’ (6.89 x 10⁷ Pa) force for 3 s to 5 s. Prior to sampling, the material in each pouch was mixed by gentle side-to-side motion and rotation for approximately 1 min. Each pellet was heat-sealed into a bag of fluorinated ethylene propylene (FEP) Teflon prior to analysis. Initially, only 1 pellet was prepared from material in each pouch, but due to concerns about possible boron contamination of the die, a second set of six pellets were prepared using a different die. Three aliquots of SRM 1573a Tomato Leaves were prepared along with the samples for quality assurance. Procedural blanks were also prepared along with the samples, including an empty Teflon bag and a pressed disk of Whatman 42 filter paper. A Mettler Toledo XP205DR analytical balance, with calibration verified using Troemner

12
This publication is available free of charge from: https://doi.org/10.6028/N
IST.SP.260 -213
calibrated masses, was used for weighing in the preparation of samples, controls, and standards. All samples were sealed in Teflon bags for analysis. Standards used for calibration were legacy boron standards prepared by pipetting boric acid solution onto filter paper, which have been used many times previously for certification of boron in biological and agricultural materials using TNPGAA. Three standards, containing 62.1 μg B, 75.9 μg B, and 68.5 μg B, were used in this investigation. Additional standards, prepared from mixtures of tris(hydroxymethyl)aminomethane (TRIS) and a gravimetrically diluted solution of SRM 3107 Boron (B) Standard Solution, were used to assess the effect of hydrogen mass fraction on boron sensitivity. The TRIS material was crushed to a fine powder using a Spex Mixer mill. A portion was then weighed into a mixing vial and doped with about 0.2 g of the boron solution added via a plastic pipette (weighed before and after deposition). The powder was allowed to dry for three to four days in a clean hood and was then homogenized in the mixer mill. Pellets containing approximately 750 mg of doped material were then prepared as described earlier. All standards were sealed in Teflon bags for analysis. Samples, standards, and controls were analyzed using the TNPGAA, vertical beam VT-5 facility located at the NIST Center for Neutron Research (NCNR) [6]. Targets were irradiated in an air-filled sample chamber; samples and standards were irradiated for 10 min each and controls were irradiated for 20 min. A 139 mg titanium foil was irradiated at regular intervals in order to monitor any variation in the neutron fluence rate and sample positioning within the beam over the course of the investigation. An empty Teflon bag was irradiated overnight to measure boron background arising from neutron capture by shielding materials. A pressed disk of Whatman 42 filter paper was also irradiated as a standards blank.
Water-Soluble Vitamins and Related Measurands A summary of water-soluble vitamins analyzed in SRM 2386 is listed in Table 7.
Table 7. Methods Used for Vitamin Determinations
Analyte NIST Method Ascorbic acid (vitamin C) LC-UV Thiamine (vitamin B1) ID-LC-MS/MS Riboflavin (vitamin B2) ID-LC-MS/MS Niacinamide (vitamin B3) ID-LC-MS/MS Niacin (vitamin B3) ID-LC-MS/MS Total vitamin B3 ID-LC-MS/MS Pantothenic acid (vitamin B5) ID-LC-MS/MS Pyridoxal (vitamin B6) ID-LC-MS/MS Pyridoxine (vitamin B6) ID-LC-MS/MS Total vitamin B6 ID-LC-MS/MS Choline ID-LC-MS/MS Carnitine ID-LC-MS/MS
LC-UV Liquid Chromatography with UV Absorbance Detection ID-LC-MS/MS Isotope Dilution Liquid Chromatography with Tandem Mass Spectrometry Detection
3.1.3.1 Ascorbic Acid (Vitamin C) The mass fraction of ascorbic acid (vitamin C) in SRM 2386 Avocado Powder was determined at NIST using LC-UV and employing an internal standard, as modified from an earlier study [7]. Three 2 g aliquots were taken from each of 10 packets of SRM 2386 Avocado Powder and were dissolved

13
This publication is available free of charge from: https://doi.org/10.6028/N
IST.SP.260 -213
in 25 g to 30 g of 0.1 mol/L hydrochloric acid (HCl). Three 2 g aliquots of SRM 1849a Infant/Adult Nutritional Formula I (milk-based) were prepared along with the samples for quality assurance. A 4-pyridoxic acid (4-PA) solution was prepared for use as an internal standard using pure material obtained from Sigma-Aldrich, St. Louis, MO, USA by dissolving 477.38 mg 4-PA in 1111.2507 g of 0.1 mol/L HCl. A 15-g aliquot of the 4-PA solution was added gravimetrically to each sample followed by 2 g of a 40 % solution of metaphosphoric acid to stabilize the vitamin C. About 0.5 g to 1 g of dithiothreitol (DTT) solution (100 mg in 10 mL of 0.5 mol/L potassium phosphate dibasic) was added to the solution to convert dihydroascorbic acid to total ascorbic acid. The solution was sonicated for 30 min followed by centrifugation (1000 x gn) at room temperature for 15 min. A 1-mL aliquot of the solution was removed and filtered using both a 0.45 μm and a 0.22 μm nylon filter prior to LC-UV analysis. Four stock solutions of vitamin C (Sigma-Aldrich; St. Louis, MO) were prepared by dissolving the compound in 0.1 mol/L HCl. Four calibration standards were independently prepared from these solutions and were run during the analyses of SRM 2386. The purity of the vitamin C solution was determined to be (99.71 ± 0.10) % using LC-UV at 243 nm; the uncertainty represents the standard deviation of single measurements of four independently prepared solutions. Purity was also assessed using quantitative proton nuclear magnetic (qNMR) resonance spectroscopy using an internal standard approach as (99.68 ± 0.17) %. Because qNMR is a higher order method for purity assessment of neat materials at NIST, the purity value from this method was used to correct the mass fraction of the vitamin C calibration solutions used in SRM 2386 evaluations. Quantitation was based on the internal standard approach using averaged response factors. Mass fractions (expressed in mg/kg) were calculated from the ratio of peak areas and the detector response factors. Figure 4 shows an exemplar LC-UV chromatogram of an extract of SRM 2386.
Figure 4. Exemplar LC-UV Chromatogram of Ascorbic Acid (Vitamin C) Avocado Powder 3.1.3.2 B Vitamins Mass fractions of thiamine, riboflavin, niacinamide, niacin, total vitamin B3, pantothenic acid), pyridoxal, pyridoxine, and total vitamin B6 in SRM 2386 Avocado Powder were determined at NIST by ID-LC-MS/MS. Two 1 g to 1.5 g aliquots were taken from each of 10 packets of SRM 2386 Avocado Powder and were placed into 125 mL polypropylene HotBlock digestion vessels. The contents of each packet of SRM 2386 were well mixed prior to sampling for extraction by applying external pressure to the open packet to break up pieces. Four 2 g aliquots each of SRM 1845a Whole Egg Powder from 2 separate packets and four 10 g to 12 g aliquots of SRM 2387 Peanut Butter were prepared along with the samples for quality assurance. Three blank samples were prepared along with the samples containing (1) only the internal standard solutions, (2) only the sample of SRM 2386, and (3) only the extraction solvent. These samples were diluted to the approximate volume of the other samples and carried through the extraction process to identify any potential biases that may occur. A nominal 1 g aliquot of the mixed internal standard solution (described below) and 30 mL of an extraction solvent (0.1 mol/L ammonium acetate in water, adjusted to pH 2.6 with HCl) were added to all samples, controls, and blanks.

14
This publication is available free of charge from: https://doi.org/10.6028/N
IST.SP.260 -213
Samples were loosely capped and placed in a HotBlock with continuous stirring using a magnetic stir bar. Prior to certification, the extraction procedure was optimized for extraction temperature and number of extractions (see Section 4.3.2). A single cycle of HotBlock heating at 100 °C for 30 min was selected for extraction of vitamins for the certification measurements. Following digestion, contents of the digestion vessel were transferred to a 50 mL polyethylene centrifuge tube, and the digestion vessel was rinsed with a small aliquot (< 5 mL) of extraction solvent. Magnetic stir bars remained in the digestion cups. The samples were centrifuged for 15 min at (1000 x gn), and an aliquot of the supernatant was removed and filtered through a 0.45 μm regenerated cellulose (RC) filter into an autosampler vial for analysis by LC-MS/MS. Samples, calibrants, controls, and blanks were analyzed by using an Agilent Series 1290 LC equipped with an Agilent Series 6410 Triple Quadrupole MS with electrospray ionization in the positive ion mode. The system was composed of a mobile phase degasser, binary pump, autosampler, and mass selective detector. The instrument was tuned prior to certification. A Cadenza CD-C18 column (250 x 4.6 mm i.d., 3 μm particles) from Silvertone Sciences (Philadelphia, PA) was used for the analyses without a guard cartridge. The gradient elution program shown in Table 8 was used with a flow rate of 0.8 mL/min. Mobile phase A consisted of 20 mM ammonium formate in water adjusted to pH 4.0 with formic acid, and mobile phase B was methanol. A 10 μL injection volume was used for all samples. The mass spectrometer was operated at a nebulizer pressure of 1.03x10⁻⁵ Pa (15 psig), a drying gas flow of 11 L/min, a drying gas temperature of 300 °C, a capillary voltage of 4000 V, and a dwell time of 100 ms.
Table 8. LC Gradient Profile Used for Analysis of B Vitamins
Time (min) % A % B 0 100 0 6 100 0
20 50 50 20.1 0 100 30 0 100 30.1 100 0 50 100 0
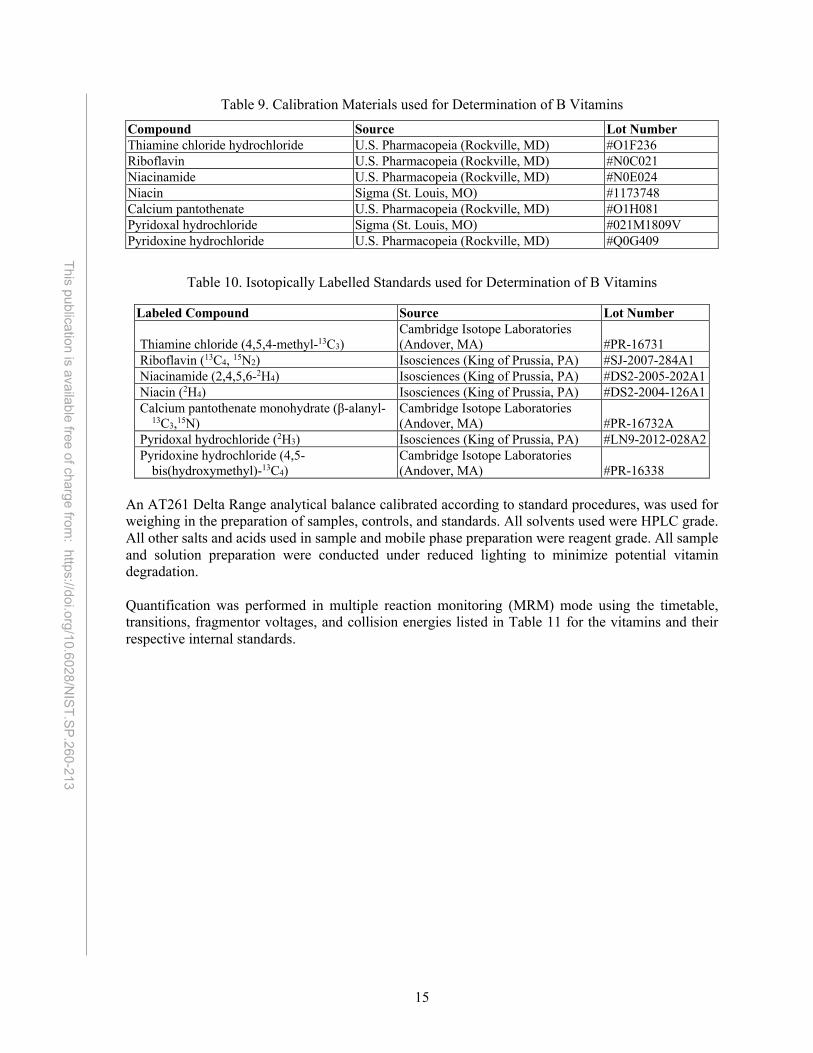
Calibration solutions were prepared from neat materials as described in Table 9. Purity of these reference standards has been evaluated by NIST using LC-UV and these purities were used to correct the reported mass fractions for each analyte. Isotopically labelled vitamin analogues were used as internal standards as described in Table 10. All stock calibrant and internal standard solutions were prepared in 0.1 mol/L ammonium acetate in water, adjusted to pH 2.6 with HCl. A stock solution containing each labeled vitamin was prepared for use in spiking SRM 2386 samples and controls, and for combination with calibration solutions to determine response factors. Diluted and mixed solutions were prepared in 0.1 mol/L ammonium acetate in water, adjusted to pH 2.6 with HCl. Calibrant and internal standard solutions were stored in the refrigerator (4 °C) when not in use.
15
This publication is available free of charge from: https://doi.org/10.6028/N
IST.SP.260 -213
Table 9. Calibration Materials used for Determination of B Vitamins Compound Source Lot Number Thiamine chloride hydrochloride U.S. Pharmacopeia (Rockville, MD) #O1F236 Riboflavin U.S. Pharmacopeia (Rockville, MD) #N0C021 Niacinamide U.S. Pharmacopeia (Rockville, MD) #N0E024 Niacin Sigma (St. Louis, MO) #1173748 Calcium pantothenate U.S. Pharmacopeia (Rockville, MD) #O1H081 Pyridoxal hydrochloride Sigma (St. Louis, MO) #021M1809V Pyridoxine hydrochloride U.S. Pharmacopeia (Rockville, MD) #Q0G409
Table 10. Isotopically Labelled Standards used for Determination of B Vitamins
Labeled Compound Source Lot Number
Thiamine chloride (4,5,4-methyl-13C3) Cambridge Isotope Laboratories (Andover, MA) #PR-16731
Riboflavin (13C4, 15N2) Isosciences (King of Prussia, PA) #SJ-2007-284A1 Niacinamide (2,4,5,6-2H4) Isosciences (King of Prussia, PA) #DS2-2005-202A1 Niacin (2H4) Isosciences (King of Prussia, PA) #DS2-2004-126A1 Calcium pantothenate monohydrate (β-alanyl-
13C3,15N) Cambridge Isotope Laboratories (Andover, MA) #PR-16732A
Pyridoxal hydrochloride (2H3) Isosciences (King of Prussia, PA) #LN9-2012-028A2 Pyridoxine hydrochloride (4,5-
bis(hydroxymethyl)-13C4) Cambridge Isotope Laboratories (Andover, MA) #PR-16338
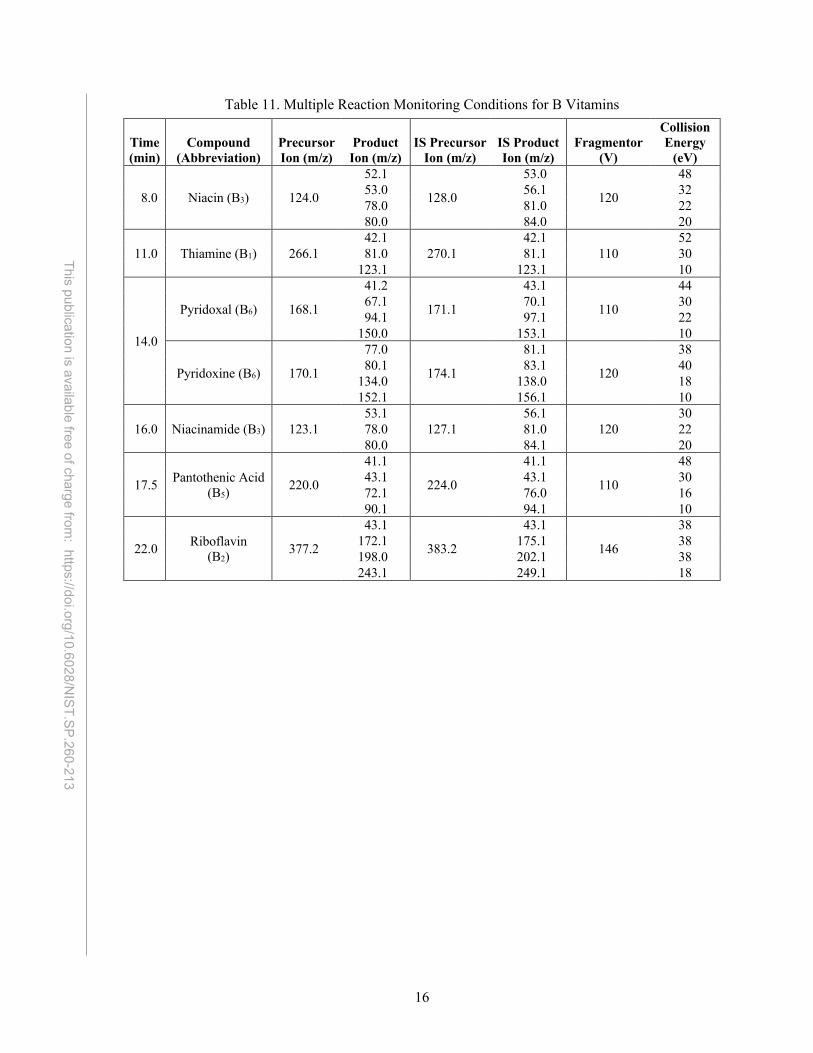
An AT261 Delta Range analytical balance calibrated according to standard procedures, was used for weighing in the preparation of samples, controls, and standards. All solvents used were HPLC grade. All other salts and acids used in sample and mobile phase preparation were reagent grade. All sample and solution preparation were conducted under reduced lighting to minimize potential vitamin degradation. Quantification was performed in multiple reaction monitoring (MRM) mode using the timetable, transitions, fragmentor voltages, and collision energies listed in Table 11 for the vitamins and their respective internal standards.
16
This publication is available free of charge from: https://doi.org/10.6028/N
IST.SP.260 -213
Table 11. Multiple Reaction Monitoring Conditions for B Vitamins
Time (min)
Compound (Abbreviation)
Precursor Ion (m/z)
Product Ion (m/z)
IS Precursor Ion (m/z)
IS Product Ion (m/z)
Fragmentor (V)
Collision Energy
(eV)
8.0 Niacin (B3) 124.0
52.1
128.0
53.0
120
48 53.0 56.1 32 78.0 81.0 22 80.0 84.0 20
11.0 Thiamine (B1) 266.1 42.1
270.1 42.1
110 52
81.0 81.1 30 123.1 123.1 10
14.0
Pyridoxal (B6) 168.1
41.2
171.1
43.1
110
44 67.1 70.1 30 94.1 97.1 22
150.0 153.1 10
Pyridoxine (B6) 170.1
77.0
174.1
81.1
120
38 80.1 83.1 40
134.0 138.0 18 152.1 156.1 10
16.0 Niacinamide (B3) 123.1 53.1
127.1 56.1
120 30
78.0 81.0 22 80.0 84.1 20
17.5 Pantothenic Acid (B5) 220.0
41.1
224.0
41.1
110
48 43.1 43.1 30 72.1 76.0 16 90.1 94.1 10
22.0 Riboflavin (B2) 377.2
43.1
383.2
43.1
146
38 172.1 175.1 38 198.0 202.1 38 243.1 249.1 18

17
This publication is available free of charge from: https://doi.org/10.6028/N
IST.SP.260 -213
Figure 5 displays an exemplar ID-LC-MS/MS with MRM chromatogram for an extract of SRM 2386.
Figure 5. Exemplar ID-LC-MS/MS Chromatogram for B Vitamins
Transitions for vitamin ions are shown in black, transitions for isotopically labeled internal standards are shown in red. Only traces for most intense transitions are displayed.
3.1.3.3 Choline and Carnitine The mass fractions of choline and carnitine in SRM 2386 Avocado Powder were determined at NIST using ID-LC-MS/MS. Two 1 g aliquots were taken from each of 10 packets of SRM 2386 Avocado Powder and were placed into 50 mL polyethylene centrifuge tubes. The contents of each packet of SRM 2386 were well mixed prior to sampling for extraction by applying external pressure to the open packet to break up pieces and thorough mixing with a metal spatula. Four 1 g aliquots from 2 different packets of SRM 1849a Infant/Adult Nutritional Powder I (milk-based) were prepared along with the samples for quality assurance. Three blank samples were prepared containing (1) only the internal standard solutions, (2) only the sample of SRM 2386, and (3) only the extraction solvent. These samples were diluted to the approximate volume of the other samples and carried through the extraction process to identify any potential biases that may occur. An aliquot of the mixed internal standard solution (≈1.43 g d9-choline and ≈0.81 g d9-carnitine, exact mass known) and a portion (≈30 mL) of extraction solvent (1 mol/L aqueous HCl) were added. Internal standard solutions were prepared from choline chloride (trimethyl-d9, Lot #PR- 16783) obtained from Cambridge Isotope Laboratories (Andover, MA) and from DL-carnitine HCl (trimethyl-d9, Lot #Z324P21) obtained from C/D/N Isotopes (Pointe-Claire, QC, Canada). All stock calibrant and internal standard solutions were prepared in HPLC grade water. A stock solution containing each labeled analyte was prepared for use in spiking SRM 2386 samples and controls, and for combination with calibration solutions to determine response factors. Diluted and mixed solutions were prepared in HPLC grade water. Calibrants and internal standard solutions were stored in the refrigerator (4 °C) when not in use. A calibrated Mettler AT261 Delta Range analytical balance was used for weighing in the preparation of samples, controls, and standards. Samples were shaken and vortexed for 20 s to ensure thorough mixing. The entire 30 mL sample was transferred from the polyethylene tube into a Teflon microwave vessel and hydrolyzed under 1600 W of microwave radiation using a Microwave Assisted Reaction System (MARS) with HP-500 Plus

18
This publication is available free of charge from: https://doi.org/10.6028/N
IST.SP.260 -213
vessels from CEM Corporation (Matthews, NC). Prior to certification, the extraction procedure was optimized for microwave hold temperature, hold time, acid concentration, and need for a post-hydrolysis enzyme treatment. The optimum settings were chosen for certification measurements based on the highest extraction yield for choline. Samples were heated to 150 °C over 15 min and held at 150 °C for 15 min with a maximum pressure of 2.76x10⁻⁵ Pa (40 psi). Samples were then cooled and transferred back to 50 mL polyethylene centrifuge tubes. The pH of each sample was adjusted to be in the range of 3.8 to 4.0 using a 50 % solution (w/w) of sodium hydroxide and the pH was confirmed visually using pH paper. The samples were centrifuged for 15 min, and the supernatant was filtered through a 0.45 μm RC filter. Approximately 4 to 5 drops of sample extract were combined with ≈1.5 mL of HPLC grade water in an autosampler vial. Choline bitartrate (Lot #0112016V) and (±)-carnitine hydrochloride (Lot #0001333675) were obtained from Sigma (St. Louis, MO). (NOTE: Choline chloride is very hygroscopic and should not be used as a reference standard for choline measurements.) Purity of these reference standards has been evaluated by NIST using liquid chromatography with ultraviolet absorbance detection, differential scanning calorimetry, quantitative proton nuclear magnetic resonance spectroscopy, and Karl Fisher analysis, and these purities were used to correct the reported mass fractions for each analyte. All solvents used were HPLC grade. Phospholipase D (from Arachis hypogaea (peanut), Type II, lyophilized powder, ≥ 60 units/mg protein) and Triton X-100 used in the extraction optimization study for evaluation enzymatic hydrolysis were obtained from Sigma. Hydrochloric acid and sodium hydroxide used in the hydrolysis were reagent grade. Samples were analyzed by using an Agilent Series 1290 Infinity II LC equipped with an Agilent Series 6410 Triple Quadrupole MS with electrospray ionization in the positive ion mode. The system was composed of a mobile phase degasser, binary pump, autosampler, and mass selective detector. The instrument was tuned prior to certification. A Scherzo SMC18 column (250 x 4.6 mm i.d., 3 μm particles) from Silvertone Sciences (Philadelphia, PA) was used for the analyses without a guard cartridge. The gradient elution program listed in Table 12 was used with a flow rate of 0.5 mL/min. Mobile phase A consisted of 3 mmol/L ammonium formate in water, and mobile phase B was 25 mmol/L ammonium formate in 80:20 water:acetonitrile (volume fraction). A 5.0 μL injection volume was used for all samples. The mass spectrometer was operated at a nebulizer pressure of 15 psig, a drying gas flow of 6 L/min, a drying gas temperature of 300 °C, a capillary voltage of 4000 V, and a dwell time of 100 ms.
Table 12. LC Gradient Profile Used for Analysis of Choline and Carnitine
Time (min) % A % B 0 100 0
11 0 100 27 0 100 27.1 0 0 45 0 0
Quantification was performed in multiple reaction monitoring (MRM) mode using the timetable, transitions, fragmentor voltages, and collision energies listed in Table 13 for choline, carnitine, and their respective internal standards. Figure 6 displays an exemplar ID-LC-MS/MS with MRM chromatogram for an extract of SRM 2386.

19
This publication is available free of charge from: https://doi.org/10.6028/N
IST.SP.260 -213
Table 13. Multiple Reaction Monitoring Conditions for Choline and Carnitine
Time (min) Compound
Precursor Ion (m/z)
Product Ion (m/z)
IS Precursor Ion (m/z)
IS Product Ion (m/z)
Fragmentor (V)
Collision Energy (eV)
6.0 Carnitine 162.12 60.1 171.17 69.2 110 20 103.0 103.0 16
12.0 Choline 105.12 58.1 113.17 66.2 110 32 60.1 69.2 20
Figure 6. Exemplar ID-LC-MS/MS Chromatogram for Choline and Carnitine
Transitions for choline and carnitine ions are shown in black, transitions for isotopically labeled internal standards are shown in red. Transitions for each analyte are nearly identical to the corresponding transitions for
isotopically labeled internal standards.
Fatty Acids The mass fractions of selected fatty acids (as free fatty acids) in SRM 2386 were determined at NIST by a method involving Soxhlet extraction, thermal transesterification with m-trifluoromethylphenyl trimethylammonium hydroxide derivatization agent, and gas chromatography with flame ionization detection (GC-FID). For extraction, duplicate 0.5 g portions of SRM 2386 from 12 unopened packets were analyzed. Along with the samples, duplicate 0.5 g portions of SRM 1845a Whole Egg Powder and a set mass (between 0.1 g and 2 g) of calibration solution were prepared for quality control. Samples were prepared and extracted over an eight-day period by Soxhlet extraction. All solid samples (SRM 2386 and SRM 1845a) were stored in 50-mL polypropylene centrifuge tubes at 4 °C between weighings. All aliquots were added to approximately 3 g of hydromatrix (Agilent Technologies, Wilmington, DE) in a Whatman cellulose extraction thimble (GE Healthcare Life Sciences, Marlborough, MA) and 0.5 mL of an internal standard solution was added to the extraction thimble by weight via gas-tight syringe. A whole-method blank control was prepared by adding only the internal standard solution to hydromatrix. An additional 3 g of hydromatrix was added to all mixtures, followed by ≈ 0.5 mL of HPLC-grade water. Each mixture was stirred with a clean spatula before extraction. The cellulose extraction thimbles were Soxhlet extracted for 20 h to 22 h using approximately 250 mL of solvent containing 80 % (volume fraction) hexanes with 30 mg/L (nominal) butylated hydroxytoluene (BHT; Sigma-Aldrich) and 20 % acetone.
20
This publication is available free of charge from: https://doi.org/10.6028/N
IST.SP.260 -213
Calibration solutions were prepared from SRM 2377 Fatty Acid Methyl Esters in 2,2,4-Trimethylpentane. SRM 2377 was used to prepare six calibration solutions. Three calibration solutions were prepared by direct gravimetric additions of SRM 2377 to the Soxhlet extraction thimbles. For a broad concentration range, a diluted calibration solution was created by a gravimetric dilution (approximately 1:10) of SRM 2377 into 2,2,4-trimethylpentane. The single diluted stock solution was then used to create three additional calibration solutions, which were prepared by direct gravimetric additions to the Soxhlet extraction thimbles. Tridecanonin (C13:0 triglyceride) and methyl octacosanoate (C28:0 fatty acid methyl ester) were obtained from Sigma-Aldrich, Inc. (St Louis, MO) and were gravimetrically added to MTBE and the resulting solution was used as an internal standard (IS) spiking solution. After extraction, the solutions were transferred from round-bottom flasks to Turbovap vessels and were concentrated under nitrogen to near dryness. Approximately 1 mL of toluene was volumetrically added to all samples and the solutions were mixed thoroughly before being transferred to 4 mL amber glass vials. All extracted samples were stored at 4 °C until further analysis. One day after the final set of extractions, a 1-mL ampoule of Meth-Prep II derivatization solution (W.R. Grace & Co., Columbia, MD) was added to all vials and the vials were shaken for 10 s to 15 s and allowed to sit at room temperature for 1 h. For GC-FID analysis, 1 mL of each derivatized solution was added to autosampler vials (high concentration solution) and a 100 μL aliquot of each sample and control solution was volumetrically diluted 1:10 with toluene in additional autosampler vials. No dilution of the calibration solutions was necessary. An Agilent 7890A GC-FID (Agilent Technologies) was used for analysis with a 0.25 mm × 100 m SP2560 (poly(biscyanopropyl siloxane)) fused-silica capillary column (Supelco, Bellefonte, PA) with 0.25 μm film thickness. The instrumental method was adapted from AOAC Official Method 996.06 Fat (Total, Saturated, and Unsaturated) in Foods [8]. A 1μL injection was performed with a split ratio of 120:1, split flow of 120 mL/min, and injector temperature of 275 °C. The carrier gas used was helium with a flow rate of 1 mL/min (calculated average linear velocity 18.168 cm/sec). The oven program begins at 100 °C and is held for 4 min after injection. The temperature is then increased by 3 °C/min to 240 °C, which is then held for 20 min. The flame ionization detector settings include a temperature of 250 °C, hydrogen flow of 44 mL/min, air flow of 400 mL/min, and makeup (nitrogen) gas flow of 29 mL/min. The instrumental analysis was controlled using Open Lab ChemStation Rev C.01.04 (Agilent Technologies). Figure 7 displays example chromatograms for the SRM 2386 extract and for a calibration solution. Each sample was extracted in duplicate over three separate days of extraction and measured over three days. Samples were analyzed in random order, with every 3 to 4 samples or controls bracketed by calibrants. Quantitation was based on linear regression of internal standard-normalized response using tridecanonin (C13:0 triglyceride) as the internal standard. The methyl octacosanoate (C28:0 fatty acid methyl ester) material could not be used since its peak overlapped a peak in the SRM 2386 extracts that was not present in the control or calibration solutions. Per industry standard, mass fractions of fatty acids are reported as equivalent free fatty acid grams of fatty acid per 100 grams sample. Table 14 lists the factors for converting from fatty acid methyl ester (directly measured in this study) to free fatty acids, taken from AOAC Official Method 996.06 [8]. Hydromatrix and boiling stones used for Soxhlet were first solvent rinsed with hexanes and air-dried. All solvents used for standard preparation, sample preparation, and extraction were HPLC-grade or better.

21
This publication is available free of charge from: https://doi.org/10.6028/N
IST.SP.260 -213
Figure 7. Exemplar Chromatograms of Fatty Acids
The chromatogram in panel A is for the SRM 2386 extract; that in panel B is for a calibration solution. Detected compounds are labeled.
Table 14. Factors for Converting Fatty Acid Methyl Ester to Free Fatty Acid Percentages
Fatty Acid Factor Fatty Acid Factor Fatty Acid Factor α-linolenic acid 0.9520 EPA 0.9957 myristoleic acid 0.9417 arachidic acid 0.9570 erucic acid 0.9602 nervonic acid 0.9632 arachidonic acid 0.9560 γ-linolenic acid 0.9520 oleic acid 0.9527 behenic acid 0.9604 gondoic acid 0.9568 palmitic acid 0.9481 capric acid 0.9247 lauric acid 0.9346 palmitoleic acid 0.9477 caprylic acid 0.9114 lignoceric acid 0.9963 stearic acid 0.9530 DHA 0.9590 linoelaidic acid 0.9524 trans-vaccenic acid 0.9527 DPA 0.9593 linoleic acid 0.9524 vaccenic acid 0.9527 elaidic acid 0.9527 myristic acid 0.9421
A
B

22
This publication is available free of charge from: https://doi.org/10.6028/N
IST.SP.260 -213
3.2 GMA FIAC Interlaboratory Studies The Grocery Manufacturers Association’s Food Industry Analytical Chemists (GMA FIAC) Share Group distributed Candidate SRM 2386 Avocado Powder in two interlaboratory studies. The quantitative results from these studies are reported here in full. The reported results from each participating organization have been assigned an arbitrary numeric code. Laboratories participating in the Fall 2015 GMA Study and the Spring 2016 GMA Study reported values for many fatty acids. All participants in either study who reported their methods used GC-FID for separation and detection. Table 15 lists the study(ies) in which participants reported fatty acid results and whether they reported using a hydrolysis and derivatization method.
Table 15. Reported Usage of Hydrolysis and Derivatization Methods for Fatty Acids
Codea Fall 2015
GMA Study Spring 2016 GMA Study
2 Yes b 3 No b 4 Yes No 5 No Yes 6 No b 7 Yes Yes 9 b Yes 10 c b 12 b Yes 13 c No 16 b Yes 18 Yes Yes 22 b No 24 Yes b 25 b No 26 No b 27 No b 28 b No 29 b Yes
a Arbitrary participant identification code b Did not report fatty acid results in study c Reported fatty acid results but did not provide method information

23
This publication is available free of charge from: https://doi.org/10.6028/N
IST.SP.260 -213
Fall 2015 GMA Study In August 2015, GMA FIAC Share Group distributed Candidate SRM 2386 Avocado Powder in an interlaboratory study. Participants were asked to measure analytes of a total nutrient panel (proximates, fatty acids, vitamins, minerals, amino acids, phytosterols) in test portions taken from two individual packets of SRM 2386. Results were reported by the participants listed in Table 16.
Table 16. Participants in the Fall 2015 GMA Study
Company Location Country Mereiux NutriSciences Brasil Sao Paolo Brazil Nestlé Brasil Ltda. Sao Paolo Brazil Silliker Canada Co Markham, ON Canada Covance (Asia) Pte. Ltd. The Synergy Singapore Covance Inc. Harrogate North Yorkshire United Kingdom Con Agra Foods Omaha, NE USA Covance Inc. Battle Creek, MI USA Covance Inc. Madison, WI USA Del Monte Foods Walnut Creek, CA USA Eurofins Scientific Des Moines, IA USA General Mills Inc. Golden Valley, MN USA Hormel Foods Austin, MN USA Krueger Food Labs Chelmsford, MA USA Land O’ Lakes Arden Hills, MN USA Nestle Quality Assurance Center Dublin, OH USA NSF International Ann Arbor, MI USA Schwan Food Company Salina, KS USA The JM Smucker Co. Orrville, OH USA The National Food Laboratory Livermore, CA USA

24
This publication is available free of charge from: https://doi.org/10.6028/N
IST.SP.260 -213
Spring 2016 GMA Study In January 2016, the GMA FIAC Share Group distributed Candidate SRM 2386 in a second interlaboratory study. Participants were asked to measure fatty acids in test portions taken from two individual packets of SRM 2386. Results were reported by the participants listed Table 17.
Table 17. Participants in the Spring 2016 GMA Study
Company Location Country Covance (Asia) Pte. Ltd. The Synergy Singapore Covance Inc. Harrogate North Yorkshire United Kingdom Covance Inc. Madison, WI USA Del Monte Foods Walnut Creek, CA USA Eurofins Central Analytical Laboratories Metairie, LA USA Eurofins Scientific Des Moines, IA USA Hormel Foods Austin, MN USA Krueger Food Labs Chelmsford, MA USA Land O’ Lakes Arden Hills, MN USA Nestle Quality Assurance Center Dublin, OH USA Schwan Food Company Salina, KS USA
3.3 Statistical Approaches for Value Assignment Statistical analysis was provided by the NIST Statistical Engineering Division (SED). Where more than one method available for a measured analyte, the estimated value is a weighted mean of the method estimates available for this analyte. The weighted mean used is the Dersimonian-Laird estimate [9], the uncertainty of which is estimated using a bootstrap procedure based on a Gaussian random effects model for the between-method effects [10,11,12,13]. If only one method is available for an analyte, then that method estimate is the analyte estimate. The uncertainties of all values except ash incorporate a relative uncertainty of 0.9 % due to moisture correction. In addition, some analytes incorporate an uncertainty component due to possible inhomogeneity. To address issues of possible inhomogeneity of the SRM, both analyses of variance with 5 % significance level and graphical analyses were run on NIST data where box information was available. For some measurands, the uncertainty incorporates a component for possible inhomogeneity based on the standard deviation as described in the individual results and discussion sections below. Very marked differences are often observed between the results from the different laboratories participating in an interlaboratory study. For each interlaboratory study, the method estimate for that study for each analyte is the weighted median of the individual laboratory means for that analyte, where the weights are based on a Laplace random effects model [20]. For this SRM, the weighted median is equal to or very close to the unweighted median of laboratory means for most analytes. The uncertainty of the weighted median is estimated using a bootstrap procedure based on a Laplace random effects model for the between-laboratory and within-laboratory effects [10-14]. The weights and uncertainty of the weighted median are based in part on the uncertainties of the individual laboratory means. Here, the uncertainty assigned to each laboratory mean is the standard deviation of that mean. If a laboratory reported only one measurement for an analyte, then for the purposes of the computation that value is assigned an uncertainty equal to the maximum of the uncertainties reported by the other laboratories for that analyte.
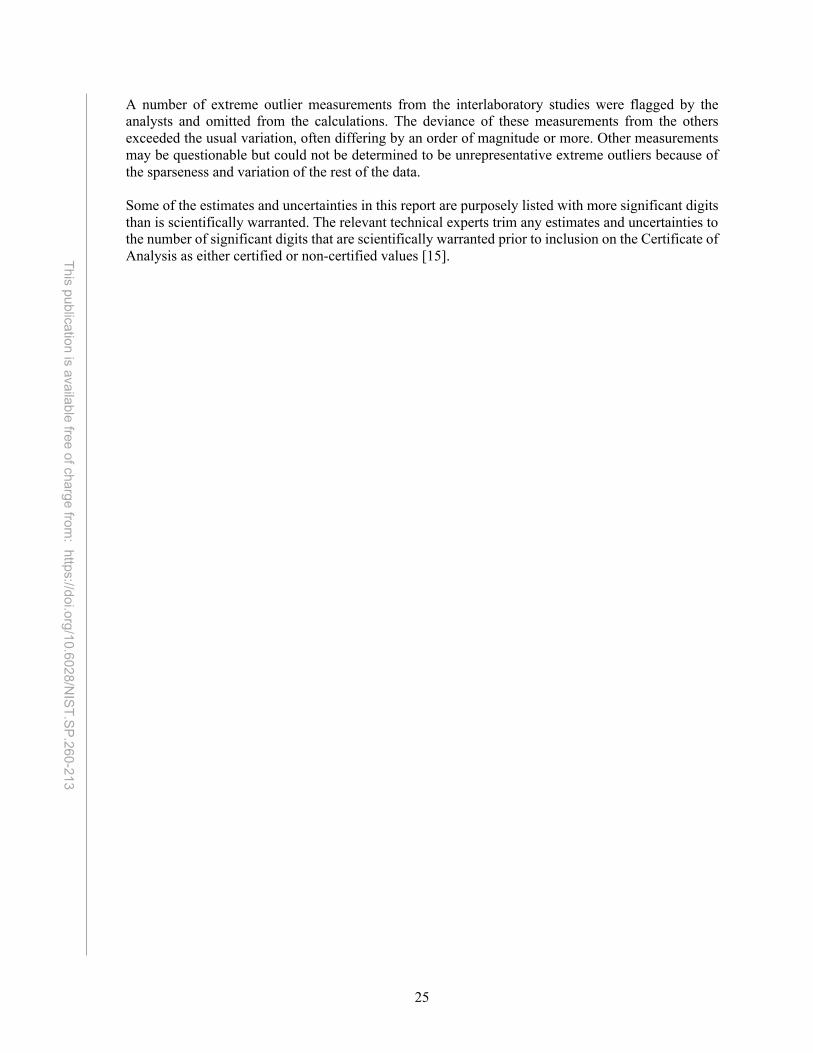
25
This publication is available free of charge from: https://doi.org/10.6028/N
IST.SP.260 -213
A number of extreme outlier measurements from the interlaboratory studies were flagged by the analysts and omitted from the calculations. The deviance of these measurements from the others exceeded the usual variation, often differing by an order of magnitude or more. Other measurements may be questionable but could not be determined to be unrepresentative extreme outliers because of the sparseness and variation of the rest of the data. Some of the estimates and uncertainties in this report are purposely listed with more significant digits than is scientifically warranted. The relevant technical experts trim any estimates and uncertainties to the number of significant digits that are scientifically warranted prior to inclusion on the Certificate of Analysis as either certified or non-certified values [15].

26
This publication is available free of charge from: https://doi.org/10.6028/N
IST.SP.260 -213
4 Results and Discussion 4.1 Moisture
NIST Results Figure 8 displays the change in mass as a function of time in the desiccator, demonstrating that the rate of change decreases after 14 days. Based on this data, a minimum of a 14 days should be used for determination of moisture by desiccator drying.
Figure 8. Change in Percent Moisture of SRM 2386 as a Function of Time in Desiccator Moisture results from the three NIST methods are tabulated in Table 18, including summary statistics where N = number of values and SD = standard deviation of values.
Table 18. NIST Results for Moisture, %
Freeze Dryinga Desiccatorb FAIRc Combinedd Box A B Meane 7 Day 14 Day 21 Day 28 Day Mean SD
1 5.24 5.46 5.54 5.62 5.91 5.69 0.32 2 3.78 3.80 3.79 3.57 3.72 3.76 3.82 4.24 3.92 0.28 3 5.22 5.42 5.53 5.61 5.87 5.65 0.32 4 5.37 5.46 5.42 5.2 5.41 5.52 5.6 5.98 5.60 0.33 5 3.61 3.77 3.87 3.91 4.31 4.04 0.38 6 3.83 4.04 3.93 3.22 3.40 3.48 3.55 4.02 3.78 0.33 7 5.11 5.30 5.41 5.48 5.77 5.54 0.34 8 3.80 3.97 3.88 3.36 3.51 3.53 3.57 4.17 3.85 0.33 9 3.22 3.42 3.49 3.57 3.97 3.70 0.38 10 5.46 5.36 5.41 5.15 5.39 5.44 5.52 5.87 5.56 0.27 11 5.18 5.39 5.46 5.52 5.84 5.61 0.31 12 5.37 5.38 5.37 5.28 5.47 5.57 5.63 5.91 5.58 0.28
N: 6 6 6 12 12 12 12 12 12 Mean: 4.60 4.67 4.63 4.45 4.64 4.72 4.78 5.15 4.88
SD: 0.88 0.81 0.84 0.94 0.95 0.97 0.98 0.90 0.90
a Freeze drying for 7 days @ -40° C b Desiccator drying over magnesium perchlorate c Forced air drying for 1 h @ 80° C d Combination of results from 14-d desiccator drying, forced air drying, and mean of freeze-drying replicates e Mean of two replicates from a single package
0.0
0.1
0.2
0.3
0.4
7 14 21 28
Chan
ge Fr
om D
ay 7
, %
Time in Desiccator, Days
1 23 45 67 89 1011 12
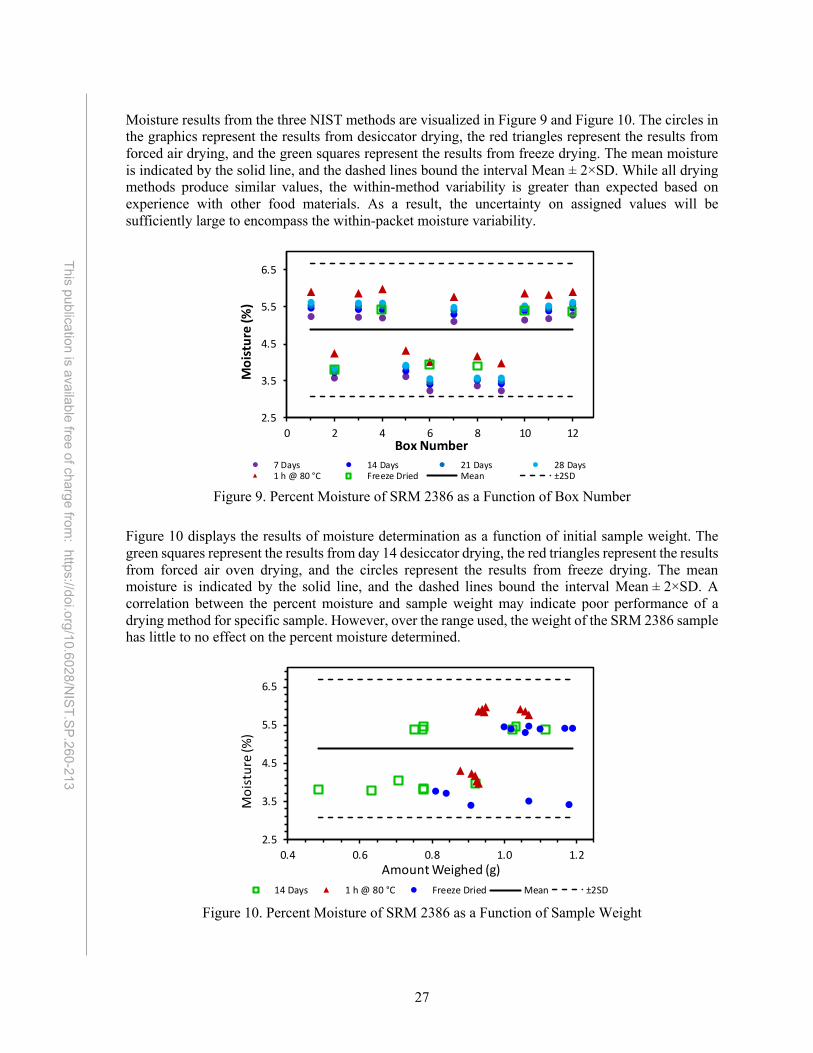
27
This publication is available free of charge from: https://doi.org/10.6028/N
IST.SP.260 -213
Moisture results from the three NIST methods are visualized in Figure 9 and Figure 10. The circles in the graphics represent the results from desiccator drying, the red triangles represent the results from forced air drying, and the green squares represent the results from freeze drying. The mean moisture is indicated by the solid line, and the dashed lines bound the interval Mean ± 2×SD. While all drying methods produce similar values, the within-method variability is greater than expected based on experience with other food materials. As a result, the uncertainty on assigned values will be sufficiently large to encompass the within-packet moisture variability.
Figure 9. Percent Moisture of SRM 2386 as a Function of Box Number
Figure 10 displays the results of moisture determination as a function of initial sample weight. The green squares represent the results from day 14 desiccator drying, the red triangles represent the results from forced air oven drying, and the circles represent the results from freeze drying. The mean moisture is indicated by the solid line, and the dashed lines bound the interval Mean ± 2×SD. A correlation between the percent moisture and sample weight may indicate poor performance of a drying method for specific sample. However, over the range used, the weight of the SRM 2386 sample has little to no effect on the percent moisture determined.
Figure 10. Percent Moisture of SRM 2386 as a Function of Sample Weight
2.5
3.5
4.5
5.5
6.5
0 2 4 6 8 10 12
Moi
stur
e (%
)
Box Number7 Days 14 Days 21 Days 28 Days1 h @ 80 °C Freeze Dried Mean ±2SD
2.5
3.5
4.5
5.5
6.5
0.4 0.6 0.8 1.0 1.2
Moi
stur
e (%
)
Amount Weighed (g)14 Days 1 h @ 80 °C Freeze Dried Mean ±2SD

28
This publication is available free of charge from: https://doi.org/10.6028/N
IST.SP.260 -213
GMA Results Laboratories participating in the Fall 2015 GMA Study reported moisture results as percent total solids, which was converted to percent moisture by subtraction of percent total solids from 100 %. Table 19 lists the results and methods reported for moisture in the Fall 2015 GMA Study.
Table 19. Fall 2015 GMA Study Results for Moisture, %
Packet Summarya Lab A B Mean SD Method
2 6.25 6.18 6.22 0.05 Vacuum oven 3 5.13 4.46 4.79 0.47 Forced-air oven 4 3.97 3.77 3.87 0.14 Vacuum oven 5 7.56 7.45 7.51 0.08 Forced-air oven 7 5.50 5.50 5.50 0.00 Vacuum oven 10 4.80 4.80 not reported 11 4.50 4.50 not reported 13 5.62 5.62 not reported 16 3.20 3.20 3.20 0.00 Vacuum oven 18 6.88 6.88 Vacuum oven 24 6.76 6.95 6.86 0.13 Vacuum oven 25 7.46 7.48 7.47 0.01 Forced-air oven 26 4.48 4.53 4.51 0.04 Vacuum oven 27 3.39 3.41 3.40 0.01 Vacuum oven
N 14 10 Mean, Pooled SD 5.37 0.17
SD 1.45
a Reported as percent total solids, converted to percent moisture by subtraction from 100 %.
Value Assignment and Dry-Mass Conversions The assigned value for moisture content was determined using three NIST techniques and the Fall 2015 GMA Study. The four method estimates were combined using the Dersimonian-Laird weighted mean [9] to estimate a dry-mass proportion of (0.9516 ± 0.0178) gram dry-mass per gram as-received mass, which was used to convert data from an as-received to a dry-mass basis. The uncertainty shown on this value is an approximate 95 % level of confidence expanded uncertainty, U95. This uncertainty incorporates a component for possible inhomogeneity based on the standard deviation of box means, as a division into two groups was apparent in all the NIST moisture estimation methods. The moisture correction is achieved by multiplying the as-received measurements by a conversion factor equal to the inverse of the dry-mass proportion. A relative uncertainty component for the conversion factor (0.9 %) obtained from the moisture measurements is incorporated in the uncertainties of the estimated analyte values (except ash), reported on a dry-mass basis.

29
This publication is available free of charge from: https://doi.org/10.6028/N
IST.SP.260 -213
4.2 Elements All elemental results determined at NIST were determined on a dry-mass basis. Results provided by the Fall 2015 GMA Study were provided on an as-received basis but converted to a dry-mass basis for the Certificate of Analysis (COA).
Boron The NIST TNPGAA results for boron (B), on a dry-mass basis, are summarized in Table 20, along with the moisture results collected during these experiments. The table also provides several summary values: N = number of values, Mean = mean of values, SD = standard deviation of values, and Pooled SD = square-root of the sum of the squared within-box standard deviations. The quality assurance measurement results were concordant with the certified value delivered by the control material, SRM 1573a.
Table 20. Summary of Results for Boron (B), mg/kg
Boron (mg/kg) Moisture Box A B Mean SD %
2 175 177 176.0 1.4 3.78 4 165 168 166.5 2.1 5.37 6 179 179 179.0 0.0 3.83 8 178 176 177.0 1.4 3.80 10 165 164 164.5 0.7 5.46 12 171 165 168.0 4.2 5.37
N: 6 6 Mean, Pooled SD: 171.8 2.1 4.60
SD: 6.2 0.88 Figure 11 displays the NIST boron results as a function of the sample box number. The blue circles in the figure represent the results for the first replicate and the red squares the second replicate. The mean mass fraction is indicated by the solid line, and the dashed lines bound the interval Mean ± 2×SD.
Figure 11. Boron (B) Dry-Mass Basis Mass Fraction as a Function of Box Number Table 21 details the uncertainty components and calculations. The most difficult uncertainty to estimate in the analysis of hydrogenous materials by TNPGAA is the effect of hydrogen (H) scattering on element sensitivities. Element sensitivities in thin hydrogenous targets can be enhanced by up to 10 % compared to those measured in a thicker target [16]. Filter paper standards have been used in the
155
165
175
185
0 2 4 6 8 10 12
Boro
n (m
g/kg
)
Packet/BoxA B Mean ±2SD

30
This publication is available free of charge from: https://doi.org/10.6028/N
IST.SP.260 -213
past to measure boron in agricultural materials due to the similarity in H content. For example, both the control material, SRM 1573a Tomato Leaves, and the filter paper standards used in this investigation yielded hydrogen count rates of about (95 ± 10) cps. However, due to high moisture content, the H count rates of the SRM 2386 samples averaged around (140 ± 5) cps. To estimate the effects of neutron scattering, 750 mg boron standard pellets prepared from two mixtures of TRIS and boron spectrometric solution were measured. The H count rate of these pellets fell into the range of 160 to 170 cps. The average boron sensitivity of these pellets was found to differ from the average boron sensitivity measured in filter paper standards by only about 1 %. To be conservative, a 1 % uncertainty from H scattering effects was thus added to the total uncertainty.
Table 21. Uncertainty Budget for TNPGAA Analysis of Boron (B)
Component Description urel Units
Sample measurement s/√n, where s is standard deviation of the sample data replication and n is the number of samples analyzed. 1.03 %
Standard replication s/√n, where s is standard deviation of the standard data replication and n is the number of standards analyzed. 0.71 %
Weighing of samples Uncertainty in weighing/average weight of sample: 100*0.01 mg /750 mg 0.001 %
Sample positioning Flux variation
Estimated from the standard deviation of repeated measurements of a titanium foil. 0.5 %
H scattering effects Estimated as approximately 1 % from the difference between boron standards of different H count rate and geometry. 1 %
Standard quantity Uncertainty in spectrometric standard mass fraction (given on the certificate)/2, assuming the certificate uncertainty is an expanded uncertainty with coverage factor of 2.
0.1 %
Delivery of standard Standard solution was determined by mass, and weighed to ±0.1 mg, so % uncertainty in solution mass for 100 mg of solution is 100*0.01/100.
0.01 %
Blank correction Estimated as 10 % of the blank correction. 0.06 % urel Combined relative uncertainty 1.68 % k Student's t 95 % coverage factor for 5 degrees of freedom 2.57 %
U95rel k*urel, relative expanded uncertainty at a 95 % level of confidence 4.32 % U95 171.8 mg/kg * U95rel / 100 7.42 mg/kg
Cadmium
The NIST ID ICP-MS results for cadmium (Cd) on an as-received and dry-mass basis are summarized in Table 22, along with the moisture results collected during these experiments. The table also provides several summary values: N = number of values, Mean = mean of values, SD = standard deviation of values, and Pooled SD = square-root of the sum of the squared within-box standard deviations.
Table 22. Summary of Results for Cadmium (Cd), mg/kg
As-Received Basis (mg/kg) Dry-Mass Basis (mg/kg) Moisture Box A B Mean SD A B Mean SD (%)
1 0.13221 0.13191 0.13206 0.00021 0.14045 0.14014 0.14030 0.00022 5.87 2 0.14419 0.14390 0.14405 0.00021 0.15075 0.15045 0.15060 0.00021 4.35 4 0.13020 0.12996 0.13008 0.00017 0.13865 0.13840 0.13853 0.00018 6.10 6 0.13279 0.13313 0.13296 0.00024 0.14107 0.14143 0.14125 0.00025 5.87 7 0.13214 0.13262 0.13238 0.00034 0.14052 0.14103 0.14078 0.00036 5.96 12 0.13223 0.13215 0.13219 0.00006 0.14062 0.14054 0.14058 0.00006 5.97
N: 6 N 6 6 Mean, Pooled SD: 0.13395 0.00022 Mean, Pooled SD 0.14200 0.00023 5.69
SD: 0.00504 SD 0.00431 0.66
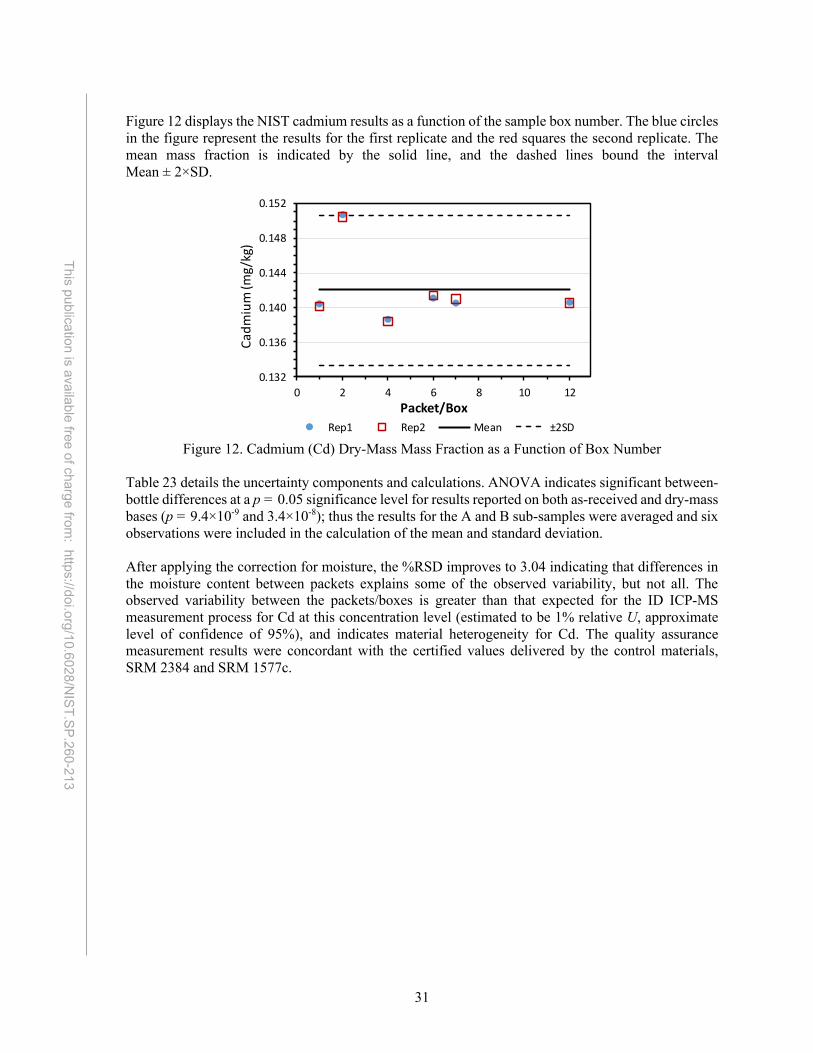
31
This publication is available free of charge from: https://doi.org/10.6028/N
IST.SP.260 -213
Figure 12 displays the NIST cadmium results as a function of the sample box number. The blue circles in the figure represent the results for the first replicate and the red squares the second replicate. The mean mass fraction is indicated by the solid line, and the dashed lines bound the interval Mean ± 2×SD.
Figure 12. Cadmium (Cd) Dry-Mass Mass Fraction as a Function of Box Number Table 23 details the uncertainty components and calculations. ANOVA indicates significant between-bottle differences at a p = 0.05 significance level for results reported on both as-received and dry-mass bases (p = 9.4×10⁻⁹ and 3.4×10⁻⁸); thus the results for the A and B sub-samples were averaged and six observations were included in the calculation of the mean and standard deviation. After applying the correction for moisture, the %RSD improves to 3.04 indicating that differences in the moisture content between packets explains some of the observed variability, but not all. The observed variability between the packets/boxes is greater than that expected for the ID ICP-MS measurement process for Cd at this concentration level (estimated to be 1% relative U, approximate level of confidence of 95%), and indicates material heterogeneity for Cd. The quality assurance measurement results were concordant with the certified values delivered by the control materials, SRM 2384 and SRM 1577c.
0.132
0.136
0.140
0.144
0.148
0.152
0 2 4 6 8 10 12
Cadm
ium
(mg/
kg)
Packet/BoxRep1 Rep2 Mean ±2SD

32
This publication is available free of charge from: https://doi.org/10.6028/N
IST.SP.260 -213
Table 23. Uncertainty Budget for ID ICP-MS Analysis of Cadmium (Cd)
Component xi u(xi) Units ci ciu(xi) vi RelCon (%) Rep 1.000 0.033 1 1.41E-01 4.62E-03 5 96.50
blank 0.00000022 0.00000009 μmol -2.47E+02 -2.14E-05 2 <0.01 mx 0.48448 0.00015 g -2.91E-01 -4.36E-05 ∞ 0.01
DMCF 0.9404 0.0028 1 -1.49E-01 -4.20E-04 ∞ 0.80 my 0.66971 0.00015 g 2.10E-01 3.15E-05 ∞ <0.01 cy 0.0005435 0.0000011 μmol/g 2.59E+02 2.97E-04 ∞ 0.40
(Aby)y 0.96497 0.00050 1 1.48E-01 7.41E-05 ∞ 0.02 (Abx)y 0.00588 0.00025 1 -3.79E-01 -9.47E-05 ∞ 0.04 (Abx)x 0.28730 0.00070 1 -5.92E-01 -4.14E-04 ∞ 0.78 (Aby)x 0.12800 0.00020 1 2.33E-01 4.65E-05 ∞ 0.01
kb 1.0000 0.0015 1 -1.73E-01 -2.61E-04 ∞ 0.30 (Ry/x)b 2.5539 0.0074 1 -6.74E-02 -5.02E-04 ∞ 1.10 AtWt 112.4110 0.0040 μg/μmol 1.25E-03 5.01E-06 ∞ <0.01
u(total): 0.0047 k95: 2.57 U95(total): 0.0121
xi Typical value of the component
u(xi) Standard uncertainty of xi ci Sensitivity coefficient for the component in the measurement model vi Effective degrees of freedom for component
RelCon 100(ciu(xi)/u(total))2, relative contribution of the component to the total standard uncertainty
Rep Sample repeatability, using a prediction interval estimated as the (standard deviation of the mean of the dry mass basis mass fraction results)(√(6+1)).
blank Procedure blank correction: estimated as the (standard deviation of the mean of procedure blank determinations.)
mx Sample mass: (±0.00030 g tolerance of the 5-place balance)/2.
DMCF Moisture correction (100 - Moisture %)/100: (absolute value of the difference between the mean of the current result and that in Section 4.1.1)/2
my mass of added spike solution: (±0.00030 g tolerance of the 5-place balance)/2.
cy
Spike solution amount content calibrated by reverse ID comprised of the combined content (U95,rel between (0.15 & 0.2) %, the half width of the difference between the mean results of two primary standard solutions and the relative standard deviation of the mean of 5 spike calibration samples.
(Aby)y Abundance of spike isotope in the spike solution: (Oak Ridge certified U95)/2. (Abx)y Abundance of sample isotope in the spike solution: (Oak Ridge certified U95)/2. (Abx)x Abundance of sample isotope in the sample: (uncertainty reported in Reference [17])/2. (Aby)x Abundance of spike isotope in the sample: (uncertainty reported in reference [17])/2.
kb Mass bias correction factor: (u of replicate mass bias uncertainty combined with an experienced-based U95,rel of ± 1 %)/2.
(Ry/x)b Ratio of intensity at spike mass to intensity at sample mass in an unknown spiked with enriched isotope: ( ± 0.2 % for dead time correction combined with the average % difference for replicate ICP-MS measurements)/2.
AtWt atomic weight. (u reported in reference [17])/2. u(total) ∑(ciu(xi))2, the combined standard uncertainty for the measurement
k95 Student’s two-tailed 95 % level of confidence expansion factor for 5 degrees of freedom U95(total) k95 × u(total), 95 % level of confidence expanded uncertainty for the measurement

33
This publication is available free of charge from: https://doi.org/10.6028/N
IST.SP.260 -213
Calcium, Copper, Iron, Potassium, Magnesium, Manganese, Sodium, Phosphorus, and Zinc
The elements Ca, Cu, Fe, K, Mg, Mn, Na, P, and Zn were prepared and analyzed at NIST on ICP-OES. Results for these elements were reported on a dry-mass basis and are summarized in the following sections. All results have been corrected for the mean blank values from their corresponding runs by subtracting the mean total micrograms found in the blanks from the total micrograms found in each individual sample. In all cases, the quality assurance measurement results were concordant with the certified values delivered by the control materials, SRM 1845a Whole Egg Powder and SRM 1577c Bovine Liver. 4.2.3.1 Calcium The NIST ICP-OES results for calcium (Ca) and all Ca values reported by the participants in the Fall 2015 GMA Study are summarized in Table 24. The table also provides several summary values: N = number of values, Mean = mean of values, SD = standard deviation of values, and Pooled SD = square-root of the sum of the squared within-box or within-participant standard deviations.
Table 24. Summary of Results for Calcium (Ca), mg/kg
NIST ICP-OES Fall 2015 GMA Study Box A B Mean SD Lab A B Mean SD Method
1 749.8 749.8 1 786 785 785.5 0.7 not reported 2 777.3 766.3 771.8 7.8 2 744 730 737.0 9.9 ICP-OES 3 718.9 747.3 733.1 20.0 3 739 758 748.5 13.4 ICP-OES 4 758.3 736.6 747.4 15.3 4 882 965 923.5 58.7 AAS 5 749.4 736.8 743.1 8.9 5 793 762 777.5 21.9 ICP-MS 6 731.2 741.0 736.1 6.9 6 748 800 774.0 36.8 ICP-OES 7 763.2 749.7 756.4 9.5 7 667 609 638.0 41.0 ICP-OES 8 735.3 735.3 10 713 713.0 not reported 9 751.9 749.5 750.7 1.7 11 739 739.0 not reported 10 753.4 752.3 752.9 0.7 13 758 758.0 not reported
N: 10 16 759 759 759.0 0.0 AAS Mean, Pooled SD: 747.7 10.7 18 770 770.0 ICP-OES
SD: 11.6 24 804 781 792.5 16.3 AAS 26 777 762 769.5 10.6 ICP-OES 27 785 774 779.5 7.8 AAS N: 15 Mean, Pooled SD: 764.3 26.4 SD: 58.2
AAS Atomic Absorption Spectroscopy ICP-MS Inductively Coupled Plasma Mass Spectrometry
ICP-OES Inductively Coupled Plasma Optical Emission Spectroscopy

34
This publication is available free of charge from: https://doi.org/10.6028/N
IST.SP.260 -213
Figure 13 displays the NIST calcium results as a function of the sample box number. The blue circles in the figure represent the results for the first replicate and the red squares the second replicate. The mean mass fraction is indicated by the solid line, and the dashed lines bound the interval Mean ± 2×SD.
Figure 13. Calcium (Ca) Mass Fraction as a Function of Box Number 4.2.3.2 Copper The NIST ICP-OES results for copper (Cu) and all Cu values reported by the participants in the Fall 2015 GMA Study are summarized in Table 25. The table also provides several summary values: N = number of values, Mean = mean of values, SD = standard deviation of values, and Pooled SD = square-root of the sum of the squared within-box or within-participant standard deviations.
Table 25. Summary of Results for Copper (Cu), mg/kg
NIST ICP-OES Fall 2015 GMA Study Box A B Mean SD Lab A B Mean SD Method
1 15.63 15.45 15.54 0.13 1 15.2 14.6 14.90 0.42 not reported 2 16.59 16.47 16.53 0.08 2 16.0 16.2 16.10 0.14 ICP-OES 3 16.72 16.56 16.64 0.11 4 18.9 18.2 18.55 0.49 AAS 4 15.60 15.63 15.61 0.02 5 15.9 15.9 15.90 0.00 ICP-MS 5 16.82 15.25 16.03 1.11 6 15.2 15.8 15.50 0.42 ICP-OES 6 16.40 17.43 16.92 0.73 7 7.8 5.9 6.85 1.34 ICP-MS 7 15.85 16.09 15.97 0.17 10 16.4 16.40 not reported 8 15.94 15.46 15.70 0.35 11 18.0 18.00 not reported 9 17.06 16.84 16.95 0.16 13 17.5 17.50 not reported 10 16.21 16.16 16.18 0.04 16 15.0 15.0 15.00 0.00 AAS N: 10 18 15.0 15.00 ICP-OES
Mean, Pooled SD: 16.21 0.44 26 14.9 15.1 15.00 0.14 ICP-OES SD: 0.53 27 17.7 17.7 17.70 0.00 AAS N: 13 Mean, Pooled SD: 15.57 0.52 SD: 2.91
AAS Atomic Absorption Spectroscopy ICP-MS Inductively Coupled Plasma Mass Spectrometry
ICP-OES Inductively Coupled Plasma Optical Emission Spectroscopy
710
730
750
770
790
0 2 4 6 8 10
Calc
ium
(mg/
kg)
Packet/BoxRep1 Rep2 Mean ±2SD

35
This publication is available free of charge from: https://doi.org/10.6028/N
IST.SP.260 -213
Figure 14 displays the NIST copper results as a function of the sample box number. The blue circles in the figure represent the results for the first replicate and the red squares the second replicate. The mean mass fraction is indicated by the solid line, and the dashed lines bound the interval Mean ± 2×SD.
Figure 14. Copper (Cu) Mass Fraction as a Function of Box Number
15
16
17
0 2 4 6 8 10
Copp
er (m
g/kg
)
Packet/BoxRep1 Rep2 Mean ±2SD

36
This publication is available free of charge from: https://doi.org/10.6028/N
IST.SP.260 -213
4.2.3.3 Iron The NIST ICP-OES results for iron (Fe) and all Fe values reported by the participants in the Fall 2015 GMA Study are summarized in Table 26. The table also provides several summary values: N = number of values, Mean = mean of values, SD = standard deviation of values, and Pooled SD = square-root of the sum of the squared within-box or within-participant standard deviations. Statistical outliers identified using Dixon’s Q-test were excluded from further calculations.
Table 26. Summary of Results for Iron (Fe), mg/kg
NIST ICP-OES Fall 2015 GMA Study Box A B Mean SD Lab A B Mean SD Method
1 32.16 32.67 32.41 0.36 1 34.1 37.4 35.75 2.33 not reported 2 33.64 33.64 2 32.6 33.3 32.95 0.49 ICP-OES 3 34.36 34.36 3 31.9 33.7 32.80 1.27 ICP-OES 4 32.67 31.22 31.95 1.03 4 40.2 37.3 38.75 2.05 AAS 5 32.14 32.14 5 32.5 32.4 32.45 0.07 ICP-MS 6 33.10 35.18 34.14 1.47 6 33.6 35.0 34.30 0.99 ICP-OES 7 33.23 36.56 34.89 2.35 7 57.0 28.0 42.50 20.51 not reported 8 33.46 32.79 33.13 0.47 10 33.2 33.20 not reported 9 35.74 34.42 35.08 0.93 11 39.1 39.10 not reported 10 32.84 32.84 13 33.8 33.80 not reported
N: 10 16 23.0 23.0 23.00 0.00 AAS Mean, Pooled SD: 33.46 1.29 18 39.2 39.20 ICP-OES
SD: 1.14 24 41.0 38.0 39.50 2.12 AAS 26 28.8 28.3 28.55 0.35 ICP-OES 27 33.3 33.0 33.15 0.21 AAS N: 15 Mean, Pooled SD: 34.60 6.31 SD: 4.88
AAS Atomic Absorption Spectroscopy ICP-MS Inductively Coupled Plasma Mass Spectrometry
ICP-OES Inductively Coupled Plasma Optical Emission Spectroscopy
Figure 15 displays the NIST iron results as a function of the sample box number. The blue circles in the figure represent the results for the first replicate and the red squares the second replicate. The mean mass fraction is indicated by the solid line, and the dashed lines bound the interval Mean ± 2×SD.
Figure 15. Iron (Fe) Mass Fraction as a Function of Box Number
30
32
34
36
0 2 4 6 8 10
Iron
(mg/
kg)
Packet/BoxRep1 Rep2 Mean ±2SD

37
This publication is available free of charge from: https://doi.org/10.6028/N
IST.SP.260 -213
4.2.3.4 Potassium The NIST ICP-OES results for potassium (K) and all K values reported by the participants in the Fall 2015 GMA Study are summarized in Table 27. The table also provides several summary values: N = number of values, Mean = mean of values, SD = standard deviation of values, and Pooled SD = square-root of the sum of the squared within-box or within-participant standard deviations.
Table 27. Summary of Results for Potassium (K), mg/kg
NIST ICP-OES Fall 2015 GMA Study Box A B Mean SD Lab A B Mean SD Method
1 32031 37868 34950 4128 1 37000 37000 37000 0 not reported 2 42509 39670 41089 2008 2 32200 32400 32300 141 ICP-OES 3 41743 41317 41530 0301 3 34310 35430 34870 792 ICP-OES 4 35472 37562 36517 1478 4 34000 34400 34200 283 AAS 5 40475 35706 38091 3372 5 33100 33300 33200 141 ICP-MS 6 41249 38983 40116 1603 6 36800 39570 38185 1959 ICP-OES 7 39835 39211 39523 0442 7 31100 30700 30900 283 ICP-MS 8 38511 37947 38229 0399 10 32300 32300 not reported 9 42543 38184 40364 3082 11 31500 31500 not reported 10 38248 38798 38523 0389 13 33700 33700 not reported
N: 10 16 32332 32252 32292 57 AAS Mean, Pooled SD: 38893 2175 18 32100 32100 ICP-OES
SD: 2062 24 31600 31400 31500 141 AAS 26 28700 28800 28750 71 ICP-OES 27 35499 35409 35454 64 AAS N: 15 Mean, Pooled SD: 33217 653 SD: 2434
AAS Atomic Absorption Spectroscopy ICP-MS Inductively Coupled Plasma Mass Spectrometry
ICP-OES Inductively Coupled Plasma Optical Emission Spectroscopy
Figure 16 displays the NIST potassium results as a function of the sample box number. The blue circles in the figure represent the results for the first replicate and the red squares the second replicate. The mean mass fraction is indicated by the solid line, and the dashed lines bound the interval Mean ± 2×SD.
Figure 16. Potassium (K) Mass Fraction as a Function of Box Number
31000
35000
39000
43000
0 2 4 6 8 10Packet/Box
Rep1 Rep2 Mean ±2SD
Pota
ssiu
m (m
g/kg
)

38
This publication is available free of charge from: https://doi.org/10.6028/N
IST.SP.260 -213
4.2.3.5 Magnesium The NIST ICP-OES results for magnesium (Mg) and all Mg values reported by the participants in the Fall 2015 GMA Study are summarized in Table 28. The table also provides several summary values: N = number of values, Mean = mean of values, SD = standard deviation of values, and Pooled SD = square-root of the sum of the squared within-box or within-participant standard deviations. Statistical outliers identified using Dixon’s Q-test were excluded from further calculations.
Table 28. Summary of Results for Magnesium (Mg), mg/kg
NIST ICP-OES Fall 2015 GMA Study Box A B Mean SD Lab A B Mean SD Method
1 1739 1887 1813 0105 1 2060 2060 2060 0 not reported 2 1950 1946 1948 0003 2 1970 1920 1945 35 ICP-OES 3 2042 1987 2015 0038 4 1790 1760 1775 21 AAS 4 1918 1874 1896 0031 5 1910 1910 1910 0 ICP-MS 5 1904 1904 6 2060 2150 2105 64 ICP-OES 6 1917 1890 1903 0019 7 1600 1460 1530 99 ICP-OES 7 1829 1914 1871 0060 10 1730 1730 not reported 8 1794 2404 2099 0432 11 1690 1690 not reported 9 2019 2769 2394 0531 13 1850 1850 not reported 10 2497 2354 2426 0101 16 2131 2150 2141 13 AAS
N: 10 18 1850 1850 ICP-OES Mean, Pooled SD: 2027 235 24 1900 1900 1900 0 AAS
SD: 217 26 2030 2030 2030 0 ICP-OES 27 1713 1678 1696 25 AAS
N: 14
Mean, Pooled SD: 1872 40
SD: 177
AAS Atomic Absorption Spectroscopy ICP-MS Inductively Coupled Plasma Mass Spectrometry
ICP-OES Inductively Coupled Plasma Optical Emission Spectroscopy
Figure 17 displays the NIST magnesium results as a function of the sample box number. The blue circles in the figure represent the results for the first replicate and the red squares the second replicate. The mean mass fraction is indicated by the solid line, and the dashed lines bound the interval Mean ± 2×SD.
Figure 17. Magnesium (Mg) Mass Fraction as a Function of Box Number
1500
1900
2300
0 2 4 6 8 10Packet/Box
Rep1 Rep2 Mean ±2SD
Mag
nesi
um (m
g/kg
)

39
This publication is available free of charge from: https://doi.org/10.6028/N
IST.SP.260 -213
4.2.3.6 Manganese The NIST ICP-OES results for manganese (Mn) and all Mn values reported by the participants in the Fall 2015 GMA Study are summarized in Table 29. The table also provides several summary values: N = number of values, Mean = mean of values, SD = standard deviation of values, and Pooled SD = square-root of the sum of the squared within-box or within-participant standard deviations.
Table 29. Summary of Results for Manganese (Mn), mg/kg
NIST ICP-OES Fall 2015 GMA Study Box A B Mean SD Lab A B Mean SD Method
1 10.34 10.34 10.34 0.00 1 10.60 10.80 10.70 0.14 not reported 2 11.11 10.89 11.00 0.16 2 10.40 10.60 10.50 0.14 ICP-OES 3 11.00 10.90 10.95 0.07 4 12.00 11.70 11.85 0.21 AAS 4 10.35 10.27 10.31 0.05 5 10.10 10.30 10.20 0.14 ICP-MS 5 10.50 10.28 10.39 0.16 6 8.46 8.85 8.66 0.28 ICP-OES 6 10.79 11.33 11.06 0.38 7 8.80 7.90 8.35 0.64 ICP-MS 7 10.62 10.73 10.68 0.08 10 10.50 10.50 ICP-OES 8 10.67 10.54 10.60 0.09 11 10.70 10.70 not reported 9 11.15 11.02 11.08 0.09 13 10.50 10.50 not reported 10 10.75 10.60 10.68 0.10 18 <10 ICP-OES
N: 10 27 10.00 10.00 10.00 0.00 ICP-MS Mean, Pooled SD: 10.71 0.15 N: 10
SD: 0.30 Mean, Pooled SD: 10.20 0.29 SD: 1.02
AAS Atomic Absorption Spectroscopy ICP-MS Inductively Coupled Plasma Mass Spectrometry
ICP-OES Inductively Coupled Plasma Optical Emission Spectroscopy Figure 18 displays the NIST manganese results as a function of the sample box number. The blue circles in the figure represent the results for the first replicate and the red squares the second replicate. The mean mass fraction is indicated by the solid line, and the dashed lines bound the interval Mean ± 2×SD.
Figure 18. Manganese (Mn) Mass Fraction as a Function of Box Number
10.0
10.5
11.0
11.5
0 2 4 6 8 10
Man
gane
se (m
g/kg
)
Packet/BoxRep1 Rep2 Mean ±2SD
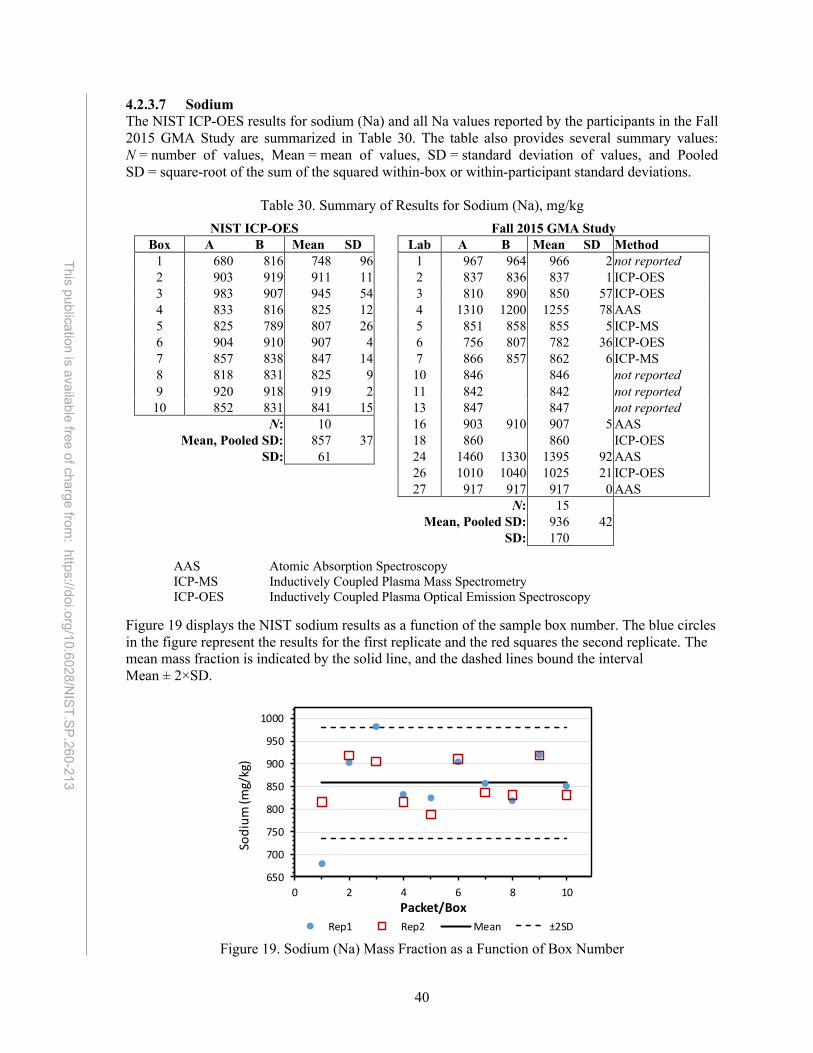
40
This publication is available free of charge from: https://doi.org/10.6028/N
IST.SP.260 -213
4.2.3.7 Sodium The NIST ICP-OES results for sodium (Na) and all Na values reported by the participants in the Fall 2015 GMA Study are summarized in Table 30. The table also provides several summary values: N = number of values, Mean = mean of values, SD = standard deviation of values, and Pooled SD = square-root of the sum of the squared within-box or within-participant standard deviations.
Table 30. Summary of Results for Sodium (Na), mg/kg
NIST ICP-OES Fall 2015 GMA Study Box A B Mean SD Lab A B Mean SD Method
1 680 816 748 96 1 967 964 966 2 not reported 2 903 919 911 11 2 837 836 837 1 ICP-OES 3 983 907 945 54 3 810 890 850 57 ICP-OES 4 833 816 825 12 4 1310 1200 1255 78 AAS 5 825 789 807 26 5 851 858 855 5 ICP-MS 6 904 910 907 4 6 756 807 782 36 ICP-OES 7 857 838 847 14 7 866 857 862 6 ICP-MS 8 818 831 825 9 10 846 846 not reported 9 920 918 919 2 11 842 842 not reported 10 852 831 841 15 13 847 847 not reported
N: 10 16 903 910 907 5 AAS Mean, Pooled SD: 857 37 18 860 860 ICP-OES
SD: 61 24 1460 1330 1395 92 AAS 26 1010 1040 1025 21 ICP-OES 27 917 917 917 0 AAS N: 15 Mean, Pooled SD: 936 42 SD: 170
AAS Atomic Absorption Spectroscopy ICP-MS Inductively Coupled Plasma Mass Spectrometry
ICP-OES Inductively Coupled Plasma Optical Emission Spectroscopy Figure 19 displays the NIST sodium results as a function of the sample box number. The blue circles in the figure represent the results for the first replicate and the red squares the second replicate. The mean mass fraction is indicated by the solid line, and the dashed lines bound the interval Mean ± 2×SD.
Figure 19. Sodium (Na) Mass Fraction as a Function of Box Number
650
700
750
800
850
900
950
1000
0 2 4 6 8 10Packet/Box
Rep1 Rep2 Mean ±2SD
Sodi
um (m
g/kg
)
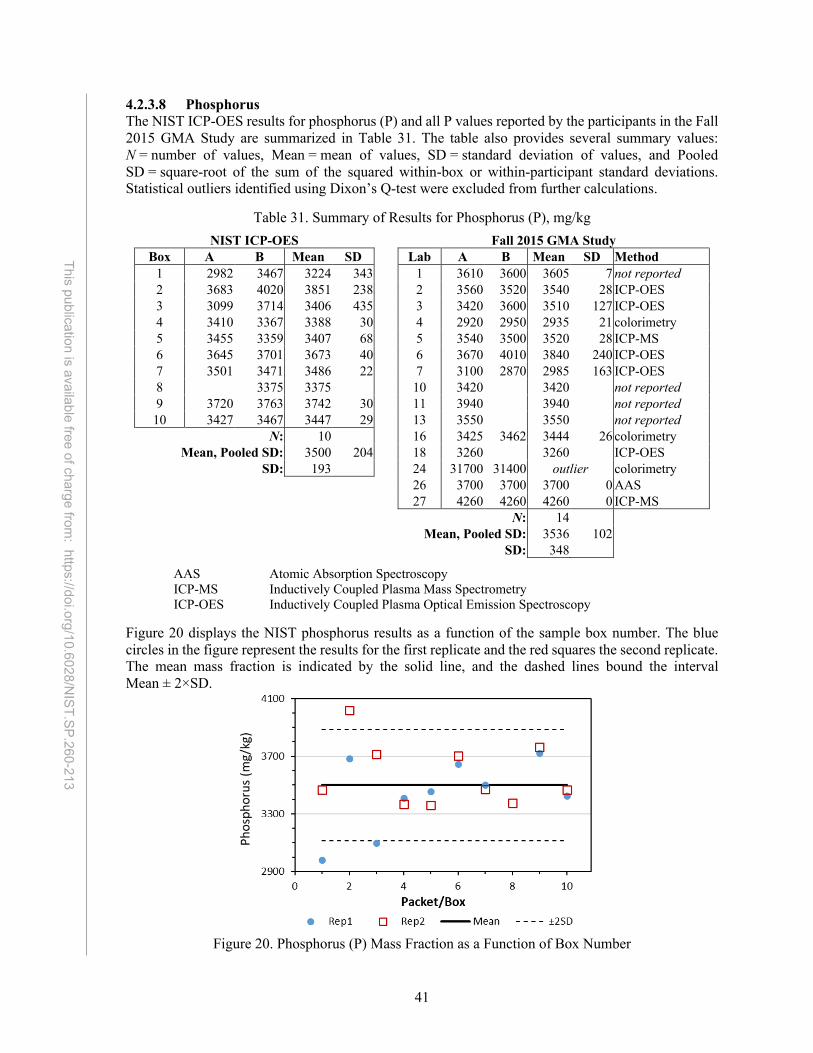
41
This publication is available free of charge from: https://doi.org/10.6028/N
IST.SP.260 -213
4.2.3.8 Phosphorus The NIST ICP-OES results for phosphorus (P) and all P values reported by the participants in the Fall 2015 GMA Study are summarized in Table 31. The table also provides several summary values: N = number of values, Mean = mean of values, SD = standard deviation of values, and Pooled SD = square-root of the sum of the squared within-box or within-participant standard deviations. Statistical outliers identified using Dixon’s Q-test were excluded from further calculations.
Table 31. Summary of Results for Phosphorus (P), mg/kg
NIST ICP-OES Fall 2015 GMA Study Box A B Mean SD Lab A B Mean SD Method
1 2982 3467 3224 343 1 3610 3600 3605 7 not reported 2 3683 4020 3851 238 2 3560 3520 3540 28 ICP-OES 3 3099 3714 3406 435 3 3420 3600 3510 127 ICP-OES 4 3410 3367 3388 30 4 2920 2950 2935 21 colorimetry 5 3455 3359 3407 68 5 3540 3500 3520 28 ICP-MS 6 3645 3701 3673 40 6 3670 4010 3840 240 ICP-OES 7 3501 3471 3486 22 7 3100 2870 2985 163 ICP-OES 8 3375 3375 10 3420 3420 not reported 9 3720 3763 3742 30 11 3940 3940 not reported 10 3427 3467 3447 29 13 3550 3550 not reported
N: 10 16 3425 3462 3444 26 colorimetry Mean, Pooled SD: 3500 204 18 3260 3260 ICP-OES
SD: 193 24 31700 31400 outlier colorimetry 26 3700 3700 3700 0 AAS 27 4260 4260 4260 0 ICP-MS
N: 14
Mean, Pooled SD: 3536 102
SD: 348
AAS Atomic Absorption Spectroscopy ICP-MS Inductively Coupled Plasma Mass Spectrometry
ICP-OES Inductively Coupled Plasma Optical Emission Spectroscopy
Figure 20 displays the NIST phosphorus results as a function of the sample box number. The blue circles in the figure represent the results for the first replicate and the red squares the second replicate. The mean mass fraction is indicated by the solid line, and the dashed lines bound the interval Mean ± 2×SD.
Figure 20. Phosphorus (P) Mass Fraction as a Function of Box Number

42
This publication is available free of charge from: https://doi.org/10.6028/N
IST.SP.260 -213
4.2.3.9 Zinc The NIST ICP-OES results for zinc (Zn) and all Zn values reported by the participants in the Fall 2015 GMA Study are summarized in Table 32. The table also provides several summary values: N = number of values, Mean = mean of values, SD = standard deviation of values, and Pooled SD = square-root of the sum of the squared within-box or within-participant standard deviations.
Table 32. Summary of Results for Zinc (Zn), mg/kg
NIST ICP-OES Fall 2015 GMA Study Box A B Mean SD Lab A B Mean SD Method
1 33.77 34.44 34.11 0.47 1 35.5 35.8 35.7 0.2 not reported 2 36.70 37.59 37.15 0.63 2 35.9 36.0 36.0 0.1 ICP-OES 3 36.48 36.92 36.70 0.31 4 44.3 41.2 42.8 2.2 AAS 4 34.33 33.67 34.00 0.47 5 36.5 36.3 36.4 0.1 ICP-MS 5 39.12 33.48 36.30 3.99 6 40.0 41.8 40.9 1.3 ICP-OES 6 35.30 36.25 35.78 0.67 7 30.0 26.0 28.0 2.8 ICP-OES 7 34.94 34.72 34.83 0.16 10 35.5 35.5 not reported 8 34.26 33.20 33.73 0.75 11 36.8 36.8 not reported 9 37.72 37.58 37.65 0.10 13 37.9 37.9 not reported 10 33.70 34.98 34.34 0.91 16 34.0 34.0 34.0 0.0 AAS
N: 10 18 35.1 35.1 ICP-OES Mean, Pooled SD: 35.46 1.37 24 33.0 33.0 33.0 0.0 AAS
SD: 1.44 26 37.1 36.0 36.6 0.8 ICP-OES 27 38.4 38.7 38.6 0.2 AAS N: 14 Mean, Pooled SD: 36.2 1.2 SD: 3.5
AAS Atomic Absorption Spectroscopy ICP-MS Inductively Coupled Plasma Mass Spectrometry
ICP-OES Inductively Coupled Plasma Optical Emission Spectroscopy Figure 21 displays the NIST zinc results as a function of the sample box number. The blue circles in the figure represent the results for the first replicate and the red squares the second replicate. The mean mass fraction is indicated by the solid line, and the dashed lines bound the interval Mean ± 2×SD.
Figure 21. Zinc (Zn) Mass Fraction as a Function of Box Number
32
34
36
38
0 2 4 6 8 10
Zinc
(mg/
kg)
Packet/BoxRep1 Rep2 Mean ±2SD

43
This publication is available free of charge from: https://doi.org/10.6028/N
IST.SP.260 -213
4.2.3.10 Uncertainty Budget Table 33 lists the uncertainty budget for Ca, Cu, Fe, K, Mg, Mn, Na, P, and Zn.
Table 33. Uncertainty Budget for ICP-OES Analysis of Ca, Cu, Fe, K, Mg, Mn, Na, P, and Zn
Uncertainty Basis Type DF Sample Replication, ssample
The uncertainty due to sample preparation and measurement is estimated by calculating the standard deviation of the mean. (n = 16, 19, or 20)
A 15,18,19
Blank Replication, sblank
The uncertainty due to blank preparation and measurement is estimated by calculating the standard deviation of the mean. (n = 12)
A 11
Moisture Correction, smoisture
The uncertainty due to the moisture correction is estimated by calculating the standard deviation of the mean then converting percent moisture to mass. (n = 4)
A 3
Primary Standard, us The uncertainty associated with the primary standards is calculated to be the expanded uncertainty divided by the expansion factor, k, obtained from the Certificate of Analysis for each SRM used as the standard addition spike.
B > 60
Weighing of Standards, ub1
The uncertainty for each weighing of the standard is ± 0.01 mg based on the certificate of calibration for the balance. This uncertainty is normalized by division by √3.
B ∞
Weighing of Samples, ub2
The uncertainty for each weighing of the sample is ± 0.01 mg based on the certificate of calibration for the balance. This uncertainty is normalized by division by √3.
B ∞
Molybdenum
All molybdenum (Mo) values reported by laboratories participating in the Fall 2015 GMA Study are summarized in Table 34. The table also provides several summary values: N = number of values, Mean = mean of values, SD = standard deviation of values, and Pooled SD = square-root of the sum of the squared within-participant standard deviations.
Table 34. Summary of Results for Molybdenum (Mo), mg/kg
Lab A B Mean SD Method 1 0.0850 0.0830 0.0840 0.0014 not reported 5 0.0840 0.0810 0.0825 0.0021 ICP-MS 18 0.0680 0.0680 ICP-OES 27 <0.5 <0.5 ICP-MS
N: 3 Mean, Pooled SD: 0.0782 0.0018
SD: 0.0088 ICP-MS Inductively Coupled Plasma Mass Spectrometry
ICP-OES Inductively Coupled Plasma Optical Emission Spectroscopy

44
This publication is available free of charge from: https://doi.org/10.6028/N
IST.SP.260 -213
Selenium All selenium (Se) values reported by laboratories participating in the Fall 2015 GMA Study are summarized in Table 35. The table also provides several summary values: N = number of values, Mean = mean of values, SD = standard deviation of values, and Pooled SD = square-root of the sum of the squared within-participant standard deviations.
Table 35. Summary of Results for Selenium (Se), mg/kg
Lab A B Mean SD Method 1 0.046 0.043 0.0445 0.0021 not reported 3 712 746 ICP-MS 5 <0.4 <0.4 ICP-MS 7 <0.1 <0.1 other 10 0.4000 0.4000 not reported 13 0.0400 0.0400 not reported 18 0.0140 0.0140 ICP-OES 27 0.0860 0.0840 0.0850 0.0014 ICP-MS
N: 5 Mean, Pooled SD: 0.1167 0.0018
SD: 0.1604 ICP-MS Inductively Coupled Plasma Mass Spectrometry
ICP-OES Inductively Coupled Plasma Optical Emission Spectroscopy

45
This publication is available free of charge from: https://doi.org/10.6028/N
IST.SP.260 -213
Value Assignment As described in Section 3.3, available data for each measurand to provide an estimate of the mass fraction present in SRM 2386 where x is the mean and U95(x) is the 95% confidence interval. The summary of these estimates for elements is provided in Table 36, along with a summary of the methods used to arrive at these estimates. A blank in the table indicates that no data from that method was available for determination of the estimate. Analysis of variance at a 5 % significance level showed statistically significant heterogeneity in some cases, and the uncertainties for Cd, Mg, Mn, and Na values containing NIST results incorporate an additional component for possible heterogeneity.
Table 36. Summary of Estimates for Elements in SRM 2386, mg/kg
Based on Analyte x U95(x) NIST Methods Fall 2015 GMA Methodsa
Boron 171.833 14.422 TNPGAA Cadmium 0.14201 0.00988 ID-ICP-MS Calcium 776.61 62.32 ICP-OES ICP-OES, ICP-MS, AAS Copper 16.22 0.60 ICP-OES ICP-OES, ICP-MS, AAS Iron 33.57 1.38 ICP-OES ICP-OES, ICP-MS, AAS Magnesium 1999.25 540.99 ICP-OES ICP-OES, ICP-MS, AAS Manganese 10.72 0.70 ICP-OES ICP-OES, ICP-MS, AAS Molybdenum 0.0867 0.0168 ICP-OES, ICP-MS Phosphorus 3591.30 214.30 ICP-OES ICP-OES, ICP-MS, AAS, Colorimetry Potassium 36440.80 5011.22 ICP-OES ICP-OES, ICP-MS, AAS Selenium 0.0460 0.0278 ICP-OES, ICP-MS Sodium 866.53 138.93 ICP-OES ICP-OES, ICP-MS, AAS Zinc 36.57 2.62 ICP-OES ICP-OES, ICP-MS, AAS
a Not all laboratories reported methods used. AAS Atomic Absorption Spectroscopy ICP-OES Inductively Coupled Plasma Optical Emission Spectrometry ICP-MS Inductively Coupled Plasma Mass Spectrometry ID ICP-MS Isotope Dilution Inductively Coupled Plasma Mass Spectrometry TNPGAA Thermal Neutron Prompt Gamma-Ray Activation Analysis

46
This publication is available free of charge from: https://doi.org/10.6028/N
IST.SP.260 -213
4.3 Vitamins All vitamin results determined at NIST and by the Fall 2015 GMA Study were reported on an as-received basis and converted to a dry-mass basis using the moisture correction provided in Section 4.1.3 for reporting on the COA. Results from GMA studies include those vitamins that were quantitatively determined by at least two participants. Results reported as “0” or “<” values are not used in the statistical summaries. Values that are at least 10-fold greater than the median of the quantitative values (most likely reflecting unit conversion errors) are also not used in the summaries
Vitamin C (Ascorbic Acid) The NIST LC-UV results for ascorbic acid are summarized in Table 37. The table also provides several summary values: N = number of values, Mean = mean of values, SD = standard deviation of values, and Pooled SD = square-root of the sum of the squared within-box standard deviations. The quality assurance measurement results were concordant with the certified value delivered by the control material, SRM 1849a.
Table 37. Summary of NIST Results for Ascorbic Acid (Vitamin C), mg/kg
Packet 1 Packet 2 Packet 3 Total Box A B C Mean SD A B C Mean SD A B C Mean SD Mean SD
1 173 174 171 172.7 1.5 176 175 180 177.0 2.6 174 175 170 173.0 2.6 174.2 2.4 2 175 182 175 177.3 4.0 185 186 183 184.7 1.5 173 177 179 176.3 3.1 179.4 4.6 3 170 179 184 177.7 7.1 174 171 182 175.7 5.7 172 175 181 176.0 4.6 176.4 1.1 4 184 177 180 180.3 3.5 176 176 181 177.7 2.9 172 175 182 176.3 5.1 178.1 2.0 5 175 183 177 178.3 4.2 171 176 174 173.7 2.5 186 180 184 183.3 3.1 178.4 4.8 6 179 177 174 176.7 2.5 170 175 180 175.0 5.0 184 176 178 179.3 4.2 177.0 2.2 7 172 175 171 172.7 2.1 177 177 180 178.0 1.7 178 171 177 175.3 3.8 175.3 2.7 8 175 171 184 176.7 6.7 177 170 178 175.0 4.4 180 176 171 175.7 4.5 175.8 0.8 9 183 185 182 183.3 1.5 186 185 185 185.3 0.6 183 186 185 184.7 1.5 184.4 1.0 10 173 174 169 172.0 2.6 178 177 170 175.0 4.4 176 179 179 178.0 1.7 175.0 3.0
N: 10 10 10 10 Mean, Pooled SD: 176.8 4.0 177.7 3.5 177.8 3.6 177.4 2.8
SD: 3.6 4.1 3.7 3.0 Figure 22 displays the NIST ascorbic acid results as a function of box number. The blue diamonds represent the triplicate results for samples from the first packet, the red triangles represent the triplicates from the second packet, and the green circles represent the triplicates from the third packet. The mean mass fraction is indicated by the solid line, and the dashed lines bound the interval Mean ± 2×SD. While the within-packet triplicates appear bunched, the within-sample variability as estimated by the within-sample pooled standard deviations are of very similar magnitude to the between-sample standard deviations. SRM 2386 appears homogenous with regard to ascorbic acid content.

47
This publication is available free of charge from: https://doi.org/10.6028/N
IST.SP.260 -213
Figure 22. Ascorbic Acid (Vitamin C) Mass Fraction as a Function of Box Number Ascorbic acid values reported by the participants in the Fall 2015 GMA Study are summarized in Table 38. The results of the study were highly variable and summary statistics could not be calculated.
Table 38. Fall 2015 GMA Study Results for Ascorbic Acid (Vitamin C), mg/kg
Laba A B Mean SD Method 2 <10 <10 LC-UV 3 1.2 1.3 1.3 0.1 LC-UV 4 <10 <10 Other 5 5.9 5.6 5.8 0.2 not reported 6 <5 <5 DCPIP 7 6.2 6.2 not reported 10 <10 not reported 13 1700 1700 not reported 16 490 510 500 14 DCPIP 26 <0.4 <0.4 LC-FL
DCPIP Titration with Dichlorophenol Indophenol Detection
LC-UV Liquid Chromatography with Ultraviolet Absorbance Detection LC-FL Liquid Chromatography with Fluorescence Detection
B Vitamins
Vitamins were extracted from samples of SRM 2386 for 30 min by sonication without added heat and by using a HotBlock at 60 °C and 100 °C, for up to three extraction cycles, and the recoveries using different conditions compared. Consistent extraction yields were observed at all extraction temperatures for thiamine, riboflavin, niacin, and pantothenic acid. Increased recovery was observed, however, for niacinamide, pyridoxal, and pyridoxine at elevated temperatures. No significant increases in extraction yield were observed with increasing number of extraction cycles for any of the measurands. The results of the optimization experiments are summarized in Figure 23. For value assignment, the vitamins were extracted using a HotBlock at 100 °C. For quantification, mass fractions of thiamine, riboflavin, niacin, niacinamide, pantothenic acid, pyridoxine, and pyridoxal in the samples were bracketed with calibration solutions. A response factor was calculated for each transition in each injection, and an average response factor (RF) was determined for each transition using the equation below.
165
170
175
180
185
190
0 2 4 6 8 10
Asco
bic A
cid
(mg/
kg)
Box NumberP1 P2 P3 Mean ±U95

48
This publication is available free of charge from: https://doi.org/10.6028/N
IST.SP.260 -213
𝑅𝐹 = (.*)(!+,)(.+,)(!*)
[3]
where Aa peak area of the analyte, AIS peak area of the internal standard, mIS mass of the internal standard, and ma mass of the analyte.
Very low signal to noise was observed for some transitions, and those transitions were not used in determination of average RFs. Relative standard deviation (RSD) for five injections of five calibration solutions was good for all transitions of riboflavin (2.8 % to 4.6 %), niacin (4.4 % to 5.4 %), and pantothenic acid (1.8 % to 3.3 %), three transitions of pyridoxine (3.7 % to 6.0 %), two transitions of niacinamide (4.1 % to 4.9 %), and one transition of pyridoxal (5.3 %). Variability (RSD) was slightly higher, yet still acceptable, for one transition each for thiamine (9.7 %), niacinamide (7.5 %), and pyridoxine (9.5 %). High variability was observed for two transitions of thiamine (18.6 % to 27.3 %) and three transitions of pyridoxal (14.7 % to 16.1 %). One transition for thiamine giving high variability (27.3 %) was not used in calculation of sample mass fractions due to low signal to noise observed in the calibrants. For all vitamins, the variability in the analysis of the samples is comparable to or greater than the variability in the calibration.

49
This publication is available free of charge from: https://doi.org/10.6028/N
IST.SP.260 -213
Figure 23. Optimization of Extraction Temperature and Number of Cycles for B Vitamins Error bars represent the standard deviation of three measurements.
A large peak was identified in the m/z 269.1 à m/z 81 transition for labeled thiamine in a blank sample, which contained only SRM 2386 with no internal standard spike. As a result, this transition was not used in the determination of thiamine mass fraction in the samples. No other peaks were identified in any blank samples. Averages of peak areas over all samples or calibrants were used for each transition. Averages of masses and/or mass fractions were used to estimate the levels in the samples or calibrants. The uncertainty in peak integration was assumed to be 1 %. The uncertainty in weight on a g-scale balance

50
This publication is available free of charge from: https://doi.org/10.6028/N
IST.SP.260 -213
was assumed to be 0.005 %. Uncertainty in purity of calibrant materials was assumed to be 5 % when the uncertainty was not previously established. The combined measurement uncertainties were between 1.25% and 2.02% for all transitions of all analytes. The mass fraction results for each compound in each sample were determined as the mean of the value from each transition with adequate signal to noise in the samples and calibrants using the measurement equation below.
𝑥 = ,.*,.4,.+,,/4,!+,,.4,!*,/4(8*),.*,/4,.+,,.4,!+,,/4(!.)
[4]
Aa,s peak area of the analyte in the sample, AIS,c peak area of the internal standard in the calibrant, mIS,s mass of the internal standard in the sample, ma,c mass of the analyte in the calibrant, pa purity of the analyte in the calibrant, AIS,s peak area of the internal standard in the sample, Aa,c peak area of the analyte in the calibrant, mIS,c mass of the internal standard in the calibrant, and ms mass of the sample. Measured values for thiamine, riboflavin, and pantothenic acid were consistent with the certified values for the SRM 1845a control, however the values for niacinamide and pyridoxal were higher than expected. Measured values for thiamine, riboflavin, niacin, pantothenic acid, pyridoxine, and total vitamin B6 were consistent with the certified values for the SRM 2387 control, however the measured values for niacinamide and pyridoxal were also higher than expected. These observations may have been related to the more robust extraction condition used for SRM 2386 (heating at 100 °C for 30 min) compared to those used for the original value assignment of control materials. The vitamins in the controls were also declared to be in the free, unbound form. The NIST ID LC-MS/MS results for the various B vitamins are summarized in the following sections.

51
This publication is available free of charge from: https://doi.org/10.6028/N
IST.SP.260 -213
4.3.2.1 Thiamine (Vitamin B1) The NIST ID-LC-MS/MS results for thiamine (vitamin B1) and all of the thiamine values reported by the participants in the Fall 2015 GMA Study are summarized in Table 39. The table also provides several summary values: N = number of values, Mean = mean of values, SD = standard deviation of values, and Pooled SD = square-root of the sum of the squared within-box or within-participant standard deviations.
Table 39. Summary of Results for Thiamine (Vitamin B1), mg/kg
NIST ID-LC-MS/MS Fall 2015 GMA Study Box A B Mean SD Lab A B Mean SD Method
1 1.516 1.716 1.616 0.141 5 1.63 1.60 1.62 0.02 LC-MS or LC-MS/MS 2 1.644 1.787 1.716 0.101 6 1.98 1.96 1.97 0.01 LC-FL 3 1.727 1.973 1.850 0.174 7 3.58 3.38 3.48 0.14 Digestion-fluorescence 4 1.785 1.656 1.721 0.091 10 1.80 1.80 not reported 5 1.514 1.626 1.570 0.079 13 2.00 2.00 not reported 6 1.730 1.857 1.794 0.090 18 1.90 1.90 Digestion-fluorescence & AA 7 1.942 1.792 1.867 0.106 N: 6 8 1.708 1.778 1.743 0.049 Mean, Pooled SD: 2.13 0.08 9 1.727 1.905 1.816 0.126 SD: 0.68 10 1.599 1.633 1.616 0.024
N: 10 Mean, Pooled SD: 1.731 0.106
SD: 0.104 AA Autoanalyzer LC-FL Liquid Chromatography with Fluorescence Detection LC-MS Liquid Chromatography with Mass Spectrometry LC-MS/MS Liquid Chromatography with Tandem Mass Spectrometry ID-LC-MS/MS Isotope Dilution Liquid Chromatography with Tandem Mass Spectrometry Figure 24 displays the NIST thiamine results as a function of box number. The blue circles in the figure represent the results for the first replicate and the red squares the second replicate. The mean mass fraction is indicated by the solid line, and the dashed lines bound the interval Mean ± 2×SD.
Figure 24. Thiamine (Vitamin B1) Mass Fraction as a Function of Box Number
1.4
1.6
1.8
2.0
0 2 4 6 8 10
Thia
min
e (m
g/kg
)
Box NumberRep1 Rep2 Mean ±2SD
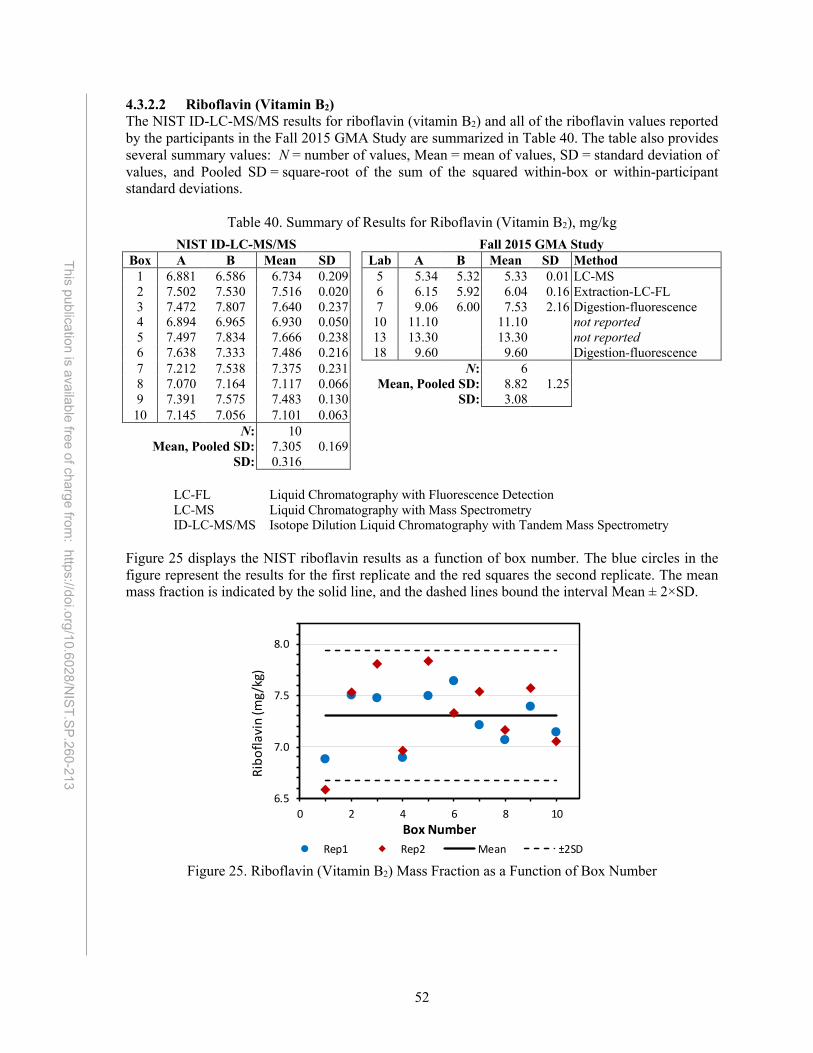
52
This publication is available free of charge from: https://doi.org/10.6028/N
IST.SP.260 -213
4.3.2.2 Riboflavin (Vitamin B2) The NIST ID-LC-MS/MS results for riboflavin (vitamin B2) and all of the riboflavin values reported by the participants in the Fall 2015 GMA Study are summarized in Table 40. The table also provides several summary values: N = number of values, Mean = mean of values, SD = standard deviation of values, and Pooled SD = square-root of the sum of the squared within-box or within-participant standard deviations.
Table 40. Summary of Results for Riboflavin (Vitamin B2), mg/kg
NIST ID-LC-MS/MS Fall 2015 GMA Study Box A B Mean SD Lab A B Mean SD Method
1 6.881 6.586 6.734 0.209 5 5.34 5.32 5.33 0.01 LC-MS 2 7.502 7.530 7.516 0.020 6 6.15 5.92 6.04 0.16 Extraction-LC-FL 3 7.472 7.807 7.640 0.237 7 9.06 6.00 7.53 2.16 Digestion-fluorescence 4 6.894 6.965 6.930 0.050 10 11.10 11.10 not reported 5 7.497 7.834 7.666 0.238 13 13.30 13.30 not reported 6 7.638 7.333 7.486 0.216 18 9.60 9.60 Digestion-fluorescence 7 7.212 7.538 7.375 0.231 N: 6 8 7.070 7.164 7.117 0.066 Mean, Pooled SD: 8.82 1.25 9 7.391 7.575 7.483 0.130 SD: 3.08 10 7.145 7.056 7.101 0.063
N: 10 Mean, Pooled SD: 7.305 0.169
SD: 0.316 LC-FL Liquid Chromatography with Fluorescence Detection LC-MS Liquid Chromatography with Mass Spectrometry
ID-LC-MS/MS Isotope Dilution Liquid Chromatography with Tandem Mass Spectrometry
Figure 25 displays the NIST riboflavin results as a function of box number. The blue circles in the figure represent the results for the first replicate and the red squares the second replicate. The mean mass fraction is indicated by the solid line, and the dashed lines bound the interval Mean ± 2×SD.
Figure 25. Riboflavin (Vitamin B2) Mass Fraction as a Function of Box Number
6.5
7.0
7.5
8.0
0 2 4 6 8 10
Ribo
flavi
n (m
g/kg
)
Box NumberRep1 Rep2 Mean ±2SD

53
This publication is available free of charge from: https://doi.org/10.6028/N
IST.SP.260 -213
4.3.2.3 Niacinamide (Vitamin B3) The NIST ID-LC-MS/MS results for niacinamide (vitamin B3) and all of the niacinamide values reported by the participants in the Fall 2015 GMA Study are summarized in Table 41. The table also provides several summary values: N = number of values, Mean = mean of values, SD = standard deviation of values, and Pooled SD = square-root of the sum of the squared within-box standard deviations.
Table 41. Summary of Results for Niacinamide (Vitamin B3), mg/kg
NIST ID-LC-MS/MS Fall 2015 GMA Study Box A B Mean SD Lab A B Mean SD Method
1 6.468 6.948 6.708 0.340 5 <0.2 <0.2 LC-MS or LC-MS/MS 2 6.320 6.268 6.294 0.036 6 6.13 5.47 5.80 0.47 LC-FL 3 5.867 5.926 5.897 0.042 4 6.656 6.327 6.491 0.232 5 5.693 5.815 5.754 0.086 6 6.167 5.968 6.067 0.141 7 5.891 6.123 6.007 0.164 8 6.623 6.670 6.647 0.033 9 5.777 5.854 5.816 0.055 10 6.677 6.720 6.698 0.030
N: 10 Mean, Pooled SD: 6.238 0.152
SD: 0.377 LC-FL Liquid Chromatography with Fluorescence Detection LC-MS Liquid Chromatography with Mass Spectrometry LC-MS/MS Liquid Chromatography with Tandem Mass Spectrometry ID-LC-MS/MS Isotope Dilution Liquid Chromatography with Tandem Mass Spectrometry Figure 26 displays the NIST niacinamide results as a function of box number. The blue circles in the figure represent the results for the first replicate and the red squares the second replicate. The mean mass fraction is indicated by the solid line, and the dashed lines bound the interval Mean ± 2×SD.
Figure 26. Niacinamide (Vitamin B3) Mass Fraction as a Function of Box Number
5.3
5.7
6.1
6.5
6.9
0 2 4 6 8 10
Nia
cina
mid
e (m
g/kg
)
Box NumberRep1 Rep2 Mean ±2SD

54
This publication is available free of charge from: https://doi.org/10.6028/N
IST.SP.260 -213
4.3.2.4 Niacin (Vitamin B3) The NIST ID-LC-MS/MS results for niacin (vitamin B3) and all of the niacin values reported by the participants in the Fall 2015 GMA Study are summarized in Table 42. The table also provides several summary values: N = number of values, Mean = mean of values, SD = standard deviation of values, and Pooled SD = square-root of the sum of the squared within-box or within-participant standard deviations.
Table 42. Summary of Results for Niacin (Vitamin B3), mg/kg
NIST ID-LC-MS/MS Fall 2015 GMA Study Box A B Mean SD Lab A B Mean SD Method
1 84.06 86.74 85.40 1.90 5 107.6 108.0 107.8 0.3 LC-MS or LC-MS/MS 2 96.21 96.81 96.51 0.42 6 70.2 76.8 73.5 4.7 LC-FL 3 97.71 96.35 97.03 0.96 7 132.0 131.0 131.5 0.7 not reported 4 84.75 82.94 83.85 1.28 10 117.0 117.0 not reported 5 96.89 95.82 96.36 0.76 13 123.0 123.0 not reported 6 101.14 96.91 99.03 2.99 18 114.0 114.0 Microbiological 7 93.18 92.58 92.88 0.42 N: 6 8 77.75 81.02 79.39 2.32 Mean, Pooled SD: 111.1 2.7 9 94.32 94.94 94.63 0.44 SD: 20.1 10 84.83 84.36 84.60 0.34
N: 10 Mean, Pooled SD: 90.97 1.47
SD: 6.95 LC-FL Liquid Chromatography with Fluorescence Detection LC-MS Liquid Chromatography with Mass Spectrometry LC-MS/MS Liquid Chromatography with Tandem Mass Spectrometry ID-LC-MS/MS Isotope Dilution Liquid Chromatography with Tandem Mass Spectrometry Figure 27 displays the NIST niacin results as a function of box number. The blue circles in the figure represent the results for the first replicate and the red squares the second replicate. The mean mass fraction is indicated by the solid line, and the dashed lines bound the interval Mean ± 2×SD.
Figure 27. Niacin (Vitamin B3) Mass Fraction as a Function of Box Number
70
80
90
100
110
0 2 4 6 8 10
Nia
cin
(mg/
kg)
Box NumberRep1 Rep2 Mean ±2SD

55
This publication is available free of charge from: https://doi.org/10.6028/N
IST.SP.260 -213
4.3.2.5 Total Vitamin B3 as Niacinamide The NIST ID-LC-MS/MS results for total vitamin B3 and all of the total vitamin B3 values reported by the participants in the Fall 2015 GMA Study are summarized in Table 43. The table also provides several summary values: N = number of values, Mean = mean of values, SD = standard deviation of values, and Pooled SD = square-root of the sum of the squared within-box or within-participant standard deviations. Total vitamin B3 was calculated as the mass fraction of niacinamide plus 0.992 times the mass fraction of niacin. The factor 0.992 is the ratio of the molar masses of the two compounds: 122.1 g/mol for niacinamide and 123.1 g/mol for niacin.
Table 43. Summary of Results for Total Vitamin B3 as Niacinamide, mg/kg
NIST ID-LC-MS/MS Fall 2015 GMA Study Box A B Mean SD Lab A B Mean SD Method
1 84.06 86.74 85.40 1.90 5 107.6 108.0 107.8 0.3 LC-MS or LC-MS/MS 2 96.21 96.81 96.51 0.42 6 70.2 76.8 73.5 4.7 LC-FL 3 97.71 96.35 97.03 0.96 7 132.0 131.0 131.5 0.7 not reported 4 84.75 82.94 83.85 1.28 10 117.0 117.0 not reported 5 96.89 95.82 96.36 0.76 13 123.0 123.0 not reported 6 101.14 96.91 99.03 2.99 18 114.0 114.0 Microbiological 7 93.18 92.58 92.88 0.42 N: 6 8 77.75 81.02 79.39 2.32 Mean, Pooled SD: 111.1 2.7 9 94.32 94.94 94.63 0.44 SD: 20.1 10 84.83 84.36 84.60 0.34
N: 10 Mean, Pooled SD: 90.97 1.47
SD: 6.95 LC-FL Liquid Chromatography with Fluorescence Detection LC-MS Liquid Chromatography with Mass Spectrometry LC-MS/MS Liquid Chromatography with Tandem Mass Spectrometry ID-LC-MS/MS Isotope Dilution Liquid Chromatography with Tandem Mass Spectrometry Figure 28 displays the NIST results for total vitamin B3 as a function of box number. The blue circles in the figure represent the results for the first replicate and the red squares the second replicate. The mean mass fraction is indicated by the solid line, and the dashed lines bound the interval Mean ± 2×SD.
Figure 28. Total Vitamin B3 Mass Fraction as a Function of Box Number
75
85
95
105
115
0 2 4 6 8 10
Tota
l Vita
min
B3
(mg/
kg)
Box NumberRep1 Rep2 Mean ±2SD

56
This publication is available free of charge from: https://doi.org/10.6028/N
IST.SP.260 -213
4.3.2.6 Pantothenic Acid (Vitamin B5) The NIST ID-LC-MS/MS results for pantothenic acid (vitamin B5) and all of the pantothenic acid values reported by the participants in the Fall 2015 GMA Study are summarized in Table 44. The table also provides several summary values: N = number of values, Mean = mean of values, SD = standard deviation of values, and Pooled SD = square-root of the sum of the squared within-box or within-participant standard deviations.
Table 44. Summary of Results for Pantothenic Acid (Vitamin B5), mg/kg
NIST ID-LC-MS/MS Fall 2015 GMA Study Box A B Mean SD Lab A B Mean SD Method
1 57.56 58.11 57.84 0.39 5 6.5 5.9 6.2 0.4 LC-MS or LC-MS/MS 2 67.64 67.51 67.58 0.09 7 70.2 47.4 58.8 16.1 not reported 3 67.65 68.70 68.18 0.74 10 72.2 72.2 not reported 4 56.78 56.93 56.86 0.11 13 67.5 67.5 not reported 5 67.79 66.86 67.33 0.66 18 63.0 63.0 microbiological 6 67.41 67.16 67.29 0.18 N: 5 7 65.76 65.92 65.84 0.11 Mean, Pooled SD: 53.5 11.4 8 57.12 57.02 57.07 0.07 SD: 26.9 9 66.12 65.70 65.91 0.30 10 59.15 59.09 59.12 0.04
N: 10 Mean, Pooled SD: 63.30 0.36
SD: 4.89 LC-MS Liquid Chromatography with Mass Spectrometry LC-MS/MS Liquid Chromatography with Tandem Mass Spectrometry ID-LC-MS/MS Isotope Dilution Liquid Chromatography with Tandem Mass Spectrometry Figure 29 displays the NIST pantothenic acid results as a function of box number. The blue circles in the figure represent the results for the first replicate and the red squares the second replicate. The mean mass fraction is indicated by the solid line, and the dashed lines bound the interval Mean ± 2×SD.
Figure 29. Pantothenic Acid (Vitamin B5) Mass Fraction as a Function of Box Number
50
55
60
65
70
75
0 2 4 6 8 10
Pant
othe
nic A
cid
(mg/
kg)
Box NumberRep1 Rep2 Mean ±2SD

57
This publication is available free of charge from: https://doi.org/10.6028/N
IST.SP.260 -213
4.3.2.7 Pyridoxal (Vitamin B6) The NIST ID-LC-MS/MS results for pyridoxal (vitamin B6) and all of the pyridoxal values reported by the participants in the Fall 2015 GMA Study are summarized in Table 45. The table also provides several summary values: N = number of values, Mean = mean of values, SD = standard deviation of values, and Pooled SD = square-root of the sum of the squared within-box standard deviations.
Table 45. Summary of Results for Pyridoxal (Vitamin B6), mg/kg
NIST ID-LC-MS/MS Fall 2015 GMA Study Box A B Mean SD Lab A B Mean SD Method
1 1.346 1.479 1.412 0.094 5 1.3 1.2 1.23 0.11 LC-MS or LC-MS/MS 2 1.910 1.820 1.865 0.063 3 1.903 1.820 1.862 0.059 4 1.383 1.294 1.339 0.063 5 1.694 1.789 1.741 0.067 6 2.006 1.869 1.937 0.097 7 2.029 2.160 2.094 0.093 8 1.345 1.471 1.408 0.089 9 2.101 2.161 2.131 0.042 10 1.384 1.460 1.422 0.053
N: 10 Mean, Pooled SD: 1.721 0.074
SD: 0.303 LC-MS Liquid Chromatography with Mass Spectrometry LC-MS/MS Liquid Chromatography with Tandem Mass Spectrometry ID-LC-MS/MS Isotope Dilution Liquid Chromatography with Tandem Mass Spectrometry Figure 30 displays the NIST pyridoxal results as a function of box number. The blue circles in the figure represent the results for the first replicate and the red squares the second replicate. The mean mass fraction is indicated by the solid line, and the dashed lines bound the interval Mean ± 2×SD.
Figure 30. Pyridoxal (Vitamin B6) Mass Fraction as a Function of Box Number
1.0
1.5
2.0
2.5
0 2 4 6 8 10
Pyrid
oxal
(mg/
kg)
Box NumberRep1 Rep2 Mean ±2SD

58
This publication is available free of charge from: https://doi.org/10.6028/N
IST.SP.260 -213
4.3.2.8 Pyridoxine (Vitamin B6) The NIST ID-LC-MS/MS results for pyridoxine (vitamin B6) and all of the pyridoxine values reported by the participants in the Fall 2015 GMA Study are summarized in Table 46. The table also provides several summary values: N = number of values, Mean = mean of values, SD = standard deviation of values, and Pooled SD = square-root of the sum of the squared within-box standard deviations.
Table 46. Summary of Results for Pyridoxine (Vitamin B6), mg/kg
NIST ID-LC-MS/MS Fall 2015 GMA Study Box A B Mean SD Lab A B Mean SD Method
1 3.256 3.246 3.251 0.007 5 3.16 3.07 3.12 0.06 LC-MS or LC-MS/MS 2 3.599 3.636 3.618 0.026 3 3.654 3.567 3.611 0.061 4 3.235 3.201 3.218 0.024 5 3.652 3.520 3.586 0.094 6 3.557 3.478 3.518 0.056 7 3.520 3.448 3.484 0.051 8 3.142 3.146 3.144 0.003 9 3.551 3.485 3.518 0.047 10 3.409 3.178 3.294 0.163
N: 10 Mean, Pooled SD: 3.424 0.070
SD: 0.179 LC-MS Liquid Chromatography with Mass Spectrometry LC-MS/MS Liquid Chromatography with Tandem Mass Spectrometry ID-LC-MS/MS Isotope Dilution Liquid Chromatography with Tandem Mass Spectrometry Figure 31 displays the NIST pyridoxine results as a function of box number. The blue circles in the figure represent the results for the first replicate and the red squares the second replicate. The mean mass fraction is indicated by the solid line, and the dashed lines bound the interval Mean ± 2×SD.
Figure 31. Pyridoxine (Vitamin B6) Mass Fraction as a Function of Box Number
2.9
3.1
3.3
3.5
3.7
3.9
0 2 4 6 8 10
Pyrid
oxin
e (m
g/kg
)
Box NumberRep1 Rep2 Mean ±2SD

59
This publication is available free of charge from: https://doi.org/10.6028/N
IST.SP.260 -213
4.3.2.9 Total Vitamin B6 The NIST ID-LC-MS/MS results for total vitamin B6 and all of the total vitamin B6 values reported by the participants in the Fall 2015 GMA Study are summarized in Table 47. The table also provides several summary values: N = number of values, Mean = mean of values, SD = standard deviation of values, and Pooled SD = square-root of the sum of the squared within-box or within-participant standard deviations. Total vitamin B6 was calculated as the mass fraction of pyridoxine plus 1.017 times the mass fraction of pyridoxal. The factor 1.017 is the ratio of the molar masses of the two compounds: 170.0 g/mol for pyridoxine and 167.2 g/mol for pyridoxal.
Table 47. Summary of Results for Total Vitamin B6, mg/kg
NIST ID-LC-MS/MS Fall 2015 GMA Study Box A B Mean SD Lab A B Mean SD Method
1 4.618 4.743 4.680 0.089 3 0.48 0.48 0.48 0.00 LC-MS or LC-MS/MS 2 5.532 5.479 5.505 0.038 5 4.47 4.22 4.35 0.18 LC-MS or LC-MS/MS 3 5.580 5.409 5.495 0.121 6 5.70 5.80 5.75 0.07 LC-FL 4 4.635 4.511 4.573 0.088 7 8.37 8.57 8.47 0.14 not reported 5 5.367 5.330 5.348 0.026 10 5.82 5.82 not reported 6 5.588 5.369 5.478 0.154 13 9.01 9.01 not reported 7 5.573 5.634 5.603 0.043 18 24.97 24.97 Microbiological 8 4.503 4.635 4.569 0.093 N: 7 9 5.678 5.673 5.675 0.004 Mean, Pooled SD: 8.41 0.12 10 4.811 4.656 4.733 0.109 SD: 7.83
N: 10 Mean, Pooled SD: 5.166 0.089
SD: 0.464 LC-FL Liquid Chromatography with Fluorescence Detection LC-MS Liquid Chromatography with Mass Spectrometry LC-MS/MS Liquid Chromatography with Tandem Mass Spectrometry ID-LC-MS/MS Isotope Dilution Liquid Chromatography with Tandem Mass Spectrometry Figure 32 displays the NIST results for total vitamin B6 as a function of box number. The blue circles in the figure represent the results for the first replicate and the red squares the second replicate. The mean mass fraction is indicated by the solid line, and the dashed lines bound the interval Mean ± 2×SD.
Figure 32. Total Vitamin B6 Mass Fraction as a Function of Box Number
4.0
4.5
5.0
5.5
6.0
0 2 4 6 8 10
Tota
l Vita
min
B6
(mg/
kg)
Box NumberRep1 Rep2 Mean ±2SD

60
This publication is available free of charge from: https://doi.org/10.6028/N
IST.SP.260 -213
Choline and Carnitine Choline and carnitine were extracted from samples of SRM 2386 using microwave-assisted hydrolysis with 1 mol/L HCl at various temperatures ranging from 110 °C to 160 °C using a 15-min hold time (Figure 33). The choline mass fraction levels increased steadily with increased temperature from 110 °C to 150 °C, with a slight decrease in mass fraction observed at the highest hold temperature setting of 160 °C. Minimal changes in carnitine mass fraction levels were obtained with increased temperature.
Figure 33. Optimization of Microwave Hold Temperature for Choline and Carnitine Extraction
The asterisk denotes the conditions used for the certification measurements. Error bars represent the standard deviation of the measured mass fraction levels (N=3).
Choline and carnitine were extracted from samples of SRM 2386 using microwave-assisted hydrolysis with a hold temperature of 140 °C and variable hold times for samples prepared with 1 mol/L HCl and 2 mol/L HCl (Figure 34). Changes in hold time and acid concentration did not produce significant changes in measured choline or carnitine mass fractions, so the shortest time and lowest acid concentration were chosen for simplification of the certification sample preparation.
Figure 34. Optimization of Microwave Hold Time and Acid Mass Fraction for Choline and Carnitine Extraction
The asterisk denotes the conditions used for the certification measurements. Error bars represent the standard deviation of the measured mass fraction levels (N=3).
Most forms of choline are susceptible to acid hydrolysis, but the choline found in phosphocholine may require phospholipase enzyme hydrolysis to free the choline ion from the phospholipid backbone. Following microwave-assisted hydrolysis using parameters determined above and pH adjustment, samples were treated with ≈100 μL of Triton X-100, a surfactant used to improve recovery of choline esters. A 300 μL aliquot of the sample was combined with 1 mL of phospholipase D solution (20 U/mL in 0.25 mol/L sodium acetate plus 0.05 mol/L calcium chloride solution) in a 15 mL polyethylene
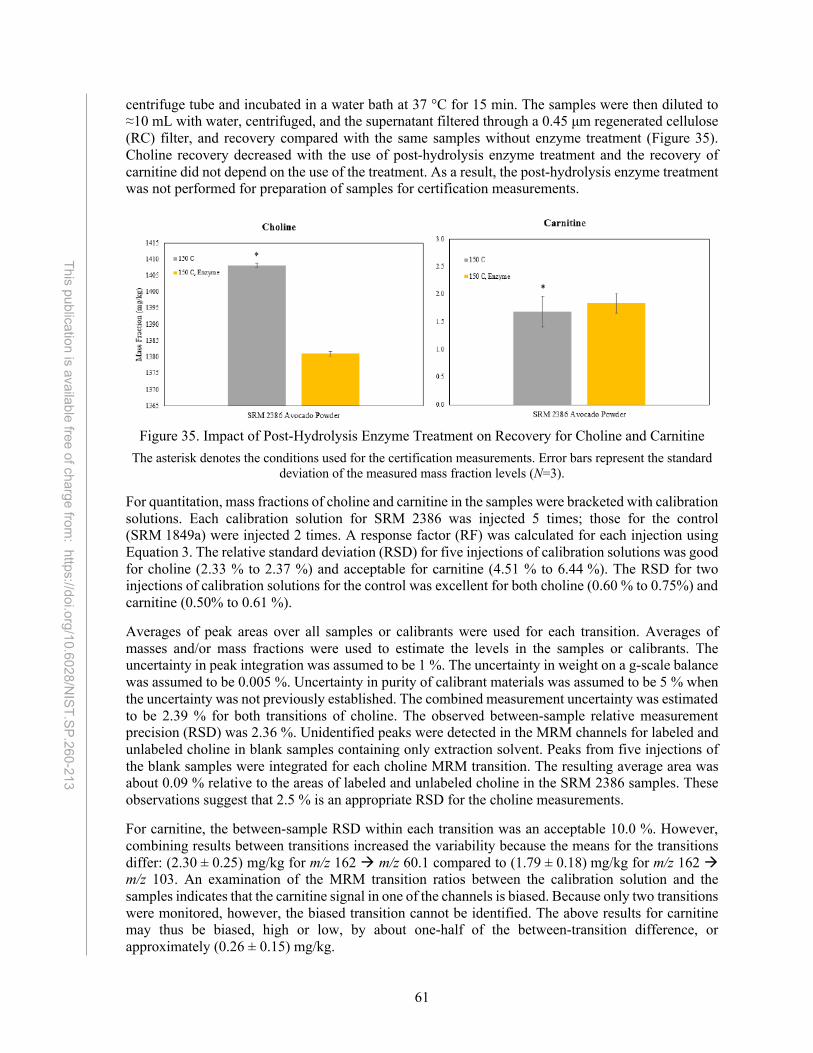
61
This publication is available free of charge from: https://doi.org/10.6028/N
IST.SP.260 -213
centrifuge tube and incubated in a water bath at 37 °C for 15 min. The samples were then diluted to ≈10 mL with water, centrifuged, and the supernatant filtered through a 0.45 μm regenerated cellulose (RC) filter, and recovery compared with the same samples without enzyme treatment (Figure 35). Choline recovery decreased with the use of post-hydrolysis enzyme treatment and the recovery of carnitine did not depend on the use of the treatment. As a result, the post-hydrolysis enzyme treatment was not performed for preparation of samples for certification measurements.
Figure 35. Impact of Post-Hydrolysis Enzyme Treatment on Recovery for Choline and Carnitine
The asterisk denotes the conditions used for the certification measurements. Error bars represent the standard deviation of the measured mass fraction levels (N=3).
For quantitation, mass fractions of choline and carnitine in the samples were bracketed with calibration solutions. Each calibration solution for SRM 2386 was injected 5 times; those for the control (SRM 1849a) were injected 2 times. A response factor (RF) was calculated for each injection using Equation 3. The relative standard deviation (RSD) for five injections of calibration solutions was good for choline (2.33 % to 2.37 %) and acceptable for carnitine (4.51 % to 6.44 %). The RSD for two injections of calibration solutions for the control was excellent for both choline (0.60 % to 0.75%) and carnitine (0.50% to 0.61 %). Averages of peak areas over all samples or calibrants were used for each transition. Averages of masses and/or mass fractions were used to estimate the levels in the samples or calibrants. The uncertainty in peak integration was assumed to be 1 %. The uncertainty in weight on a g-scale balance was assumed to be 0.005 %. Uncertainty in purity of calibrant materials was assumed to be 5 % when the uncertainty was not previously established. The combined measurement uncertainty was estimated to be 2.39 % for both transitions of choline. The observed between-sample relative measurement precision (RSD) was 2.36 %. Unidentified peaks were detected in the MRM channels for labeled and unlabeled choline in blank samples containing only extraction solvent. Peaks from five injections of the blank samples were integrated for each choline MRM transition. The resulting average area was about 0.09 % relative to the areas of labeled and unlabeled choline in the SRM 2386 samples. These observations suggest that 2.5 % is an appropriate RSD for the choline measurements. For carnitine, the between-sample RSD within each transition was an acceptable 10.0 %. However, combining results between transitions increased the variability because the means for the transitions differ: (2.30 ± 0.25) mg/kg for m/z 162 à m/z 60.1 compared to (1.79 ± 0.18) mg/kg for m/z 162 à m/z 103. An examination of the MRM transition ratios between the calibration solution and the samples indicates that the carnitine signal in one of the channels is biased. Because only two transitions were monitored, however, the biased transition cannot be identified. The above results for carnitine may thus be biased, high or low, by about one-half of the between-transition difference, or approximately (0.26 ± 0.15) mg/kg.

62
This publication is available free of charge from: https://doi.org/10.6028/N
IST.SP.260 -213
The mass fraction results for each compound in each sample were determined as the mean of the value from each transition with adequate signal to noise in the samples and calibrants using Equation 4 (Section 4.3.2). The quality assurance measurement results were concordant with the certified values delivered by the control material, SRM 1849a. The NIST ID LC-MS/MS results are summarized in the following sections. 4.3.3.1 Choline The NIST ID-LC-MS/MS results for choline and all of the choline values reported by the participants in the Fall 2015 GMA Study are summarized in Table 48. The table also provides several summary values: N = number of values, Mean = mean of values, SD = standard deviation of values, and Pooled SD = square-root of the sum of the squared within-box standard deviations.
Table 48. Summary of Results for Choline, mg/kg
NIST ID-LC-MS/MS Fall 2015 GMA Study Box Rep1 Rep2 Mean SD Lab A B Mean SD Method
1 1364 1357 1361 5 5 1440 1430 1435 7 LC-MS or LC-MS/MS 2 1445 1430 1438 11 7 1210 1250 1230 28 Other 3 1434 1441 1438 5 10 1240 1240 not reported 4 1351 1363 1357 8 13 815 815 not reported 5 1430 1421 1426 6 N: 4 6 1428 1430 1429 1 Mean, Pooled SD: 1180 21 7 1409 1410 1410 1 SD: 261 8 1372 1358 1365 10 9 1418 1402 1410 11 10 1380 1379 1380 1
N: 10 Mean, Pooled SD: 1401 7
SD: 33
LC-MS Liquid Chromatography with Mass Spectrometry LC-MS/MS Liquid Chromatography with Tandem Mass Spectrometry ID-LC-MS/MS Isotope Dilution Liquid Chromatography with Tandem Mass Spectrometry
Figure 36 displays the NIST choline results as a function of box number. The blue circles in the figure represent the results for the first replicate and the red squares the second replicate. The mean mass fraction is indicated by the solid line, and the dashed lines bound the interval Mean ± 2×SD.
Figure 36. Choline Mass Fraction as a Function of Box Number
1320
1360
1400
1440
1480
0 2 4 6 8 10
Chol
ine
(mg/
kg)
Box NumberRep1 Rep2 Mean ±2SD

63
This publication is available free of charge from: https://doi.org/10.6028/N
IST.SP.260 -213
4.3.3.2 Carnitine The NIST ID-LC-MS/MS results for carnitine and all of the carnitine values reported by the participants in the Fall 2015 GMA Study are summarized in Table 49. The table also provides several summary values: N = number of values, Mean = mean of values, SD = standard deviation of values, and Pooled SD = square-root of the sum of the squared within-box standard deviations.
Table 49. Summary of Results for Carnitine, mg/kg
NIST ID-LC-MS/MS Fall 2015 GMA Study Box A B Mean SD Lab A B Method
1 1.810 1.840 1.825 0.021 5 <5 <5 Hydrolysis, derivatization, LC 2 2.150 2.270 2.210 0.085 10 0 not reported 3 2.170 2.200 2.185 0.021 13 0 not reported 4 1.710 1.850 1.780 0.099 5 2.080 2.180 2.130 0.071 6 2.170 2.290 2.230 0.085 7 2.350 2.380 2.365 0.021 8 1.810 1.830 1.820 0.014 9 1.970 2.040 2.005 0.049 10 1.940 1.900 1.920 0.028
N: 10 Mean, Pooled SD: 2.047 0.058
SD: 0.205 LC Liquid Chromatography ID-LC-MS/MS Isotope Dilution Liquid Chromatography with Tandem Mass Spectrometry Figure 37 displays the NIST carnitine results as a function of box number. The blue circles in the figure represent the results for the first replicate and the red squares the second replicate. The mean mass fraction is indicated by the solid line, and the dashed lines bound the interval Mean ± 2×SD.
Figure 37. Carnitine Mass Fraction as a Function of Box Number
1.5
1.7
1.9
2.1
2.3
2.5
0 2 4 6 8 10
Carn
itine
(mg/
kg)
Box NumberRep1 Rep2 Mean ±2SD
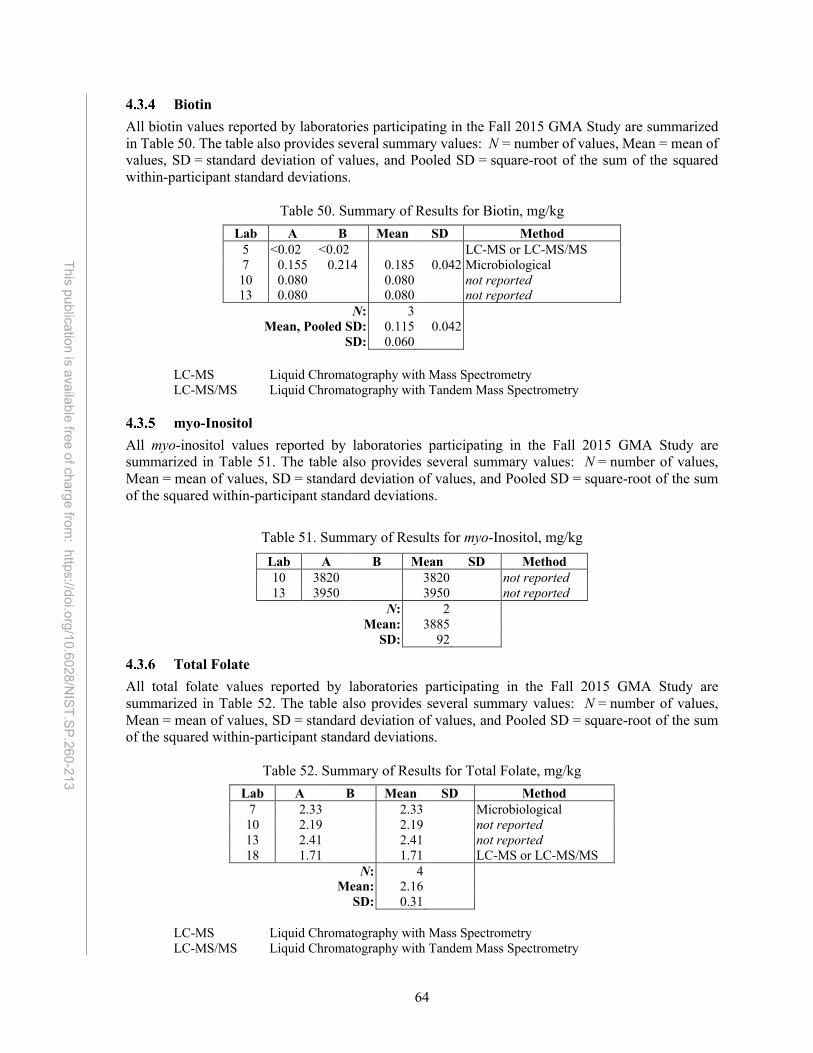
64
This publication is available free of charge from: https://doi.org/10.6028/N
IST.SP.260 -213
Biotin All biotin values reported by laboratories participating in the Fall 2015 GMA Study are summarized in Table 50. The table also provides several summary values: N = number of values, Mean = mean of values, SD = standard deviation of values, and Pooled SD = square-root of the sum of the squared within-participant standard deviations.
Table 50. Summary of Results for Biotin, mg/kg
Lab A B Mean SD Method 5 <0.02 <0.02 LC-MS or LC-MS/MS 7 0.155 0.214 0.185 0.042 Microbiological 10 0.080 0.080 not reported 13 0.080 0.080 not reported
N: 3 Mean, Pooled SD: 0.115 0.042
SD: 0.060 LC-MS Liquid Chromatography with Mass Spectrometry LC-MS/MS Liquid Chromatography with Tandem Mass Spectrometry
myo-Inositol All myo-inositol values reported by laboratories participating in the Fall 2015 GMA Study are summarized in Table 51. The table also provides several summary values: N = number of values, Mean = mean of values, SD = standard deviation of values, and Pooled SD = square-root of the sum of the squared within-participant standard deviations.
Table 51. Summary of Results for myo-Inositol, mg/kg Lab A B Mean SD Method 10 3820 3820 not reported 13 3950 3950 not reported
N: 2 Mean: 3885 SD: 92
Total Folate All total folate values reported by laboratories participating in the Fall 2015 GMA Study are summarized in Table 52. The table also provides several summary values: N = number of values, Mean = mean of values, SD = standard deviation of values, and Pooled SD = square-root of the sum of the squared within-participant standard deviations.
Table 52. Summary of Results for Total Folate, mg/kg
Lab A B Mean SD Method 7 2.33 2.33 Microbiological 10 2.19 2.19 not reported 13 2.41 2.41 not reported 18 1.71 1.71 LC-MS or LC-MS/MS
N: 4 Mean: 2.16 SD: 0.31
LC-MS Liquid Chromatography with Mass Spectrometry LC-MS/MS Liquid Chromatography with Tandem Mass Spectrometry

65
This publication is available free of charge from: https://doi.org/10.6028/N
IST.SP.260 -213
Retinol (Vitamin A) All retinol (vitamin A) values reported by laboratories participating in the Fall 2015 GMA Study are summarized in Table 53. The table also provides several summary values: N = number of values, Mean = mean of values, SD = standard deviation of values, and Pooled SD = square-root of the sum of the squared within-participant standard deviations.
Table 53. Summary of Results for Retinol (Vitamin A), mg/kg
Lab A B Mean SD Method 2 0.130 0.080 0.105 0.035 Saponification, LC-Abs 3 0 0 Extraction 4 0.620 0.520 0.570 0.071 Saponification, extraction, LC-Abs 5 0.180 0.130 0.155 0.035 Saponification, extraction, LC-Abs 6 <1000 <1000 Saponification, extraction, LC-Abs 10 <0.30 not reported 11 0.601 0.601 not reported 13 <0.30 not reported 18 1.670 1.670 Saponification, LC-Abs 26 <12 <12 Extraction 27 <0.5 <0.5 Extraction
N: 5 Mean, Pooled SD: 0.620 0.050
SD: 0.563 LC-Abs Liquid Chromatography with Absorbance Detection
β-Carotene All of the b-carotene values reported by laboratories participating in the Fall 2015 GMA Study are summarized in Table 54. The table also provides several summary values: N = number of values, Mean = mean of values, SD = standard deviation of values, and Pooled SD = square-root of the sum of the squared within-participant standard deviations.
Table 54. Summary of Results for b-Carotene (Provitamin A), mg/kg
Lab A B Mean SD Method 3 35 28 not reported 5 <0.24 <0.24 not reported 10 0.250 0.250 not reported 13 0.220 0.220 not reported 18 0.144 0.144 LC-Abs 27 <0.5 <0.5 not reported
N: 3 Mean: 0.205 SD: 0.063
LC-Abs Liquid Chromatography with Absorbance Detection

66
This publication is available free of charge from: https://doi.org/10.6028/N
IST.SP.260 -213
Tocopherols (Vitamin E) All of the tocopherol values reported by laboratories participating in the Fall 2015 GMA Study are summarized in Table 55. The table also provides several summary values: N = number of values, Mean = mean of values, SD = standard deviation of values, and Pooled SD = square-root of the sum of the squared within-participant standard deviations.
Table 55. Summary of Results for Tocopherols (Vitamin E), mg/kg
α-Tocopherol β-Tocopherol γ-Tocopherol Lab A B Mean SD A B A B Method
2 47.50 50.20 48.85 1.91 Saponification, LC-FL 4 <30 <30 Saponification, extraction, LC-Abs 5 27. 25 26.00 1.41 Saponification, extraction, LC-FL 6 288 284 Saponification, extraction, LC-FL 7 47.70 47.70 18.50 4.75 not reported 10 23.30 23.30 3.04 3.65 not reported 18 27.30 27.30 2.35 3.73 Saponification, LC-FL 27 21.13 21.93 21.53 0.57 LC
N: 6 3 3 Mean, Pooled SD: 32.45 1.41 7.96 4.04
SD: 10.15 10.54 0.71 LC-Abs Liquid Chromatography with Absorbance Detection LC-FL Liquid Chromatography with Fluorescence Detection
Vitamin K All of the vitamin K values reported by laboratories participating in the Fall 2015 GMA Study are summarized in Table 56. The table also provides several summary values: N = number of values, Mean = mean of values, SD = standard deviation of values, and Pooled SD = square-root of the sum of the squared within-participant standard deviations.
Table 56. Summary of Results for Vitamin K, mg/kg
Lab A B Mean SD Method 5 0.386 0.385 0.386 0.001 Extraction, LC-FL 10 0.325 0.325 not specified 13 0.120 0.120 not specified 27 <0.2 <0.2 LC
N: 3 Mean, Pooled SD: 0.277 0.001
SD: 0.161 LC Liquid Chromatography
LC-FL Liquid Chromatography with Fluorescence Detection

67
This publication is available free of charge from: https://doi.org/10.6028/N
IST.SP.260 -213
Value Assignment As described in Section 3.3, available data for each measurand to provide an estimate of the mass fraction present in SRM 2386 where x is the mean and U95(x) is the 95% confidence interval. The summary of these estimates for vitamins is provided in Table 57, along with a summary of the methods used to arrive at these estimates. A blank in the table indicates that no data from that method was available for determination of the estimate. For ascorbic acid, riboflavin, niacin, niacinamide, total vitamin B3, pantothenic acid, pyridoxal, pyridoxine, total vitamin B6 as pyridoxine, choline, and carnitine, the uncertainty incorporates a component for possible inhomogeneity based on the standard deviation.
Table 57. Summary of Estimates for Vitamins in SRM 2386, mg/kg
Based on Analyte x U95(x) NIST Method Fall 2015 GMA Methodsa
Ascorbic acid 186.44 361.76b LC-UV LC-FL, LC-UV, DCPIP Ascorbic acid 186.4449 10.5938 LC-UV Biotin 0.084 0.112b LC-MS or LC-MS/MS, Microbiological Carnitine 2.151 0.461 ID-LC-MS/MS Choline 1468.39 141.50 ID-LC-MS/MS Extraction-based LC-MS or LC-MS/MS myo Inositol 4082.568 372.830 Not reported Niacin 106.82 30.64 ID-LC-MS/MS LC-MS, LC-MS/MS, Extraction-LC,
Microbiological Niacinamide 6.555 0.872 ID-LC-MS/MS LC-MS, LC-MS/MS, Extraction-LC Pantothenic acid 66.56 11.26 ID-LC-MS/MS LC-MS, LC-MS/MS, Microbiological Pyridoxal 1.809 0.676 ID-LC-MS/MS Pyridoxine 3.598 0.414 ID-LC-MS/MS Retinol 0.599 0.743b Saponification, Extraction, LC-UV Riboflavin 7.68 1.35 ID-LC-MS/MS LC-MS, Digestion-FL, Extraction-FL Thiamine 1.82 0.17 ID-LC-MS/MS AA, LC-MS, LC-MS/MS, LC-FL, Digestion-FL Total Folates 2.375 0.569 LC-MS or LC-MS/MS, Microbiological Total Vitamin B3 101.44 24.03 ID-LC-MS/MS LC-MS, LC-MS/MS, Extraction-LC-FL,
Microbiological Total Vitamin B6 as Pyridoxine
5.43 2.06 ID-LC-MS/MS LC-MS, LC-MS/MS, LC-FL, Microbiological
Vitamin K 0.342 0.271 Extraction, LC-FL α-Tocopherol 28.005 12.797 Saponification, Extraction, LC-UV, LC-FL β-Carotene 0.247 17.499b LC-UV β-Tocopherol 3.195 21.387b Saponification, Extraction, LC-UV, LC-FL γ-Tocopherol 3.920 1.383 Saponification, Extraction, LC-UV, LC-FL
a Not all laboratories reported methods used. AA Autoanalyzer DCPIP Titration with Dichlorophenol Indophenol Detection ID-LC-MS/MS Isotope Dilution Liquid Chromatography with Tandem Mass Spectrometry FL Fluorescence LC Liquid Chromatography LC-UV Liquid Chromatography with UV Absorbance Detection LC-FL Liquid Chromatography with Fluorescence Detection LC-MS Liquid Chromatography with Mass Spectrometry LC-MS/MS Liquid Chromatography with Tandem Mass Spectrometry
b The expanded uncertainty is larger than the value, indicating a large level of variability. Any interval for the value should be truncated at zero.

68
This publication is available free of charge from: https://doi.org/10.6028/N
IST.SP.260 -213
4.4 Fatty Acids No fatty acids were consistently detected in the duplicate analysis of the blank sample, although a detectable quantity of oleic acid, palmitic acid, and stearic acid methyl esters were found in the first blank analysis, potentially due to carryover from the high concentration of the first calibration solution. The carry-over mass from the previous calibrant accounts for less than 1 % of the mass in the calibration solution and should not affect calculations. No quantity of these compounds was detectable in the second analysis of the same blank solution. The contribution of the potential blank contamination is minimal to all fatty acids except stearic acid and should not affect the overall quantitation of most of the fatty acids. Up to 14 % of the steric acid result may be due to blank contamination. In previous studies of fatty acids, measurement of both a concentrated and dilute solution of the sample extract was required to determine both high- and low-level fatty acids. In this study, concentrated and dilute solutions of the extracts were measured but due to the high level of background signal and the high concentration of most fatty acids, the results for the concentrated samples are not reported. The analyte signal for some compounds in multiple samples was below a 3.3 signal-to-noise cut-off for limits of detection and are also not reported. The Soxhlet setup for one of the box 1 samples was spilled resulting in the loss of sample mass. The results from this sample are technical outliers and are not reported. The quality assurance measurement results for most of the free fatty acids were concordant with the non-certified values delivered by the control material, SRM 1845a. All fatty acids results determined at NIST and by the Fall 2015 and Spring 2016 GMA Studies were reported on an as-received basis and converted to a dry-mass basis using the moisture correction provided in Section 4.1.3 for reporting on the COA. Results from GMA studies include those fatty acids that were quantitatively determined by at least two participants. Results reported as “0” or “<” values are not used in the statistical summaries. Values that are at least 10-fold greater than the median of the quantitative values (most likely reflecting unit conversion errors) are also not used in the summaries

69
This publication is available free of charge from: https://doi.org/10.6028/N
IST.SP.260 -213
Lauric Acid (C12:0) The NIST GC-FID results and all of the lauric acid values reported by the participants in the Fall 2015 GMA Study and Spring 2016 GMA Study are summarized in Table 58. The table also provides several summary values: N = number of values, Mean = mean of values, SD = standard deviation of values, and Pooled SD = square-root of the sum of the squared within-box or within-participant standard deviations.
Table 58. Summary of Results for Lauric Acid, %
Figure 38 displays the NIST lauric acid results as a function of box number. The blue circles in the graphics represent the results for the first replicate and the red squares the second replicate. The mean mass fraction is indicated by the solid line, and the dashed lines bound the interval Mean ± 2×SD.
Figure 38. Lauric Acid Mass Fraction as a Function of Box Number
0.02
0.05
0.08
0.11
0 2 4 6 8 10 12
Laur
ic A
cid
(%)
Box NumberRep1 Rep2 Mean ±2SD
NIST GC-FID Fall 2015 GMA Study Spring 2016 GMA Study Box A B Mean SD Lab A B Mean SD A B Mean SD
1 0.046 0.046 2 0.003 0.004 0.004 0.001 2 0.116 0.043 0.080 0.052 3 0.016 0.016 3 0.072 0.122 0.097 0.035 4 0 0 4 0.066 0.055 0.061 0.008 5 <0.01 <0.01 0.020 0.020 0.020 0.000 5 0.081 0.069 0.075 0.008 6 <0.01 <0.01 6 0.088 0.094 0.091 0.004 7 0.050 0.040 0.045 0.007 0.005 0.004 0.005 0.001 7 0.046 0.070 0.058 0.017 10 <0.005 8 0.104 0.057 0.081 0.033 12 0.040 0.020 0.030 0.014 9 0.053 0.059 0.056 0.004 13 <0.01 <0.01 0 0 12 0.113 0.113 16 0.010 <0.01 0.010 N: 10 18 <0.01 <0.01
Mean, Pooled SD: 0.076 0.026 22 <0.01 SD: 0.021 24 0.010 0.010 0.010 0.000 25 <0.007 27 0.003 0.003 0.003 0.000 28 <0.01 29 <0.01 <0.01
N: 5 4 Mean, Pooled SD: 0.016 0.004 0.016 0.008 SD: 0.017 0.011
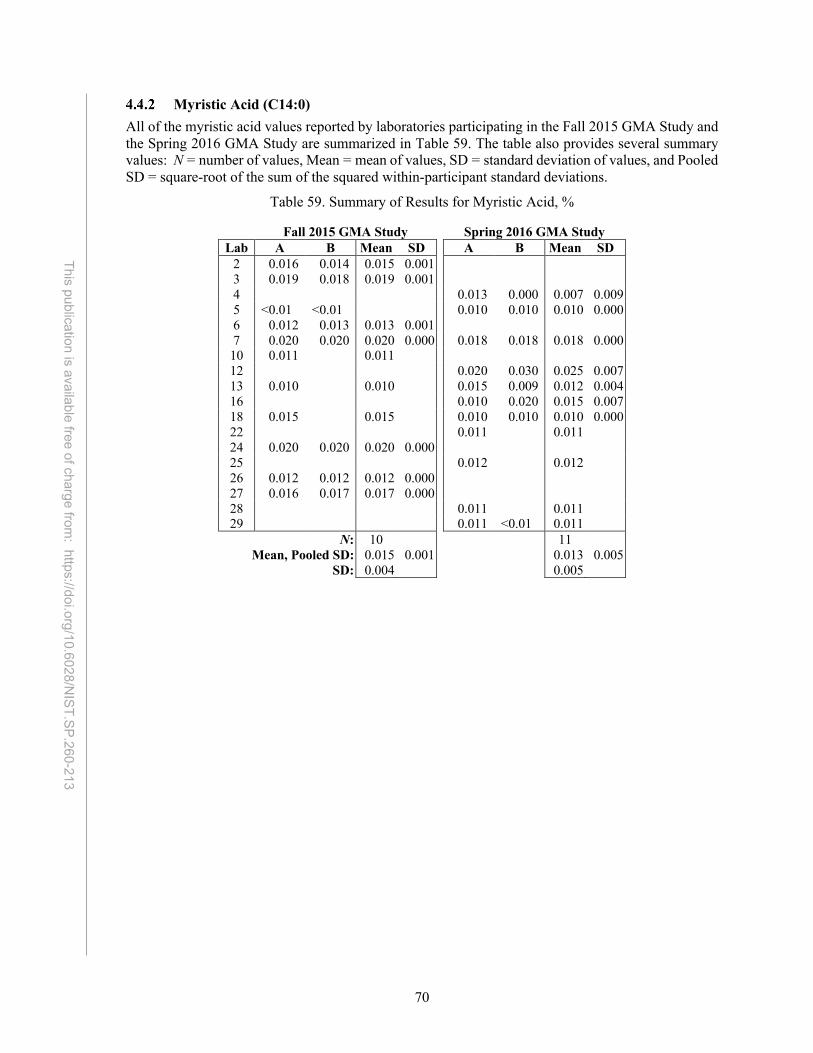
70
This publication is available free of charge from: https://doi.org/10.6028/N
IST.SP.260 -213
Myristic Acid (C14:0) All of the myristic acid values reported by laboratories participating in the Fall 2015 GMA Study and the Spring 2016 GMA Study are summarized in Table 59. The table also provides several summary values: N = number of values, Mean = mean of values, SD = standard deviation of values, and Pooled SD = square-root of the sum of the squared within-participant standard deviations.
Table 59. Summary of Results for Myristic Acid, %
Fall 2015 GMA Study Spring 2016 GMA Study Lab A B Mean SD A B Mean SD
2 0.016 0.014 0.015 0.001 3 0.019 0.018 0.019 0.001 4 0.013 0.000 0.007 0.009 5 <0.01 <0.01 0.010 0.010 0.010 0.000 6 0.012 0.013 0.013 0.001 7 0.020 0.020 0.020 0.000 0.018 0.018 0.018 0.000 10 0.011 0.011 12 0.020 0.030 0.025 0.007 13 0.010 0.010 0.015 0.009 0.012 0.004 16 0.010 0.020 0.015 0.007 18 0.015 0.015 0.010 0.010 0.010 0.000 22 0.011 0.011 24 0.020 0.020 0.020 0.000 25 0.012 0.012 26 0.012 0.012 0.012 0.000 27 0.016 0.017 0.017 0.000 28 0.011 0.011 29 0.011 <0.01 0.011
N: 10 11 Mean, Pooled SD: 0.015 0.001 0.013 0.005 SD: 0.004 0.005

71
This publication is available free of charge from: https://doi.org/10.6028/N
IST.SP.260 -213
Palmitic Acid (C16:0) The NIST GC-FID results and all of the palmitic acid values reported by the participants in the Fall 2015 GMA Study and Spring 2016 GMA Study are summarized in Table 60. The table also provides several summary values: N = number of values, Mean = mean of values, SD = standard deviation of values, and Pooled SD = square-root of the sum of the squared within-box or within-participant standard deviations.
Table 60. Summary of Results for Palmitic Acid, %
Figure 39 displays the NIST palmitic acid results as a function of box number. The blue circles in the graphics represent the results for the first replicate and the red squares the second replicate. The mean mass fraction is indicated by the solid line, and the dashed lines bound the interval Mean ± 2×SD.
Figure 39. Palmitic Acid Mass Fraction as a Function of Box Number
2.9
3.0
3.1
3.2
0 2 4 6 8 10 12
Palm
itic A
cid
(%)
Box NumberRep1 Rep2 Mean ±2SD
NIST GC-FID Fall 2015 GMA Study Spring 2016 GMA Study Box A B Mean SD Lab A B Mean SD A B Mean SD
1 2.998 2.998 2 3.445 3.536 3.491 0.064 2 3.007 3.071 3.039 0.045 3 3.052 3.105 3.079 0.037 3 3.084 3.078 3.081 0.004 4 4.710 4.610 4.660 0.071 2.990 2.970 2.980 0.014 4 3.054 3.008 3.031 0.033 5 3.020 3.040 3.030 0.014 3.110 3.150 3.130 0.028 5 3.030 2.918 2.974 0.079 6 2.732 2.787 2.760 0.039 6 3.099 3.034 3.067 0.046 7 3.260 3.220 3.240 0.028 3.612 3.233 3.423 0.268 7 3.019 3.019 3.019 0.000 9 4.570 4.650 4.610 0.057 8 3.102 3.172 3.137 0.049 10 3.110 3.110 9 3.057 3.023 3.040 0.024 12 3.190 3.250 3.220 0.042 12 2.966 3.073 3.020 0.076 13 3.022 3.022 3.603 3.594 3.599 0.006 N: 10 16 3.230 3.180 3.205 0.035
Mean, Pooled SD: 3.041 0.047 18 3.277 3.277 2.850 2.800 2.825 0.035 SD: 0.046 22 3.040 3.040 24 3.220 3.220 3.220 0.000 25 3.420 3.420 26 4.034 4.106 4.070 0.051 27 3.949 3.652 3.800 0.210 28 3.190 3.190 29 3.310 3.310 3.310 0.000
N: 12 12 Mean, Pooled SD: 3.396 0.081 3.329 0.094 SD: 0.536 0.455
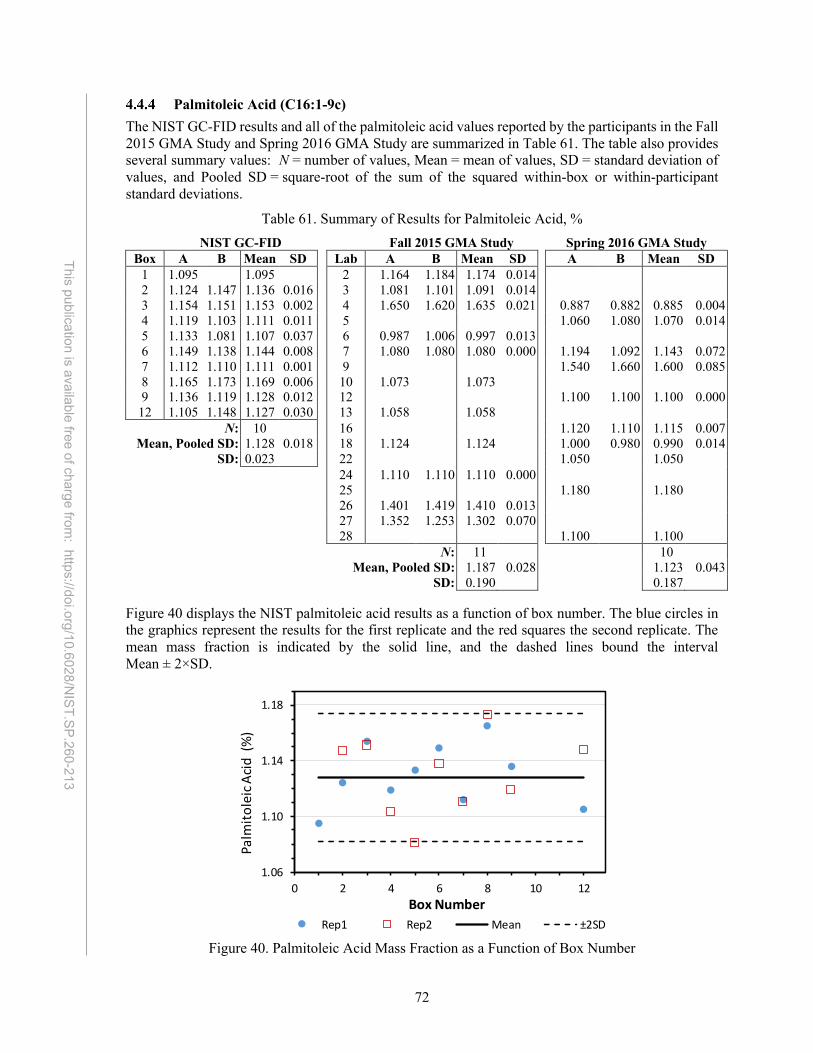
72
This publication is available free of charge from: https://doi.org/10.6028/N
IST.SP.260 -213
Palmitoleic Acid (C16:1-9c) The NIST GC-FID results and all of the palmitoleic acid values reported by the participants in the Fall 2015 GMA Study and Spring 2016 GMA Study are summarized in Table 61. The table also provides several summary values: N = number of values, Mean = mean of values, SD = standard deviation of values, and Pooled SD = square-root of the sum of the squared within-box or within-participant standard deviations.
Table 61. Summary of Results for Palmitoleic Acid, %
Figure 40 displays the NIST palmitoleic acid results as a function of box number. The blue circles in the graphics represent the results for the first replicate and the red squares the second replicate. The mean mass fraction is indicated by the solid line, and the dashed lines bound the interval Mean ± 2×SD.
Figure 40. Palmitoleic Acid Mass Fraction as a Function of Box Number
1.06
1.10
1.14
1.18
0 2 4 6 8 10 12
Palm
itole
ic A
cid
(%)
Box NumberRep1 Rep2 Mean ±2SD
NIST GC-FID Fall 2015 GMA Study Spring 2016 GMA Study Box A B Mean SD Lab A B Mean SD A B Mean SD
1 1.095 1.095 2 1.164 1.184 1.174 0.014 2 1.124 1.147 1.136 0.016 3 1.081 1.101 1.091 0.014 3 1.154 1.151 1.153 0.002 4 1.650 1.620 1.635 0.021 0.887 0.882 0.885 0.004 4 1.119 1.103 1.111 0.011 5 1.060 1.080 1.070 0.014 5 1.133 1.081 1.107 0.037 6 0.987 1.006 0.997 0.013 6 1.149 1.138 1.144 0.008 7 1.080 1.080 1.080 0.000 1.194 1.092 1.143 0.072 7 1.112 1.110 1.111 0.001 9 1.540 1.660 1.600 0.085 8 1.165 1.173 1.169 0.006 10 1.073 1.073 9 1.136 1.119 1.128 0.012 12 1.100 1.100 1.100 0.000 12 1.105 1.148 1.127 0.030 13 1.058 1.058 N: 10 16 1.120 1.110 1.115 0.007
Mean, Pooled SD: 1.128 0.018 18 1.124 1.124 1.000 0.980 0.990 0.014 SD: 0.023 22 1.050 1.050 24 1.110 1.110 1.110 0.000 25 1.180 1.180 26 1.401 1.419 1.410 0.013 27 1.352 1.253 1.302 0.070 28 1.100 1.100
N: 11 10 Mean, Pooled SD: 1.187 0.028 1.123 0.043 SD: 0.190 0.187

73
This publication is available free of charge from: https://doi.org/10.6028/N
IST.SP.260 -213
Stearic Acid (C18:0) The NIST GC-FID results and all of the stearic acid values reported by the participants in the Fall 2015 GMA Study and Spring 2016 GMA Study are summarized in Table 62. The table also provides several summary values: N = number of values, Mean = mean of values, SD = standard deviation of values, and Pooled SD = square-root of the sum of the squared within-box or within-participant standard deviations.
Table 62. Summary of Results for Stearic Acid, %
Figure 41 displays the NIST stearic acid results as a function of box number. The blue circles in the graphics represent the results for the first replicate and the red squares the second replicate. The mean mass fraction is indicated by the solid line, and the dashed lines bound the interval Mean ± 2×SD.
Figure 41. Stearic Acid Mass Fraction as a Function of Box Number
NIST GC-FID Fall 2015 GMA Study Spring 2016 GMA Study Box A B Mean SD Lab A B Mean SD A B Mean SD
1 2 0.110 0.109 0.110 0.001 2 0.087 0.102 0.095 0.011 3 0.188 0.192 0.190 0.003 3 0.097 0.108 0.103 0.008 4 0.140 0.130 0.135 0.007 0.220 0.229 0.225 0.006 4 0.100 0.101 0.101 0.001 5 0.081 0.082 0.082 0.001 5 0.096 0.120 0.108 0.017 6 0.084 0.085 0.085 0.001 6 0.084 0.081 0.083 0.002 7 0.120 0.120 0.120 0.000 0.118 0.097 0.108 0.015 7 0.099 0.101 0.100 0.001 9 0.150 0.150 0.150 0.000 8 0.108 0.102 0.105 0.004 10 0.090 0.090 9 0.094 0.107 0.101 0.009 12 0.100 0.120 0.110 0.014 12 0.101 0.102 0.102 0.001 13 0.087 0.087 0.104 0.092 0.098 0.008 N: 9 16 0.120 0.100 0.110 0.014
Mean, Pooled SD: 0.099 0.008 18 0.106 0.106 0.100 0.100 0.100 0.000 SD: 0.007 22 0.088 0.088 24 0.120 0.140 0.130 0.014 25 0.100 0.100 26 0.106 0.106 0.106 0.000 27 0.116 0.103 0.110 0.009 28 0.095 0.095 29 0.101 0.101 0.101 0.000
N: 12 11 Mean, Pooled SD: 0.112 0.006 0.117 0.010 SD: 0.030 0.039

74
This publication is available free of charge from: https://doi.org/10.6028/N
IST.SP.260 -213
Oleic Acid (C18:1-9c) The NIST GC-FID results and all of the oleic acid values reported by the participants in the Fall 2015 GMA Study and Spring 2016 GMA Study are summarized in Table 63. The table also provides several summary values: N = number of values, Mean = mean of values, SD = standard deviation of values, and Pooled SD = square-root of the sum of the squared within-box or within-participant standard deviations.
Table 63. Summary of Results for Oleic Acid, %
Figure 42 displays the NIST oleic acid results as a function of box number. The blue circles in the graphics represent the results for the first replicate and the red squares the second replicate. The mean mass fraction is indicated by the solid line, and the dashed lines bound the interval Mean ± 2×SD.
Figure 42. Oleic Acid Mass Fraction as a Function of Box Number
11.5
11.8
12.1
12.4
12.7
0 2 4 6 8 10 12
Ole
ic A
cid
(%)
Box NumberRep1 Rep2 Mean ±2SD
NIST GC-FID Fall 2015 GMA Study Spring 2016 GMA Study Box A B Mean SD Lab A B Mean SD A B Mean SD
1 12.335 12.335 3 13.113 13.290 13.202 0.125 2 12.051 12.378 12.215 0.231 4 18.540 18.390 18.465 0.106 13.310 12.960 13.135 0.247 3 12.410 12.316 12.363 0.066 7 12.500 12.440 12.470 0.042 4 12.570 12.357 12.464 0.151 9 18.690 18.830 18.760 0.099 5 12.219 11.676 11.948 0.384 10 12.754 12.754 6 12.497 12.269 12.383 0.161 12 12.800 12.820 12.810 0.014 7 12.430 12.414 12.422 0.011 13 12.376 12.376 17.998 17.992 17.995 0.004 8 12.466 12.698 12.582 0.164 16 12.920 12.720 12.820 0.141 9 12.398 12.239 12.319 0.112 18 17.569 17.569 11.750 11.550 11.650 0.141 12 11.925 12.314 12.120 0.275 22 12.300 12.300 N: 10 24 12.710 12.640 12.675 0.049 14.000 13.000 13.500 0.707
Mean, Pooled SD: 12.315 0.203 26 18.187 18.190 18.189 0.002 SD: 0.181 29 15.300 15.300 15.300 0.000
N: 8 9 Mean, Pooled SD: 14.712 0.079 14.252 0.276 SD: 2.805 2.548

75
This publication is available free of charge from: https://doi.org/10.6028/N
IST.SP.260 -213
Vaccenic Acid (C18:1-11c) The NIST GC-FID results and all of the vaccenic acid values reported by the participants in the Fall 2015 GMA Study and Spring 2016 GMA Study are summarized in Table 64. The table also provides several summary values: N = number of values, Mean = mean of values, SD = standard deviation of values, and Pooled SD = square-root of the sum of the squared within-box or within-participant standard deviations.
Table 64. Summary of Results for Vaccenic Acid, %
Figure 43 displays the NIST vaccenic acid results as a function of box number. The blue circles in the graphics represent the results for the first replicate and the red squares the second replicate. The mean mass fraction is indicated by the solid line, and the dashed lines bound the interval Mean ± 2×SD.
Figure 43. Vaccenic Acid Mass Fraction as a Function of Box Number
NIST GC-FID Fall 2015 GMA Study Spring 2016 GMA Study Box A B Mean SD Lab A B Mean SD A B Mean SD
1 1.167 1.167 3 3.213 3.285 3.249 0.051 2 1.172 1.191 1.182 0.013 4 1.840 1.840 1.840 0.000 3.600 3.850 3.725 0.177 3 1.191 1.206 1.199 0.011 7 1.120 1.120 1.120 0.000 4 1.186 1.172 1.179 0.010 9 1.980 1.960 1.970 0.014 5 1.177 1.129 1.153 0.034 10 1.145 1.145 6 1.202 1.190 1.196 0.008 12 1.140 1.140 1.140 0.000 7 1.177 1.171 1.174 0.004 13 1.191 1.191 1.274 1.268 1.271 0.004 8 1.219 1.216 1.218 0.002 16 1.170 1.140 1.155 0.021 9 1.188 1.173 1.181 0.011 22 1.120 1.120 12 1.152 1.192 1.172 0.028 24 1.150 1.150 1.150 0.000 N: 10 25 1.260 1.260
Mean, Pooled SD: 1.182 0.017 26 1.455 1.467 1.461 0.008 SD: 0.018 28 1.180 1.180
N: 7 8 Mean, Pooled SD: 1.594 0.023 1.603 0.080 SD: 0.775 0.902
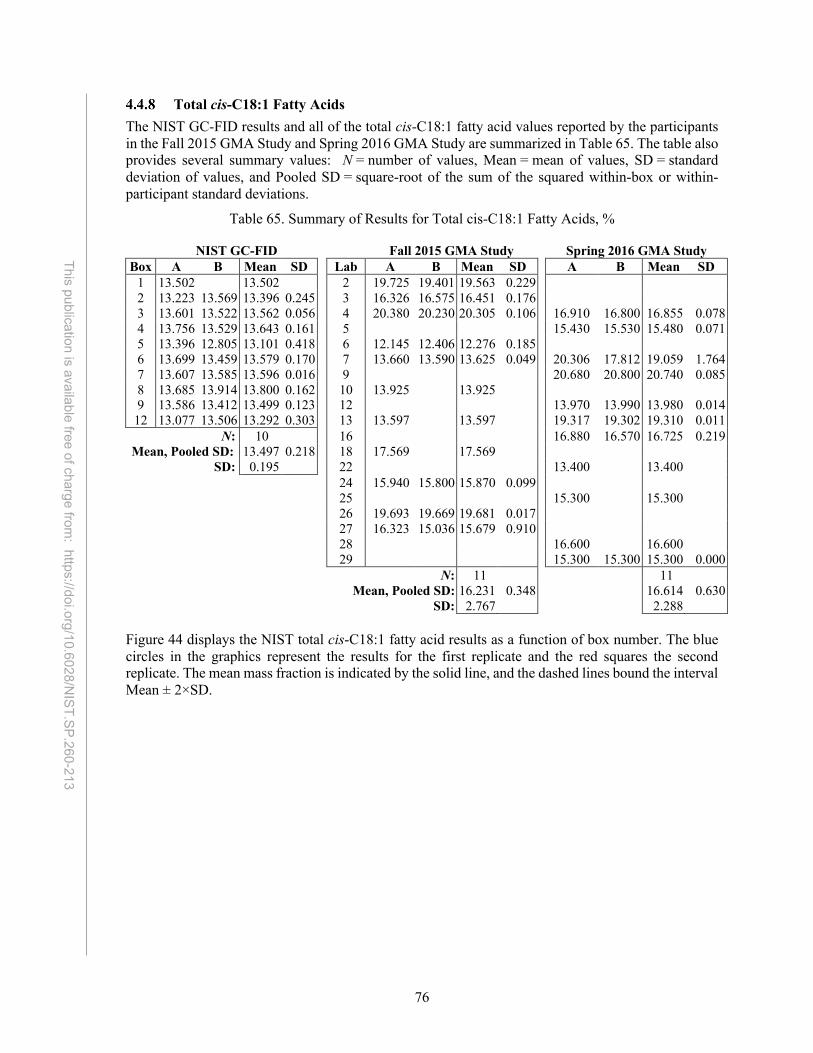
76
This publication is available free of charge from: https://doi.org/10.6028/N
IST.SP.260 -213
Total cis-C18:1 Fatty Acids The NIST GC-FID results and all of the total cis-C18:1 fatty acid values reported by the participants in the Fall 2015 GMA Study and Spring 2016 GMA Study are summarized in Table 65. The table also provides several summary values: N = number of values, Mean = mean of values, SD = standard deviation of values, and Pooled SD = square-root of the sum of the squared within-box or within-participant standard deviations.
Table 65. Summary of Results for Total cis-C18:1 Fatty Acids, %
Figure 44 displays the NIST total cis-C18:1 fatty acid results as a function of box number. The blue circles in the graphics represent the results for the first replicate and the red squares the second replicate. The mean mass fraction is indicated by the solid line, and the dashed lines bound the interval Mean ± 2×SD.
NIST GC-FID Fall 2015 GMA Study Spring 2016 GMA Study Box A B Mean SD Lab A B Mean SD A B Mean SD
1 13.502 13.502 2 19.725 19.401 19.563 0.229 2 13.223 13.569 13.396 0.245 3 16.326 16.575 16.451 0.176 3 13.601 13.522 13.562 0.056 4 20.380 20.230 20.305 0.106 16.910 16.800 16.855 0.078 4 13.756 13.529 13.643 0.161 5 15.430 15.530 15.480 0.071 5 13.396 12.805 13.101 0.418 6 12.145 12.406 12.276 0.185 6 13.699 13.459 13.579 0.170 7 13.660 13.590 13.625 0.049 20.306 17.812 19.059 1.764 7 13.607 13.585 13.596 0.016 9 20.680 20.800 20.740 0.085 8 13.685 13.914 13.800 0.162 10 13.925 13.925 9 13.586 13.412 13.499 0.123 12 13.970 13.990 13.980 0.014 12 13.077 13.506 13.292 0.303 13 13.597 13.597 19.317 19.302 19.310 0.011 N: 10 16 16.880 16.570 16.725 0.219
Mean, Pooled SD: 13.497 0.218 18 17.569 17.569 SD: 0.195 22 13.400 13.400 24 15.940 15.800 15.870 0.099 25 15.300 15.300 26 19.693 19.669 19.681 0.017 27 16.323 15.036 15.679 0.910 28 16.600 16.600 29 15.300 15.300 15.300 0.000
N: 11 11 Mean, Pooled SD: 16.231 0.348 16.614 0.630 SD: 2.767 2.288

77
This publication is available free of charge from: https://doi.org/10.6028/N
IST.SP.260 -213
Figure 44. Total cis-C18:1 Mass Fraction as a Function of Box Number
Total trans-C18:1 Fatty Acids
All of the total trans-C18:1 fatty acids values reported by laboratories participating in the Fall 2015 GMA Study and the Spring 2016 GMA Study are summarized in Table 66. The table also provides several summary values: N = number of values, Mean = mean of values, SD = standard deviation of values, and Pooled SD = square-root of the sum of the squared within-participant standard deviations.
Table 66. Summary of Results for Total trans-C18:1 Fatty Acids, %
Fall 2015 GMA Study Spring 2016 GMA Study Lab A B Mean SD A B Mean SD
2 0.014 0.008 0.011 0.004 4 0.030 0.040 0.035 0.007 0.037 0.192 0.115 0.110 6 0.010 0.010 7 0.130 0.130 0.130 0.000 0.012 0.008 0.010 0.003 10 0.038 0.038 12 0.110 0.120 0.115 0.007 13 0.013 0.013 0.006 0.006 0.006 0.000 16 0.010 0.050 0.030 0.028 18 0.008 0.008 22 0.011 0.011 24 0.040 0.040 0.040 0.000 25 0.016 0.016 26 0.006 0.006 0.006 0.000 28 0.024 0.024 29 0.028 0.029 0.029 0.001
N: 9 9 Mean, Pooled SD: 0.032 0.004 0.039 0.046 SD: 0.039 0.043
13.0
13.2
13.4
13.6
13.8
14.0
0 2 4 6 8 10 12
Tota
l cis
-C18
:1 (
%)
Box NumberRep1 Rep2 Mean ±2SD
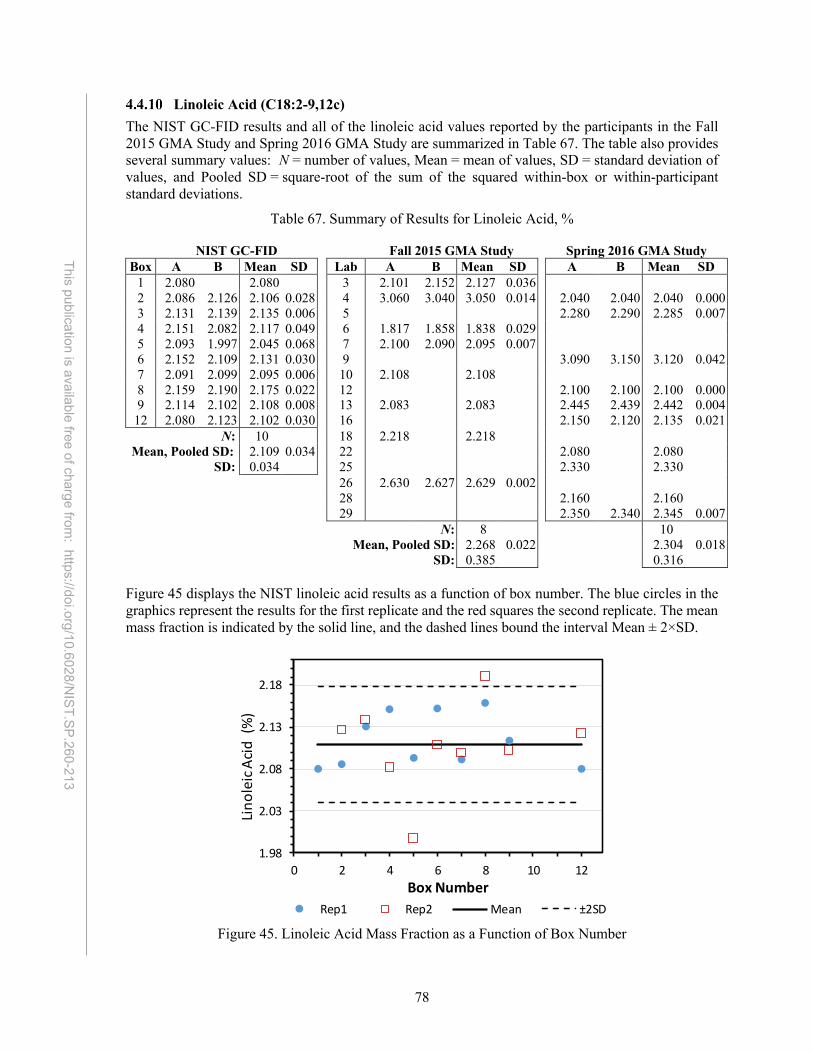
78
This publication is available free of charge from: https://doi.org/10.6028/N
IST.SP.260 -213
Linoleic Acid (C18:2-9,12c) The NIST GC-FID results and all of the linoleic acid values reported by the participants in the Fall 2015 GMA Study and Spring 2016 GMA Study are summarized in Table 67. The table also provides several summary values: N = number of values, Mean = mean of values, SD = standard deviation of values, and Pooled SD = square-root of the sum of the squared within-box or within-participant standard deviations.
Table 67. Summary of Results for Linoleic Acid, %
Figure 45 displays the NIST linoleic acid results as a function of box number. The blue circles in the graphics represent the results for the first replicate and the red squares the second replicate. The mean mass fraction is indicated by the solid line, and the dashed lines bound the interval Mean ± 2×SD.
Figure 45. Linoleic Acid Mass Fraction as a Function of Box Number
1.98
2.03
2.08
2.13
2.18
0 2 4 6 8 10 12
Lino
leic
Aci
d (%
)
Box NumberRep1 Rep2 Mean ±2SD
NIST GC-FID Fall 2015 GMA Study Spring 2016 GMA Study Box A B Mean SD Lab A B Mean SD A B Mean SD
1 2.080 2.080 3 2.101 2.152 2.127 0.036 2 2.086 2.126 2.106 0.028 4 3.060 3.040 3.050 0.014 2.040 2.040 2.040 0.000 3 2.131 2.139 2.135 0.006 5 2.280 2.290 2.285 0.007 4 2.151 2.082 2.117 0.049 6 1.817 1.858 1.838 0.029 5 2.093 1.997 2.045 0.068 7 2.100 2.090 2.095 0.007 6 2.152 2.109 2.131 0.030 9 3.090 3.150 3.120 0.042 7 2.091 2.099 2.095 0.006 10 2.108 2.108 8 2.159 2.190 2.175 0.022 12 2.100 2.100 2.100 0.000 9 2.114 2.102 2.108 0.008 13 2.083 2.083 2.445 2.439 2.442 0.004 12 2.080 2.123 2.102 0.030 16 2.150 2.120 2.135 0.021 N: 10 18 2.218 2.218
Mean, Pooled SD: 2.109 0.034 22 2.080 2.080 SD: 0.034 25 2.330 2.330 26 2.630 2.627 2.629 0.002 28 2.160 2.160 29 2.350 2.340 2.345 0.007
N: 8 10 Mean, Pooled SD: 2.268 0.022 2.304 0.018 SD: 0.385 0.316
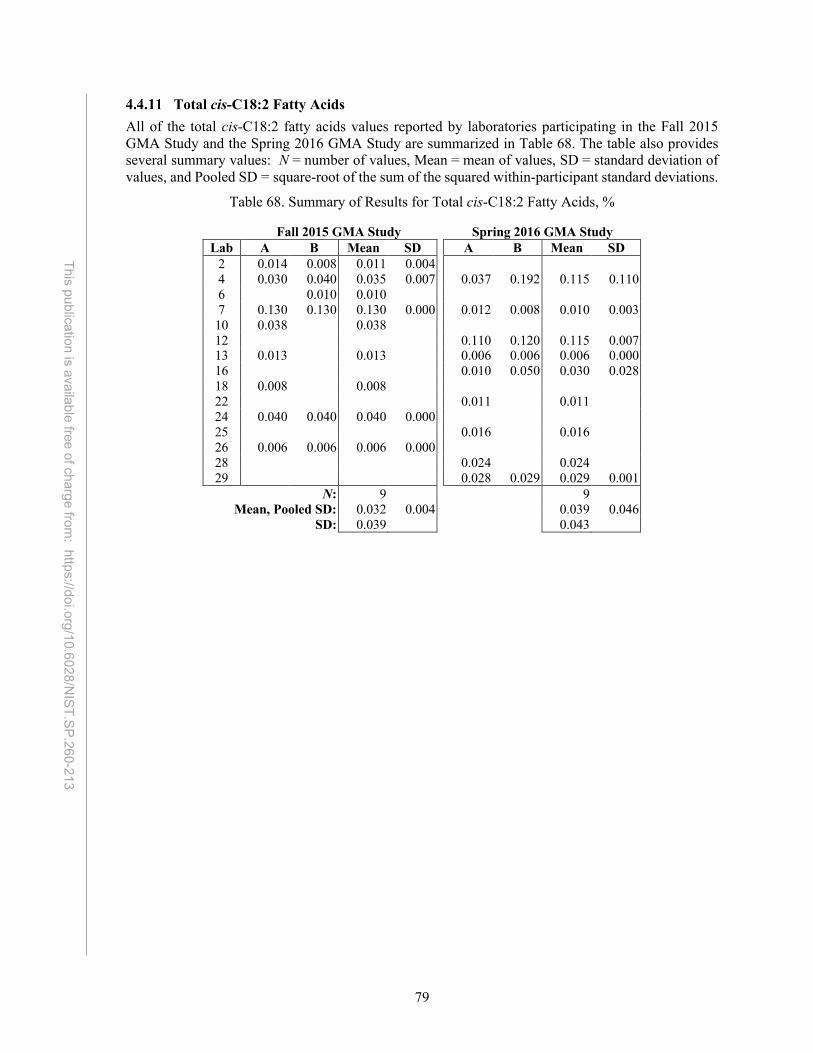
79
This publication is available free of charge from: https://doi.org/10.6028/N
IST.SP.260 -213
Total cis-C18:2 Fatty Acids All of the total cis-C18:2 fatty acids values reported by laboratories participating in the Fall 2015 GMA Study and the Spring 2016 GMA Study are summarized in Table 68. The table also provides several summary values: N = number of values, Mean = mean of values, SD = standard deviation of values, and Pooled SD = square-root of the sum of the squared within-participant standard deviations.
Table 68. Summary of Results for Total cis-C18:2 Fatty Acids, %
Fall 2015 GMA Study Spring 2016 GMA Study Lab A B Mean SD A B Mean SD
2 0.014 0.008 0.011 0.004 4 0.030 0.040 0.035 0.007 0.037 0.192 0.115 0.110 6 0.010 0.010 7 0.130 0.130 0.130 0.000 0.012 0.008 0.010 0.003 10 0.038 0.038 12 0.110 0.120 0.115 0.007 13 0.013 0.013 0.006 0.006 0.006 0.000 16 0.010 0.050 0.030 0.028 18 0.008 0.008 22 0.011 0.011 24 0.040 0.040 0.040 0.000 25 0.016 0.016 26 0.006 0.006 0.006 0.000 28 0.024 0.024 29 0.028 0.029 0.029 0.001
N: 9 9 Mean, Pooled SD: 0.032 0.004 0.039 0.046 SD: 0.039 0.043

80
This publication is available free of charge from: https://doi.org/10.6028/N
IST.SP.260 -213
Total trans-C18:2 Fatty Acids All of the total trans-C18:2 fatty acids values reported by laboratories participating in the Fall 2015 GMA Study and the Spring 2016 GMA Study are summarized in Table 69. The table also provides several summary values: N = number of values, Mean = mean of values, SD = standard deviation of values, and Pooled SD = square-root of the sum of the squared within-participant standard deviations.
Table 69. Summary of Results for Total trans-C18:2 Fatty Acids, %
Fall 2015 GMA Study Spring 2016 GMA Study Lab A B Mean SD A B Mean SD
2 0 0 3 0 0 4 4.440 4.460 0 0.060 0.060 5 <0.01 6 0.012 <0.01 7 0.01 0.010 0.010 0.000 0.015 0.018 0.017 0.002 9 4.000 3.660 10 0.011 0.011 12 0.010 0.010 0.010 0.000 13 <0.01 0 0 16 0.020 0.010 0.015 0.007 18 0.003 0.003 24 0.110 0.050 0.080 0.042 26 0.009 0.015 0.012 0.004 27 4.340 3.940
N: 5 4 Mean, Pooled SD: 0.023 0.025 0.025 0.004 SD: 0.032 0.023

81
This publication is available free of charge from: https://doi.org/10.6028/N
IST.SP.260 -213
γ-Linolenic Acid (C18:3-6,9,12c) All of the γ-linolenic acid values reported by laboratories participating in the Fall 2015 GMA Study and the Spring 2016 GMA Study are summarized in Table 70. The table also provides several summary values: N = number of values, Mean = mean of values, SD = standard deviation of values, and Pooled SD = square-root of the sum of the squared within-participant standard deviations.
Table 70. Summary of Results for γ-Linolenic Acid, %
Fall 2015 GMA Study Spring 2016 GMA Study Lab A B Mean SD A B Mean SD
2 0.006 0.006 3 0.032 0.017 0.025 0.011 5 0.04 0.04 0.040 0.000 6 0.012 0.017 0.015 0.004 7 0.010 0.010 0.010 0.000 0.009 0.007 0.008 0.001 10 0.010 0.010 12 0.01 0.01 0.010 0.000 13 <0.01 0.012 0.006 0.009 0.004 16 <0.01 <0.01 18 0.01 0.01 0.010 0.000 22 <0.01 24 <0.01 <0.01 25 <0.007 26 0.006 0.009 0.008 0.002 27 0.019 0.017 0.018 0.001 28 <0.01
N: 7 5 Mean, Pooled SD: 0.013 0.005 0.015 0.002 SD: 0.007 0.014

82
This publication is available free of charge from: https://doi.org/10.6028/N
IST.SP.260 -213
α-Linolenic Acid (C18:2-9,12c) The NIST GC-FID results and all of the α-linolenic acid values reported by the participants in the Fall 2015 GMA Study and Spring 2016 GMA Study are summarized in Table 71. The table also provides several summary values: N = number of values, Mean = mean of values, SD = standard deviation of values, and Pooled SD = square-root of the sum of the squared within-box or within-participant standard deviations.
Table 71. Summary of Results for α-Linolenic Acid, %
Figure 46 displays the NIST α-linolenic acid results as a function of box number. The blue circles in the graphics represent the results for the first replicate and the red squares the second replicate. The mean mass fraction is indicated by the solid line, and the dashed lines bound the interval Mean ± 2×SD.
NIST GC-FID Fall 2015 GMA Study Spring 2016 GMA Study Box A B Mean SD Lab A B Mean SD A B Mean SD
1 0.219 0.219 2 0.185 0.185 0.185 0.000 2 0.214 0.221 0.218 0.005 3 0.192 0.194 0.193 0.001 3 0.222 0.227 0.225 0.004 4 0.193 0.199 0.196 0.004 4 0.222 0.220 0.221 0.001 5 0.200 0.200 0.200 0.000 5 0.218 0.200 0.209 0.013 6 0.157 0.160 0.159 0.002 6 0.226 0.226 7 0.180 0.180 0.180 0.000 0.189 0.173 0.181 0.011 7 0.219 0.217 0.218 0.001 9 0.340 0.350 0.345 0.007 8 0.224 0.229 0.227 0.004 10 0.192 0.192 9 0.219 0.216 0.218 0.002 12 0.190 0.190 0.190 0.000 12 0.205 0.215 0.210 0.007 13 0.185 0.185 0.196 0.193 0.195 0.002 N: 10 16 0.200 0.200 0.200 0.000
Mean, Pooled SD: 0.219 0.006 18 0.217 0.217 SD: 0.006 22 0.196 0.196 24 0.190 0.190 0.190 0.000 25 0.219 0.219 26 0.217 0.220 0.219 0.002 27 0.263 0.236 0.249 0.019 28 0.202 0.202 29 0.234 0.232 0.233 0.001
N: 10 11 Mean, Pooled SD: 0.197 0.007 0.214 0.005 SD: 0.025 0.046

83
This publication is available free of charge from: https://doi.org/10.6028/N
IST.SP.260 -213
Figure 46. α-Linolenic Acid Mass Fraction as a Function of Box Number
Arachidic Acid (C20:0)
All of the arachidic acid values reported by laboratories participating in the Fall 2015 GMA Study and the Spring 2016 GMA Study are summarized in Table 72. The table also provides several summary values: N = number of values, Mean = mean of values, SD = standard deviation of values, and Pooled SD = square-root of the sum of the squared within-participant standard deviations.
Table 72. Summary of Results for Arachidic Acid, %
Fall 2015 GMA Study Spring 2016 GMA Study Lab A B Mean SD A B Mean SD
2 0.014 0.011 0.013 0.002 3 0.012 0.021 0.017 0.006 4 0.050 0.050 0.015 0.026 0.021 0.008 6 0.017 0.017 0.017 0.000 7 0.010 0.010 0.010 0.000 0.011 0.011 0.011 0.000 10 0.014 0.014 12 0.010 0.020 0.015 0.007 13 0.014 0.014 0.027 0.030 0.029 0.002 16 0.030 0.020 0.014 18 0.015 0.015 0.020 0.020 0.020 0.000 22 0.010 0.010 24 0.020 0.020 0.020 0.000 25 0.015 0.015 26 0.015 0.018 0.017 0.002 27 0.021 0.019 0.020 0.001 28 0.011 0.011 29 0.011 0.012 0.012 0.001
N: 11 10 Mean, Pooled SD: 0.019 0.003 0.016 0.007 SD: 0.011 0.006
0.195
0.205
0.215
0.225
0.235
0 2 4 6 8 10 12
α-Li
nole
nic A
cid
(%)
Box NumberRep1 Rep2 Mean ±2SD

84
This publication is available free of charge from: https://doi.org/10.6028/N
IST.SP.260 -213
Total cis-C20:1 Fatty Acids The NIST GC-FID results and all of the total cis-C20:1 fatty acid values reported by the participants in the Fall 2015 GMA Study and Spring 2016 GMA Study are summarized in Table 73. The table also provides several summary values: N = number of values, Mean = mean of values, SD = standard deviation of values, and Pooled SD = square-root of the sum of the squared within-box or within-participant standard deviations.
Table 73. Summary of Results for Total cis-C20:1 Fatty Acids, %
Figure 47 displays the NIST total cis-C20:1 fatty acid results as a function of box number. The blue circles in the graphics represent the results for the first replicate and the red squares the second replicate. The mean mass fraction is indicated by the solid line, and the dashed lines bound the interval Mean ± 2×SD.
NIST GC-FID Fall 2015 GMA Study Spring 2016 GMA Study Box A B Mean SD Lab A B Mean SD A B Mean SD
1 0.037 0.037 2 0.042 0.046 0.044 0.003 2 0.046 0.035 0.041 0.008 3 0.043 0.042 0.043 0.001 3 0.040 0.043 0.042 0.002 4 0.340 0.330 0.040 0.050 0.045 0.007 4 0.041 0.036 0.039 0.004 5 0.060 0.060 0.060 0.000 5 0.034 0.039 0.037 0.004 6 0.037 0.038 0.038 0.001 6 0.043 0.039 0.041 0.003 7 0.050 0.050 0.050 0.000 0.045 0.042 0.044 0.002 7 0.035 0.036 0.036 0.001 10 0.041 0.041 8 0.035 0.031 0.033 0.003 12 0.050 0.050 0.050 0.000 9 0.040 0.033 0.037 0.005 13 0.040 0.040 0.059 0.056 0.058 0.002 12 0.033 0.045 0.039 0.008 16 0.050 0.050 0.050 0.000 N: 10 18 0.039 0.039 0.040 0.040 0.040 0.000
Mean, Pooled SD: 0.038 0.005 22 0.039 0.039 SD: 0.003 24 0.050 0.040 0.045 0.007 25 0.046 0.046 26 0.549 0.561 0.555 0.008 27 0.055 0.050 0.052 0.003 28 0.040 0.040 29 0.044 0.043 0.044 0.001
N: 11 11 Mean, Pooled SD: 0.116 0.005 0.047 0.003 SD: 0.170 0.007

85
This publication is available free of charge from: https://doi.org/10.6028/N
IST.SP.260 -213
Figure 47. Total cis-C20:1 Mass Fraction as a Function of Box Number
Eicosadienoic Acid (C20:2-11,14c)
All of the eicosadienoic acid values reported by laboratories participating in the Fall 2015 GMA Study and the Spring 2016 GMA Study are summarized in Table 74. The table also provides several summary values: N = number of values, Mean = mean of values, SD = standard deviation of values, and Pooled SD = square-root of the sum of the squared within-participant standard deviations.
Table 74. Summary of Results for Eicosadienoic Acid, %
Fall 2015 GMA Study Spring 2016 GMA Study Lab A B Mean SD A B Mean SD
2 0 0 3 0.023 0.025 0.024 0.001 4 0.370 0.390 0.020 0.020 0.020 0.000 6 <0.01 <0.01 7 <0.01 <0.01 0 0 9 0.28 0.23 10 <0.005 12 <0.01 13 <0.01 0 16 <0.01 18 0.011 0.011 22 <0.01 24 0.020 0.020 0.020 0.000 25 <0.007 26 0.275 0.272 27 0.006 0.007 0.006 0.000 28 <0.01 29 <0.01 <0.01
N: 4 1 Mean, Pooled SD: 0.015 0.001 0.020 0.000
SD: 0.008
0.028
0.032
0.036
0.040
0.044
0.048
0 2 4 6 8 10 12
Toat
l cis
-C20
:1 (%
)
Box NumberRep1 Rep2 Mean ±2SD
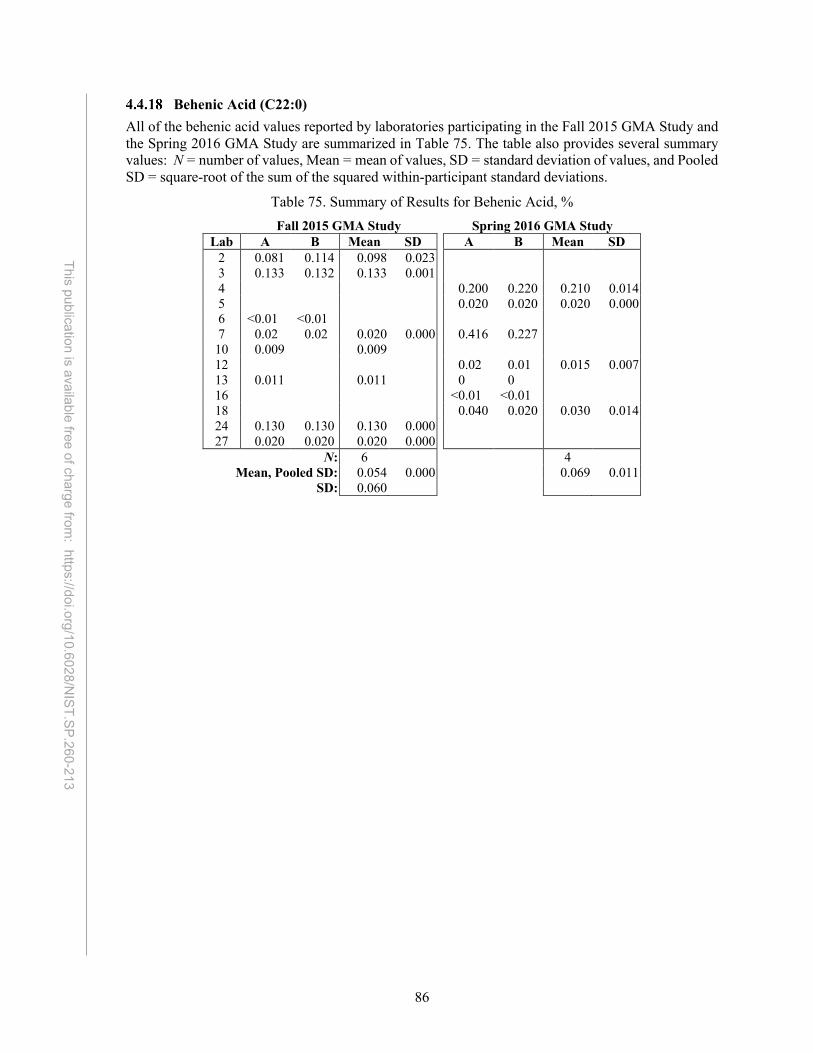
86
This publication is available free of charge from: https://doi.org/10.6028/N
IST.SP.260 -213
Behenic Acid (C22:0) All of the behenic acid values reported by laboratories participating in the Fall 2015 GMA Study and the Spring 2016 GMA Study are summarized in Table 75. The table also provides several summary values: N = number of values, Mean = mean of values, SD = standard deviation of values, and Pooled SD = square-root of the sum of the squared within-participant standard deviations.
Table 75. Summary of Results for Behenic Acid, %
Fall 2015 GMA Study Spring 2016 GMA Study Lab A B Mean SD A B Mean SD
2 0.081 0.114 0.098 0.023 3 0.133 0.132 0.133 0.001 4 0.200 0.220 0.210 0.014 5 0.020 0.020 0.020 0.000 6 <0.01 <0.01 7 0.02 0.02 0.020 0.000 0.416 0.227 10 0.009 0.009 12 0.02 0.01 0.015 0.007 13 0.011 0.011 0 0 16 <0.01 <0.01 18 0.040 0.020 0.030 0.014 24 0.130 0.130 0.130 0.000 27 0.020 0.020 0.020 0.000
N: 6 4 Mean, Pooled SD: 0.054 0.000 0.069 0.011
SD: 0.060
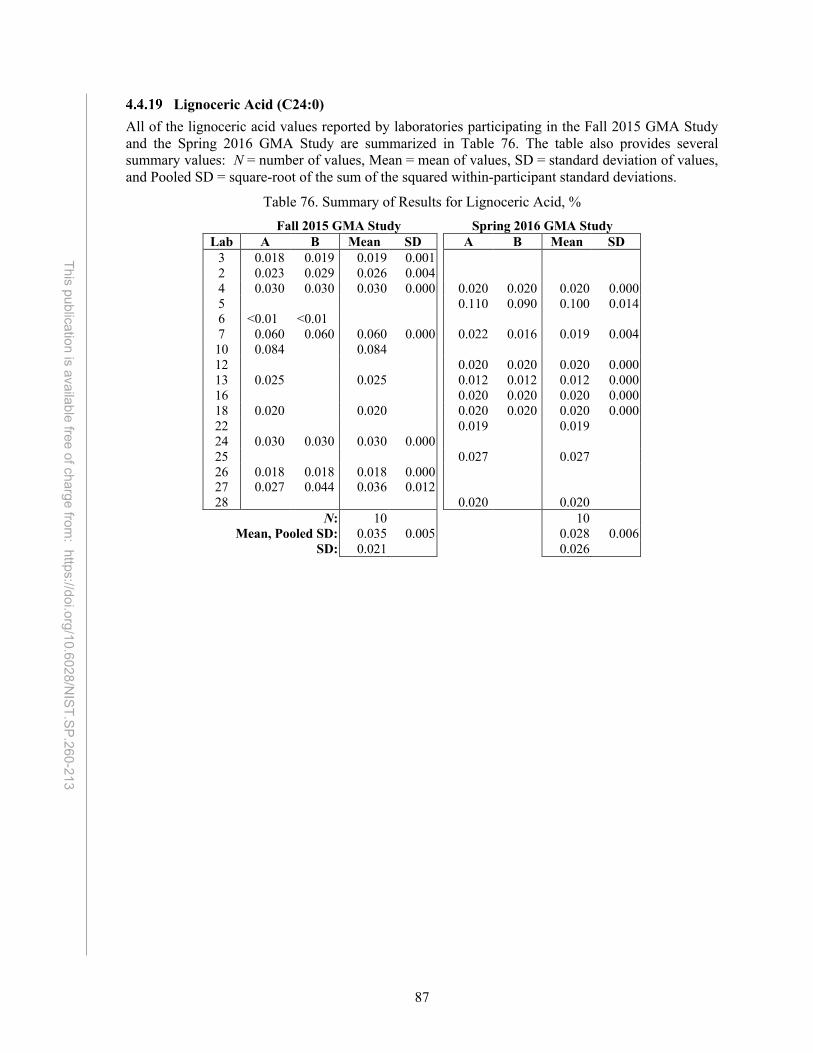
87
This publication is available free of charge from: https://doi.org/10.6028/N
IST.SP.260 -213
Lignoceric Acid (C24:0) All of the lignoceric acid values reported by laboratories participating in the Fall 2015 GMA Study and the Spring 2016 GMA Study are summarized in Table 76. The table also provides several summary values: N = number of values, Mean = mean of values, SD = standard deviation of values, and Pooled SD = square-root of the sum of the squared within-participant standard deviations.
Table 76. Summary of Results for Lignoceric Acid, %
Fall 2015 GMA Study Spring 2016 GMA Study Lab A B Mean SD A B Mean SD
3 0.018 0.019 0.019 0.001 2 0.023 0.029 0.026 0.004 4 0.030 0.030 0.030 0.000 0.020 0.020 0.020 0.000 5 0.110 0.090 0.100 0.014 6 <0.01 <0.01 7 0.060 0.060 0.060 0.000 0.022 0.016 0.019 0.004 10 0.084 0.084 12 0.020 0.020 0.020 0.000 13 0.025 0.025 0.012 0.012 0.012 0.000 16 0.020 0.020 0.020 0.000 18 0.020 0.020 0.020 0.020 0.020 0.000 22 0.019 0.019 24 0.030 0.030 0.030 0.000 25 0.027 0.027 26 0.018 0.018 0.018 0.000 27 0.027 0.044 0.036 0.012 28 0.020 0.020
N: 10 10 Mean, Pooled SD: 0.035 0.005 0.028 0.006 SD: 0.021 0.026

88
This publication is available free of charge from: https://doi.org/10.6028/N
IST.SP.260 -213
Total ω-3 Fatty Acids All of the total ω-3 fatty acid values reported by laboratories participating in the Fall 2015 GMA Study and the Spring 2016 GMA Study are summarized in Table 77. The table also provides several summary values: N = number of values, Mean = mean of values, SD = standard deviation of values, and Pooled SD = square-root of the sum of the squared within-participant standard deviations.
Table 77. Summary of Results for Total ω-3 Fatty Acids, %
Fall 2015 GMA Study Spring 2016 GMA Study Lab A B Mean SD A B Mean SD
2 0.20 0.20 0.20 0.00 3 0.19 0.24 0.22 0.03 4 0.34 0.33 0.34 0.01 0.24 0.29 0.27 0.04 5 0.33 0.32 0.33 0.00 0.25 0.25 0.25 0.00 6 0.17 0.17 0.17 0.00 7 0.19 0.19 0.19 0.00 0.20 0.18 0.19 0.01 9 0.34 0.35 0.35 0.01 10 0.2 0.20 12 0.19 0.19 0.19 0.00 13 0.195 0.20 2.649 2.717 16 0.2 0.2 0.20 0.00 18 0.2 0.2 0.20 0.00 22 0.20 0.20 24 0.19 0.19 0.19 0.00 0.219 0.22 25 26 1.27 1.19 28 0.214 0.21 29 0.246 0.232 0.24 0.01
N: 9 11 Mean, Pooled SD: 0.22 0.01 0.23 0.01
SD: 0.06 0.05

89
This publication is available free of charge from: https://doi.org/10.6028/N
IST.SP.260 -213
Total ω-6 Fatty Acids All of the total ω-6 fatty acid values reported by laboratories participating in the Fall 2015 GMA Study and the Spring 2016 GMA Study are summarized in Table 78. The table also provides several summary values: N = number of values, Mean = mean of values, SD = standard deviation of values, and Pooled SD = square-root of the sum of the squared within-participant standard deviations.
Table 78. Summary of Results for Total ω-6 Fatty Acids, %
Fall 2015 GMA Study Spring 2016 GMA Study Lab A B Mean SD A B Mean SD
2 2.37 2.34 2.36 0.02 3 2.16 2.19 2.18 0.03 4 3.43 3.43 3.43 0.00 2.07 2.20 2.14 0.09 5 2.08 2.09 2.09 0.01 6 1.83 1.87 1.85 0.03 7 2.11 2.10 2.11 0.01 2.37 2.12 2.25 0.18 9 3.51 3.50 3.51 0.01 10 2.12 2.12 12 2.12 2.13 2.13 0.01 13 2.08 2.08 2.45 2.45 2.45 0.01 16 2.16 2.12 2.14 0.03 18 2.03 2.00 2.02 0.02 22 2.08 2.08 24 2.16 2.15 2.16 0.01 25 2.33 2.33 26 2.92 2.92 2.92 0.00 28 2.16 2.16 29 2.35 2.34 2.35 0.01
N: 10 11 Mean, Pooled SD: 2.33 0.02 2.32 0.07
SD: 0.48 0.41

90
This publication is available free of charge from: https://doi.org/10.6028/N
IST.SP.260 -213
Saturated Fat All of the saturated fat values reported by laboratories participating in the Fall 2015 GMA Study and the Spring 2016 GMA Study are summarized in Table 79. The table also provides several summary values: N = number of values, Mean = mean of values, SD = standard deviation of values, and Pooled SD = square-root of the sum of the squared within-participant standard deviations.
Table 79. Summary of Results for Saturated Fat, %
Fall 2015 GMA Study Spring 2016 GMA Study Lab A B Mean SD A B Mean SD
2 3.84 3.72 3.78 0.08 3 3.44 3.49 3.46 0.03 4 4.88 4.82 4.85 0.04 3.46 3.46 3.46 0.00 5 3.23 3.25 3.24 0.01 3.20 3.23 3.22 0.02 6 2.91 2.97 2.94 0.04 7 3.57 3.50 3.54 0.05 4.23 3.63 3.93 0.42 9 4.72 4.79 4.76 0.05 10 3.32 3.32 12 3.44 3.48 3.46 0.03 13 3.17 3.17 3.81 3.784 3.80 0.02 16 3.45 3.36 3.41 0.06 18 3.29 3.29 3.09 3.03 3.06 0.04 22 3.45 3.45 24 3.57 3.49 3.53 0.06 25 3.58 3.58 26 4.25 4.33 4.29 0.06 27 4.19 3.89 4.04 0.21 28 3.36 3.36 29 3.71 3.73 3.72 0.01
N: 12 12 Mean, Pooled SD: 3.62 0.09 3.60 0.15
SD: 0.54 0.44

91
This publication is available free of charge from: https://doi.org/10.6028/N
IST.SP.260 -213
cis-Monounsaturated Fat All of the cis-monounsaturated fat values reported by laboratories participating in the Fall 2015 GMA Study and the Spring 2016 GMA Study are summarized in Table 80. The table also provides several summary values: N = number of values, Mean = mean of values, SD = standard deviation of values, and Pooled SD = square-root of the sum of the squared within-participant standard deviations.
Table 80. Summary of Results for cis-Monosaturated Fat, %
Fall 2015 GMA Study Spring 2016 GMA Study Lab A B Mean SD A B Mean SD
2 20.99 20.66 20.83 0.23 3 17.47 17.74 17.61 0.19 4 22.23 22.07 22.15 0.11 17.38 17.33 17.36 0.04 5 14.90 15.00 14.95 0.07 16.55 16.67 16.61 0.08 6 13.19 13.47 13.33 0.20 7 14.87 14.81 14.84 0.04 21.57 18.97 20.27 1.84 9 22.36 22.53 22.45 0.12 10 15.04 15.04 12 15.18 15.21 15.20 0.02 13 14.70 14.70 20.65 20.61 20.63 0.03 16 18.09 17.77 17.93 0.23 18 17.95 17.95 13.81 13.62 13.72 0.13 22 14.50 14.50 24 17.18 17.03 17.11 0.11 25 16.50 16.50 26 21.68 21.68 21.68 0.00 27 17.77 16.39 17.08 0.98 28 17.80 17.80 29 16.60 16.50 16.55 0.07
N: 12 12 Mean, Pooled SD: 17.27 0.35 17.46 0.62
SD: 2.94 2.59

92
This publication is available free of charge from: https://doi.org/10.6028/N
IST.SP.260 -213
cis-Polyunsaturated Fat All of the cis-polyunsaturated fat values reported by laboratories participating in the Fall 2015 GMA Study and the Spring 2016 GMA Study are summarized in Table 81. The table also provides several summary values: N = number of values, Mean = mean of values, SD = standard deviation of values, and Pooled SD = square-root of the sum of the squared within-participant standard deviations.
Table 81. Summary of Results for cis-Polyunsaturated Fat, %
Fall 2015 GMA Study Spring 2016 GMA Study Lab A B Mean SD A B Mean SD
2 2.57 2.54 2.56 0.02 3 2.39 2.48 2.44 0.06 4 3.80 3.93 3.87 0.09 2.30 2.43 2.37 0.09 5 2.41 2.42 2.42 0.01 2.54 2.55 2.55 0.01 6 1.99 2.04 2.02 0.03 7 2.35 2.33 2.34 0.01 2.56 2.29 2.43 0.19 9 3.70 3.73 3.72 0.02 10 2.32 2.32 12 2.35 2.37 2.36 0.01 13 2.28 2.28 5.141 5.203 5.17 0.04 16 2.38 2.34 2.36 0.03 18 2.35 2.35 2.23 2.2 2.22 0.02 22 2.29 2.29 24 2.38 2.38 2.38 0.00 25 2.55 2.55 26 4.21 4.14 4.17 0.05 27 3.02 2.77 2.90 0.18 28 2.37 2.37 29 2.60 2.58 2.59 0.01
N: 12 12 Mean, Pooled SD: 2.67 0.07 2.75 0.07
SD: 0.67 0.86

93
This publication is available free of charge from: https://doi.org/10.6028/N
IST.SP.260 -213
Total trans-Fat All of the total trans-fat values reported by laboratories participating in the Fall 2015 GMA Study and the Spring 2016 GMA Study are summarized in Table 82. The table also provides several summary values: N = number of values, Mean = mean of values, SD = standard deviation of values, and Pooled SD = square-root of the sum of the squared within-participant standard deviations.
Table 82. Summary of Results for Total trans-Fat, %
Fall 2015 GMA Study Spring 2016 GMA Study Lab A B Mean SD A B Mean SD
2 0.040 0.040 0.040 0.000 3 0.018 0.019 0.019 0.001 4 4.480 4.570 0.050 0.260 0.155 0.148 5 <0.01 <0.01 6 0.020 0.010 0.015 0.007 7 0.150 0.140 0.145 0.007 0.060 0.050 0.055 0.007 9 4.000 3.660 10 0.090 0.090 12 0.120 0.130 0.125 0.007 13 0.013 0.013 0.039 0.039 0.039 0.000 16 0.060 0.070 0.065 0.007 18 0.060 0.060 0.030 0.030 0.030 0.000 22 0.026 0.000 0.013 0.018 24 0.170 0.120 0.145 0.035 25 26 0.045 0.048 0.047 0.002 27 4.350 3.650 28 0.024 0.024 29 0.028 0.029 0.029 0.001
N: 9 9 Mean, Pooled SD: 0.064 0.015 0.059 0.053
SD: 0.052 0.049

94
This publication is available free of charge from: https://doi.org/10.6028/N
IST.SP.260 -213
Value Assignment As described in Section 3.3, available data for each measurand to provide an estimate of the mass fraction present in SRM 2386 where x is the mean and U95(x) is the 95% confidence interval. The summary of these estimates for fatty acids is provided in Table 83, along with a summary of the methods used to arrive at these estimates. A blank in the table indicates that no data from that method was available for determination of the estimate.
Table 83. Summary of Estimates for Fatty Acids in SRM 2386, %
Based on
Analyte x U95(x) NIST Methods
Fall 2015 GMA Methodsa
Spring 2016 GMA Methodsa
C12:0 Lauric Acid 0.0353 0.0493b GC-FID GC-FID GC-FID C14:0 Myristic Acid 0.0143 0.0038 GC-FID GC-FID C16:0 Palmitic Acid 3.277 0.1668 GC-FID GC-FID GC-FID C16:1-9c Palmitoleic Acid 1.1862 0.0361 GC-FID GC-FID GC-FID C18:0 Stearic Acid 0.1053 0.0059 GC-FID GC-FID GC-FID C18:1-9c Oleic Acid 12.9468 0.5322 GC-FID GC-FID GC-FID C18:1-11c Vaccenic Acid 1.2428 0.1146 GC-FID GC-FID GC-FID Total cis-C18:1 15.9919 2.3364 GC-FID GC-FID GC-FID Total trans-C18:1 0.0169 0.0205b GC-FID GC-FID C18:2-9,12c Linoleic Acid 2.2193 0.0705 GC-FID GC-FID GC-FID Total cis-C18:2 2.2192 0.0609 GC-FID GC-FID C18:3-9,12,15c α-Linolenic Acid 0.2144 0.0222 GC-FID GC-FID GC-FID C18:3-6,9,12c γ-Linolenic Acid 0.0105 0.0049 GC-FID GC-FID C20:0 Arachidic Acid 0.0168 0.0035 GC-FID GC-FID Total cis-C20:1 0.0435 0.0045 GC-FID GC-FID GC-FID C20:2-11,14c Eicosadienoic Acid 0.0231 0.1917b GC-FID GC-FID C24:0 Lignoceric Acid 0.0255 0.0085 GC-FID GC-FID Saturated Fat 3.6558 0.1890 GC-FID GC-FID cis-Monounsaturated Fat 17.9171 1.1130 GC-FID GC-FID cis-Polyunsaturated Fat 2.5194 0.2362 GC-FID GC-FID Total trans-Fat 0.0434 0.0270 GC-FID GC-FID Total Omega-3 Fatty Acids 0.2181 0.0222 GC-FID GC-FID Total Omega-6 Fatty Acids 2.2604 0.1607 GC-FID GC-FID
a Not all laboratories reported methods used. GC-FID Gas Chromatography with Flame Ionization Detection b The expanded uncertainty is larger than the value, indicating a large level of variability. Any interval for
the value should be truncated at zero.

95
This publication is available free of charge from: https://doi.org/10.6028/N
IST.SP.260 -213
4.5 Proximates Results for proximates provided by the Fall 2015 GMA Study were provided on an as-received basis but converted to a dry-mass basis for the Certificate of Analysis (COA), except ash.
Total Fat (Sum of Fatty Acids as Triglycerides) All of the total fat values reported by laboratories participating in the Fall 2015 GMA Study are summarized in Table 84. The table also provides several summary values: N = number of values, Mean = mean of values, SD = standard deviation of values, and Pooled SD = square-root of the sum of the squared within-participant standard deviations.
Table 84. Summary of Results for Total Fat, %
Lab A B Mean SD Method 2 28.18 28.69 28.44 0.36 Sum of fatty acids as triglycerides 3 24.41 24.83 24.62 0.30 Sum of fatty acids as triglycerides 4 35.39 35.39 35.39 0.00 Sum of fatty acids as triglycerides 5 20.50 20.70 20.60 0.14 Sum of fatty acids as triglycerides 6 31.89 32.02 31.96 0.09 Sum of fatty acids as triglycerides 7 35.90 35.75 35.83 0.11 Sum of fatty acids as triglycerides 18 24.80 24.80 Sum of fatty acids as triglycerides 24 24.41 24.23 24.32 0.13 Sum of fatty acids as triglycerides 25 29.96 29.78 29.87 0.13 Sum of fatty acids as triglycerides 26 31.93 31.63 31.78 0.21 Sum of fatty acids as triglycerides 27 30.67 28.24 29.46 1.72 Sum of fatty acids as triglycerides
N: 11 Mean, Pooled SD: 28.82 0.57
SD: 2.92
Ash All of the ash values reported by laboratories participating in the Fall 2015 GMA Study are summarized in Table 85. The table also provides several summary values: N = number of values, Mean = mean of values, SD = standard deviation of values, and Pooled SD = square-root of the sum of the squared within-participant standard deviations.
Table 85. Summary of Results for Ash, %
Lab A B Mean SD Method 2 7.16 7.16 7.16 0.00 Weight loss 3 6.51 6.85 6.68 0.24 Weight loss 4 5.80 5.71 5.76 0.06 Weight loss 5 7.31 7.45 7.38 0.10 Weight loss 6 7.54 7.55 7.55 0.01 Weight loss 7 14.10 14.06 14.08 0.03 Weight loss 10 15.20 12.10 13.65 2.19 not reported 13 13.40 13.40 not reported 16 5.90 6.10 6.00 0.14 not reported 18 6.79 6.79 Weight loss 24 7.68 7.70 7.69 0.01 Weight loss 25 8.09 8.09 8.09 0.00 Weight loss 26 8.20 8.35 8.28 0.11 Weight loss 27 7.19 7.18 7.19 0.01 Weight loss
N: 14 Mean, Pooled SD: 8.55 0.64
SD: 1.54

96
This publication is available free of charge from: https://doi.org/10.6028/N
IST.SP.260 -213
Protein All of the protein values reported by laboratories participating in the Fall 2015 GMA Study are summarized in Table 86. The table also provides several summary values: N = number of values, Mean = mean of values, SD = standard deviation of values, and Pooled SD = square-root of the sum of the squared within-participant standard deviations.
Table 86. Summary of Results for Protein, %
Lab A B Mean SD Method 2 9.94 9.01 9.48 0.66 Kjeldahl, factor 6.25 3 9.02 9.34 9.18 0.23 Combustion - Leco 4 9.04 8.75 8.90 0.21 Kjeldahl, factor 6.25 5 9.11 9.02 9.07 0.06 Kjeldahl 6 10.09 9.99 10.04 0.07 Combustion - Leco 7 9.79 9.95 9.87 0.11 Not reported 10 9.72 9.72 Not reported 11 9.61 9.61 Not reported 13 10.40 10.40 Not reported 16 9.10 9.10 9.10 0.00 Kjeldahl 18 9.73 9.73 Combustion - Leco; Kjeldahl, factor 6.25 24 9.55 9.38 9.47 0.12 Kjeldahl 25 8.17 8.17 8.17 0.00 Kjeldahl 26 9.64 9.70 9.67 0.04 Combustion - Leco 27 9.42 9.48 9.45 0.04 Combustion - Leco
N: 14 Mean, Pooled SD: 9.46 0.24
SD: 0.29
Carbohydrates All of the carbohydrate values reported by laboratories participating in the Fall 2015 GMA Study are summarized in Table 87. The table also provides several summary values: N = number of values, Mean = mean of values, SD = standard deviation of values, and Pooled SD = square-root of the sum of the squared within-participant standard deviations.
Table 87. Summary of Results for Carbohydrates, %
Lab A B Mean SD Method 2 47.96 49.32 48.64 0.96 Solids-(protein+fat+ash) 3 54.93 54.51 54.72 0.30 Solids-(protein+fat+ash) 4 45.80 46.38 46.09 0.41 Solids-(protein+fat+ash) 5 54.40 54.40 54.40 0.00 Solids-(protein+fat+ash) 7 48.71 48.76 48.74 0.04 Solids-(protein+fat+ash) 10 45.90 45.90 not reported 11 38.90 38.90 not reported 13 39.30 39.30 not reported 18 51.80 51.80 Solids-(protein+fat+ash) 24 41.69 41.69 41.69 0.00 Solids-(protein+fat+ash) 25 29.41 29.57 29.49 0.11 Solids-(protein+fat+ash) 26 45.75 45.79 45.77 0.03 Solids-(protein+fat+ash) 27 49.33 51.69 50.51 1.67 Solids-(protein+fat+ash)
N: 13 Mean, Pooled SD: 45.84 0.67
SD: 1.99
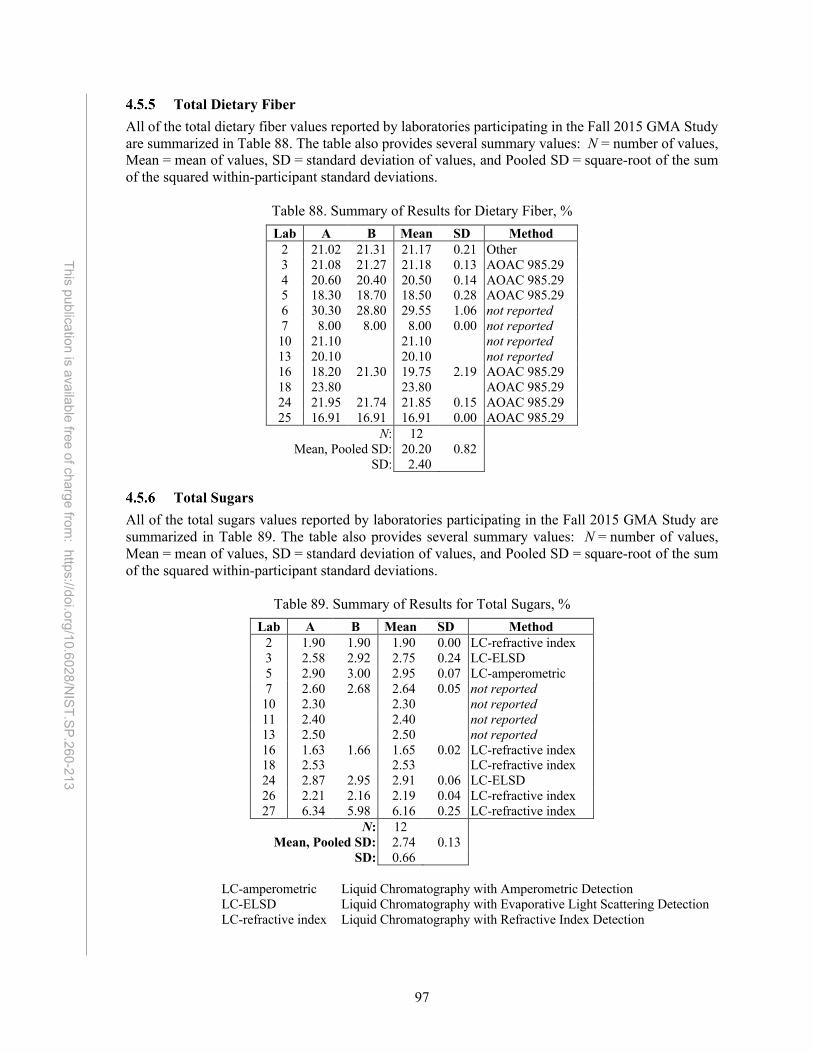
97
This publication is available free of charge from: https://doi.org/10.6028/N
IST.SP.260 -213
Total Dietary Fiber All of the total dietary fiber values reported by laboratories participating in the Fall 2015 GMA Study are summarized in Table 88. The table also provides several summary values: N = number of values, Mean = mean of values, SD = standard deviation of values, and Pooled SD = square-root of the sum of the squared within-participant standard deviations.
Table 88. Summary of Results for Dietary Fiber, %
Lab A B Mean SD Method 2 21.02 21.31 21.17 0.21 Other 3 21.08 21.27 21.18 0.13 AOAC 985.29 4 20.60 20.40 20.50 0.14 AOAC 985.29 5 18.30 18.70 18.50 0.28 AOAC 985.29 6 30.30 28.80 29.55 1.06 not reported 7 8.00 8.00 8.00 0.00 not reported 10 21.10 21.10 not reported 13 20.10 20.10 not reported 16 18.20 21.30 19.75 2.19 AOAC 985.29 18 23.80 23.80 AOAC 985.29 24 21.95 21.74 21.85 0.15 AOAC 985.29 25 16.91 16.91 16.91 0.00 AOAC 985.29
N: 12 Mean, Pooled SD: 20.20 0.82
SD: 2.40
Total Sugars All of the total sugars values reported by laboratories participating in the Fall 2015 GMA Study are summarized in Table 89. The table also provides several summary values: N = number of values, Mean = mean of values, SD = standard deviation of values, and Pooled SD = square-root of the sum of the squared within-participant standard deviations.
Table 89. Summary of Results for Total Sugars, %
Lab A B Mean SD Method 2 1.90 1.90 1.90 0.00 LC-refractive index 3 2.58 2.92 2.75 0.24 LC-ELSD 5 2.90 3.00 2.95 0.07 LC-amperometric 7 2.60 2.68 2.64 0.05 not reported 10 2.30 2.30 not reported 11 2.40 2.40 not reported 13 2.50 2.50 not reported 16 1.63 1.66 1.65 0.02 LC-refractive index 18 2.53 2.53 LC-refractive index 24 2.87 2.95 2.91 0.06 LC-ELSD 26 2.21 2.16 2.19 0.04 LC-refractive index 27 6.34 5.98 6.16 0.25 LC-refractive index
N: 12 Mean, Pooled SD: 2.74 0.13
SD: 0.66 LC-amperometric Liquid Chromatography with Amperometric Detection LC-ELSD Liquid Chromatography with Evaporative Light Scattering Detection LC-refractive index Liquid Chromatography with Refractive Index Detection

98
This publication is available free of charge from: https://doi.org/10.6028/N
IST.SP.260 -213
Calories All of the calorie values reported by laboratories participating in the Fall 2015 GMA Study are summarized in Table 90. The table also provides several summary values: N = number of values, Mean = mean of values, SD = standard deviation of values, and Pooled SD = square-root of the sum of the squared within-participant standard deviations.
Table 90. Summary of Results for Calories, kcal/100 g
Lab A B Mean SD Method 2 487.0 487.0 487.0 0.0 9(fat)+4(protein)+4(carbohydrate) 3 475.0 479.0 477.0 2.8 9(fat)+4(protein)+4(carbohydrate) 4 538.0 539.0 538.5 0.7 9(fat)+4(protein)+4(carbohydrate) 5 449.0 449.0 449.0 0.0 9(fat)+4(protein)+4(carbohydrate) 7 431.0 430.0 430.5 0.7 9(fat)+4(protein)+4(carbohydrate) 10 441.0 441.0 not reported 11 508.0 508.0 not reported 13 400.0 400.0 not reported 18 469.0 469.0 9(fat)+4(protein)+4(carbohydrate) 24 518.0 520.0 519.0 1.4 9(fat)+4(protein)+4(carbohydrate) 25 420.0 419.0 419.5 0.7 9(fat)+4(protein)+4(carbohydrate) 26 508.9 506.6 507.8 1.6 9(fat)+4(protein)+4(carbohydrate) 27 511.0 499.0 505.0 8.5 9(fat)+4(protein)+4(carbohydrate)
N: 13 Mean, Pooled SD: 473.2 3.1
SD: 23.6
Value Assignment As described in 3.3, available data for each measurand to provide an estimate of the mass fraction present in SRM 2386 where x is the mean and U95(x) is the 95% confidence interval. The summary of these estimates for proximates is provided in Table 91, along with a summary of the methods used to arrive at these estimates. A blank in the table indicates that no data from that method was available for determination of the estimate.
Table 91. Summary of Estimates for Proximates in SRM 2386
Based on Analyte x U95(x) Units Fall 2015 GMA Methodsa
Ash 7.46 1.42 % Weight loss on drying Protein 9.96 0.37 % Kjeldahl, Leco Combustion (Factor of 6.25) Fat 30.95 3.64 % Sum of fatty acids as triglycerides Carbohydrates 48.43 4.39 % Calculation [Solids-(protein+fat+ash)] Total Dietary Fiber 21.86 2.64 % AOAC 985.29 Total Sugars 2.64 0.51 % LC-RI, LC-ELSD, LC-AMP Calories 501.26 30.69 kcal/100 g Calculation [9(fat)+4(protein)+4(carbohydrate)]
a Not all laboratories reported methods used. LC-RI Liquid Chromatography with Refractive Index Detection LC-ELSD Liquid Chromatography with Evaporative Light Scattering Detection LC-AMP Liquid Chromatography with Amperometric Detection

99
This publication is available free of charge from: https://doi.org/10.6028/N
IST.SP.260 -213
4.6 Amino Acids Results for amino acids provided by the Fall 2015 GMA Study were provided on an as-received basis but converted to a dry-mass basis for the Certificate of Analysis (COA). All participants who reported method information for amino acids used liquid chromatography following hydrolysis and derivatization. Some laboratories did not report the method used.
Fall 2015 GMA Study All of the amino acid values reported by laboratories participating in the Fall 2015 GMA Study are summarized in Table 92. The table also provides several summary values: N = number of values, Mean = mean of values, SD = standard deviation of values, and Pooled SD = square-root of the sum of the squared within-participant standard deviations.
Table 92. Summary of Results for Amino Acids, %
Alanine Arginine Aspartic Acid Lab A B Mean SD A B Mean SD A B Mean SD
3 0.402 0.408 0.405 0.004 0.360 0.380 0.370 0.014 0.676 0.685 0.681 0.006 5 0.460 0.470 0.465 0.007 0.367 0.371 0.369 0.003 0.770 0.780 0.775 0.007 7 0.494 0.495 0.495 0.001 0.397 0.408 0.403 0.008 0.846 0.833 0.840 0.009 10 0.468 0.468 0.451 0.451 0.787 0.787 13 0.490 0.490 0.500 0.500 0.820 0.820
N: 5 5 5 Mean, Pooled SD: 0.465 0.005 0.419 0.009 0.780 0.008
SD: 0.036 0.056 0.061
Cystine Glutamic Acid Glycine Lab A B Mean SD A B Mean SD A B Mean SD
3 0.926 0.941 0.934 0.011 0.357 0.367 0.362 0.007 5 1.030 1.050 1.040 0.014 0.400 0.420 0.410 0.014 7 0.093 0.080 0.087 0.009 1.150 1.141 1.146 0.006 0.454 0.459 0.457 0.004 10 0.113 0.113 1.080 1.080 0.432 0.432 13 0.080 0.080 1.120 1.120 0.420 0.420
N: 3 5 5 Mean, Pooled SD: 0.093 0.009 1.064 0.011 0.416 0.009
SD: 0.017 0.083 0.035
Histidine Isolucine Leucine Lab A B Mean SD A B Mean SD A B Mean SD
3 0.135 0.142 0.139 0.005 0.210 0.212 0.211 0.001 0.470 0.475 0.473 0.004 5 0.180 0.190 0.185 0.007 0.260 0.300 0.280 0.028 0.550 0.580 0.565 0.021 7 0.233 0.223 0.228 0.007 0.374 0.367 0.371 0.005 0.613 0.613 0.613 0.000 10 0.171 0.171 0.370 0.370 0.609 0.609 13 0.200 0.200 0.410 0.410 0.670 0.670
N: 5 5 5 Mean, Pooled SD: 0.185 0.006 0.328 0.017 0.586 0.012
SD: 0.033 0.081 0.074

100
This publication is available free of charge from: https://doi.org/10.6028/N
IST.SP.260 -213
Lysine Methionine Phenylalanine Lab A B Mean SD A B Mean SD A B Mean SD
3 0.287 0.299 0.293 0.008 0.105 0.102 0.104 0.002 0.278 0.279 0.279 0.001 5 0.440 0.460 0.450 0.014 0.310 0.330 0.320 0.014 7 0.641 0.535 0.588 0.075 0.172 0.169 0.171 0.002 0.368 0.354 0.361 0.010 10 0.439 0.439 0.134 0.134 0.350 0.350 13 0.530 0.530 0.170 0.170 0.400 0.400
N: 5 4 5 Mean, Pooled SD: 0.460 0.044 0.145 0.002 0.342 0.010
SD: 0.111 0.032 0.046
Proline Serine Threonine Lab A B Mean SD A B Mean SD A B Mean SD
3 0.277 0.286 0.282 0.006 0.428 0.440 0.434 0.008 0.288 0.293 0.291 0.004 5 0.410 0.390 0.400 0.014 0.490 0.490 0.490 0.000 0.370 0.390 0.380 0.014 7 0.444 0.460 0.452 0.011 0.509 0.494 0.502 0.011 0.385 0.381 0.383 0.003 10 0.413 0.413 0.465 0.465 0.359 0.359 13 0.420 0.420 0.490 0.490 0.380 0.380
N: 5 5 5 Mean, Pooled SD: 0.393 0.011 0.476 0.008 0.359 0.009
SD: 0.065 0.027 0.039
Tyrosine Valine Lab A B Mean SD A B Mean SD
3 0.206 0.206 0.206 0.000 0.267 0.271 0.269 0.003 5 0.270 0.280 0.275 0.007 0.360 0.410 0.385 0.035 7 0.280 0.270 0.275 0.007 0.495 0.506 0.501 0.008 10 0.307 0.307 0.485 0.485 13 0.330 0.330 0.530 0.530
N: 5 5 Mean, Pooled SD: 0.279 0.006 0.434 0.021
SD: 0.047 0.107
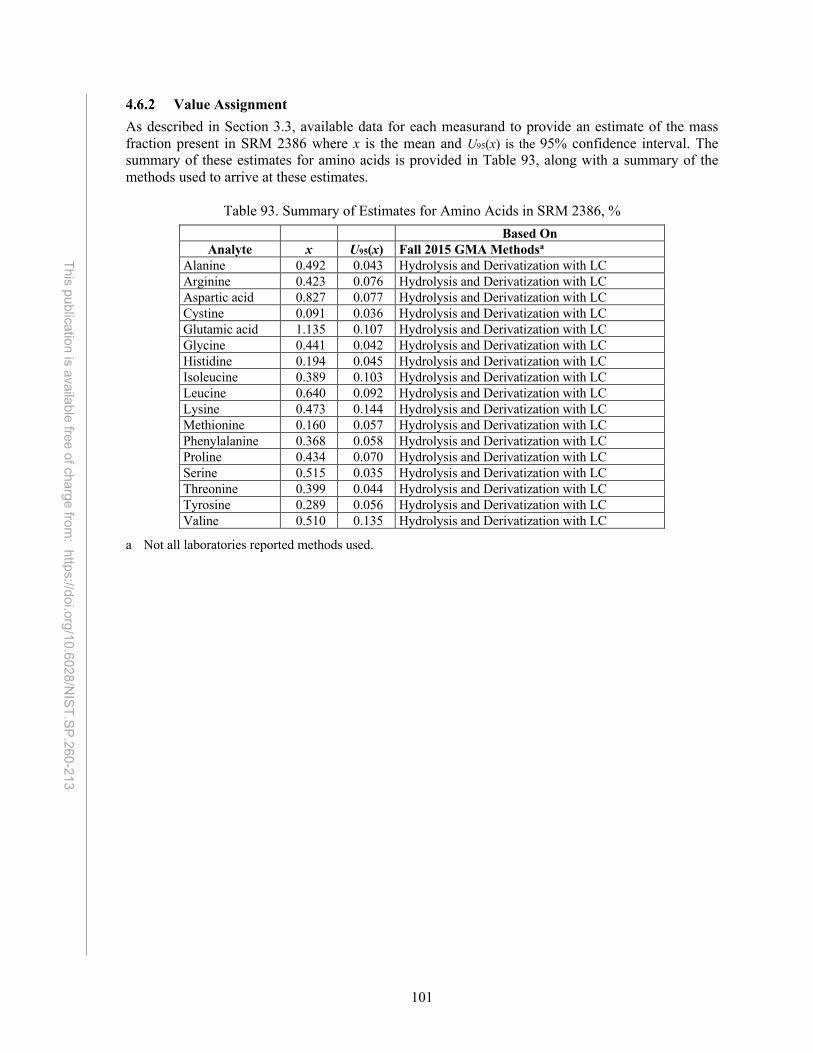
101
This publication is available free of charge from: https://doi.org/10.6028/N
IST.SP.260 -213
Value Assignment As described in Section 3.3, available data for each measurand to provide an estimate of the mass fraction present in SRM 2386 where x is the mean and U95(x) is the 95% confidence interval. The summary of these estimates for amino acids is provided in Table 93, along with a summary of the methods used to arrive at these estimates.
Table 93. Summary of Estimates for Amino Acids in SRM 2386, %
Based On Analyte x U95(x) Fall 2015 GMA Methodsa
Alanine 0.492 0.043 Hydrolysis and Derivatization with LC Arginine 0.423 0.076 Hydrolysis and Derivatization with LC Aspartic acid 0.827 0.077 Hydrolysis and Derivatization with LC Cystine 0.091 0.036 Hydrolysis and Derivatization with LC Glutamic acid 1.135 0.107 Hydrolysis and Derivatization with LC Glycine 0.441 0.042 Hydrolysis and Derivatization with LC Histidine 0.194 0.045 Hydrolysis and Derivatization with LC Isoleucine 0.389 0.103 Hydrolysis and Derivatization with LC Leucine 0.640 0.092 Hydrolysis and Derivatization with LC Lysine 0.473 0.144 Hydrolysis and Derivatization with LC Methionine 0.160 0.057 Hydrolysis and Derivatization with LC Phenylalanine 0.368 0.058 Hydrolysis and Derivatization with LC Proline 0.434 0.070 Hydrolysis and Derivatization with LC Serine 0.515 0.035 Hydrolysis and Derivatization with LC Threonine 0.399 0.044 Hydrolysis and Derivatization with LC Tyrosine 0.289 0.056 Hydrolysis and Derivatization with LC Valine 0.510 0.135 Hydrolysis and Derivatization with LC
a Not all laboratories reported methods used.

102
This publication is available free of charge from: https://doi.org/10.6028/N
IST.SP.260 -213
5 References
1 Wolf, WR, Andrews KW. A system for defining reference materials applicable to all food matrices. Fres J Anal Chem 1995;352:73-76. https://doi.org/10.1007/BF00322300
2 Murphy KE, Vetter TW. Recognizing and Overcoming Analytical Error in the Use of ICP-MS for the Determination of Cd in Breakfast Cereals and Dietary Supplements. Anal Bioanal Chem 2013;405(13):4579-4588. https://doi.org/10.1007/s00216-013-6855-8
3 Murphy KE, Long SE, Vocke RD. On The Certification of Cadmium at Trace and Ultratrace Levels In Standard Reference Materials Using ID ICP-MS. Anal Bioanal Chem 2007;387:2453-2461. https://doi.org/10.1007/s00216-006-0880-9
4 Murphy KE, Beary ES, Rearick MS, Vocke RD. Isotope Dilution Inductively Coupled Plasma Mass Spectrometry (ID ICP-MS) for the Certification of Lead and Cadmium in Environmental Standard Reference Materials. Fresenius J Anal Chem 2000;368:362-370. https://doi.org/10.1007/s002160000454
5 IUPAC Commission on Atomic Weights and Isotopic Abundances, Atomic Weights of the Elements 2005, IUPAC Technical Report, Pure & Appl Chem 2006;78(11):2051-2066. https://doi.org/0.1351/pac200678112051
6 Mackey EA, Anderson DL, Liposky PJ, Lindstrom RM, Chen-Mayer H, Lamaze GP. New thermal neutron prompt γ-ray activation analysis instrument at the National Institute of Standards and Technology Center for Neutron Research. Nucl Instr Meth Phys Res B 2004;226(3):426-440. https://doi.org/10.1016/j.nimb.2004.05.038
7 Thomas JB, Yen JH, Sharpless KE. Characterization of NIST-food Matrix Standard Reference Materials for their Vitamin C Content. Anal Bioanal Chem 2013;405:4539-4548. https://doi.org/10.1007/s00216-013-6891-4
8 AOAC Official Method 996.06. Fat (Total, Saturated, and Unsaturated) in Foods 9 DerSimonian, R., Laird, N. Meta-analysis in clinical trials, Controlled Clinical Trials,
1986;7(3):177-188. https://doi.org/10.1016/0197-2456(86)90046-2 10 JCGM 100:2008, Evaluation of Measurement Data — Guide to the Expression of Uncertainty in
Measurement (ISO GUM 1995 with Minor Corrections); Joint Committee for Guides in Metrology (2008); https://www.bipm.org/en/publications/guides See also Taylor, B.N.; Kuyatt, C.E.; Guidelines for Evaluating and Expressing the Uncertainty of NIST Measurement Results; NIST Technical Note 1297; https://doi.org/10.6028/NIST.TN.1297
11 JCGM 101:2008, Evaluation of measurement data—Supplement 1 to the “Guide to the expression of uncertainty in measurement'”—Propagation of distributions using a Monte Carlo method; Joint Committee for Guides in Metrology (2008), https://www.bipm.org/en/publications/guides
12 Efron B, Tibshirani RJ. (1993) An Introduction to the Bootstrap, Chapman & Hall, UK. 13 Searle S, Casella G, McCulloch C. (1992) Variance Components; John Wiley, Hoboken, NJ. 14 Rukhin AL, Possolo A. Laplace random effects models for interlaboratory studies, Computational
Statistics and Data Analysis 2011;55:1815-1827. https://doi.org/10.1016/j.csda.2010.11.016 15 Beauchamp, C.R.; Camara, J.E.; Carney, J.; Choquette, S.J.; Cole, K.D.; DeRose, P.C.;
Duewer, D.L.; Epstein, M.S.; Kline, M.C.; Lippa, K.A.; Lucon, E.; Phinney, K.W.; Polakoski, M.; Possolo, A.; Sharpless, K.E.; Sieber, J.R.; Toman, B.; Winchester, M.R.; Windover, D.; Metrological Tools for the Reference Materials and Reference Instruments of the NIST Material Measurement Laboratory; NIST Special Publication (NIST SP) 260-136, 2020 Edition; https://doi.org/10.6028/NIST.SP.260-136-2020

103
This publication is available free of charge from: https://doi.org/10.6028/N
IST.SP.260 -213
16 Mackey EA, Gordon GE, Lindstrom RM, Anderson DL. Use of Spherical Targets To Minimize Effects of Neutron Scattering by Hydrogen in Neutron Capture Prompt γ-Ray Activation Analysis. Anal Chem 1992;64(20):2366-2371. https://doi.org/10.1021/ac00044a012
17 Rosman K, Taylor PD. IUPAC Isotopic Compositions of the Elements 1997, Pure & Appl Chem 1998;70:217-235. http://doi.org/10.1351/pac199870010217