certification of key performance indicators for the year ... · // annual report 2015/16 109 key...
TRANSCRIPT

Department of the Attorney General // Annual Report 2015/16 109
Key Performance IndicatorsCertification of Key Performance Indicators for the Year Ended 30 June 2016I hereby certify that the Key Performance Indicators are based on proper records, are relevant and appropriate for assisting users to assess the Department of the Attorney General’s performance, and fairly represent the performance of the Department of the Attorney General for the financial year ended 30 June 2016.
Pauline BagdonaviciusA/Director GeneralDepartment of the Attorney General23 August 2016

Department of the Attorney General // Annual Report 2015/16 110
Key Performance IndicatorsOur PurposeTo provide high quality and accessible justice, legal, registry, guardianship and trustee services that meet the needs of the community and Government.
Relationships to Government goalsBroad, high-level government goals are supported at agency level by more specific agency level desired outcomes. Agencies deliver services to achieve these desired outcomes that ultimately contribute to meeting the higher level government goals.The following table illustrates the relationship between the Department of the Attorney General’s agency level desired outcomes, services delivered by the Department and the Government’s goals.
Government Goals Department of the Attorney General Desired Outcomes Services
Results-based service delivery:Greater focus on achieving results in key service delivery areas for the benefit of all Western Australians.
1. An efficient, accessible court and tribunal system 1. Court and Tribunal Services
2. Trustee, Guardianship and Administration services are accessible to all Western Australians
2. Advocacy, Guardianship and Administration Services
3. Trustee Services
3. Western Australian birth, death and marriage certificates are accurate and accessible
4. Births, Deaths and Marriages
4. Government receives quality, timely legal and legislative drafting services
5. Services to Government
5. Equitable access to legal services and information*
6. Legal Aid Assistance*
* This outcome and service is delivered by the Legal Aid Commission. The Legal Aid Commission is partly funded through the Department of the Attorney General but prepares a separate annual report including reporting against Key Performance Indicators.
Department of the Attorney General // Annual Report 2015/16 111
Changes to the Department’s Outcome Based Management structureThere were no changes to the Department’s Outcome Based Management framework for 2015/16.
Key Performance IndicatorsThe Department of the Attorney General is required under Section 61 of the Financial Management Act 2006 and Treasurer‘s Instruction TI 904, to disclose key performance indicators in agency annual reports.The Department has developed Key Performance Indicators of effectiveness and efficiency to assist senior management and stakeholders assess and monitor the extent to which agency level government desired outcomes have been achieved and the efficiency of service delivery.The Key Performance Indicators are monitored on a regular basis by the Department’s Corporate Executive Committee.Key effectiveness indicators provide information on the extent to which agency level outcomes have been achieved, or contributed to, through the delivery of services. The Department of the Attorney General reports on effectiveness indicators for five agency level outcomes.Key efficiency indicators relate services to the level of resource inputs required to deliver them. Efficiency indicators have been developed for each of the services delivered by the Department.Each indicator shows the average cost per output to deliver the service. Service costs are calculated based on the Department’s internal cost allocation model to reflect the full cost of the service.The following performance indicators should be read in conjunction with the accompanying notes to the Key Performance Indicators. Explanations are provided where there is a significant variation between 2015/16 budget targets and actual results.

Department of the Attorney General // Annual Report 2015/16 112
Outcome 1: An efficient, accessible court and tribunal system
The Department aims to provide a court system that is responsive to community needs for access to justice.This supports the Government’s strategic goal of a greater focus on achieving results in key service delivery areas for the benefit of all Western Australians.To be accessible, the court system must be available to resolve disputes in a timely manner. Accessibility is diminished if there are lengthy delays in bringing matters to trial or finalising matters brought before the courts. The time taken to achieve an outcome in the courts is considered a
primary indicator of the accessibility of the court system and therefore the extent to which the agency level outcome is achieved. The timely resolution of matters brought before the courts is also a measure of the efficiency of the courts system.Effectiveness indicators are measured separately for key jurisdictions and the Fines Enforcement Registry. The jurisdictions measured are considered key indicators because, combined, they represent the majority of the workload and/or expenditure for the courts.
The key effectiveness indicators comprise measures of time to trial, time to finalise matters and time to finalise non trial matters. The measure used is dependent on the type of matter and the jurisdiction. In criminal jurisdictions, the majority of matters may go to trial therefore time to trial is an appropriate measure whereas in civil jurisdictions most matters may be finalised without going to trial and time to finalise non trial matters is used.
Key Effectiveness Indicators
Supreme Court – Criminal – Time to trialWhat does this indicator measure? Time to trial is a measure of the median time taken from a specified initial date (e.g. committal, lodgment) to the first trial date. The proportion of matters needing a trial, and the time required for the court and associated services to satisfy complex pre-trial issues, increases with the seriousness and complexity of the matter.How is this indicator calculated? This measure is calculated by taking the median time from date of committal to first trial date. The information for this indicator has been derived from the Integrated Courts Management System (ICMS).What does this indicator show? The criminal median time to trial remained above target due to an increase in the volume of committals for trial.
2015/16 Actual 36
2015/16 Target 28
2014/15 Actual 33
2013/14 Actual 30
2012/13 Actual 26 weeks

Department of the Attorney General // Annual Report 2015/16 113
Supreme Court – Civil – Time to finalise non-trial mattersWhat does this indicator measure? This indicator measures the median time to finalise cases that are heard by a Registrar or Judge at conferences or hearings, before proceeding to trial and is an indicator of the capacity of the court to resolve matters by methods other than formal trial.How is this indicator calculated? This measure is calculated by taking the median time from date of lodgment to first date of finalisation, excluding matters finalised by trial and matters finalised administratively. Information for this indicator is derived from the Integrated Courts Management System (ICMS).What does this indicator show? No significant variation.
2015/16 Actual 18
2015/16 Target 19
2014/15 Actual 17
2013/14 Actual 19
2012/13 Actual 20 weeks
District Court – Criminal – Time to trialWhat does this indicator measure? Time to trial is a measure of the median time taken from a specified initial date (e.g. committal, lodgment) to the first trial date. The proportion of matters needing a trial, and the time required for the court and associated services to satisfy complex pre-trial issues, increases with the seriousness and complexity of the matter.How is this indicator calculated? This measure is calculated by taking the median time from date of committal to the first trial date. The information for this indicator is derived from the Integrated Courts Management System (ICMS).What does this indicator show? No significant variation.
2015/16 Actual 32
2015/16 Target 32
2014/15 Actual 31
2013/14 Actual 26
2012/13 Actual 25 weeks
State Administrative Tribunal – Time to finaliseWhat does this indicator measure? This indicator is measured by calculating the median time to finalise a matter from its lodgment to when a judgement is made.How is this indicator calculated? This measure is calculated by taking the median time to finalise a matter from date of lodgment to when a judgement is made (excludes all guardianship administration matters). Information for this indicator is derived from the Integrated Courts Management System (ICMS).What does this indicator show? No significant variation.
2015/16 Actual 16
2015/16 Target 15
2014/15 Actual 13
2013/14 Actual 14
2012/13 Actual 13 weeks

Department of the Attorney General // Annual Report 2015/16 114
Family Court of Western Australia – Time to finalise non-trial mattersWhat does this indicator measure? This indicator measures the median time to finalise final order applications by court order, before proceeding to trial. This is an indicator of the capacity of the court to resolve matters by methods other than formal trial.How is this indicator calculated? This measure is calculated by taking the median time from the date of lodgment to the date of finalisation, excluding matters finalised by trial and matters finalised administratively. Information for this indicator is derived from a national cases database (CASETRACK).From 1 July 2015, the Court changed its data extraction process and now includes first finalisations only. The change provides a more accurate reflection of the court’s service delivery. Comparative results of the past three years are restated using the revised counting rule.The previously reported results were 44 weeks (2014/15), 57 weeks (2013/14) and 47 weeks (2012/13).What does this indicator show? The higher than target result is due to the continued growth in the complexity and volume of final order parenting applications finalised; and the reallocation of magistrates to trial work to help address the delay to trial, thereby reducing the Court’s capacity to hear non-trial matters.
2015/16 Actual 38
2015/16 Target 27
2014/15 Actual 35
2013/14 Actual 35
2012/13 Actual 32 weeks
Magistrates Court – Criminal and Civil – Time to trialWhat does this indicator measure? Time to trial is a measure of the median time taken from a specified initial date (e.g. lodgment) to the first trial date. The proportion of matters needing a trial, and the time required for the court and associated services to satisfy complex pre-trial issues, increases with the seriousness and complexity of the matter.How is this indicator calculated? This measure is calculated by taking the median time from the date of lodgment to the first trial date. Information for this indicator is derived from the Integrated Courts Management System (ICMS).What does this indicator show? The higher than target result is due to the growth in criminal case lodgments and increase in charges per case in 2015/16.
2015/16 Actual 23
2015/16 Target 19
2014/15 Actual 20
2013/14 Actual 18
2012/13 Actual 17 weeks

Department of the Attorney General // Annual Report 2015/16 115
Coroner’s Court – Time to trialWhat does this indicator measure? Time to trial is a measure of the median time taken from the date of death to the first inquest hearing. The proportion of matters needing a trial, and the time required for the court and associated services to satisfy complex pre-trial issues, increases with the seriousness and complexity of the matter.How is this indicator calculated? This measure is calculated by taking the median time from death to the first inquest hearing (for those cases where an inquest is held). In the Coroner’s Court a trial is defined as an inquest. Information for this indicator is derived from the National Coroners Information System (NCIS) database.What does this indicator show? The result is higher than target due to the Coroner’s Court focusing on older and more complex inquest cases. More than 77% of cases heard in 2015-16 were older than 128 weeks.
2015/16 Actual 164
2015/16 Target 128
2014/15 Actual 168
2013/14 Actual 112
2012/13 Actual 137 weeks
Fines Enforcement Registry - Percentage of Fines Satisfied Within 12 MonthsWhat does this indicator measure? The Fines Enforcement Registry effectiveness indicators demonstrate to the community that the appropriate systems, procedures and resources are in place to enforce fines, costs and infringement penalties in a timely manner. It also demonstrates to the community that a court fine is a viable sentencing option.
Fines and CostsHow is this indicator calculated? This indicator measures the number of fines satisfied within 12 months of referral to the Fines Enforcement Registry (FER). It is calculated by expressing the number of fines satisfied within 12 months of referral as a percentage of the total number of fines referred to FER. Information is extracted from the ICMS database.What does this indicator show? No significant variation.
2015/16 Actual 39%
2015/16 Target 35%
2014/15 Actual 39%
2013/14 Actual 40%
2012/13 Actual 41% weeks
InfringementsHow is this indicator calculated? This indicator measures the number of infringements satisfied within 12 months of referral to the Fines Enforcement Registry (FER). It is derived by expressing the number of infringements satisfied within 12 months of referral as a percentage of the total number of infringements referred to FER. Information is extracted from the ICMS database.What does this indicator show? No significant variation.
2015/16 Actual 58%
2015/16 Target 57%
2014/15 Actual 59%
2013/14 Actual 60%
2012/13 Actual 62% weeks

Department of the Attorney General // Annual Report 2015/16 116
Service 1: Court and Tribunal ServicesThis service is delivered by Court and Tribunal Services.Two distinct groups administer courts in Western Australia: the independent judicial officers who preside over the various courts and the Department of the Attorney General that provides court facilities, administrative support and judicial support staff to enable the determination of cases brought before a court or tribunal. Part of this function also involves the delivery of court counselling services and a range of civil and criminal enforcement services.
Key Efficiency Indicators
What does this indicator measure? The following indicators measure the average cost per case for all matters finalised within each jurisdiction (including matters finalised without trial and those finalised administratively), and the cost per enforcement action to finalise outstanding fines and infringements.The cost per case is calculated by dividing the total cost of the jurisdiction by the number of cases finalised.
How are the cost per case indicators calculated? The cost per case indicators are calculated by dividing the total cost of processing cases by the number of finalisations.The efficiency indicators for Court and Tribunal Services are calculated from the Department’s Cost Allocation Model in the Financial Management Information System. Total operating costs used to calculate the efficiency measure are extracted from the Department’s jurisdiction based cost management system (Hyperion).
The number of finalisations is obtained from various in house case management and tracking systems maintained by the jurisdictions.
Supreme Court – Criminal – Cost per caseNo significant variation.
2015/16 Actual $37,688
2015/16 Target $40,042
2014/15 Actual $34,674
2013/14 Actual $36,466
2012/13 Actual $30,327
Supreme Court – Civil – Cost per caseNo significant variation.
2015/16 Actual $13,381
2015/16 Target $12,750
2014/15 Actual $10,573
2013/14 Actual $9,869
2012/13 Actual $7,363
Department of the Attorney General // Annual Report 2015/16 117
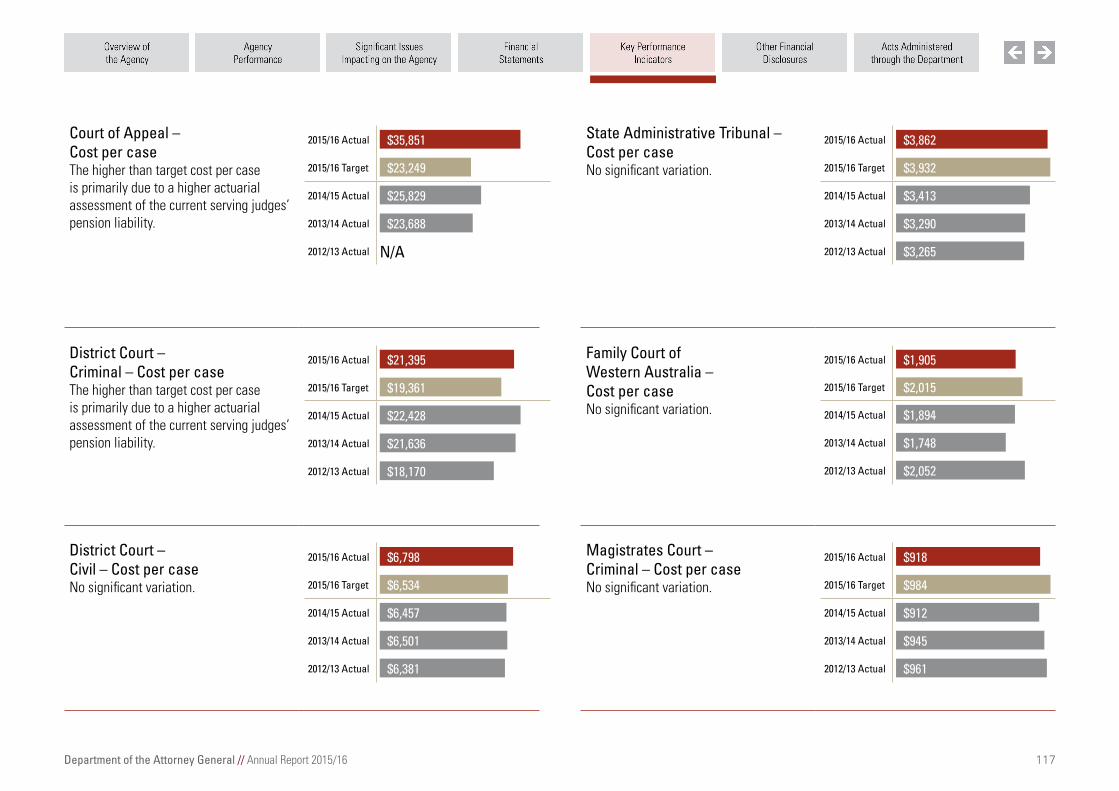
Court of Appeal – Cost per caseThe higher than target cost per case is primarily due to a higher actuarial assessment of the current serving judges’ pension liability.
2015/16 Actual $35,851
2015/16 Target $23,249
2014/15 Actual $25,829
2013/14 Actual $23,688
2012/13 Actual N/A
District Court – Criminal – Cost per caseThe higher than target cost per case is primarily due to a higher actuarial assessment of the current serving judges’ pension liability.
2015/16 Actual $21,395
2015/16 Target $19,361
2014/15 Actual $22,428
2013/14 Actual $21,636
2012/13 Actual $18,170
District Court – Civil – Cost per caseNo significant variation.
2015/16 Actual $6,798
2015/16 Target $6,534
2014/15 Actual $6,457
2013/14 Actual $6,501
2012/13 Actual $6,381
State Administrative Tribunal – Cost per caseNo significant variation.
2015/16 Actual $3,862
2015/16 Target $3,932
2014/15 Actual $3,413
2013/14 Actual $3,290
2012/13 Actual $3,265
Family Court of Western Australia – Cost per caseNo significant variation.
2015/16 Actual $1,905
2015/16 Target $2,015
2014/15 Actual $1,894
2013/14 Actual $1,748
2012/13 Actual $2,052
Magistrates Court – Criminal – Cost per caseNo significant variation.
2015/16 Actual $918
2015/16 Target $984
2014/15 Actual $912
2013/14 Actual $945
2012/13 Actual $961

Department of the Attorney General // Annual Report 2015/16 118
Magistrates Court – Civil – Cost per caseNo significant variation.
2015/16 Actual $354
2015/16 Target $364
2014/15 Actual $370
2013/14 Actual $327
2012/13 Actual $339
Coroner’s Court – Cost per caseNo significant variation.
2015/16 Actual $5,252
2015/16 Target $5,612
2014/15 Actual $5,666
2013/14 Actual $5,128
2012/13 Actual $5,485
Children’s Court – Criminal – Cost per caseNo significant variation.
2015/16 Actual $1,024
2015/16 Target $939
2014/15 Actual $972
2013/14 Actual $907
2012/13 Actual $862
Children’s Court – Civil – Cost per caseThe higher than expected cost per case is due to an increase in complex Protection and Care matters requiring case management as well as the higher than anticipated judicial leave commitments in 2015/16.
2015/16 Actual $768
2015/16 Target $568
2014/15 Actual $604
2013/14 Actual $500
2012/13 Actual $488
Fines Enforcement Registry – Cost per enforcementHow is the cost per enforcement indicator calculated? The total cost of processing fines and infringements is divided by the number of lodgments where a lodgment represents an individual enforcement registered with the Fines Enforcement Registry for enforcement. The data sources for this Key Performance Indicator are Hyperion and the departmental information management system (COGNOS) for the number of lodgments.What does this indicator show? No significant variation.
2015/16 Actual $26
2015/16 Target $24
2014/15 Actual $27
2013/14 Actual $25
2012/13 Actual $22

Department of the Attorney General // Annual Report 2015/16 119
Outcome 2: Trustee, guardianship and administration services are accessible to all Western Australians
The Department, through the operations of the Public Advocate safeguards the rights of adults with decision-making disabilities, and reduces the incidence of risk, neglect and exploitation while the Public Trustee ensures equitable access to trustee services for all Western Australians.This supports the Government’s strategic goal of a greater focus on achieving results in key service delivery areas for the benefit of all Western Australians.
The following indicators show the extent to which the Department has achieved this outcome. The indicators measure the accessibility of trustee, guardianship and administration services to all Western Australians.
Key Effectiveness Indicators
Percentage of Guardians of last resort allocated in one dayWhat does this indicator measure? This indicator measures the timeliness of the Public Advocate in allocating a guardian to a represented person in order to make decisions on their behalf and protect them from neglect, abuse or exploitation. A guardian is appointed only when considered necessary, and when there is no one else suitable or available to take on the role.How is this indicator calculated? The indicator is based on the Public Advocate’s best practice to ensure the needs of the represented person are met immediately. It is measured by the number of appointments of Guardians of Last Resort made by the State Administrative Tribunal at the hearing and accepted by the Public Advocate’s delegate within one working day of receipt of the guardianship order.The Public Advocate is appointed as guardian of last resort only when considered necessary and when there is no one else suitable, available or willing to take on the role. The information for this indicator is extracted from the Public Advocate Case Management System (PACMAN).What does this indicator show? No significant variation.
2015/16 Actual 98%
2015/16 Target 95%
2014/15 Actual 96%
2013/14 Actual 94%
2012/13 Actual 96%

Department of the Attorney General // Annual Report 2015/16 120
Percentage of Western Australian deceased estates administered by the Public TrusteeWhat does this indicator measure? The Public Trustee offers a secure value for money alternative for administration of deceased estates in Western Australia. This ensures that trustee services are accessible to people in the state. The percentage of deceased estates administered by the Public Trustee indicates the use being made of the service and therefore the overall accessibility of trustee services to Western Australians.The indicator represents the number of deceased estate files reported as a percentage of the number of adult deaths in Western Australia.How is this indicator calculated? The Public Trustee operates in a commercial environment offering services that can be provided by numerous professional service providers.The Public Trustee administers the estates where it has been appointed as executor. Some estates may not require formal administration but still require work to be undertaken in order that assets may be registered in the survivor or beneficiaries’ name.Data for this indicator is sourced from the Registry of births, deaths and marriages and the Public Trustee’s Management Accounting and Trust Environment (MATE) system.What does this indicator show? No significant variation.
2015/16 Actual 4.1%
2015/16 Target 6.5%
2014/15 Actual 4.7%
2013/14 Actual 5.1%
2012/13 Actual 5.7%
Percentage of clients who have services provided by the Public Trustee under an operating subsidyWhat does this indicator measure? In addition to providing affordable services thereby making trustee services more accessible, the Public Trustee provides services free of charge, or at a reduced cost, to clients who cannot afford them. This further increases the accessibility of trustee services by ensuring that all Western Australians have access to trustee services.The indicator represents the proportion of services provided free of charge or at a reduced cost under the Public Trustee’s community service.How is this indicator calculated? This indicator measures the proportion of clients provided with services by the Public Trustee under the operating subsidy. The fees raised are rebated back to the clients who meet the minimum requirements under the operating subsidy.The indicator is calculated using the number of operating subsidy clients compared to the total trust clients administered.What does this indicator show? The higher than target result is due to continuing increase in the number of appointments from the State Administration Tribunal where the Public Trustee provides services at a subsidised cost to vulnerable persons.
2015/16 Actual 53%
2015/16 Target 35%
2014/15 Actual 51%
2013/14 Actual 49%
2012/13 Actual 46%

Department of the Attorney General // Annual Report 2015/16 121
Service 2: Advocacy, guardianship and administration services
This service is delivered by the Public Advocate.Advocacy, guardianship and administration services protect and promote the financial interests and welfare of people with decision-making disabilities by providing:• access to investigation and advocacy services;• appropriate appointment of guardians and
administrators and appropriate interventions in relation to Enduring Powers of Attorney and Enduring Powers of Guardianship;
• guardianship and administration community education services; and
• guardianship and administration services provided by the Public Advocate.
The following efficiency indicator measures the cost of delivering the service.
Key Efficiency Indicators
Average cost of providing advocacy and guardianship servicesWhat does this indicator measure? This indicator measures the average cost per case of providing advocacy and guardianship services on behalf of people with decision-making disabilities.How is this indicator calculated? This indicator is calculated by dividing the total cost of providing advocacy, guardianship and administration services by the number of advocacy and guardianship services provided. The information for this indicator is extracted from Department’s activity based cost management system (Hyperion) and the Public Advocate Case Management System (PACMAN).What does this indicator show? No significant variation.
2015/16 Actual $1,744
2015/16 Target $1,860
2014/15 Actual $1,649
2013/14 Actual $1,820
2012/13 Actual $1,776
Department of the Attorney General // Annual Report 2015/16 122
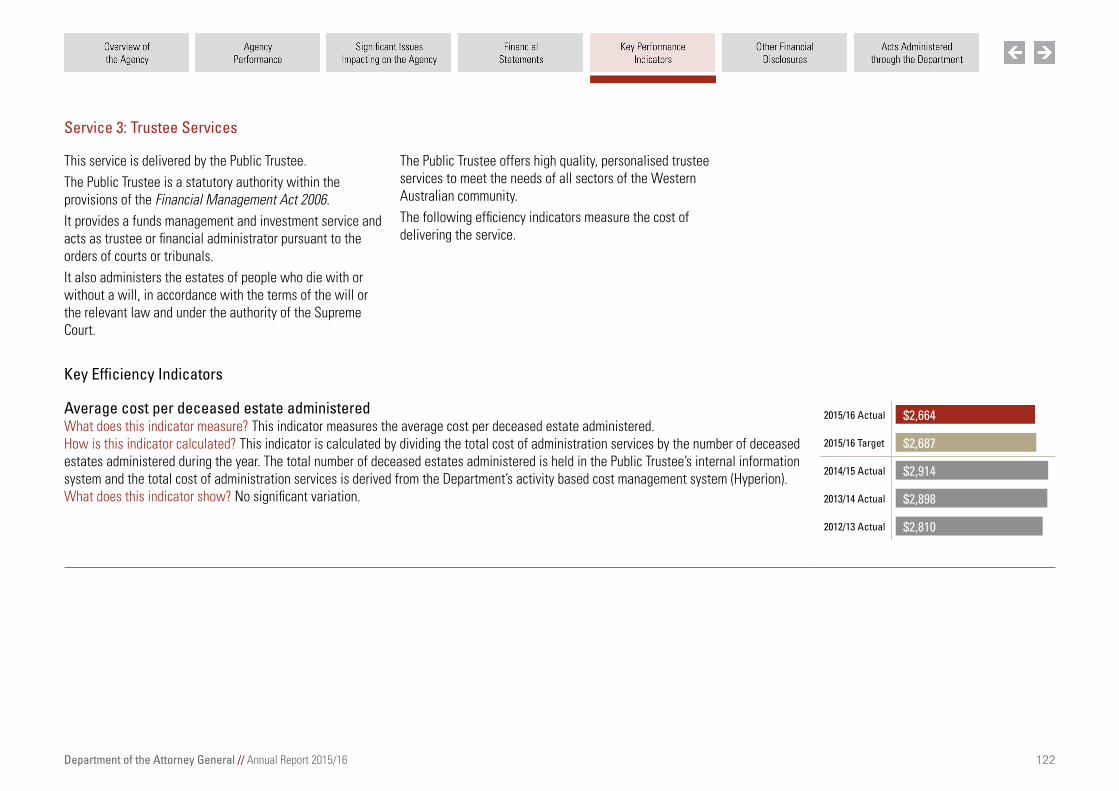
Service 3: Trustee Services
This service is delivered by the Public Trustee.The Public Trustee is a statutory authority within the provisions of the Financial Management Act 2006.It provides a funds management and investment service and acts as trustee or financial administrator pursuant to the orders of courts or tribunals.It also administers the estates of people who die with or without a will, in accordance with the terms of the will or the relevant law and under the authority of the Supreme Court.
The Public Trustee offers high quality, personalised trustee services to meet the needs of all sectors of the Western Australian community.The following efficiency indicators measure the cost of delivering the service.
Key Efficiency Indicators
Average cost per deceased estate administeredWhat does this indicator measure? This indicator measures the average cost per deceased estate administered.How is this indicator calculated? This indicator is calculated by dividing the total cost of administration services by the number of deceased estates administered during the year. The total number of deceased estates administered is held in the Public Trustee’s internal information system and the total cost of administration services is derived from the Department’s activity based cost management system (Hyperion).What does this indicator show? No significant variation.
2015/16 Actual $2,664
2015/16 Target $2,687
2014/15 Actual $2,914
2013/14 Actual $2,898
2012/13 Actual $2,810
Department of the Attorney General // Annual Report 2015/16 123
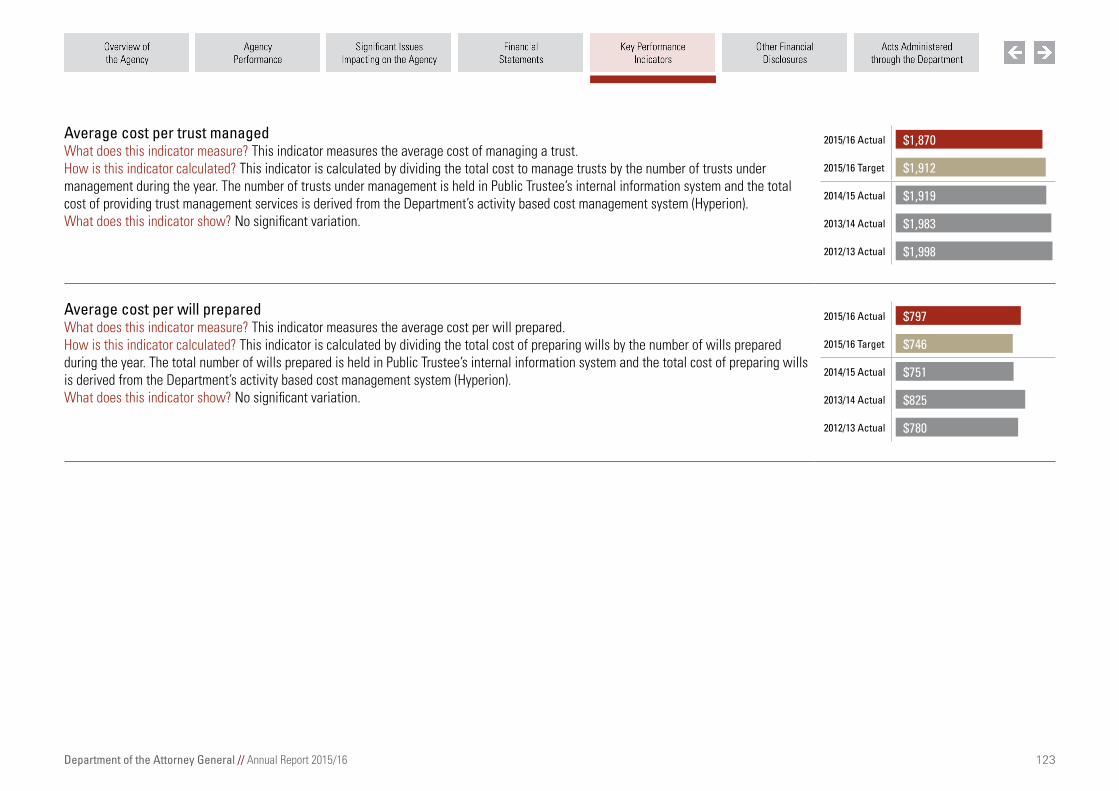
Average cost per trust managedWhat does this indicator measure? This indicator measures the average cost of managing a trust.How is this indicator calculated? This indicator is calculated by dividing the total cost to manage trusts by the number of trusts under management during the year. The number of trusts under management is held in Public Trustee’s internal information system and the total cost of providing trust management services is derived from the Department’s activity based cost management system (Hyperion).What does this indicator show? No significant variation.
2015/16 Actual $1,870
2015/16 Target $1,912
2014/15 Actual $1,919
2013/14 Actual $1,983
2012/13 Actual $1,998
Average cost per will preparedWhat does this indicator measure? This indicator measures the average cost per will prepared.How is this indicator calculated? This indicator is calculated by dividing the total cost of preparing wills by the number of wills prepared during the year. The total number of wills prepared is held in Public Trustee’s internal information system and the total cost of preparing wills is derived from the Department’s activity based cost management system (Hyperion).What does this indicator show? No significant variation.
2015/16 Actual $797
2015/16 Target $746
2014/15 Actual $751
2013/14 Actual $825
2012/13 Actual $780
Department of the Attorney General // Annual Report 2015/16 124
Outcome 3: Western Australian birth, death and marriage certificates are accurate and accessible
The Department seeks to ensure eligible people are able to obtain accurate documentary proof of key life events and approved organisations can obtain accurate information for research, statistical and planning purposes in a timely manner.This supports the Government’s strategic goal of a greater focus on achieving results in key service delivery areas for the benefit of all Western Australians.
The following effectiveness indicators show the extent to which the Department, through the activities of the Registry of Births, Deaths and Marriages, has achieved this outcome. The indicators measure the accuracy and accessibility of certificates of birth, death and marriage to all Western Australians.
Key Effectiveness Indicators
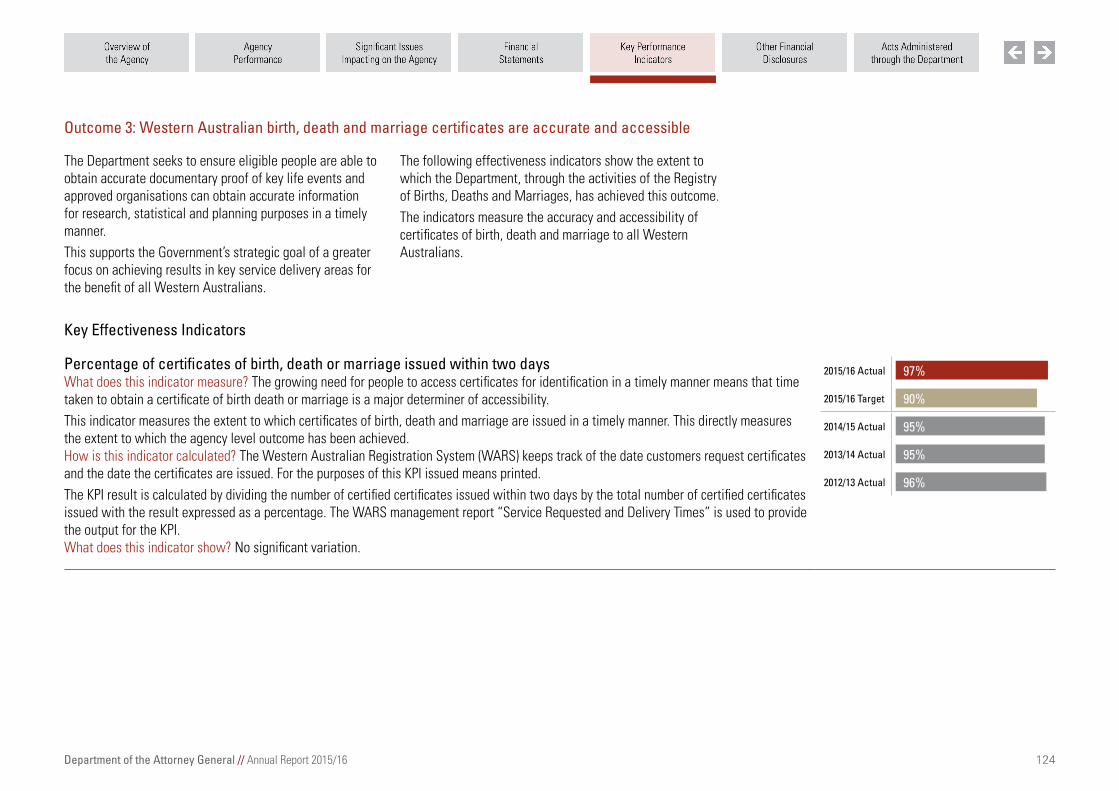
Percentage of certificates of birth, death or marriage issued within two daysWhat does this indicator measure? The growing need for people to access certificates for identification in a timely manner means that time taken to obtain a certificate of birth death or marriage is a major determiner of accessibility.This indicator measures the extent to which certificates of birth, death and marriage are issued in a timely manner. This directly measures the extent to which the agency level outcome has been achieved.How is this indicator calculated? The Western Australian Registration System (WARS) keeps track of the date customers request certificates and the date the certificates are issued. For the purposes of this KPI issued means printed.The KPI result is calculated by dividing the number of certified certificates issued within two days by the total number of certified certificates issued with the result expressed as a percentage. The WARS management report “Service Requested and Delivery Times” is used to provide the output for the KPI.What does this indicator show? No significant variation.
2015/16 Actual 97%
2015/16 Target 90%
2014/15 Actual 95%
2013/14 Actual 95%
2012/13 Actual 96%

Department of the Attorney General // Annual Report 2015/16 125
Extent to which births, deaths and marriages source information is recorded error freeWhat does this indicator measure? This indicator measures the percentage of new registrations accurately recorded by the registry, excluding incorrect source information provided by customers.How is this indicator calculated? This indicator is a Key Performance Indicator because the registry is the creator and custodian of vital records and the public must have confidence that records are accurate and reliable.The number of registry errors in death registrations is used to calculate this indicator because immediate feedback is provided if an error is evident in the death certificate, which is always needed for estate settlement. Any errors made on birth or marriage certificates are not immediately detected, as these certificates may not be requested for many years after registration. As the processes for recording births, deaths and marriages are nearly identical; the number of errors in death registrations is considered representative of all three registration types.The computerised Western Australian Registration System counts the number of death registrations corrected as a result of staff data entry errors and divides this count by the total number of deaths registered for the year. The result (i.e. erroneous registrations) is expressed as a percentage.What does this indicator show? No significant variation.
2015/16 Actual 97%
2015/16 Target 97%
2014/15 Actual 97%
2013/14 Actual 97%
2012/13 Actual 97%
Department of the Attorney General // Annual Report 2015/16 126
Service 4: Births, Deaths and Marriages
This service is delivered by the Registry of Births, Deaths and Marriages.The purpose of the Registry is to create and permanently store birth, death and marriage records to enable the public to obtain documentary proof of key life events for legal, personal and historical purposes and also to enable approved organisations to obtain information for research, statistical and planning purposes.The following efficiency indicator measures the cost of delivering the service.
Key Efficiency Indicators
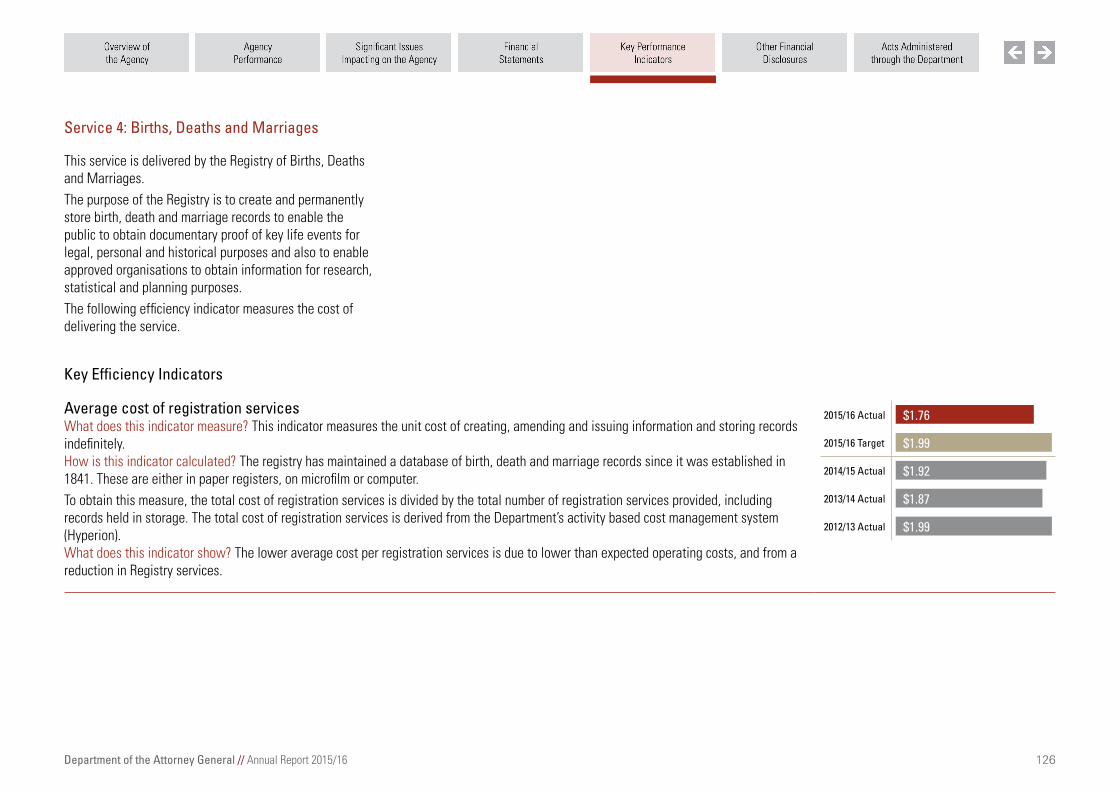
Average cost of registration servicesWhat does this indicator measure? This indicator measures the unit cost of creating, amending and issuing information and storing records indefinitely.How is this indicator calculated? The registry has maintained a database of birth, death and marriage records since it was established in 1841. These are either in paper registers, on microfilm or computer.To obtain this measure, the total cost of registration services is divided by the total number of registration services provided, including records held in storage. The total cost of registration services is derived from the Department’s activity based cost management system (Hyperion).What does this indicator show? The lower average cost per registration services is due to lower than expected operating costs, and from a reduction in Registry services.
2015/16 Actual $1.76
2015/16 Target $1.99
2014/15 Actual $1.92
2013/14 Actual $1.87
2012/13 Actual $1.99
Department of the Attorney General // Annual Report 2015/16 127
Outcome 4: Government receives quality, timely legal and legislative drafting services
The Department delivers services to Government to support justice outcomes and activities of other Government agencies.This supports the Government’s strategic goal of a greater focus on achieving results in key service delivery areas for the benefit of all Western Australians.
The following effectiveness indicators show the extent to which the Department, through the activities of the State Solicitor’s Office and the Parliamentary Counsel’s Office, has achieved this outcome.The indicators measure the satisfaction of recipients of legal services and the timeliness of drafting legislation.
Key Effectiveness Indicators
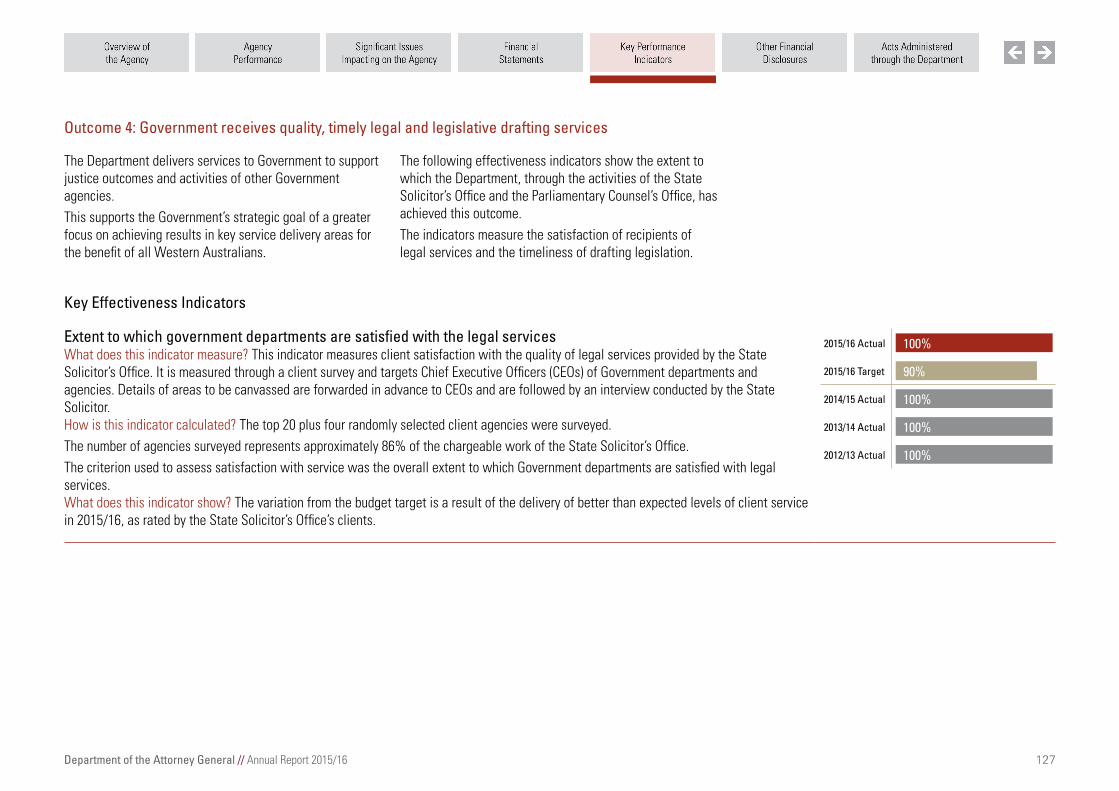
Extent to which government departments are satisfied with the legal servicesWhat does this indicator measure? This indicator measures client satisfaction with the quality of legal services provided by the State Solicitor’s Office. It is measured through a client survey and targets Chief Executive Officers (CEOs) of Government departments and agencies. Details of areas to be canvassed are forwarded in advance to CEOs and are followed by an interview conducted by the State Solicitor.How is this indicator calculated? The top 20 plus four randomly selected client agencies were surveyed.The number of agencies surveyed represents approximately 86% of the chargeable work of the State Solicitor’s Office.The criterion used to assess satisfaction with service was the overall extent to which Government departments are satisfied with legal services.What does this indicator show? The variation from the budget target is a result of the delivery of better than expected levels of client service in 2015/16, as rated by the State Solicitor’s Office’s clients.
2015/16 Actual 100%
2015/16 Target 90%
2014/15 Actual 100%
2013/14 Actual 100%
2012/13 Actual 100%
Department of the Attorney General // Annual Report 2015/16 128
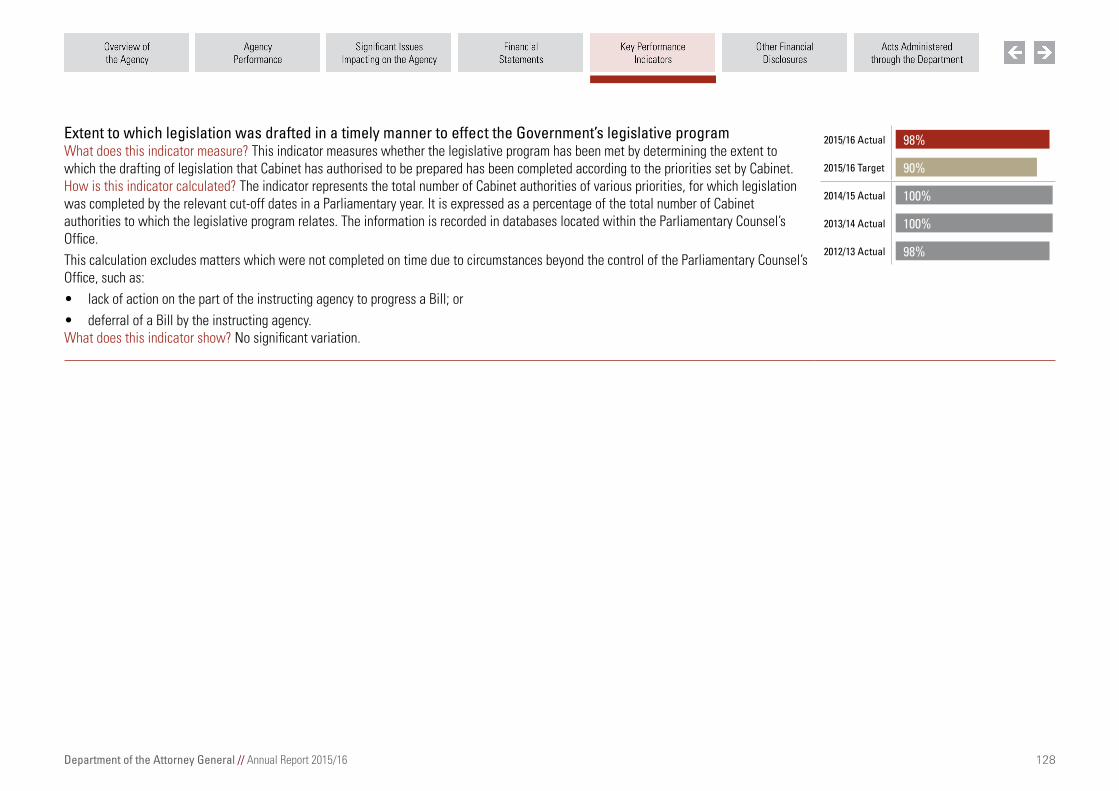
Extent to which legislation was drafted in a timely manner to effect the Government’s legislative programWhat does this indicator measure? This indicator measures whether the legislative program has been met by determining the extent to which the drafting of legislation that Cabinet has authorised to be prepared has been completed according to the priorities set by Cabinet.How is this indicator calculated? The indicator represents the total number of Cabinet authorities of various priorities, for which legislation was completed by the relevant cut-off dates in a Parliamentary year. It is expressed as a percentage of the total number of Cabinet authorities to which the legislative program relates. The information is recorded in databases located within the Parliamentary Counsel’s Office.This calculation excludes matters which were not completed on time due to circumstances beyond the control of the Parliamentary Counsel’s Office, such as:• lack of action on the part of the instructing agency to progress a Bill; or• deferral of a Bill by the instructing agency.What does this indicator show? No significant variation.
2015/16 Actual 98%
2015/16 Target 90%
2014/15 Actual 100%
2013/14 Actual 100%
2012/13 Actual 98%

Department of the Attorney General // Annual Report 2015/16 129
Service 5: Services to Government
This service is delivered by the State Solicitor’s Office and the Parliamentary Counsel’s Office.The State Solicitor’s Office provides a broad-based legal service to Government and its agencies and the Parliamentary Counsel’s Office provides comprehensive
legislative drafting services and access to up to date Western Australia legislation.The following efficiency indicator measures the cost of delivering the service.
Key Efficiency Indicators
Average cost per legal matterWhat does this indicator measure? This indicator measures the average cost of a legal matter, which is defined as an initiating instruction received from a client in the reporting year, plus any other matter active during the reporting year and upon which some legal work was conducted. It also includes work in progress. The indicator is calculated by dividing the State Solicitor’s Office total cost of service by the number of recorded matters.How is this indicator calculated? This indicator measures the average cost of a legal matter, which is defined as an initiating instruction received from a client in the reporting year, plus any other matter active during the reporting year and upon which some legal work was conducted. It also includes work in progress.The cost per matter is calculated by dividing the total cost of providing legal services by the number of matters dealt with during the financial year. Number of matters is extracted from the Time and Matter Costing System and the total cost of service is derived from the Department’s activity based cost management system (Hyperion).What does this indicator show? No significant variation.
2015/16 Actual $4,313
2015/16 Target $4,100
2014/15 Actual $3,962
2013/14 Actual $3,635
2012/13 Actual $3,462
Average cost per page of outputWhat does this indicator measure? This indicator is calculated by dividing the Parliamentary Counsel’s Office total operating expenses, by the number of pages of bills, subsidiary legislation and reprinted texts produced each financial year.How is this indicator calculated? The average cost per drafting service is calculated by dividing the total cost of the Parliamentary Counsel’s Office by the number of pages of bills, subsidiary legislation and reprinted texts produced by the office each financial year.The information is recorded in Access databases located within the Parliamentary Counsel’s Office. The total cost of service is derived from the Department’s activity based cost management system (Hyperion).What does this indicator show? The lower average cost per page is due to higher number of legislation pages produced and lower than expected operating costs.
2015/16 Actual $190
2015/16 Target $233
2014/15 Actual $214
2013/14 Actual $203
2012/13 Actual $229