cerritos college bot 2021-22 tentative budget presentation
TRANSCRIPT

Cerritos College 2021-22 Tentative Budget
Presented By: Dr. Jose Fierro and Felipe Lopez
June 16, 2021
Page a1/12
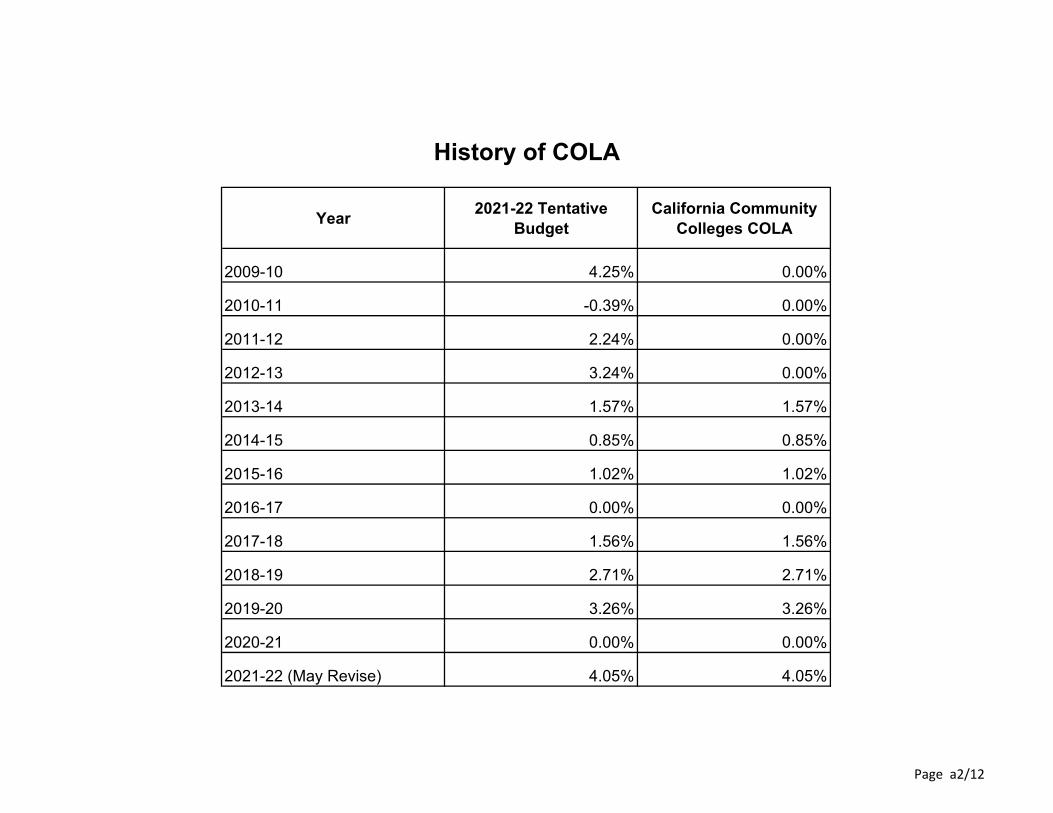
History of COLA
Year 2021-22 Tentative Budget
California Community Colleges COLA
2009-10 4.25% 0.00%
2010-11 -0.39% 0.00%
2011-12 2.24% 0.00%
2012-13 3.24% 0.00%
2013-14 1.57% 1.57%
2014-15 0.85% 0.85%
2015-16 1.02% 1.02%
2016-17 0.00% 0.00%
2017-18 1.56% 1.56%
2018-19 2.71% 2.71%
2019-20 3.26% 3.26%
2020-21 0.00% 0.00%
2021-22 (May Revise) 4.05% 4.05%
Page a2/12
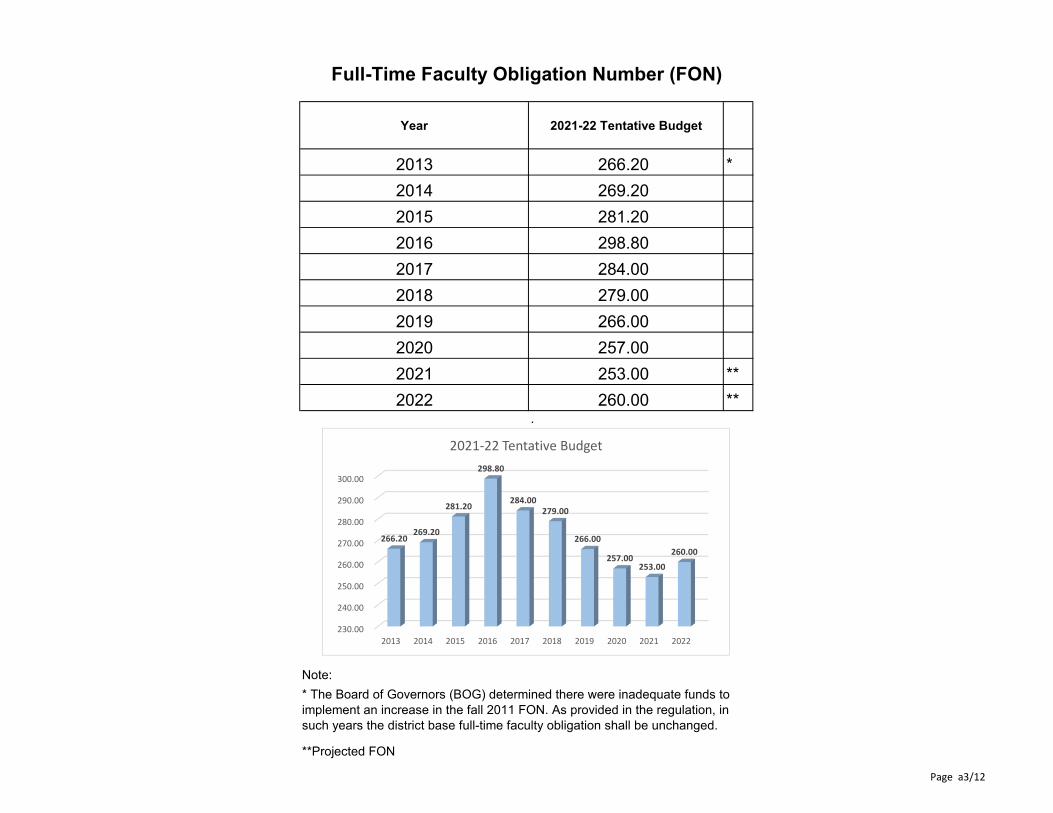
Full-Time Faculty Obligation Number (FON)
Year 2021-22 Tentative Budget
2013 266.20 * 2014 269.20 2015 281.20 2016 298.80 2017 284.00 2018 279.00 2019 266.00 2020 257.00 2021 253.00 ** 2022 260.00 **
.
230.00
240.00
250.00
260.00
270.00
280.00
290.00
300.00
2013 2014 2015 2016 2017 2018 2019 2020 2021 2022
266.20 269.20
281.20
298.80
284.00 279.00
266.00
257.00 253.00
260.00
2021‐22 Tentative Budget
Note: * The Board of Governors (BOG) determined there were inadequate funds to implement an increase in the fall 2011 FON. As provided in the regulation, in such years the district base full-time faculty obligation shall be unchanged.
**Projected FON
Page a3/12
■ ■ ■ ■ ■ ■ ■
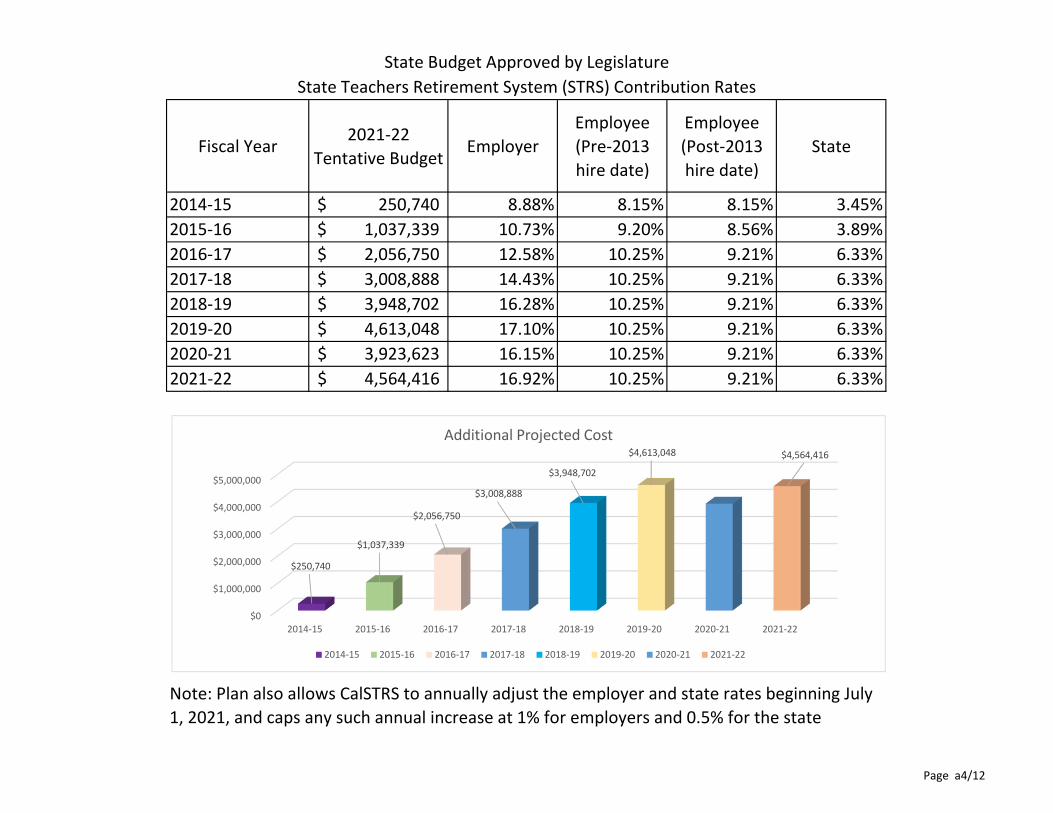
State Budget Approved by Legislature State Teachers Retirement System (STRS) Contribution Rates
Fiscal Year 2021‐22
Tentative Budget Employer
Employee (Pre‐2013 hire date)
Employee (Post‐2013 hire date)
State
2014‐15 $ 250,740 8.88% 8.15% 8.15% 3.45% 2015‐16 $ 1,037,339 10.73% 9.20% 8.56% 3.89% 2016‐17 $ 2,056,750 12.58% 10.25% 9.21% 6.33% 2017‐18 $ 3,008,888 14.43% 10.25% 9.21% 6.33% 2018‐19 $ 3,948,702 16.28% 10.25% 9.21% 6.33% 2019‐20 $ 4,613,048 17.10% 10.25% 9.21% 6.33% 2020‐21 $ 3,923,623 16.15% 10.25% 9.21% 6.33% 2021‐22 $ 4,564,416 16.92% 10.25% 9.21% 6.33%
$0
$1,000,000
$2,000,000
$3,000,000
$4,000,000
$5,000,000
2014‐15 2015‐16 2016‐17 2017‐18 2018‐19 2019‐20 2020‐21 2021‐22
$250,740
$1,037,339
$2,056,750
$3,008,888
$3,948,702
$4,613,048 $4,564,416
Additional Projected Cost
2014‐15 2015‐16 2016‐17 2017‐18 2018‐19 2019‐20 2020‐21 2021‐22
Note: Plan also allows CalSTRS to annually adjust the employer and state rates beginning July 1, 2021, and caps any such annual increase at 1% for employers and 0.5% for the state
Page a4/12
■ ■ ■ ■ ■ ■ ■
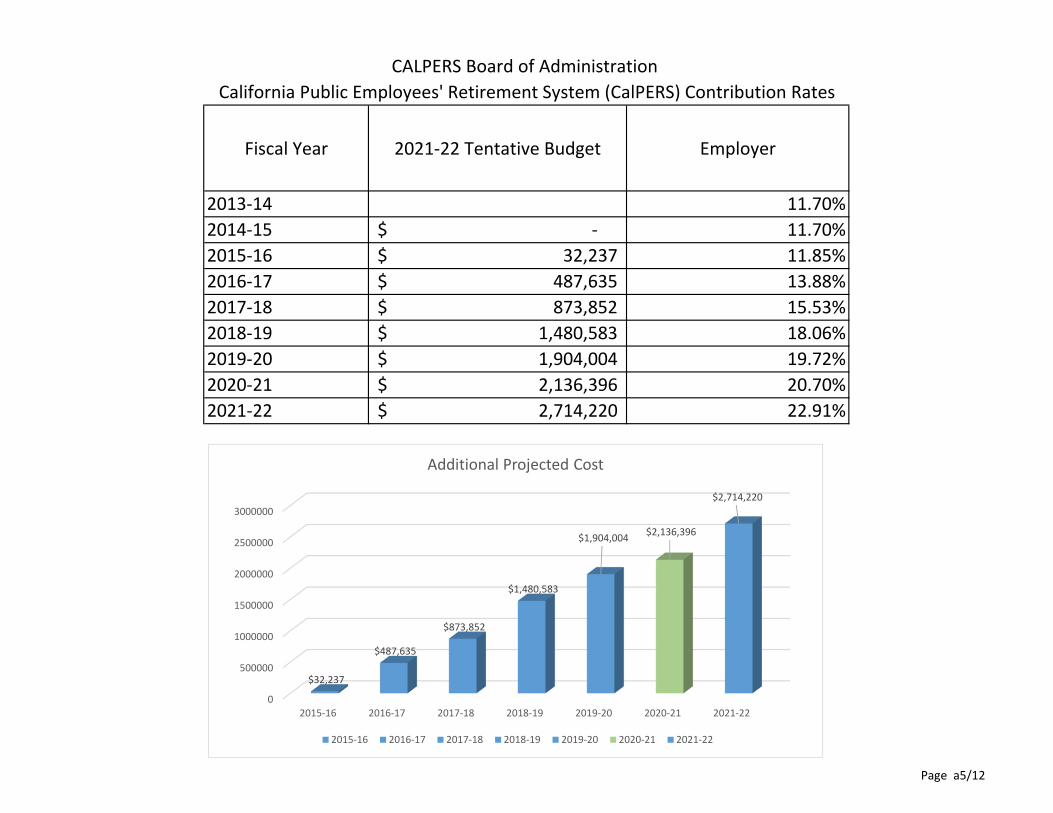
CALPERS Board of Administration California Public Employees' Retirement System (CalPERS) Contribution Rates
Fiscal Year 2021‐22 Tentative Budget Employer
2013‐14 11.70% 2014‐15 $ ‐ 11.70% 2015‐16 $ 32,237 11.85% 2016‐17 $ 487,635 13.88% 2017‐18 $ 873,852 15.53% 2018‐19 $ 1,480,583 18.06% 2019‐20 $ 1,904,004 19.72% 2020‐21 $ 2,136,396 20.70% 2021‐22 $ 2,714,220 22.91%
0
500000
1000000
1500000
2000000
2500000
3000000
2015‐16 2016‐17 2017‐18 2018‐19 2019‐20 2020‐21 2021‐22
$32,237
$487,635
$873,852
$1,480,583
$1,904,004 $2,136,396
$2,714,220
Additional Projected Cost
2015‐16 2016‐17 2017‐18 2018‐19 2019‐20 2020‐21 2021‐22
Page a5/12
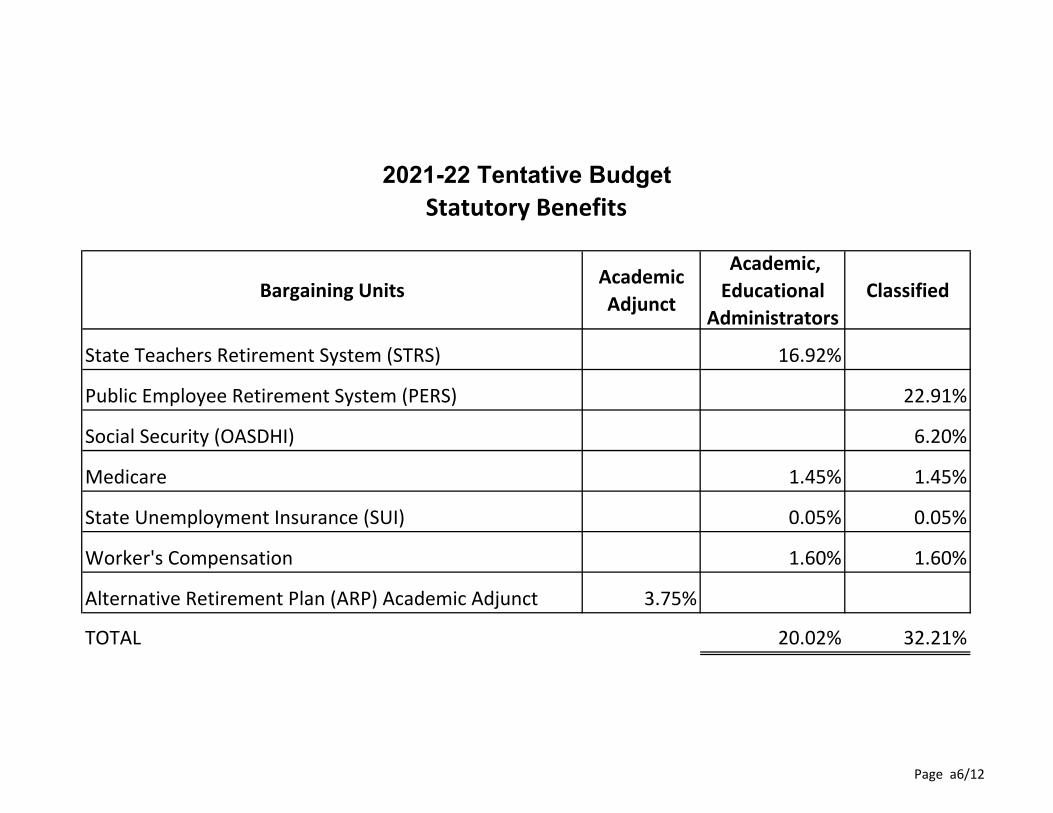
2021-22 Tentative Budget Statutory Benefits
Bargaining Units Academic Adjunct
Academic, Educational
Administrators Classified
State Teachers Retirement System (STRS) 16.92%
Public Employee Retirement System (PERS) 22.91%
Social Security (OASDHI) 6.20%
Medicare 1.45% 1.45%
State Unemployment Insurance (SUI) 0.05% 0.05%
Worker's Compensation 1.60% 1.60%
Alternative Retirement Plan (ARP) Academic Adjunct 3.75%
TOTAL 20.02% 32.21%
Page a6/12
-
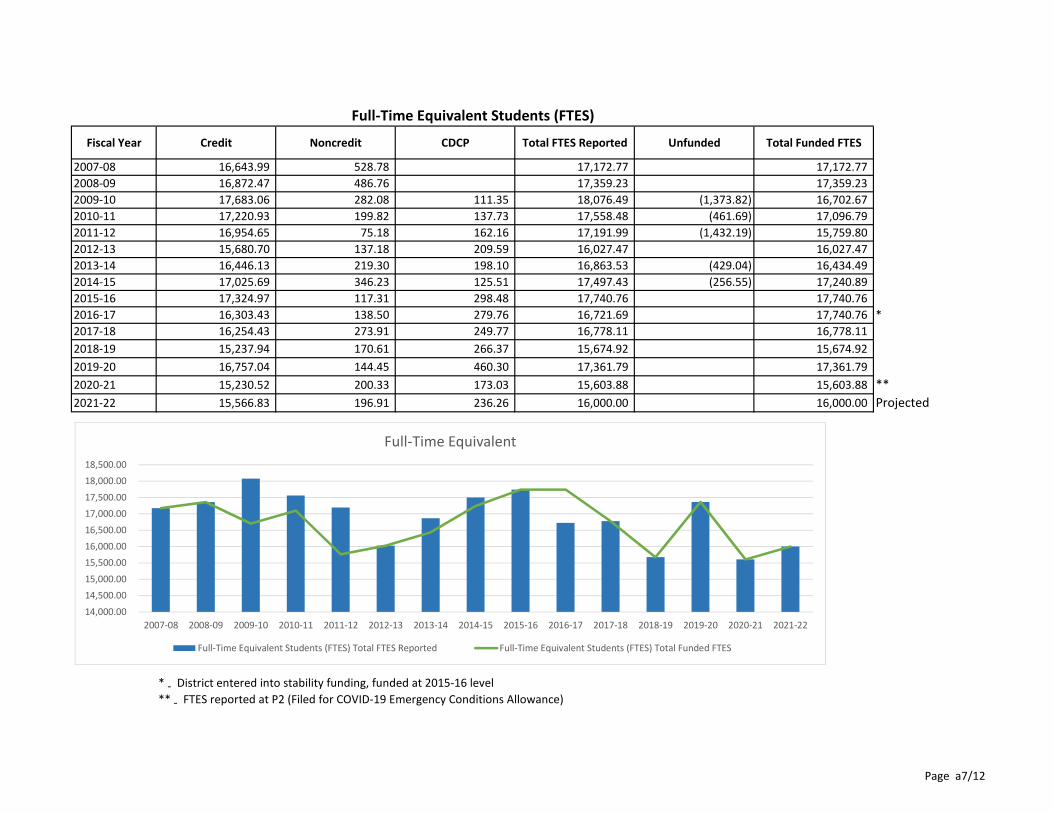
Fiscal Year Credit Noncredit CDCP Total FTES Reported Unfunded Total Funded FTES
2007‐08 16,643.99 528.78 17,172.77 17,172.77 2008‐09 16,872.47 486.76 17,359.23 17,359.23 2009‐10 17,683.06 282.08 111.35 18,076.49 (1,373.82) 16,702.67 2010‐11 17,220.93 199.82 137.73 17,558.48 (461.69) 17,096.79 2011‐12 16,954.65 75.18 162.16 17,191.99 (1,432.19) 15,759.80 2012‐13 15,680.70 137.18 209.59 16,027.47 16,027.47 2013‐14 16,446.13 219.30 198.10 16,863.53 (429.04) 16,434.49 2014‐15 17,025.69 346.23 125.51 17,497.43 (256.55) 17,240.89 2015‐16 17,324.97 117.31 298.48 17,740.76 17,740.76 2016‐17 16,303.43 138.50 279.76 16,721.69 17,740.76 2017‐18 16,254.43 273.91 249.77 16,778.11 16,778.11 2018‐19 15,237.94 170.61 266.37 15,674.92 15,674.92
2019‐20 16,757.04 144.45 460.30 17,361.79 17,361.79
2020‐21 15,230.52 200.33 173.03 15,603.88 15,603.88
2021‐22 15,566.83 196.91 236.26 16,000.00 16,000.00
Full‐Time Equivalent Students (FTES)
*
** Projected
14,000.00
14,500.00
15,000.00
15,500.00
16,000.00
16,500.00
17,000.00
17,500.00
18,000.00
18,500.00
2007‐08 2008‐09 2009‐10 2010‐11 2011‐12 2012‐13 2013‐14 2014‐15 2015‐16 2016‐17 2017‐18 2018‐19 2019‐20 2020‐21 2021‐22
Full‐Time Equivalent
Full‐Time Equivalent Students (FTES) Total FTES Reported Full‐Time Equivalent Students (FTES) Total Funded FTES
* ‐ District entered into stability funding, funded at 2015‐16 level ** ‐ FTES reported at P2 (Filed for COVID‐19 Emergency Conditions Allowance)
Page a7/12
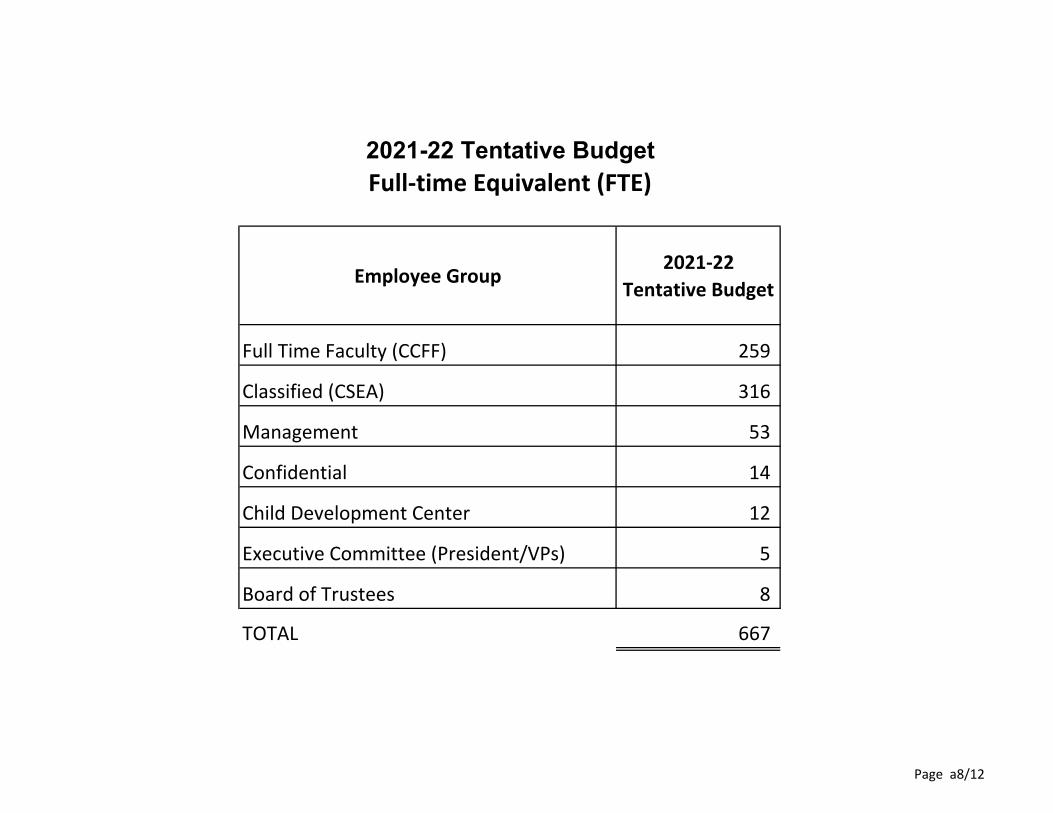
2021-22 Tentative Budget Full‐time Equivalent (FTE)
Employee Group 2021‐22
Tentative Budget
Full Time Faculty (CCFF) 259
Classified (CSEA) 316
Management 53
Confidential 14
Child Development Center 12
Executive Committee (President/VPs) 5
Board of Trustees 8
TOTAL 667
Page a8/12
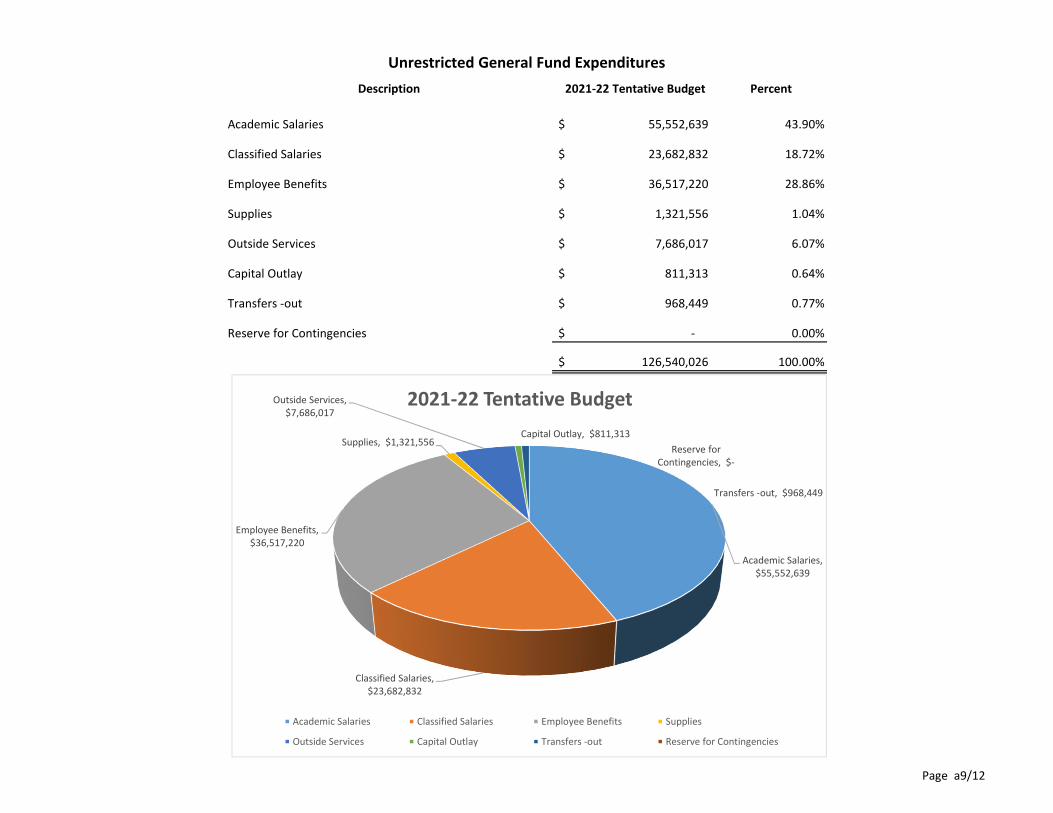
Unrestricted General Fund Expenditures Description 2021‐22 Tentative Budget Percent
Academic Salaries $ 55,552,639 43.90%
Classified Salaries $ 23,682,832 18.72%
Employee Benefits $ 36,517,220 28.86%
Supplies $ 1,321,556 1.04%
Outside Services $ 7,686,017 6.07%
Capital Outlay $ 811,313 0.64%
Transfers ‐out $ 968,449 0.77%
Reserve for Contingencies $ ‐ 0.00%
$ 126,540,026 100.00%
Academic Salaries, $55,552,639
Classified Salaries, $23,682,832
Employee Benefits, $36,517,220
Supplies, $1,321,556
Outside Services, $7,686,017
Capital Outlay, $811,313
Transfers ‐out, $968,449
Reserve for Contingencies, $‐
2021‐22 Tentative Budget
Academic Salaries Classified Salaries Employee Benefits Supplies
Outside Services Capital Outlay Transfers ‐out Reserve for Contingencies
Page a9/12
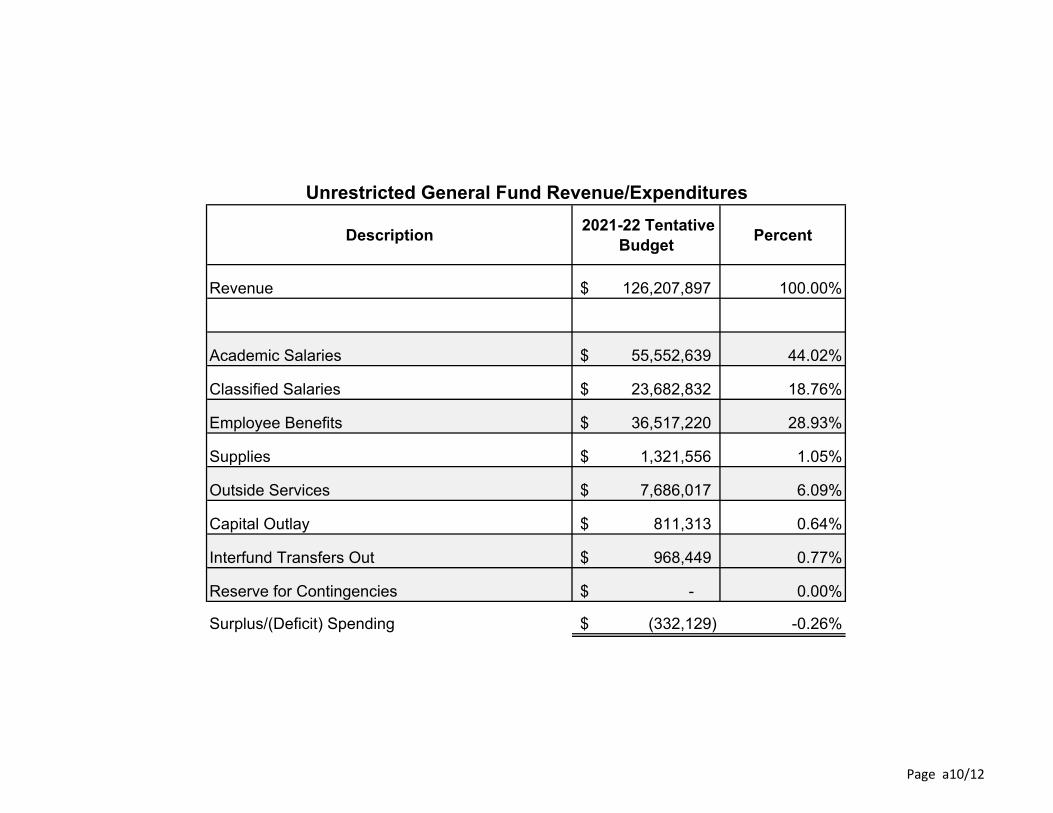
Unrestricted General Fund Revenue/Expenditures
Description 2021-22 Tentative Budget Percent
Revenue $ 126,207,897 100.00%
Academic Salaries $ 55,552,639 44.02%
Classified Salaries $ 23,682,832 18.76%
Employee Benefits $ 36,517,220 28.93%
Supplies $ 1,321,556 1.05%
Outside Services $ 7,686,017 6.09%
Capital Outlay $ 811,313 0.64%
Interfund Transfers Out $ 968,449 0.77%
Reserve for Contingencies $ - 0.00%
Surplus/(Deficit) Spending $ (332,129) -0.26%
Page a10/12

OTHER POST EMPLOYEMENT BENEFITS (OPEB) - HEALTHCARE
Description
Estimated Fund Balance as of June 30, 2020 $ 12,927,501
Actuarial Study as of September 11, 2020 - Net OPEB Liability (NOL) $ 23,795,966
Actuarial Study as of May 10, 2021 - Net OPEB Liability (NOL) $ 29,910,771
Funds needed to fully fund OPEB liability $ 16,983,270
TOTAL $ 29,910,771
Page a11/12
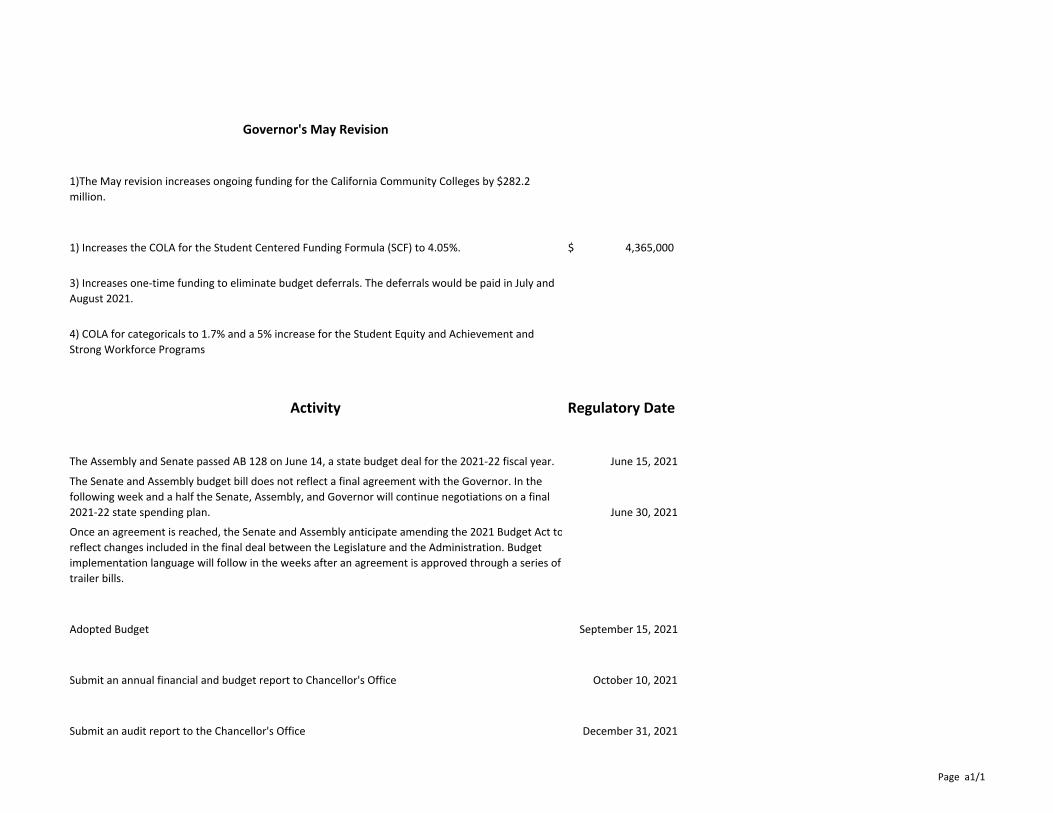
Governor's May Revision
1)The May revision increases ongoing funding for the California Community Colleges by $282.2 million.
1) Increases the COLA for the Student Centered Funding Formula (SCF) to 4.05%. $ 4,365,000
3) Increases one‐time funding to eliminate budget deferrals. The deferrals would be paid in July and August 2021.
4) COLA for categoricals to 1.7% and a 5% increase for the Student Equity and Achievement and Strong Workforce Programs
Activity Regulatory Date
The Assembly and Senate passed AB 128 on June 14, a state budget deal for the 2021‐22 fiscal year. June 15, 2021
The Senate and Assembly budget bill does not reflect a final agreement with the Governor. In the following week and a half the Senate, Assembly, and Governor will continue negotiations on a final 2021‐22 state spending plan. June 30, 2021
Once an agreement is reached, the Senate and Assembly anticipate amending the 2021 Budget Act to reflect changes included in the final deal between the Legislature and the Administration. Budget implementation language will follow in the weeks after an agreement is approved through a series of trailer bills.
Adopted Budget September 15, 2021
Submit an annual financial and budget report to Chancellor's Office October 10, 2021
Submit an audit report to the Chancellor's Office December 31, 2021
Page a1/1