ceria co-doped with calcium (ca) and strontium (sr): a potential candidate as a solid electrolyte...
TRANSCRIPT
ORIGINAL PAPER
Ceria co-doped with calcium (Ca) and strontium (Sr):a potential candidate as a solid electrolyte for intermediatetemperature solid oxide fuel cells
Nandini Jaiswal & Devendra Kumar & Shail Upadhyay &
Om Parkash
Received: 22 March 2013 /Revised: 5 June 2013 /Accepted: 6 June 2013# The Author(s) 2013. This article is published with open access at Springerlink.com
Abstract Co-doped samples of Ce0.95−xCa0.05SrxO1.95−x,where (x=0.00, 0.01, 0.02, and 0.03), have been preparedby auto-combustion method and characterized to exploretheir use as a solid electrolyte for intermediate temperaturesolid oxide fuel cells (IT-SOFCs). Crystal structure, micro-structure, and ionic conductivity have been characterized byX-ray diffraction, scanning electron microscopy, and imped-ance spectroscopy, respectively. All the compositions havebeen found to be single phase. Results show that the samplesco-doped with Ca and Sr exhibit higher ionic conductivitythan the samples singly doped with Ca in the intermediatetemperature range. Ce0.93Ca0.05Sr0.02O2−δ exhibits maxi-mum conductivity among all the compositions. This maybe a potential candidate as a solid electrolyte for IT-SOFCs.
Keywords Doped ceria electrolyte .Co-doping effect . Ionicconductivity . Solid oxide fuel cells
Introduction
Oxide ion conductors are used in oxygen sensors [1–3] andsolid oxide fuel cells (SOFCs) [4–6]. Among these applica-tions, SOFCs are especially developed as a clean and effi-cient power source for generating electricity from a variety offuels. For the commercial application of the SOFCs for the
distributed heat-power co-generation, an operation tempera-ture in the range 500–700 °C is highly desirable. This is inview of the cost effectiveness because inexpensive stainlesssteel may be used for this purpose.
Doped ceria electrolytes have attracted great interest inrecent years because of their potential as a solid electrolytefor intermediate temperature solid oxide fuel cells (IT-SOFCs)application [7]. In CeO2, temperature facilitates movement ofoxygen ions through oxygen vacancies which are produced inthe oxygen sublattice to neutralize the deficiency of chargecreated by lower valent dopant cations. Doped ceria oxidesshow much higher ionic conductivity at relatively low tem-peratures (500–700 °C) as compared with yttria-stabilizedzirconia. These have been extensively studied as the mostpromising electrolyte materials for IT-SOFCs. Among thevarious ceria compositions investigated so far [8–19], Gd-and Sm-doped ceria (GDC and SDC) are considered as themost suitable low-temperature solid electrolytes for IT-SOFCsapplication. Both Gd2O3 and Sm2O3, however, are very cost-ly. Therefore, there is an increasing interest to develop newcost-effective ceria-based electrolytes.
Ceria doped with alkaline earth oxides such as CaO [20, 21]and SrO [22, 23] has been studied extensively. Electrical con-ductivity of CaO- and SrO-doped ceria is much higher than thatof undoped ceria. The highest conductivity was found in thecomposition Ce0.90Ca0.10O1.90 by Shing et al. [24] which is∼10−3 S cm−1 at 600 °C. Yamashita et al. [25] found that thecomposition Ce0.90Ca0.10O1.90 has the highest conductivitywhich is ∼10−2 S cm−1 at 600 °C. Banerjee et al. [26] studiedthe electrical properties of Ce1−xCaxO2−δ (0.05≤x≤0.20) sam-ples prepared by a mixed fuel process followed by sintering at1,250 °C. They found that the composition Ce0.80Ca0.20O1.80
exhibits the highest conductivity (1.29×10⁻² S cm−1) at 600 °C.Compositions Ce1−xCaxO2−δ with 0.05≤x≤0.20 have beenprepared by auto-combustion method and characterized.
N. Jaiswal :D. Kumar :O. Parkash (*)Department of Ceramic Engineering, Indian Institute ofTechnology, Banaras Hindu University, Varanasi 221005, Indiae-mail: [email protected]
S. Upadhyay :O. ParkashDepartment of Applied Physics, Indian Institute of Technology,Banaras Hindu University, Varanasi 221005, India
IonicsDOI 10.1007/s11581-013-0936-8
Ce0.95Ca0.05O1.95 exhibits the maximum conductivity in thissystem. Composition exhibiting maximum conductivity in thissystem has been reported to be different by different authors.This may be due to minor changes in the purity of rawmaterialsand mainly changes in the processing conditions.
Co-doping of ceria has been found to be very effective forenhancement of conductivity in recent years [27–37]. Most ofthese compounds contain rare earth elements as a constituent. In
the present investigations, effect of co-doping has been studiedusing Sr as a co-dopant in the composition Ce0.95Ca0.05O1.95,which exhibits the maximum conductivity in our investigationas mentioned above.
Co-doping with Sr in some rare earth singly dopedceria has been reported to enhance their conductivity[38–41]. In order to explore cheaper solid electrolyte for IT-SOFCs, a few samples of ceria co-doped with Ca and Sr, viz.
20 30 40 50 60 70 80
a
(420
)(3
31)
(400
)
(222
)(3
11)
(220
)
(200
)
(111
)
Inte
nsity
(Arb
t.Un
it)
2θ (Degree)
b
c
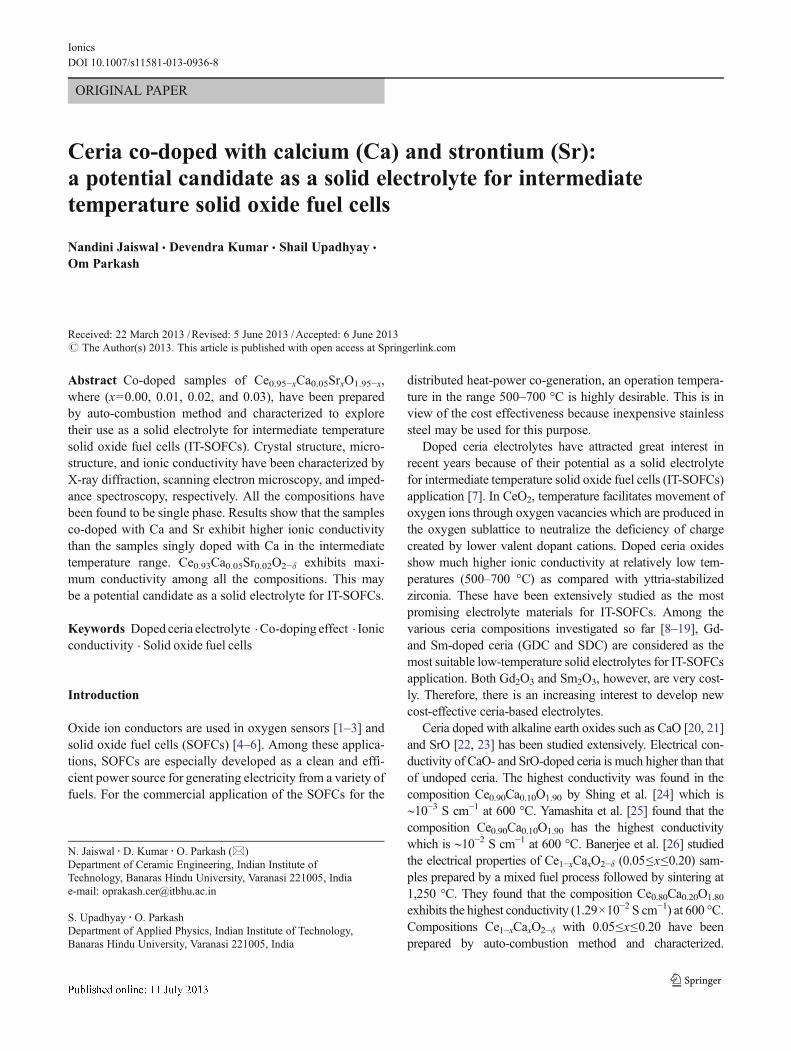
dFig. 1 Powder X-raydiffraction patterns of variouscompositions. a CCO5. bCC5S1. c CC5S2. d CC5S3sintered at 1,350 °C
Ionics
Ce0.95Ca0.05O1.95 (CCO5), Ce0.94Ca0.05Sr0.01O1.94 (CC5S1),Ce0.93Ca0.05Sr0.02O1.93 (CC5S2), and Ce0.92Ca0.05Sr0.03O1.92
(CC5S3), have been synthesized by citrate–nitrate route andcharacterized. Our results show that there is an enhancement inionic conductivity by co-doping.
Experimental
Sample preparation
Starting chemicals used for the synthesis were ceric ammoniumnitrate (NH4)2[Ce(NO3)6], (Qualikems, India; 99.00 %), calci-um carbonate (Reidel, India; >99.5 % purity), strontium nitrate(Reidel, India; >99.5 % purity), and citric acid (Loba Chemie,
India; 99.5 %) for the synthesis of powders. Aqueous solutionsof metal nitrates were mixed with an aqueous solution of citricacid maintaining a constant citrate to nitrate ratio of 0.3 [42].The mixed solution was evaporated with continuous stirring at200±5 °C until it gelled and finally burnt. Within a few seconds,the combustion reaction completed giving yellow porous ashfilling the container. The ashwas calcined at 600 °C in air for 4 h.Calcined powder was uniaxially pressed under a load of 70 kNinto green pellets having 15mmdiameter. The green pellets weresintered at 1,350 °C for 4 h in air.
Sample characterization
Crystal structure of sintered powder was determined using aRigaku high-resolution powder X-ray diffractometer employing
Table 1 Crystallite size, lattice parameter, and percent theoretical density of compositions in the system Ce0.95−xCa0.05SrxO1.95−x
S. no. Compositions Crystallite size ofsintered powder (nm)
Lattice parameter (Å) Experimentaldensity (g/cc)
Percent of theoreticaldensity
1. Ce0.95Ca0.05O1.95 56 5.4120±0.0003 6.60±0.02 97.0
2. Ce0.94Ca0.05Sr0.01O1.94 47 5.4174±0.0002 6.69±0.02 98.3
3. Ce0.93Ca0.05Sr0.02O1.93 57 5.4192±0.0002 6.70±0.03 98.5
4. Ce0.92Ca0.05Sr0.03O1.92 55 5.4201±0.0006 6.62±0.03 97.5
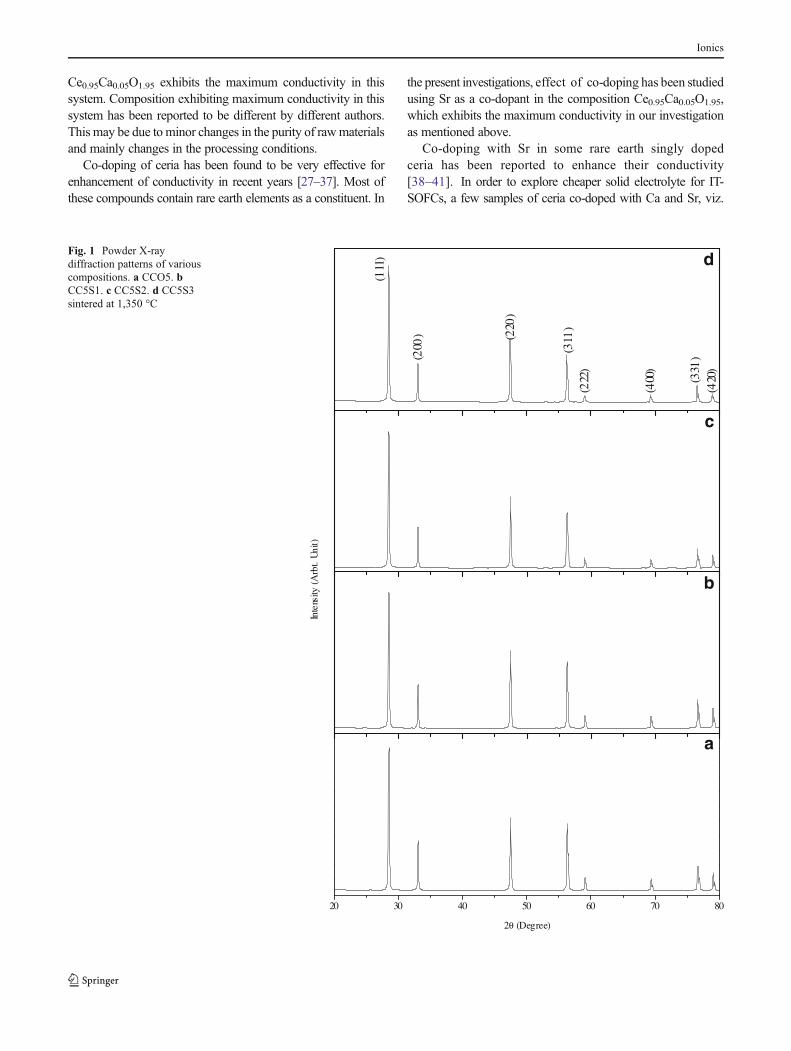
Fig. 2 Scanning electronmicrographs of variouscompositions. a CCO5. bCC5S1. c CC5S2. d CC5S3thermally etched at 1,250 °C
Ionics
Cu Kα1 radiation and Ni filter. Data were collected in the Braggangle range of 20°≤2θ≤80°. The crystallite size, D of thesintered powder, was determined using Scherrer’s formula:
D ¼ 0:9λβcosθ
ð1Þ
where β is the full width at half maxima excluding instrumentalbroadening, λ is the wave length of X-ray radiation, and θ is theBragg angle. β is taken for the strongest Bragg’s peak corre-sponding to (111) reflection for all the samples. Lattice param-eters were calculated using “Unit Cell” software [43]. Densityof sintered pellets was determined by Archimedes method andexpressed as percentage of theoretical density determined fromthe lattice parameter and molecular weight of the compound.Sintered pellets were polished using emery papers of grade 1/0,2/0, 3/0, and 4/0 (Sia, Switzerland) followed by polishing on avelvet cloth using diamond paste of grade1/4-OS-475 (HIFIN).Then, these were etched thermally at 1,250 °C. Micrographswere taken with the help of a scanning electron microscope(INSPECT 50 FEI').
Conductivity measurement
For conductivity measurements, Ag paste was applied on bothsurfaces of the pellet. The paint was cured at 700 °C for 15 minto form silver electrodes. Conductivity was determined byimpedance spectroscopy. Impedance measurements were madeusing a Novocontrol Alpha-A High-Performance FrequencyAnalyzer with an applied voltage of 20 mV in air in the temper-ature and frequency range 200–600 °C and 1 Hz to 1 MHz,respectively. Data were collected using “Win data” program andfitted to the corresponding equivalent circuit using ZViewsoftware.
Results and discussion
Crystal structure
Figure 1 shows X-ray diffraction patterns of the powders ofsintered pellets for the systemCe0.95−xCa0.05SrxO1.95−x (x=0.00,0.01, 0.02, and 0.03). Characteristic lines of constituent oxidesare not observed in the diffraction patterns. All the samples aresingle phase having cubic fluorite structure. X-ray diffraction(XRD) patterns of the calcined powders are similar to thoseobtained after sintering except that the diffraction lines becomesharper as shown in Fig. 1. This is due to grain growth occur-ring during sintering. There is a slight shift in 2θ values from thecorresponding 2θ values of undoped ceria. Diffraction patternswere indexed on the basis of fluorite structure similar to CeO2
using JCPDS file no. 43–1002. Lattice parameter of all thesamples is given in Table 1. Lattice parameter is found to
increase with strontium content because ionic radius of Sr2+
(1.26Ǻ) is larger than that of Ce4+ (0.97Ǻ) and Ca2+ (1.12Ǻ)[44]. Crystallite size, D of the calcined powder calculated fromX-ray line broadening using Scherrer’s formula, is in the range47–57 nm. Density of the sintered pellets of all the samples,determined by Archimedes principle, is more than 97 % of thetheoretical density (Table 1).
Figure 2 shows micrographs of thermally etched samplesat 1,250 °C. Micrographs of the surface of the sinteredsamples show well-defined grains separated by grain bound-aries. All sintered samples have grains with varying sizes. Asstrontium content increases, a narrowing of grain size distri-bution is observed. Average grain size of the compositionswith x=0.00, 0.01, 0.02, and 0.03 determined by linearintercept method is approx. 6.0, 2.5, 2.0, and 1.5 μm, re-spectively. It is observed from Fig. 2 that average grain sizedecreases with increasing concentration of Sr, indicating thatSr acts as a grain growth inhibitor. This may be due tosegregation of Sr2+ at grain boundaries due to elastic strainarising out of size mismatch of Sr2+ and Ce4+. Whenever wedope a material with another ion, two types of strains aredeveloped. Elastic strain arises due to difference between theionic radii of the host ion and dopant ion. Electrostatic strainarises due to difference in their valency. Both these strainslead to increase in the energy of the materials. Grain bound-aries are regions of high energy because of disorder presentin them. Therefore, the dopant ions can be accommodated inthe grain boundaries with minimum expenditure of extraenergy, i.e., dopants tend to segregate to the grain bound-aries. In the present materials, the excess concentration ofdopants (Sr2+ in this case) may not be enough at grainboundaries so that it appears as a different phase in XRD.This can however be studied by using EDX and electronmicroprobe analysis.
0 20
1
2
3
-Z''
(105
ohm
)
Z' (105 ohm)
CCO5CC5S1CC5S2CC5S3
31
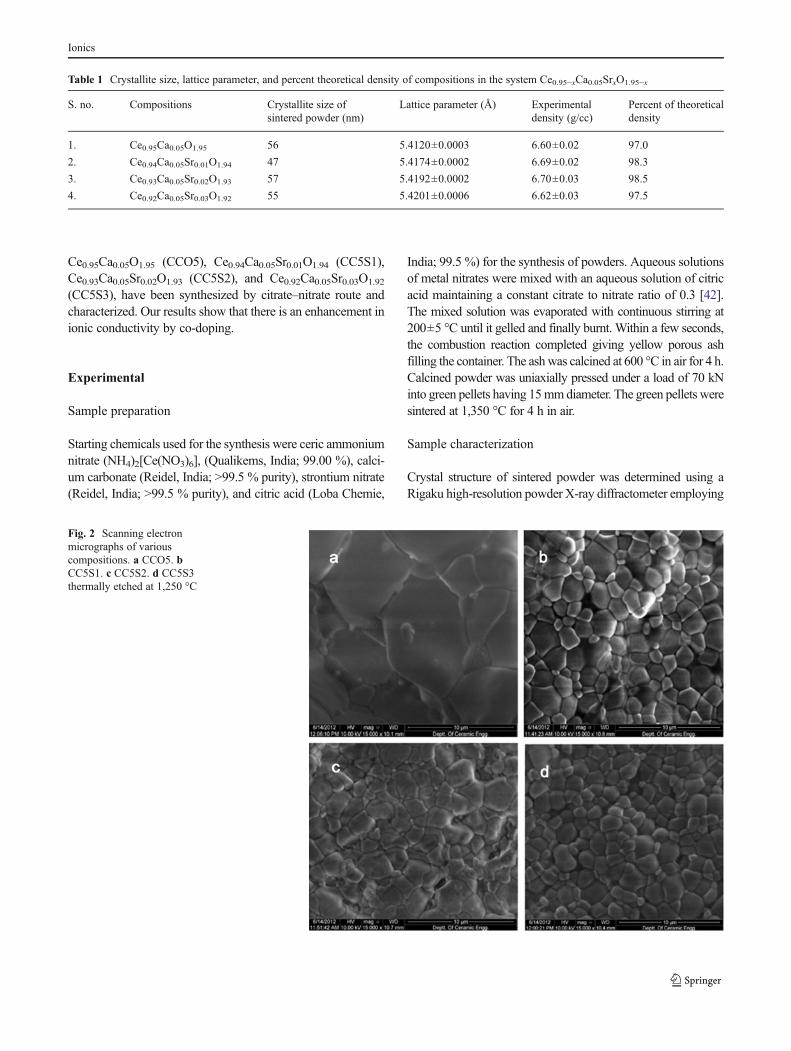
Fig. 3 Impedance plots of all the compositions in the system Ce0.95−xCa0.05SrxO1.95−x at 200 °C
Ionics

Fig. 4 Impedance plots of the composition CC5S2 at a 200 °C, b 250 °C, c 325 °C, d 375 °C, e 425 °C, and f 500 °C
Ionics
Electrical conductivity
Conductivity of doped ceria in air has been reported to becompletely ionic in nature [34]. In this paper, the conductivitymeasured in air can be treated as oxide ion conductivity.Electrical conductivity of the samples was studied using com-plex plane impedance analysis. Complex plane impedanceplots at 200 °C of all the compositions studied are shown inFig. 3. Impedance plots of CC5S2 composition at differenttemperatures are plotted in Fig. 4. Typically, three arcs areobserved in the complex plane impedance plots of polycrys-talline materials. The arc present in the highest frequencyrange is attributed to intragrain behavior, one in the interme-diate frequencies is attributed to grain boundaries, and thethird arc in the lowest frequency range is assigned to elec-trode–electrolyte interface polarization. Impedance plots at200 °C (Fig. 3) exhibit two distinct arcs corresponding tograins and grain boundaries, and a third arc corresponding toelectrode–electrolyte interface starts appearing. As the tem-perature increases, the arcs shift to higher frequency leading to
disappearance of the arcs due to contributions of grains andgrain boundaries. The grain arc disappeared at temperatureabove 325 °C, and beyond 450 °C, grain boundary arc alsodisappeared. At higher temperatures, only electrode arc ap-pears. All the three arcs are not clearly seen in the impedanceplots at all temperatures because of limited frequency rangeavailable in the equipment. The grains and grain boundariesarcs are associated with the capacitances in the pF (10−10–10−12) and nF (10−7–10−9) ranges [45]. These are determinedfrom the relation 2πfmaxRC=1, where fmax is the applied fre-quency at the arc maximum, R is the resistance, and C is thecapacitance of a particular contribution. In order to see clearlythe contribution of the grain boundaries, the data is plotted onan expanded scale in the insets. Impedance spectra were fittedusing the equivalent circuit containing two parallel resistance(R)—constant phase element (CPE) circuits connected in seriesone for the bulk and other for the grain boundaries. In thepresent analysis, a CPE [46] is used for fitting the data insteadof a capacitor (Fig. 4). The CPE accounts for the microstruc-ture inhomogeneity within the sample, and it is equivalent to a
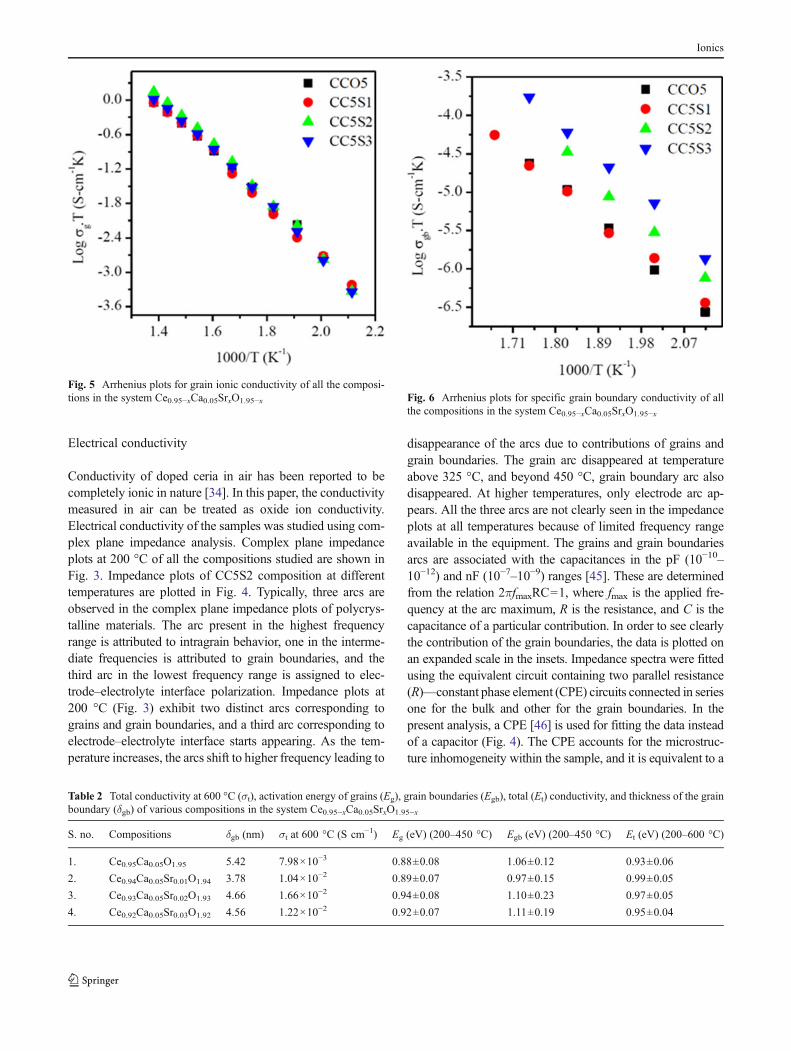
Fig. 5 Arrhenius plots for grain ionic conductivity of all the composi-tions in the system Ce0.95−xCa0.05SrxO1.95−x
Table 2 Total conductivity at 600 °C (σt), activation energy of grains (Eg), grain boundaries (Egb), total (Et) conductivity, and thickness of the grainboundary (δgb) of various compositions in the system Ce0.95−xCa0.05SrxO1.95−x
S. no. Compositions δgb (nm) σt at 600 °C (S cm−1) Eg (eV) (200–450 °C) Egb (eV) (200–450 °C) Et (eV) (200–600 °C)
1. Ce0.95Ca0.05O1.95 5.42 7.98×10⁻³ 0.88±0.08 1.06±0.12 0.93±0.06
2. Ce0.94Ca0.05Sr0.01O1.94 3.78 1.04×10⁻² 0.89±0.07 0.97±0.15 0.99±0.05
3. Ce0.93Ca0.05Sr0.02O1.93 4.66 1.66×10⁻² 0.94±0.08 1.10±0.23 0.97±0.05
4. Ce0.92Ca0.05Sr0.03O1.92 4.56 1.22×10⁻² 0.92±0.07 1.11±0.19 0.95±0.04
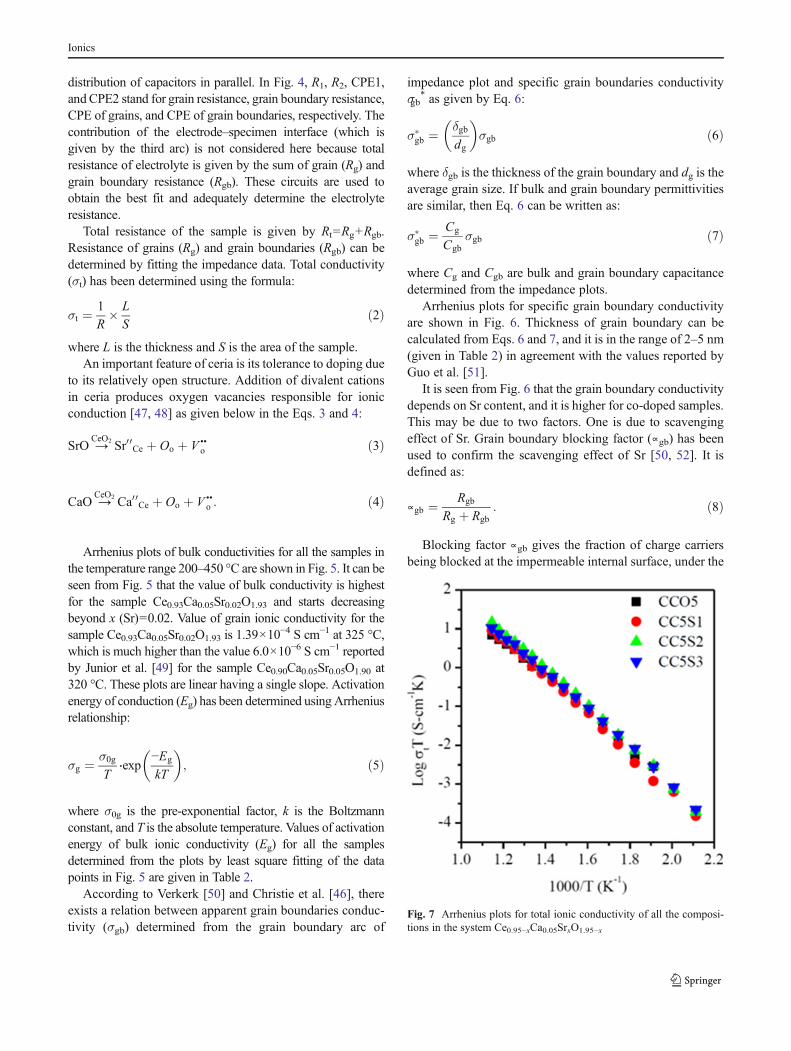
Fig. 6 Arrhenius plots for specific grain boundary conductivity of allthe compositions in the system Ce0.95−xCa0.05SrxO1.95−x
Ionics
distribution of capacitors in parallel. In Fig. 4, R1, R2, CPE1,and CPE2 stand for grain resistance, grain boundary resistance,CPE of grains, and CPE of grain boundaries, respectively. Thecontribution of the electrode–specimen interface (which isgiven by the third arc) is not considered here because totalresistance of electrolyte is given by the sum of grain (Rg) andgrain boundary resistance (Rgb). These circuits are used toobtain the best fit and adequately determine the electrolyteresistance.
Total resistance of the sample is given by Rt=Rg+Rgb.Resistance of grains (Rg) and grain boundaries (Rgb) can bedetermined by fitting the impedance data. Total conductivity(σt) has been determined using the formula:
σt ¼ 1
R� L
Sð2Þ
where L is the thickness and S is the area of the sample.An important feature of ceria is its tolerance to doping due
to its relatively open structure. Addition of divalent cationsin ceria produces oxygen vacancies responsible for ionicconduction [47, 48] as given below in the Eqs. 3 and 4:
SrO →CeO2 Sr00Ce þ Oo þ V ••
o ð3Þ
CaO →CeO2 Ca00Ce þ Oo þ V ••
o : ð4Þ
Arrhenius plots of bulk conductivities for all the samples inthe temperature range 200–450 °C are shown in Fig. 5. It can beseen from Fig. 5 that the value of bulk conductivity is highestfor the sample Ce0.93Ca0.05Sr0.02O1.93 and starts decreasingbeyond x (Sr)=0.02. Value of grain ionic conductivity for thesample Ce0.93Ca0.05Sr0.02O1.93 is 1.39×10
−4 S cm−1 at 325 °C,which is much higher than the value 6.0×10⁻⁶ S cm−1 reportedby Junior et al. [49] for the sample Ce0.90Ca0.05Sr0.05O1.90 at320 °C. These plots are linear having a single slope. Activationenergy of conduction (Eg) has been determined using Arrheniusrelationship:
σg ¼ σ0g
T⋅exp
−Eg
kT
� �; ð5Þ
where σ0g is the pre-exponential factor, k is the Boltzmannconstant, and T is the absolute temperature. Values of activationenergy of bulk ionic conductivity (Eg) for all the samplesdetermined from the plots by least square fitting of the datapoints in Fig. 5 are given in Table 2.
According to Verkerk [50] and Christie et al. [46], thereexists a relation between apparent grain boundaries conduc-tivity (σgb) determined from the grain boundary arc of
impedance plot and specific grain boundaries conductivityσgb
* as given by Eq. 6:
σ�gb ¼
δgbdg
� �σgb ð6Þ
where δgb is the thickness of the grain boundary and dg is theaverage grain size. If bulk and grain boundary permittivitiesare similar, then Eq. 6 can be written as:
σ�gb ¼
Cg
Cgbσgb ð7Þ
where Cg and Cgb are bulk and grain boundary capacitancedetermined from the impedance plots.
Arrhenius plots for specific grain boundary conductivityare shown in Fig. 6. Thickness of grain boundary can becalculated from Eqs. 6 and 7, and it is in the range of 2–5 nm(given in Table 2) in agreement with the values reported byGuo et al. [51].
It is seen from Fig. 6 that the grain boundary conductivitydepends on Sr content, and it is higher for co-doped samples.This may be due to two factors. One is due to scavengingeffect of Sr. Grain boundary blocking factor (∝gb) has beenused to confirm the scavenging effect of Sr [50, 52]. It isdefined as:
∝gb ¼ Rgb
Rg þ Rgb: ð8Þ
Blocking factor ∝gb gives the fraction of charge carriersbeing blocked at the impermeable internal surface, under the
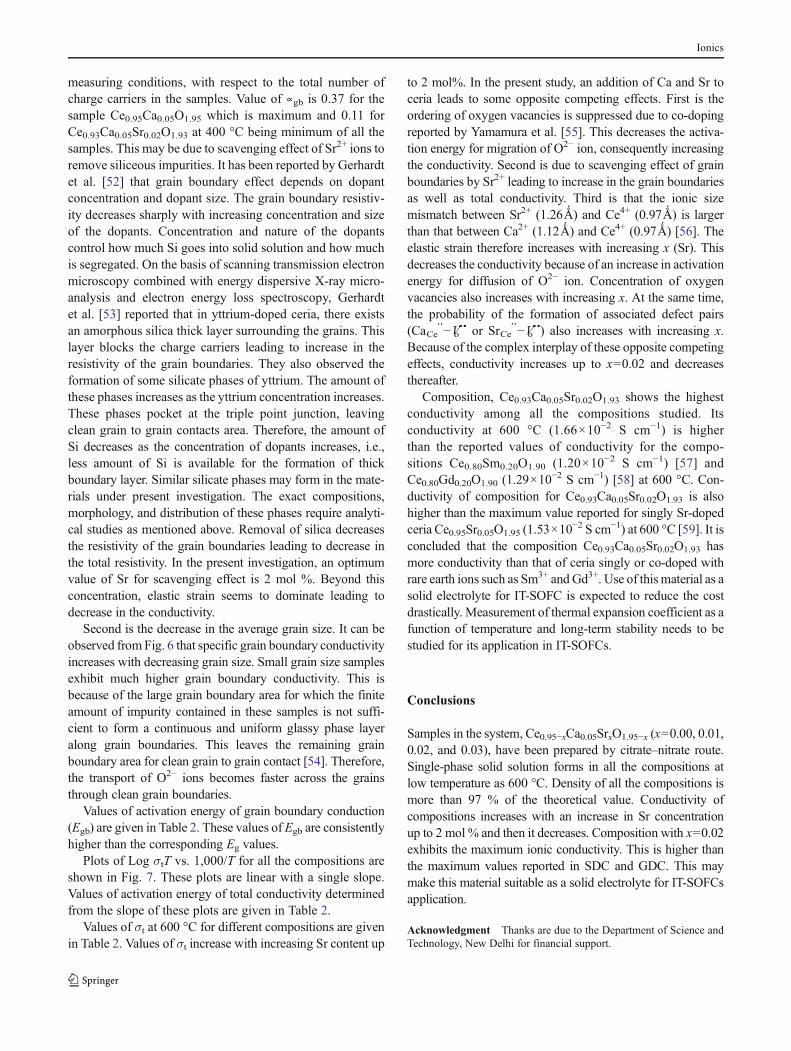
Fig. 7 Arrhenius plots for total ionic conductivity of all the composi-tions in the system Ce0.95−xCa0.05SrxO1.95−x
Ionics
measuring conditions, with respect to the total number ofcharge carriers in the samples. Value of ∝gb is 0.37 for thesample Ce0.95Ca0.05O1.95 which is maximum and 0.11 forCe0.93Ca0.05Sr0.02O1.93 at 400 °C being minimum of all thesamples. This may be due to scavenging effect of Sr2+ ions toremove siliceous impurities. It has been reported by Gerhardtet al. [52] that grain boundary effect depends on dopantconcentration and dopant size. The grain boundary resistiv-ity decreases sharply with increasing concentration and sizeof the dopants. Concentration and nature of the dopantscontrol how much Si goes into solid solution and how muchis segregated. On the basis of scanning transmission electronmicroscopy combined with energy dispersive X-ray micro-analysis and electron energy loss spectroscopy, Gerhardtet al. [53] reported that in yttrium-doped ceria, there existsan amorphous silica thick layer surrounding the grains. Thislayer blocks the charge carriers leading to increase in theresistivity of the grain boundaries. They also observed theformation of some silicate phases of yttrium. The amount ofthese phases increases as the yttrium concentration increases.These phases pocket at the triple point junction, leavingclean grain to grain contacts area. Therefore, the amount ofSi decreases as the concentration of dopants increases, i.e.,less amount of Si is available for the formation of thickboundary layer. Similar silicate phases may form in the mate-rials under present investigation. The exact compositions,morphology, and distribution of these phases require analyti-cal studies as mentioned above. Removal of silica decreasesthe resistivity of the grain boundaries leading to decrease inthe total resistivity. In the present investigation, an optimumvalue of Sr for scavenging effect is 2 mol %. Beyond thisconcentration, elastic strain seems to dominate leading todecrease in the conductivity.
Second is the decrease in the average grain size. It can beobserved from Fig. 6 that specific grain boundary conductivityincreases with decreasing grain size. Small grain size samplesexhibit much higher grain boundary conductivity. This isbecause of the large grain boundary area for which the finiteamount of impurity contained in these samples is not suffi-cient to form a continuous and uniform glassy phase layeralong grain boundaries. This leaves the remaining grainboundary area for clean grain to grain contact [54]. Therefore,the transport of O2− ions becomes faster across the grainsthrough clean grain boundaries.
Values of activation energy of grain boundary conduction(Egb) are given in Table 2. These values of Egb are consistentlyhigher than the corresponding Eg values.
Plots of Log σtT vs. 1,000/T for all the compositions areshown in Fig. 7. These plots are linear with a single slope.Values of activation energy of total conductivity determinedfrom the slope of these plots are given in Table 2.
Values of σt at 600 °C for different compositions are givenin Table 2. Values of σt increase with increasing Sr content up
to 2 mol%. In the present study, an addition of Ca and Sr toceria leads to some opposite competing effects. First is theordering of oxygen vacancies is suppressed due to co-dopingreported by Yamamura et al. [55]. This decreases the activa-tion energy for migration of O2− ion, consequently increasingthe conductivity. Second is due to scavenging effect of grainboundaries by Sr2+ leading to increase in the grain boundariesas well as total conductivity. Third is that the ionic sizemismatch between Sr2+ (1.26Ǻ) and Ce4+ (0.97Ǻ) is largerthan that between Ca2+ (1.12Ǻ) and Ce4+ (0.97Ǻ) [56]. Theelastic strain therefore increases with increasing x (Sr). Thisdecreases the conductivity because of an increase in activationenergy for diffusion of O2− ion. Concentration of oxygenvacancies also increases with increasing x. At the same time,the probability of the formation of associated defect pairs(CaCe
′ ′−Vo•• or SrCe′ ′−Vo••) also increases with increasing x.Because of the complex interplay of these opposite competingeffects, conductivity increases up to x=0.02 and decreasesthereafter.
Composition, Ce0.93Ca0.05Sr0.02O1.93 shows the highestconductivity among all the compositions studied. Itsconductivity at 600 °C (1.66×10⁻² S cm−1) is higherthan the reported values of conductivity for the compo-sitions Ce0.80Sm0.20O1.90 (1.20×10⁻² S cm−1) [57] andCe0.80Gd0.20O1.90 (1.29×10
−2 S cm−1) [58] at 600 °C. Con-ductivity of composition for Ce0.93Ca0.05Sr0.02O1.93 is alsohigher than the maximum value reported for singly Sr-dopedceria Ce0.95Sr0.05O1.95 (1.53×10
−2 S cm−1) at 600 °C [59]. It isconcluded that the composition Ce0.93Ca0.05Sr0.02O1.93 hasmore conductivity than that of ceria singly or co-doped withrare earth ions such as Sm3+ and Gd3+. Use of thismaterial as asolid electrolyte for IT-SOFC is expected to reduce the costdrastically. Measurement of thermal expansion coefficient as afunction of temperature and long-term stability needs to bestudied for its application in IT-SOFCs.
Conclusions
Samples in the system, Ce0.95−xCa0.05SrxO1.95−x (x=0.00, 0.01,0.02, and 0.03), have been prepared by citrate–nitrate route.Single-phase solid solution forms in all the compositions atlow temperature as 600 °C. Density of all the compositions ismore than 97 % of the theoretical value. Conductivity ofcompositions increases with an increase in Sr concentrationup to 2 mol % and then it decreases. Composition with x=0.02exhibits the maximum ionic conductivity. This is higher thanthe maximum values reported in SDC and GDC. This maymake this material suitable as a solid electrolyte for IT-SOFCsapplication.
Acknowledgment Thanks are due to the Department of Science andTechnology, New Delhi for financial support.
Ionics

Open Access This article is distributed under the terms of the CreativeCommons Attribution License which permits any use, distribution, andreproduction in any medium, provided the original author(s) and thesource are credited.
References
1. Arai H (1992) Oxygen ion conductor and its application. J BullCeram Soc Jpn 27:100–104
2. Miura N, Kurosawa H, Hasei M, Lu G, Yamazoe N (1996) Stabilizedzirconia-based sensor using oxide electrode for detection ofNOx in high-temperature combustion-exhausts. Solid State Ionics 86–88:1069–1073
3. Yamazoeand N, Miura N (1996) Prospect and problems of solidelectrolyte-based oxygenic gas sensors. Solid State Ionics 86–88:987–993
4. Minh NQ (1993) Ceramic fuel cells. J Am Ceram Soc 76:563–5885. Hibino T, Iwahara H (1994) Improvement of CAPCIUS cell using
SrCe0.95Yb0.05O3−α as a solid electrolyte. Chem Lett 35:485–4886. Sasaki H, Otoshi S, Suzuki M, Sogi T, Kajimura A, Sagiura N,
Ippommatsu M (1994) Fabrication of high power density tabulartype solid oxide fuel cells. Solid State Ionics 72:253–256
7. Inaba H, Tagawa H (1996) Ceria based solid electrolytes. SolidState Ionics 83:1–16
8. Stefanik ST, Tuller LH (2001) Ceria-based gas sensors. J Eur CeramSoc 21:1967–1970
9. Jurado JR (2001) Present several items on ceria-based ceramicelectrolytes: synthesis, additive effects, reactivity and electrochem-ical behavior. J Mater Sci 36:1133–1139
10. Kharton VV, Figueiredo FM, Navarro L, Naumovich EN,Kovalevsky AV, Yaremchenko AA, Viskup AP, Carneiro A,MarquesFMB, Frade JR (2001) Ceria based materials for solid oxide fuelcells. J Mater Sci 36:1105–1117
11. Doshi R, Richards VL, Carter JD, Wang X, Krumpelt M (1999)Development of solid oxide fuel cells that operate at 500°C. JElectrochem Soc 146:1273–1278
12. Godickemeier M, Gauckler LJ (1998) Engineering of solid oxidefuel cells with ceria-based electrolytes. J Electrochem Soc145:414–421
13. Zhu B, Liu X, Sun M, Ji Sun S (2003) Calcium doped ceria-basedmaterials for cost-effective intermediate temperature solid oxidefuel cells. J Solid State Sci 5:1127–1134
14. Bellon O, Sammes NM, Staniforth J (1998) Mechanical propertiesand electrochemical characterisation of extruded doped ceriumoxide for use as an electrolyte for solid oxide fuel cells. J PowerSources 75:116–121
15. Wang S, Kobayashi T, Dokiya M, Hashimoto T (2000) Electricaland ionic conductivity of Gd-doped ceria. J Electrochem Soc147:3606–3609
16. Wang Y, Mori T, Li JG, Yajima Y (2003) Low-temperature fabri-cation and electrical property of 10 mol% Sm2O3-doped CeO2
ceramics. Sci Technol Adv Mater 4:229–23817. KimDJ (1989) Ionic conductivities, and solubility limits in fluorite-
structure MO2 oxide [M=Hf4+, Zr4+, Ce4+, Th4+, U4+] solid solu-tions. J Am Ceram Soc 72:1415–1421
18. Yahiro H, Ohuchi T, Eguchi K, Arai H (1988) Electrical propertiesand microstructure in the system ceria-alkaline earth oxide. J MaterSci 23:1036–1041
19. Sameshima S, Ichikawa T, Kawaminami M, Hirata Y (1999) Ther-mal and mechanical properties of rare earth-doped ceria ceramics.Mater Chem Phys 61:31–35
20. Blumenthal RN, Pinz BA (1967) Nature of the electrical conduc-tion transients observed in CeO2 and Ca–doped CeO2. J Appl Phys38:2376–2378
21. Arai H, Kunisaki T, Shimizu Y, Seiyama T (1986) Electrical prop-erties of calcia-doped ceria with oxygen ion conduction. Solid StateIonics 20:241–248
22. Blumenthal RN, Garnier JE (1976) The electrical conductivity andthermodynamic behavior of SrO-doped nonstoichiometric ceriumdioxide. J Solid State Chem 16:21–34
23. Yahiro H, Eguchi K, Arai H (1986) AC conductivity and conductivityrelaxation studies in the CeO2–Y2O3 system. Solid State Ionics 21:49–53
24. Ong Poh Shing, Tan Yen Ping, and Taufiq Yap Yun Hin (2011)Mechanochemical synthesis and characterization of calcium dopedceria oxide ion conductor Material Science and Engineering 17:doi:10.1088/1757-899X/17/1/012017
25. Yamashita K, Ramanujachary KV, Greenblatt M (1995) Hydrother-mal synthesis and low temperature conduction properties ofsubstituted ceria ceramics. Solid State Ionics 81:53–60
26. Banerjee S, Devi PS (2008) Understanding the effect of calcium onthe properties of ceria prepared by a mixed fuel process. Solid StateIonics 179:661–669
27. Holtappels P, Poulsen FW, Mogensen M (2000) Electrical conduc-tivities and chemical stabilities of mixed conducting pyrochloresfor SOFC applications. Solid State Ionics 135:675–679
28. TullerHL, TullerH, Schoonman J, Riess I (2000)Oxygen ion andmixedconductors and their technological applications. In: Riess I (ed) Defectsand transport. Kluwer (NATO ASI series), Dordrecht, pp 245–270
29. Etsell H, Flengas SN (1970) The electrical properties of solid oxideelectrolytes. Chem Rev 70:339–376
30. Rickert H (1982) Electrochemistry of solids—an introduction.Springer-Verlag, Berlin
31. Chebotin VN, Perfilyev MV (1978) Electrochemistry of solid elec-trolytes. Khimiya, Moscow
32. Perfilyev MV, Demin AK, Kuzin BL, Lipilin AS (1988) High tem-perature electrolysis of gases. Nauka, Moscow
33. Kharton VV, Naumovich EN, Vecher AA (1999) Research on theelectrochemistry of oxygen ion conductors in the former Soviet UnionI ZrO2-based ceramic materials. J Solid State Electrochem 3:61–81
34. Inaba H, Tagawa H (1996) Ceria based electrolytes. Solid StateIonics 83:1–16
35. Bouwmeester HJM, Burggraaf AJ (1996) In: Burggraaf A, Cot L (eds)Fundamentals of inorganic membrane science and technology.Elsevier, Amsterdam, pp 435–528
36. Sammes NM, Tompsett GA, Nafe H, Aldinger F (1999) Bismuthbased oxide electrolytes—structure and ionic conductivity. J EurCeram Soc 19:1801–1826
37. Mogensen M, Sammes NM, Tompsett GA (2000) Physical chem-ical and electrochemical properties of pure and doped ceria. SolidState Ionics 129:63–94
38. Yeh T-H, Chou C-C (2007) Ionic conductivity investigation in sa-marium and strontium co-doped ceria system. Phys Scr 129:303–307
39. Cioatera N, Parvulescu V, Rolle A, Vannier RN (2009) Effect ofstrontium addition on europium-doped ceria properties. Solid StateIonics 180:681–687
40. ZhengY, LiqiangWet al (2009) The effect of Sr on the properties of Y-doped ceria electrolyte for IT-SOFCs. J Alloys Compd 486:586–589
41. Ramesh S, Vishnuvardhan Reddy C (2009) Electrical properties ofco-doped ceria electrolyte Ce0.8−xGd0.20SrxO2−δ (0.0<x<0.1). ActaPhys Polon A 115:909–912
42. Basu S, Sujata Devi P, Maiti HS (2004) Synthesis and properties ofnanocrystalline ceria powders. J Mater Res 19:3162–3171
43. Holland TJB, Redfern SAT (1997) Unit cell refinement from powderdiffraction data: the use of regression diagnostics.MineralMag 61:65–77
44. Shannon RD (1976) Revised effective ionic radii and systematicstudies of interatomic distances in halides and chalcogenides. ActaCrystallogr A 32:751–761
45. Hodge IM, Ingram MD, West AR (1976) Impedance and modulusspectroscopy of polycrystalline solid electrolytes. J Electro AnalChem 74:125–143
Ionics
46. Christie GM, Berkel FPF (1996) Microstructure-ionic conductivityrelationships in ceria-gadolinia electrolytes. Solid State Ionics83:17–27
47. Ruiz-Trejo E, Benitez-Rico A, Gomez-Reynoso S, Angeles-RosasM (2007) Nanoparticles and nano-grain sized Y-doped CeO2 ce-ramics. J Electrochem Soc 154:A258–A262
48. Wang DY, Norwick AS (1981) Dielectric relaxation from a networkof charged defects in dilute CeO2:Y2O3solid solutions. Solid StateIonics 5:551–555
49. Junior JMS et al (2012) Raman and Rietveld structure characteri-zation of sintered alkaline earth doped ceria. Mater Chem Phys135:957–964
50. Verkerk MJ, Middelhuis BJ, Burggraaf AJ (1982) Effect of grainboundaries on the conductivity of high-purity ZrO2-Y2O3 ceramics.Solid State Ionics 6:159–170
51. Guo X, Waser R (2006) Electrical properties of the grain bound-aries of oxygen ion conductors: acceptor doped zirconia and ceria.Prog Mater Sci 51:151–210
52. Gerhardt R, Nowick AS (1986) The grain boundary conductivityeffect in ceria doped with trivalent cations. Part-I electrical behav-ior. J Am Ceram Soc 69:641–646
53. Gerhardt R, Nowick AS, Mochel ME, Dumler I (1986) Grainboundary effect in ceria doped with trivalent cations: II microstruc-ture and microanalysis. J Am Ceram Soc 69:647–651
54. Tian C, Chan SW (2000) Ionic conductivities, sintering tempera-tures and microstructures of bulk ceramics CeO2 doped with Y2O3.Solid State Ionics 134:89–102
55. Yamamura H, Katoh E, Ichikawa M, Kakinuma K, Mori T, Haneda H(2000)Multiple doping effect on the electrical conductivity in the (Ce1-x-yLaxMy) O2-δ (M=Ca, Sr) system. Electrochemistry 68:455–459
56. Kim DK, Cho PS, Lee JH, Kim DY, Park HM, Auchterlonie G et al(2007) Mitigation of highly resistive grain-boundary phase ingadolinia-doped ceria by the addition of SrO. Electrochem SolidState Lett 10:B91–B95
57. Bryan Balazas G, Robert Glass S (1995) AC impedance studies ofrare earth oxide doped ceria. Solid State Ionics 76:155–162
58. Fu Y-P, Chen S-H, Huang J-J (2010) Preparation and characterizationof Ce0.8M0.2O2−δ (M=Y, Gd, Sm, Nd, La) solid electrolyte materialsfor solid oxide fuel cells. Int J Hydrogen Energy 35:745–752
59. Jaiswal N, Singh NK, Kumar D, Parkash O (2012) Effect ofstrontium (Sr) doping on the conductivity of ceria. J Power Sources202:78–84
Ionics