cep discussion paper no 814 july 2007 trade liberalization...
TRANSCRIPT

CEP Discussion Paper No 814
July 2007
Trade Liberalization, Outsourcing, and Firm Productivity
Ralph Ossa

Abstract Empirical evidence suggests that trade liberalization increases firm productivity. This paper offers a novel explanation for this finding. I develop a simple general equilibrium model of trade in which trade liberalization leads to outsourcing as firms focus on their core competencies in response to tougher competition. Since firms are the better at performing tasks the closer they are to their core competencies, this outsourcing increases firm productivity. Moreover, I also investigate the links between various technological parameters and outsourcing. In particular, I analyze how technological progress, changes in fixed costs, and changes in internal governance costs affect firms’ integration decisions. JEL Classifications: F10, F12, L22, L25 Keywords: Trade Liberalization; Outsourcing; Productivity This paper was produced as part of the Centre’s Globalisation Programme. The Centre for Economic Performance is financed by the Economic and Social Research Council. Acknowledgements I am grateful to Pol Antras, Holger Breinlich, Alejandro Cunat, Elhanan Helpman, Gianmarco Ottaviano, Henry Overman, Stephen Redding, and Tony Venables for helpful comments and discussions. All errors remain mine. Parts of this paper were written while I was a Visiting Fellow at Harvard University, and I thank the Department of Economics there for its hospitality. Financial support of the UK Economic and Social Research Council (ESRC) is gratefully acknowledged.
Ralph Ossa is an Occasional Research Assistant at the Centre for Economic Performance, London School of Economics. Email: [email protected] Published by Centre for Economic Performance London School of Economics and Political Science Houghton Street London WC2A 2AE All rights reserved. No part of this publication may be reproduced, stored in a retrieval system or transmitted in any form or by any means without the prior permission in writing of the publisher nor be issued to the public or circulated in any form other than that in which it is published. Requests for permission to reproduce any article or part of the Working Paper should be sent to the editor at the above address. © R. Ossa, submitted 2007 ISBN 978 0 85328 040 8

1 Introduction
Evaluating the gains from trade liberalization has always been a key concern of
international economics. Recently, many empirical studies have focused on the
productivity e¤ects of trade liberalization (e.g. Pavcnik 2002, Topalova 2004, Tre-
�er 2004).1 Their results suggest that there are important trade-induced improve-
ments in overall productivity, either through gains in average �rm productivity
(��rm productivity e¤ect�) or through the reallocation of market share from less
to more productive �rms (�reallocation e¤ect�).
While the recent theoretical literature has mainly concentrated on understand-
ing the reallocation e¤ect (e.g. Melitz 2003, Bernard et al. 2003, Melitz and
Ottaviano 2005), my focus is on the �rm productivity e¤ect. In the context of a
simple general equilibrium model of trade, I show that trade liberalization leads
to outsourcing as �rms focus on their core competencies in response to tougher
competition. Since �rms are the better at performing tasks the closer they are to
their core competencies, this outsourcing then increases �rm productivity. Besides
establishing this result, I also investigate the links between various technological
parameters and outsourcing. In particular, I analyze how technological progress,
changes in �xed costs, and changes in internal governance costs a¤ect �rms�inte-
gration decisions.
To the best of my knowledge, this paper is the �rst attempt to theoretically
link trade-induced gains in �rm and industry productivity to a vertical focusing
on core competencies. Other papers have mainly emphasized increasing returns
to scale (e.g. Krugman 1979), learning by exporting (e.g. Clerides, Lach, and
Tybout 1998), competition-induced innovation (e.g. Aghion et al. 2005), or
a horizontal focusing on core competencies by multi-product �rms (e.g. Eckel
and Neary, 2005; Bernard, Redding, and Schott, 2006; Nocke and Yeaple, 2006)
as potential sources of the �rm productivity e¤ect. Only McLaren (2000) also
1See Tybout (2002) for a survey of the earlier literature.
2

studies the productivity gains of trade-induced vertical disintegration. Both the
source of the productivity gains as well as the link between trade-liberalization
and outsourcing are very di¤erent in his model, however.
Apart from proposing a new mechanism which helps understanding trade-
induced increases in �rm productivity, this paper is also interesting from a mod-
elling perspective. In particular, I solve for the range of vertically related pro-
duction tasks performed within the boundaries of each �rm, thus allowing me to
study continuous changes in the degree of vertical integration. Previous work has
usually considered two discreet �upstream�and �downstream�production facilities,
which could either merge into a fully integrated �rm or stay entirely disintegrated
(e.g. Grossman and Helpman 2002).
The remainder of the paper is structured as follows. The next section sets
up the model and introduces the concepts �value chain�and �core competencies�.
Section 3 derives the outsourcing decisions of �rms, while section 4 solves for
the general equilibrium. Section 5 is concerned with the comparative statics,
establishing the key results. A �nal section concludes.
2 The basic setup
The model is a generalization of Krugman�s (1979) monopolistic competition
model of trade, the key di¤erence being that the production process of a given va-
riety is now divided between vertically related �rms. The basic setup of Krugman
(1979) is chosen because it features a competition e¤ect generating a reduction in
mark-ups following trade liberalization. As will become clear, this reduction in
mark-ups is necessary for trade liberalization to a¤ect vertical integration in this
model.
3

2.1 Demand
Consider thus an economy producing and consuming i = 1; :::; ny �nal goods,
where ny is endogenous. There are L consumers who are endowed with one unit
of labor each. Consumers have �love of variety�-preferences
U =
nyXi=1
v (xi) ; v0 (xi) > 0; v
00 (xi) < 0 (1)
where v(xi) is the utility derived from consuming x units of �nal good i. They
maximize this utility subject to their budget constraint
! =
nyXi=1
pixi (2)
where ! is the wage rate and pi is the price paid for good i. As can be seen from
the �rst order condition of the consumer�s maximization problem, the resulting
demand has elasticity
" (xi) � �v0 (xi)
xiv00 (xi)(3)
To introduce a competition e¤ect into the model, assume that "0(xi) < 0. As
is easy to verify, this is equivalent to assuming that demand is less convex than
in the constant elasticity case (e.g. linear). Assume also that "(1) > 1 and
"(0) > 1+ , a positive and constant cost parameter to be de�ned below. As
will be discussed later, these parameter restrictions are necessary to guarantee
the existence of a monopolistic competition equilibrium.
2.2 Value chain
Consider now the production process of the �nal goods. The production of each of
these goods requires the sequential performance of a number of tasks. Early tasks
are concerned with obtaining raw materials which are then re�ned successively in
later production stages. The set of these tasks is represented by a line of length
4

v which I call the value chain. To produce the �nal good, all tasks z 2 [0; v]
have to be performed sequentially. If only tasks z 2 [0; w1], 0 < w1 < v, are
performed, a preliminary good w1 is obtained. This preliminary good w1 can then
be transformed into a more downstream preliminary good w2, 0 < w1 < w2 < v,
by performing the additional tasks z 2 [w1; w2] and so on. One unit of each
task is required to produce one unit of the �nal good. Similarly, one unit of the
relevant subset of tasks is required to produce one unit of a preliminary good. The
value chains of all �nal goods are assumed to be independent of each other. The
preliminary goods are always speci�c to the production process of a particular
�nal good and are of no use outside their value chains.2
2.3 Final good producers vs. preliminary good producers
There are a large number of potential �rms whose role is to perform these pro-
duction tasks. Each of these �rms owns the trademark rights of a di¤erent �nal
good, giving the �rm the exclusive right to perform the �nal task v in the value
chain of this �nal good.3 All other tasks z 2 [0; v) can be performed by all �rms
without restrictions. Firms can choose between producing their own �nal prod-
uct (i.e. becoming �nal good producers) or performing tasks outsourced by other
�rms (i.e. becoming preliminary good producers). As �nal good producers, they
transform a preliminary good into the �nal good they own the trademark rights
to. As preliminary good producers, they transform a preliminary good into a more
downstream one. As will become clear, free entry drives pro�ts down to zero for
both types of producers, so that �rms are indi¤erent between both options in
equilibrium.
2A similar representation of the production process has been used by Dixit and Grossman(1982).
3This �nal task can be thought of as turning a relatively generic product into a particularbrand.
5

2.4 Costs and core competencies
Firms are symmetric in all other aspects of the production technology. To start
operating, they have to incur a �xed cost f which is measured in terms of labor.
This �xed cost is associated with acquiring a core competency k in a value chain.
The role of this core competency is re�ected in the structure of variable costs.
The labor requirement of performing one unit of each task in the range [w1; w2]
in this value chain is given by
l (w1; w2) =1
2
Z w2
w1
c (jk � zj) dz (4)
where c0 (:) > 0, so that �rms get the worse at performing a given task the
further away it is from their core competency.4 Firms can only acquire one core
competency so that a core competency is the de�ning feature of a �rm. Firms
can choose, however, which core competency to acquire and which value chain to
invest in.
2.5 Outsourcing contracts and the vertical division of labor
The vertical division of labor in each value chain is determined in the following
bargaining game. There are two stages, a contracting stage and a production
stage, and both stages are divided into a sequence of substages.
2.5.1 Contracting stage
Consider �rst the contracting stage. In the �rst substage, the �nal good producer
enters, chooses a core competency, and incurs the associated �xed costs. Then
she decides whether to perform all tasks z 2 [0; v] required to produce the �nal
good in-house, or to tender a take-it-or-leave-it outsourcing contract, o¤ering to
purchase yns units of preliminary good wns at price pns , where yns , wns , and pns4Notice that this is the labor requirement of transforming one unit of preliminary good w1
into one unit of preliminary good w2.
6

are choice variables.5 If she decides to perform all tasks in-house, the contracting
stage ends. If she decides to tender an outsourcing contract and this outsourcing
contract is not accepted by any �rm, she either performs all tasks in-house or
exits. If, on the other hand, she decides to tender an outsourcing contract and
this outsourcing contract is signed by a preliminary good producer, the second
substage begins. This second substage is essentially a repetition of the �rst sub-
stage. First, the preliminary good producer enters, chooses a core competency,
and incurs the associated �xed costs. Then she decides whether to perform all
tasks z 2 [0; wns ] required to produce preliminary good wns in-house, or to tender
another take-it-or-leave-it outsourcing contract, o¤ering to purchase yns�1 units
of the more upstream preliminary good wns�1 at price pns�1, where yns�1, wns�1,
and pns�1 are again choice variables. If she decides to perform all tasks in-house,
the contracting stage ends. If she decides to tender an outsourcing contract and
this outsourcing contract is not accepted by any �rm, she is forced to produce the
agreed upon quantity of preliminary good wns in-house. If, on the other hand, she
decides to tender an outsourcing contract and this outsourcing contract is signed
by another preliminary good producer, the third substage begins. This process
continues until in some substage a preliminary good producer decides to perform
all remaining tasks in-house. In all substages, contracts are assumed to be com-
plete and perfectly enforceable. Also, there is free entry of potential �rms, so that
outsourcing o¤ers are going to be accepted as long as they imply non-negative
pro�ts.
2.5.2 Production stage
Consider now the production stage which follows after the contracting stage ends.
The production stage is simply the execution of the production process as agreed
upon in the contracting stage, taking into account the sequentiality of the pro-
5Notice that she can do so because she has the exclusive right to perform the �nal task v,and preliminary goods are speci�c to the production process of a particular �nal good.
7

duction process. Hence, the most upstream preliminary good producer produces
the agreed upon quantity of the agreed upon preliminary product by sequentially
performing the required tasks and sells it to the second most upstream prelimi-
nary good producer at the agreed upon price and so on until all tasks have been
performed and the �nal good is produced.
3 Optimal organization of production
As will turn out, this game has a unique subgame perfect Nash equilibrium. In
this equilibrium, the �nal good producer chooses her actions to maximize her
pro�ts subject to the actions she can expect to be chosen by the preliminary good
producers after eliminating non-credible threats. As always, pro�t maximization
implies cost minimization, and it is useful to consider both in turn. The solution
to the cost minimization problem will be derived in the following subsection. The
solution to the pro�t maximization problem will be discussed thereafter.
3.1 Cost minimization
To solve the cost minimization problem, I proceed in two steps. First, I take a
social planner�s perspective and derive the division of labor between �rms which
ensures that total production costs of the �nal good are minimized for a given
level of output. Then, I turn to the decentralized case. As will become clear later,
the decentralized equilibrium is easy to characterize in view of the solution to the
social planner�s problem, given the strong bargaining position of the �nal good
producer in the bargaining game.
3.1.1 First step: Solving the social planner�s problem
Consider thus a social planner who is in full control of the �nal good producer
and all potential preliminary good producers. How many �rms should participate
in the production process of the �nal good, which core competencies should they
8

acquire, and which tasks should each �rm perform in order to minimize the total
cost of producing y units of the �nal good? This problem will be solved in a
number of steps.
Consider �rst an arbitrary number of �rms with an arbitrary distribution of
core competencies. To minimize total production costs, which �rm should perform
which set of tasks? Since the �xed costs have to be incurred irrespective of the
organization of production, they are irrelevant for the solution to this problem.
For total cost minimization, the aim should thus be to minimize the total unit
labor requirement. Consider �gure (1) which plots 12c (jk � zj) for an arbitrary
number of �rms and an arbitrary distribution of core competencies.6 In this
�gure, the total unit labor requirement is represented by the total area under all
triangles. As can be easily seen, this area is minimized if each �rm performs the
task which exactly matches its core competency plus all the tasks to both sides
of this core competency until half-way between this �rm�s core competency and
the neighboring �rm�s core competency.
Consider now the optimal distribution of core competencies. Elementary
geometry reveals that the total area under all triangles is minimized if the �rms�
core competencies are distributed uniformly along the value chain. Hence, for
total cost minimization each �rm should be of the same vertical size and perform
a symmetric range of tasks around its core competency.
Finally, consider the optimal vertical �rm size conditional on a given level of
output s (y). Since all tasks z 2 [0; v] have to be performed to produce the �nal
product, this is equivalent to considering the optimal number of �rms in this value
chain conditional on a given level of output ns (y), where ns (y) = vs(y) .
7 For given
vertical and horizontal �rm sizes s and y, each �rm has a labor requirement of
6To keep the illustration simple, c (:) is drawn as a linear function with c (0) = 0 in this �gure.All results carry over to the more general case, however.
7v is assumed to be su¢ ciently large relative to s (y) so that the integer problem can beignored.
9

l = f +
"Z s2
0c (z) dz
#y (5)
as can be inferred easily from equation (1) and �gure (1).8 De�ning C�s2
��R s
20 c (z) dz this can be written as
l = f + yC�s2
�(6)
Notice that C 0(:) � c(:) from the above de�nition of C (:). Since there are vs �rms
involved in the production of the given �nal good, the total labor requirement is
given by vs l. Since labor is paid a wage rate !, total production costs are
TC =!v
sf +
!v
syC�s2
�(7)
Minimizing this expression with respect to s yields the �rst order condition
f = y
�1
2sc�s2
�� C
�s2
��(8)
which implicitly de�nes s (y).9 It is straightforward to show that this implies10
s0 (y) < 0 (9)
Hence, vertical and horizontal �rm size are negatively related if total produc-
tion costs are to be minimized. Underlying this result is a trade-o¤ between �xed
and variable total production costs. If output is large, variable costs become more
important relative to �xed costs so that it is e¢ cient to incur additional �xed costs
and set up more �rms which can then operate at a smaller vertical scale in order
8Notice that the above result that �rms should be of the same vertical size and perform asymmetric range of tasks around their core competencies is incorporated in this expression.
9 It can be easily checked that the second order condition for cost minimization is also satis�ed.
10From equation (8) it follows that s0 (y) = � 4f
y2sc0( s2 )which is negative since c0
�s2
�> 0.
10

to achieve lower variable production costs. Given the optimal �rm size s (y), the
optimal labor requirement of each �rm l (y) then follows straightforwardly from
equation (6).
In summary, total production costs are thus minimized if each task is per-
formed by only one �rm, all �rms are of size s (y) and perform a symmetric range
of tasks around their core competencies.
3.1.2 Second step: Solving for the decentralized equilibrium
Given the strong bargaining position of the �nal good producer in the bargaining
game, the decentralized equilibrium is easy to characterize in view of this solution
to the social planner�s problem. In fact, the subgame perfect Nash equilibrium of
the bargaining game exactly replicates the solution to the social planner�s problem
in terms of the number of vertically related �rms, the location of their core compe-
tencies, and the range and quantity of tasks they perform. As for the equilibrium
outsourcing contracts, they are such that all preliminary good producers make zero
pro�ts. In terms of the above notation, the �nal good producer thus performs
y units of the �nal s (y) tasks in-house and buys y units of preliminary product
v � s (y) at price ! [ns (y)� 1] l (y) from a preliminary good producer. This pre-
liminary good producer purchases y units of preliminary product v�2s (y) at price
! [ns (y)� 2] l (y) from yet another preliminary good producer and so on. Finally,
the second most upstream �rm in the value chain purchases y units of preliminary
product v� [ns (y)� 1] s (y) = s (y) at price ! [ns (y)� (ns (y)� 1)] l (y) = !l (y)
from the most upstream �rm. To verify that this is the subgame perfect Nash
equilibrium of the bargaining game, proceed by backwards induction. Consider
�rst the production stage. Given the assumption that contracts are complete
and perfectly enforceable, �rms cannot deviate in the production stage. Consider
now the contracting stage. Notice �rst that in all substages no preliminary good
producer has an incentive to deviate in any action since only the described ac-
11

tions are consistent with zero pro�ts (binding participation constraints). Notice
second that the �nal good producer does not have an incentive to deviate since
the described actions allow her to produce y units of the �nal good at minimum
possible costs. Hence, this is indeed a subgame perfect Nash equilibrium of the
bargaining game. Clearly, it is also the only one.
Since all �rms are assumed to be able to become �nal good producers for
some �nal good, the above argument only goes through if the �nal good producer
also makes zero pro�ts in equilibrium. This will be ensured through monopolistic
product market competition as will be laid out in a later section.
3.2 Pro�t maximization
Consider now the pro�t maximization problem of the �nal good producer. Given
the equilibrium outsourcing contract, the �nal good producer�s total cost function
is given by
TC (y) =1
2!vyc
�s (y)
2
�(10)
This is just the expression for the minimum possible total production cost as
follows from equations (7) and (8). Some manipulation reveals that the �nal
good producer�s marginal costs are given by
MC (y) =1
s (y)!vC
�s (y)
2
�(11)
Consider now the demand facing the �nal good producer. In a setting of mo-
nopolistic competition, each �rm takes the consumers�marginal utility of income
as constant. Therefore, the demand elasticity perceived by the �rm is exactly as
derived above from consumer choice (see equation (4)). As is well known, pro�t
maximization implies that �rms charge a mark-up m (x) over marginal costs,
where
12

m (x) =1
" (x)� 1 (12)
Notice that m0 (x) > 0 since "0 (x) < 0 and that m(0) < since "(0) > 1+ . Of
course, y = Lx so that
p
!=h1 +m
� yL
�i 1
s(y)vC
�s (y)
2
�(13)
This is one of the central equations of the analysis. It describes the pairs p! and
y consistent with pro�t maximization (for this reason, the relationship will be
referred to as PMX curve henceforth).
4 The zero pro�t equilibrium
4.1 The zero pro�t condition
The model is closed with a zero pro�t condition. As long as �nal good producers
make positive pro�ts, new varieties will be established increasing the competition
facing each �nal good producer.11 Final good producers�average costs are given
by
AC (y) =1
2!vc
�s (y)
2
�(14)
as follows straightforwardly from equation (10). The zero pro�t condition can
thus be written as
p
!=1
2vc
�s (y)
2
�(15)
11As indicated above, if �nal good producers make positive pro�ts the optimal outsourcingcontract needs to be altered to induce some �rms to become suppliers of preliminary products.Basically, the price o¤ered for each intermediate good would have to be increased until �rms areindi¤erent between becoming a �nal good producer or a supplier of a preliminary good. Theconclusions regarding the zero pro�t equilibrium are, of course, una¤ected by this consideration.
13

This is the second central equation of the analysis. It describes the combinations
of p! and y where �nal good producers make zero pro�ts (for this reason, the
relationship will be referred to as ZPC curve henceforth).
4.2 The ZPC curve as an indicator of labor productivity
Notice that the ZPC curve also captures inverse labor productivity. To see this,
recall that each �rm in the value chain contributes an equal number of tasks to the
production of the �nal product. Hence, yns(y)
units of output can be attributed to
the work of a single �rm and labor productivity is simply given by yns(y)l(y)
. Now
remember that the ZPC curve is de�ned as AC(y)! . From equation (7) it follows
thatAC (y)
!=ns (y)
y
�f + yC
�s (y)
2
��(16)
which, together with equation (6), implies that
AC (y)
!=ns (y) l (y)
y(17)
This observation will be useful later on in the analysis.
4.3 Existence, stability and uniqueness
The PMX curve and the ZPC curve are two equations in the two unknowns p!
and y. For an equilibrium to exist, the PMX curve and the ZPC curve must
intersect. For an equilibrium to be stable, the ZPC curve must intersect the
PMX curve from above, as depicted in �gure (2). Then entry of �nal good
producers will shift the demand curve to the left whenever y is to the right of
the intersection and exit of �nal good producers will shift the demand curve to
the right whenever y is to the left of the intersection. For an equilibrium to be
unique, the ZPC curve must only intersect the PMX curve once.
Some more structure needs to be imposed on the model to ensure that an
14

equilibrium exists, is stable and unique. A particularly useful restriction su¢ cient
to guarantee existence, stability and uniqueness is to impose
c�s2
�2
� (1 + )C�s2
�s
(18)
As can be seen from equations (11) and (14), this restriction ensures that average
and marginal costs are proportional, the factor of proportionality being (1 + ),
AC = (1 + )MC (19)
Since s0 (y) < 0 and c0�s2
�> 0, average costs are decreasing in y. It is easy to show
that marginal costs are also decreasing in y.12 Of course, the marginal cost curve
must be strictly below the average cost curve in that case. m (0) < implies that
the PMX curve will be strictly below the ZPC curve at y = 0. Since m0 (y) > 0,
the PMX curve will fall less than proportionately relative to the marginal cost
curve as y increases.13 If marginal costs and average costs are proportional, this
implies that ZPC intersects PMX only once and from above.
Notice that the above restriction is equivalent to imposing
c (:) = � (:) , � > 0, > 0 (20)
Since (18) is an identity it can be di¤erentiated so that
c0�s2
�= a
�s2
�c�s2
�(21)
where a�s2
��
( s2). This is a simple linear �rst-order di¤erential equation with
general solution
12 @MC@y
= !vs0(y)s2
�12sc�s2
�� C
�s2
��= !vs0(y)
s2fy< 0 since s0 (y) < 0.
13 In fact, if the mark-up increases in output at a su¢ cient speed, the PMX curve might evenbecome upward sloping.
15

c�s2
�= �
�s2
� (22)
Since c0 (:) > 0 was required, � > 0, > 0. This restriction will be imposed
henceforth.
4.4 Solving for the general equilibrium
The equilibrium values� p!
�� and y� are thus determined by ZPC and PMX. Theequilibrium vertical �rm size s� then follows from (8), equilibrium consumption
per worker is given by x� = y�=L. Equilibrium employment per �rm l� is deter-
mined by (6), the equilibrium number of �rms per value chain can be calculated
from n�s = v=s�. Given the symmetry of the preference structure, xi = x and
pi = p for all i in equilibrium, so that the consumers�budget constraints simplify
to nypx = w. This equation then determines the number of goods n�y. Finally,
the total number of �rms is given by n� = n�sn�y.
4.5 Comparative statics
With this framework at hand, one can analyze the e¤ect of the exogenous variables
L, v, f , � and on the endogenous variables p=!, s, y, x, l, ns, ny and n. This
exercise is simpli�ed considerably by the proportionality assumption (18). Since
AC = (1 + )MC and, in equilibrium, AC =�1 +m
� yL
��MC one obtains
m
�y�
L
�= (23)
For a given function m (:), y is determined by L and only. Since x� = y=L, x�
depends on only. Firm labor demand is given by (6). Imposing c (:) = � (:) it
is easy to show that
l� = f
�1 +
1
�(24)
16

Therefore, �rm labor demand depends on f and only.
4.6 Trade liberalization
4.6.1 Focusing on core competencies
Consider �rst a move from autarky to free trade, which is equivalent to an increase
in the labor force in this model. If two identical countries of the type outlined
above move from autarky to free trade, the e¤ect is simply a doubling of the labor
force. Globalization is often referred to by the business press as forcing �rms to
focus on their core competencies which is exactly what the model predicts. The
e¤ect of trade liberalization on pw , y and s is depicted in �gure (3) which plots the
PMX and ZPC schedules as well as s (y) as de�ned by equation (8). As can be
seen from equations (8), (13), and (15), an increase in the labor force shifts the
PMX curve down while leaving the other curves unchanged. Trade liberalization
thus leads to an increase in real wage and output but to a decrease in vertical
�rm size. In the model, the larger market toughens competition by increasing
the demand elasticity facing the �nal good producers. Final good producers re-
spond to this by reducing their mark-ups and increasing their outputs. These
increased outputs make variable costs more important relative to �xed costs so
that, in equilibrium, �rms will downsize to achieve a more e¢ cient vertical scale.
Firms will concentrate on their core competencies, i.e. cover a smaller segment
of the value chain, as they expand horizontally. Trade liberalization is thus asso-
ciated with outsourcing in this framework. Since there are no trade costs in the
model and countries are assumed to be symmetric, there is no explicit distinction
between the home country and the foreign country. Whether outsourcing occurs
domestically or internationally (�o¤shoring�) is hence indeterminate in this model.
17

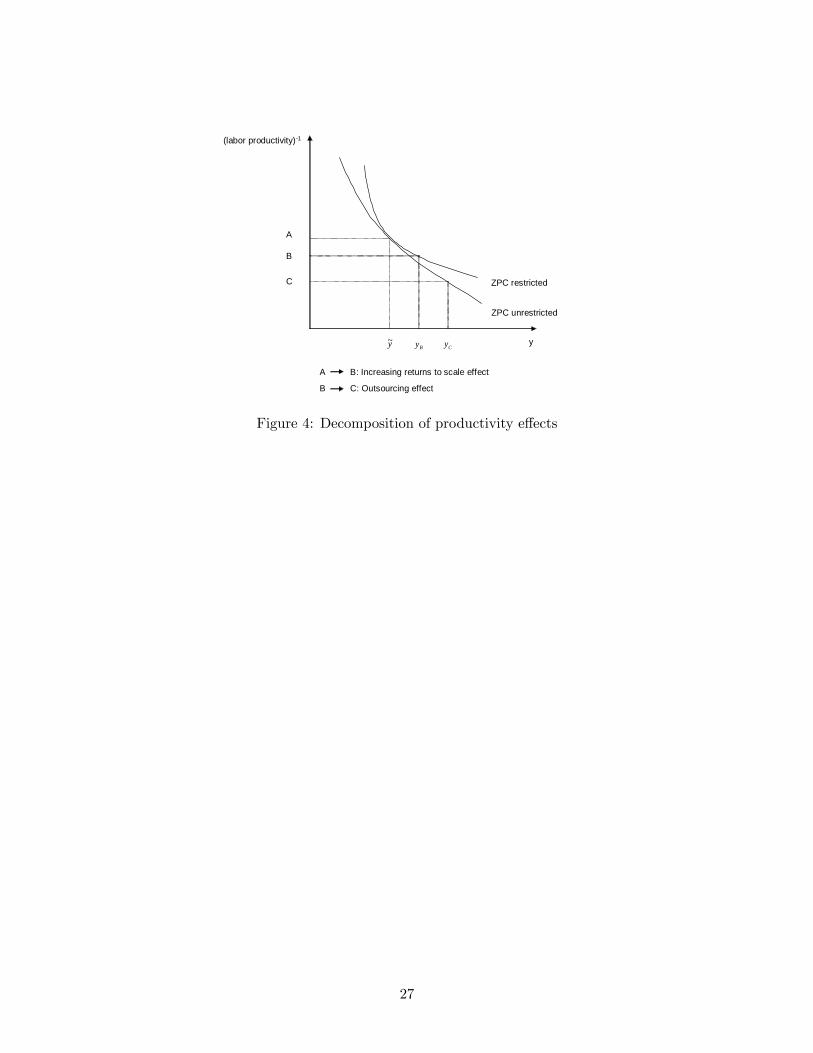
4.6.2 Productivity e¤ect
Notice that trade liberalization leads to an increase in �rm productivity, as the
equilibrium point moves down the ZPC curve (recall that the ZPC curve also
captures inverse labor productivity). Underlying this productivity e¤ect is an in-
creasing returns to scale e¤ect and an outsourcing e¤ect. This is depicted in �gure
(4). The increasing returns to scale e¤ect is the productivity e¤ect which would
occur if vertical �rm size was �xed. The outsourcing e¤ect is the additional pro-
ductivity e¤ect brought about by the endogeneity of vertical �rm size. Consider
�rst the construction of the ZPC schedules in �gure (4). Suppose that vertical
�rm size is �xed at an arbitrary level ~s.14 Since s (y) minimizes TC (y) and hence
also AC (y) with respect to s, this ~s is suboptimal unless y = ey, where ey is im-plicitly de�ned by ~s = s (ey). Therefore, the average cost curve of the restrictedmodel must be strictly above the average cost curve of the unrestricted model,
unless y = ey and both curves coincide. As the ZPC curves are proportional to
the average cost curves, the ZPC curve of the restricted model must thus also be
strictly above the ZPC curve of the unrestricted model unless y = ey, as drawn in�gure (4). Suppose now that the initial equilibrium is at y = ey and consider theimpact of a trade liberalization. It is easy to show that the output response to the
trade liberalization is larger in the unrestricted case than in the restricted case.
This is because marginal costs are decreasing rather than constant in output in
the unrestricted case. The increasing returns to scale e¤ect is captured by the
distance between A and B in �gure (4), whereas the outsourcing e¤ect is given
by the distance between B and C. Hence, there is a genuine outsourcing e¤ect in
this model which goes beyond the traditional increasing returns to scale e¤ect.
14Notice that the model then essentially reduces to Krugman (1979). As can be seen fromequation (7), a �nal good producer then has a constant �xed cost !ves f and a constant marginalcost !ves C � es2�, just as in Krugman (1979).
18

4.6.3 Other e¤ects
The e¤ects on the remaining endogenous variables are as follows. The number of
varieties available to consumers increases, while consumption per worker per �nal
good is unchanged. Due to the reduced vertical �rm sizes, the number of �rms
within each value chain increases. Interestingly, the number of workers hired by
each individual �rm is una¤ected so that �rm scale only changes as measured by
output. Therefore, the total number of �rms operating in each country remains
unchanged. Hence, despite a reduction in the number of varieties produced in
each country, trade liberalization does not lead to net exit of domestic �rms in
this model.
4.6.4 Decreasing the length of the value chain/technological progress
Consider now a reduction in the length of the value chain. Since a shorter value
chain implies that fewer tasks need to be performed to manufacture the �nal
product, this change can be interpreted as re�ecting technological progress. The
e¤ect of a change in v on� pw
��, y� and s� is depicted in �gure (5). � pw�� decreasesby the same proportion as v but y� and s� are unchanged. As can be veri�ed
easily, x�, l� are also unchanged. n�y increases by the same proportion as v falls
but n�s falls by the same proportion as v falls so that the total number of �rms
remains unchanged.
4.7 Changes in the cost structure
To analyze changes in the cost structure it is useful to express the ZPC curve
and the PMX curve explicitly in terms of the cost parameters. Substituting
restriction (20) into the �rst order condition (8) and rearranging yields
s (y) = 2
�f (1 + )
y �
� 11+
(25)
19

Using this result in equations (15) and (13) yields the following expressions for
the ZPC- curve and the PMX curve, respectively,
p
!=v
2(�)
11+
�f (1 + )
y
� 1+
(26)
p
!=v
2
h1 +m
� yL
�i � �
1 +
� 11+
�f
y
� 1+
(27)
4.7.1 Changes in �xed costs
The e¤ect of an increase in �xed costs on the real wage as well as horizontal
and vertical �rm size is depicted in �gure (6). As can be seen from equations
(25-27), an increase in f shifts up the PMX curve and the ZPC curve by the
same proportion and shifts down s (y). Hence, the real wage falls, output per �rm
stays constant and �rms get larger horizontally. The insourcing, of course, comes
along with a fall in the number of �rms per value chain, which is exactly what
one would expect following an increase in �xed costs. Of course, this implies that
each �rm has to cover a longer segment of the value chain so that, on average,
tasks are further away from the �rms�core competencies causing higher aggregate
variable costs. Consumption per �nal good remains unchanged, each �rm hires
more workers, the number of varieties falls and so does the total number of �rms.
4.7.2 Changes in governance costs
Consider �st an increase in �. As shown in �gure (7) this decreases real wage
and vertical �rm size but leaves output per �rm una¤ected. Again, the decrease
in vertical �rm size is exactly what one would expect to happen in response to
an increase in this component of internal governance costs. Consumption per
�nal good is una¤ected and so is the number of workers hired by each �rm. The
number of �rms per value chain increases but the number of varieties decreases
at the same proportion so that the total number of �rms is una¤ected.
20

Consider now an increase in . The e¤ect on both the PMX- curve as well
as the ZPC curve is ambiguous, so a graphical illustration as above is not very
insightful. From equation (23) it is clear, however, that y� increases, from equa-
tion (24) it follows that l� falls. Since L is unchanged, x� will increase with y�.
Di¤erentiating (25) reveals that s� falls and hence n�s rises. As expected, an in-
crease in this component of internal governance costs hence triggers outsourcing
to save on marginal costs. The e¤ect on�!p
��, n�y and n
� is ambiguous.
5 Conclusion
In this paper, I developed a simple general equilibrium model of trade in which
trade liberalization leads to outsourcing as �rms focus on their core competencies
in response to tougher competition. Since �rms are the better at performing
tasks the closer they are to their core competencies, this outsourcing increases �rm
productivity. Besides establishing this result, I also investigated the links between
various technological parameters and outsourcing. In particular, I analyzed how
technological progress, changes in �xed costs, and changes in internal governance
costs a¤ect �rms�integration decisions.
Essentially, the model relates Adam Smith�s famous proposition that the di-
vision of labor is limited by the extent of the market to the topic of vertical
integration. The larger the market, the more important become variable costs
relative to �xed costs in the model so that, in equilibrium, the production tasks
are divided among a larger number of leaner vertically related �rm.
So far, the focusing on core competencies is just a plausible channel through
which trade liberalization may a¤ect �rm productivity. To substantiate the im-
portance of that link, rigorous empirical research is now required. Given that
trade-induced increases in �rm productivity have been found in several empirical
studies, this seems to be a promising project for future work in this area.
21

References
[1] Aghion, P., Burgess, R., Redding, S., Zilibotti, F, 2005. Entry liberalization
and inequality in industrial performance. Journal of the European Economic
Association 3, 291-302.
[2] Bernard, A., Eaton, J., Jensen, J., Kortum, S., 2003. Plants and productivity
in international trade. American Economic Review 93, 1268-1290.
[3] Bernard, A., Redding, S., Schott, P., 2006. Multi-product �rms and trade
liberalization. NBER working paper 12782.
[4] Clerides, S. K., Lach, S., Tybout, J.R., 1998. Is learning by exporting im-
portant? Micro-dynamic evidence from Columbia, Mexico, and Morocco.
Quarterly Journal of Economics 113, 903-947.
[5] Eckel, K., Neary, J.P., 2005. Multi-product �rms and �exible manufacturing
in the global economy. Working paper. University of Oxford.
[6] Dixit, A., Grossman, G. M., 1983. Trade and protection with multi-stage
production. Review of Economic Studies 49, 583-594.
[7] Grossman, G. M., Helpman, E., 2002. Integration versus outsourcing in in-
dustry equilibrium. Quarterly Journal of Economics 117, 85-119.
[8] Krugman, P., 1979. Increasing returns, monopolistic competition, and inter-
national trade. Journal of International Economics 9, 469-479.
[9] Melitz, M., 2003. The impact of trade on intra-industry reallocations and
aggregate industry productivity. Econometrica 71, 1695-1725.
[10] Melitz, M., Ottaviano, G., 2005. Market size, trade, and productivity. NBER
working paper 11393.
[11] McLaren, J., 2000. Globalization and vertical structure. American Economic
Review 90, 1239-1254.
22

[12] Nocke, V., Yeaple, S., 2006. Globalization and endogenous �rm scope. Work-
ing paper. University of Pennsylvania.
[13] Pavcnik, N., 2002. Trade liberalization, exit, and productivity improvements:
Evidence from Chilean plants. Review of Economic Studies 69, 245-276.
[14] Topalova, P., 2004. Trade liberalization and �rm productivity: The case of
India. IMF Working Paper WP/04/28.
[15] Tre�er, D., 2004. The long and short of the Canada-U.S. free trade agreement.
American Economic Review 94, 870-895.
[16] Tybout, J., 2003. Plant- and �rm-level evidence on the "new" trade theories.
In: Kwan Choi, E., Harrigan, J. (Eds.), Handbook of International Trade,
Basil-Blackwell, Oxford.
23

0 k1 k2 k3 k4 k5 v z
Tasks performed by firm 4
1/2c(|kz|)
Figure 1: Vertical equilibrium
24

p/w
y
PMX
ZPC
ve profits +ve profits
High demand: entryLow demand: exit
Figure 2: Horizontal equilibrium
25

p/w
s
y
s(y)
PMX
ZPC
PMX’
y0 y1
s1
s0
(p/w)0
(p/w)1
Figure 3: Trade liberalization
26
(labor productivity)1
y
ZPC restricted
ZPC unrestricted
A
B
C
y~ By Cy
A B: Increasing returns to scale effect
B C: Outsourcing effect
Figure 4: Decomposition of productivity e¤ects
27

p/w
s
y
s(y)
PMX’
ZPC’y0=y1
s0=s1
(p/w)0
(p/w)1PMX
ZPC
Figure 5: Technological progress
28

p/w
s
y
s(y)
PMX
ZPCy0=y1
s0
s1
(p/w)1
(p/w)0PMX’
ZPC’
s(y)’
Figure 6: Increased �xed production cost
29

p/w
s
y
s(y)’
PMX
ZPCy0=y1
s1
s0
(p/w)1
(p/w)0PMX’
ZPC’
s(y)
Figure 7: Increasing internal governance costs
30

CENTRE FOR ECONOMIC PERFORMANCE Recent Discussion Papers
813 Karsten Kohn Alexander C. Lembcke
Wage Distributions by Bargaining Regime: Linked Employer-Employee Data Evidence from Germany
812 Yannis M. Ioannides Henry G. Overman Esteban Rossi-Hansberg Kurt Schmidheiny
The Effect of Information and Communication Technologies on Urban Structure
811 Guy Michaels The Division of Labor, Coordination, and the Demand for Information Processing
810 Maia Güell Jose V. Rodriguez Mora Chris Telmer
Intergenerational Mobility and the Informative Content of Surnames
809 Stephen J. Redding Daniel M. Sturm Nikolaus Wolf
History and Industry Location: Evidence from German Airports
808 Anna Lipinska The Maastricht Convergence Criteria and Optimal Monetary Policy for the EMU Accession Countries
807 Eran Yashiv The Beveridge Curve
806 Ghazala Azmat Alan Manning John Van Reenen
Privatization, Entry Regulation and the Decline of Labor’s Share of GDP: A Cross-Country Analysis of the Network Industries
805 Henry G. Overman Patricia Rice Anthony J. Venables
Economic Linkages Across Space
804 Benjamin Aleman-Castilla The Returns to Temporary Migration to the United States: Evidence from the Mexican Urban Employment Survey
803 Eran Yashiv Labor Search and Matching in Macroeconomics
802 Nicholas Oulton Jeremy Greenwood and Per Krusell, “Growth Accounting with Investment-Specific Technological Progress: A Discussion of Two Approaches” A Rejoinder
801 Mirabelle Muûls Mauro Pisu
Imports and Exports at the Level of the Firm: Evidence from Belgium
800 Richard E. Baldwin Frédéric Robert-Nicoud
Protection for Sale Made Easy
799 Alejandro Cuñat Marc J. Melitz
Volatility, Labor Market Flexibility, and the Pattern of Comparative Advantage

798 Giulia Faggio Job Destruction, Job Creation and Unemployment in Transition Countries: What Can We Learn?
797 Nicholas Oulton Chain Indices of the Cost of Living and the Path-Dependence Problem: an Empirical Solution
796 David Marsden Richard Belfield Salima Benhamou
Inventive Pay Systems and the Management of Human Resources in France and Great Britain
795 Andrew B. Bernard J. Bradford Jensen Stephen Redding Peter K. Schott
Firms in International Trade
794 Richard E. Baldwin Frédéric Robert-Nicoud
Offshoring: General Equilibrium Effects on Wages, Production and Trade
793 Alan Manning Respect
792 Nick Bloom Uncertainty and the Dynamics of R&D
791 Richard E. Baldwin Frédéric Robert-Nicoud
Entry and Asymmetric Lobbying: Why Governments Pick Losers
790 Alan Manning Sanchari Roy
Culture Clash or Culture Club? The Identity and Attitudes of Immigrants in Britain
789 Giorgio Gobbi Roberta Zizza
Does the Underground Economy Hold Back Financial Deepening? Evidence from the Italian Credit Market
788 Nick Bloom Raffaella Sadun John Van Reenen
Americans do I.T. better: US Multinationals and the Productivity Miracle
787 Elizabeth O. Ananat Guy Michaels
The Effect of Marital Breakup on the Income Distribution of Women with Children
786 Willem H. Buiter Seigniorage
785 Gustavo Crespi Chiara Criscuolo Jonathan E. Haskel Matthew Slaughter
Productivity Growth, Knowledge Flows and Spillovers
784 Richard Layard Guy Mayraz Stephen Nickell
The Marginal Utility of Income
The Centre for Economic Performance Publications Unit
Tel 020 7955 7673 Fax 020 7955 7595 Email [email protected] Web site http://cep.lse.ac.uk