centrepiece - centre for economic performancecep.lse.ac.uk/pubs/download/centrepiece_17_1.pdf ·...
TRANSCRIPT

ISSN 1362-3761
C e n t r e Pi e c eThe Magazine of The Centre for Economic Performance Volume 17 Issue 1 Spring 2012
UK growth Corporate innovationEnergy taxes Language barriersExecutive pay Industrial policyOil and conflict School funding
Jobs in a recession

With the UK economy seemingly back inrecession and national output still morethan 4% below its peak in 2008, wherenext for the country’s elusive quest forgrowth? John Van Reenen, director of theCentre for Economic Performance (CEP),has been prominent in recent debatesabout the government’s austerity plan oftax hikes and public spending cuts,arguing that fiscal consolidation is beingimplemented too deeply and too rapidly –and is needlessly slowing growth.
He is also co-chair with Tim Besley ofthe LSE Growth Commission, a majorinitiative launched in January to injectfresh thinking into the growth debate.The commission will be holding a seriesof evidence sessions over the comingmonths, the proceedings of which will bemade publicly available as a permanentrecord. And a report published by theend of 2012 will articulate thecommission’s views on how to make asustainable improvement in the growth
performance of the UK economy.In the meantime, the biggest social
cost of absent growth is of courseunemployment. That is the focus of ourcover story, which draws strongimplications for policy from the simpleinsight that in a recession, people queuefor jobs, either literally ormetaphorically. Pascal Michaillat’sanalysis suggests that in recessions,unemployment insurance should bemore generous and governments shouldinvest in infrastructure. What’s more, hesays, recessions are the wrong time to becutting public sector jobs.
Elsewhere in this CentrePiece arereports on policy evaluations by CEPresearchers. One result is positive: SteveGibbons and colleagues think that the‘pupil premium’ could improve theeducational outcomes of children fromlow-income families. One is negative:Ralf Martin and colleagues reveal thefailings of the climate change levy, which
aims to reduce greenhouse gasemissions. And one is mixed: HenryOverman and colleagues find thatbusiness support schemes can boostemployment but only in small firms andat a cost in terms of productivity.
Finally, our last two articles are onthe topical issue of institutional investorsand their role in the performance of bigcompanies. One shows that publiclyquoted UK firms with higher levels ofinstitutional share ownership have astronger and more symmetric linkbetween shareholder returns andexecutive pay. The other has good newsabout the beneficial impact ofinstitutional investors on innovation.Even before the LSE Growth Commissionreports, we know that innovation is akey driver of growth.
Romesh Vaitilingam, [email protected]
CentrePiece is the magazine of the
Centre for Economic Performance at the
London School of Economics. Articles in this
issue reflect the opinions of the authors, not
of the Centre. Requests for permission to
reproduce the articles should be sent to the
Editor at the address below.
Editorial and Subscriptions Office
Centre for Economic Performance
London School of Economics
Houghton Street
London WC2A 2AE
Annual subscriptions for one year (3 issues):
Individuals £13.00
Students £8.00
Organisations (UK and Europe) £30.00
Rest of world £39.00
Visa and Mastercard accepted
Cheques payable to London School
of Economics
CEP director, John Van Reenen
CEP research director, Stephen Machin
Editor, Romesh Vaitilingam
Design, DesignRaphael Ltd
Print, Hastings Printing Co. Ltd
Cover image: www.corbisimages.com
© Centre for Economic Performance 2012
Volume 17 Issue 1
(ISSN 1362-3761) All rights reserved.
Centre Piece
Editorial

CentrePiece Spring 2012
1
page 12Urban schools: does moneymake a difference?Steve Gibbons and colleagues examinewhether greater funding for UK primaryschools can improve academicachievement
page 14Language barriers? Non-native English speakersin the classroomSandra McNally and colleagues explorethe effects of the rising numbers of UKpupils who do not speak English as a firstlanguage
page 20Can industrial policy boost jobs?A CEP research team finds that businesssupport schemes aimed at revitalisingeconomically disadvantaged regions canbe effective
page 26Two cheers for Anglo-Saxonfinancial markets?Institutional investors are good forindustrial innovation, according to John Van Reenen and colleagues
page 28UK chief executives:paid for performance?Brian Bell and John Van Reenen analysea new database to shed light on therelationship between corporateperformance and executive pay
in brief...
page 3Jobs in a recessionPascal Michaillat explains the implications of a simple insight –that in a recession, people queue for jobs – for today’s economic policy debates
page 8Growth and productivity:UK economic performance since 1997A CEP report on UK productivity during the Labour years drawslessons for the current government’s strategy for growth
page 16The polluter-doesn’t-pay principleRalf Martin and colleagues reveal the failings of the UK’s climatechange levy, which aims to reduce greenhouse gas emissions
page 22Giant oilfields and civil conflictYu-Hsiang Lei and Guy Michaels investigate the impact of giantoilfield discoveries on the likelihood of civil conflict
page 16The polluter-doesn’t-pay principle
page 3Jobs in a recession
Contents
page 26Two cheers forAnglo-Saxonfinancial markets?


CentrePiece Spring 2012
3
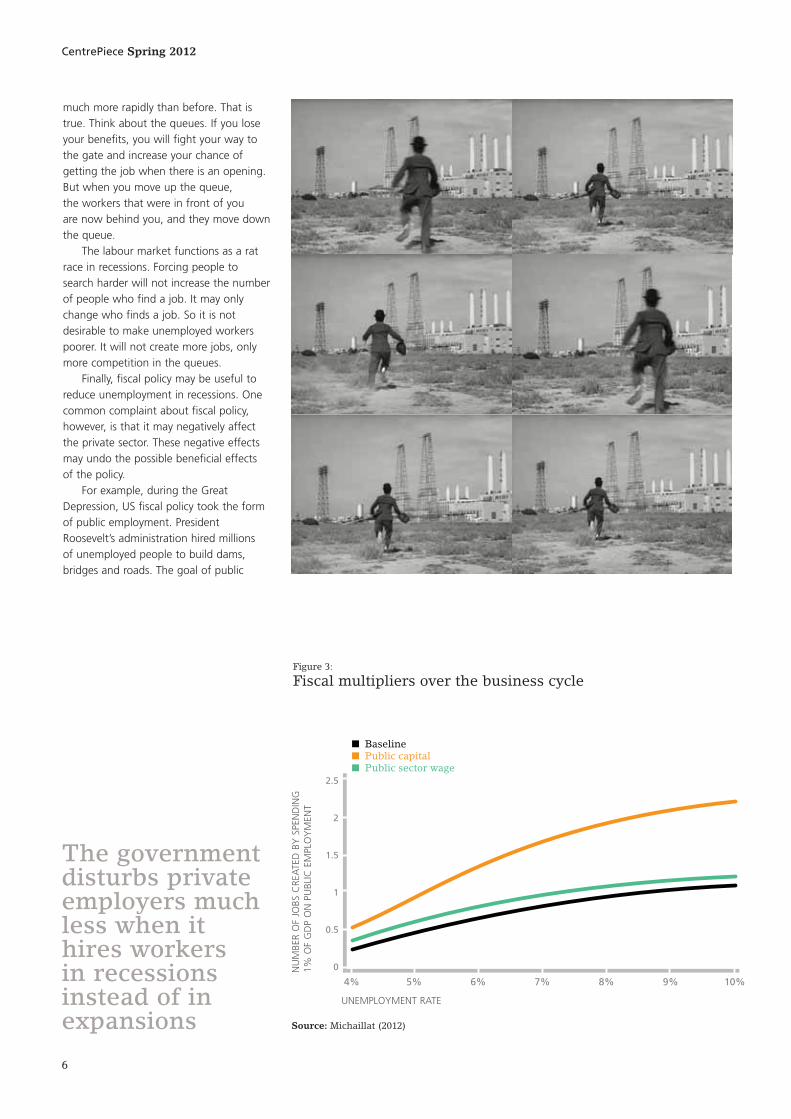
Anyone who has watchedCharlie Chaplin’s filmModern Times knowsthat people queue forjobs in recessions. In a
famous scene, Chaplin opens thenewspaper and learns that his old factoryis rehiring. He runs off to the factorywhere he meets hundreds of peopleseeking employment. The last one tosneak through the gate, Chaplin gets ajob while many others are left queuingoutside the factory gates.
The model of ‘equilibriumunemployment’ developed by PeterDiamond, Dale Mortensen and CEP’sChristopher Pissarides – for which they were awarded the Nobel Prize in2010 – provides a very appealingdescription of the labour market becauseit describes the creation of jobs by firms,the search for vacant jobs by unemployedworkers and the process of matching firms with workers.
But the model seems inadequate todescribe the recessionary unemploymentof the Great Depression and more recenttimes when the business cycle has turned down. The search model ofunemployment is inconsistent with theexistence of queues in recessions: itconverges to full employment whenunemployed workers devote an arbitrarilylarge effort to search for jobs. In otherwords, all unemployed workers could finda job if they searched sufficiently.
My research develops a model thatbuilds on the equilibrium unemploymentmodel, but which is consistent with theexistence of queues in recessions. In mymodel, jobs are rationed in recessions sothat no amount of effort will allow allworkers to find a job.
Unemployment is the sum of arationing component and a frictionalcomponent. Rationing unemploymentmeasures the job shortage in theeconomy. Frictional unemployment
The long queues of unemployed workers atfactory gates during the Great Depressionsuggest that jobs are lacking in recessions,irrespective of the amount of effort that the jobless put into searching for them.Pascal Michaillat explains how this seeminglysimple insight has important implications for today’s economic policy debates.
Jobs in a recession
In recessions,the labour
marketfunctions as a
rat race: forcingpeople to
search harderwill not create
more jobs,only more
competition inthe queues

CentrePiece Spring 2012
4
policy is unemployment insurance. Weoften hear economists asking forunemployment benefits to be lowered inrecessions. They argue that a reduction ofunemployment benefits would forcejobseekers to spend less time on thecouch and more time actively searchingfor a job. As a result, they say,unemployment would fall and theeconomy would recover.
They are probably right about the firstpoint that workers would spend moretime off the couch searching for a job. Butthey are mistaken about the second pointthat unemployment would fall becausethey forget that people queue for jobs indeep recessions. Once this feature isincorporated into a model, unemploymentdoes not depend much on the efforts of
measures additional unemployment due to frictions in matching firms with workers.
The key feature of the model appearsin Figure 1, which plots a simulation of USunemployment and its decomposition intorationing unemployment (the blue area)and frictional unemployment (the greenarea). There is no rationing unemploymentin expansions, but there is as much as 8%of rationing unemployment in deeprecessions. Frictional unemployment maybe as high as 5% in expansions, but it fallswell below 2% in deep recessions(Michaillat, 2010).
Even though the labour market alwayssees vast flows of jobs and workers and agreat deal of matching activity, recessions– as in the early 1980s, the early 1990sand the late 2000s – are periods of acutejob shortage during which matchingfrictions have little influence on labourmarket outcomes.
The intuition is simple once we thinkabout queues. In recessions the firm canhire a new worker immediately, at no cost,in the queue in front of the factory gates.If the firm does not hire a new worker, itis not because of recruiting costs butbecause it would not know how to use anextra worker. With this result in mind, wecan think about the design of economicpolicies over the business cycle.
When unemployment is high, a critical
Figure 1:
Rationing unemployment and frictional unemployment
10%
8%
6%
4%
2%
0%
1964 1974 1984 1994 2004 2008
■ Rationing unemployment■ Frictional unemployment
Source: Michaillat (2010)
Unemployment insuranceshould be more generous inrecessions and less generousin expansions
US
UN
EMPL
OY
MEN
T RA
TE

CentrePiece Spring 2012
5
jobseekers in recessions (even when theeconomy has not reached the point wherequeues form in front of factory gates).
To understand how to designunemployment insurance in a modelconsistent with the existence of queues indeep recessions, I collaborated withCamille Landais and Emmanuel Saez.
Our main result is displayed in Figure 2, which plots the optimalreplacement rate – the amount transferredto unemployed workers expressed as afraction of the income of employedworkers – as a function of theunemployment rate. It is optimal toincrease the generosity of unemploymentinsurance in recessions: the replacementrate increases from 51% to 71% whenunemployment increases from 4% to 10%(Landais et al, 2011).
Again, the intuition for this result issimple once we think about queues. Whatwould happen if the governmentdrastically reduced unemployment benefitsin recessions? Perhaps unemployedworkers would spend eight hours a day injob queues, instead of four hours in thequeue and four hours on the couch. This reduction in benefits implies thatthere are now, say, 200 people instead of100 people continuously queuing in frontof the factory gates.
But the larger number of applicantsdoes not matter for the firm. I havealready argued that if the firm does nothire a new worker, it is not because ofrecruiting costs but because it would notknow how to use an extra worker. Whilelower unemployment benefits do makeunemployed workers poorer, they do not
reduce unemployment much. So reducingunemployment insurance in recessions is undesirable.
Some will say that this argumentcannot possibly be correct. We(economists) know that when anunemployed worker loses his entitlementto unemployment benefits, he finds a job
Figure 2:
Optimal unemployment insurance over the business cycle
Source: Landais et al (2011)
75%
70%
65%
60%
55%
50%
4% 5% 6% 7% 8% 9% 10%
The governmentshould invest ininfrastructure in
recessionsrather than
expansions toavoid crowding
out privateemployment
REPL
AC
EMEN
T RA
TE
UNEMPLOYMENT RATE
CentrePiece Spring 2012
6
much more rapidly than before. That istrue. Think about the queues. If you loseyour benefits, you will fight your way tothe gate and increase your chance ofgetting the job when there is an opening.But when you move up the queue, the workers that were in front of you are now behind you, and they move downthe queue.
The labour market functions as a ratrace in recessions. Forcing people tosearch harder will not increase the numberof people who find a job. It may onlychange who finds a job. So it is notdesirable to make unemployed workerspoorer. It will not create more jobs, onlymore competition in the queues.
Finally, fiscal policy may be useful toreduce unemployment in recessions. Onecommon complaint about fiscal policy,however, is that it may negatively affectthe private sector. These negative effectsmay undo the possible beneficial effects of the policy.
For example, during the GreatDepression, US fiscal policy took the formof public employment. PresidentRoosevelt’s administration hired millions of unemployed people to build dams,bridges and roads. The goal of public
2.5
2
1.5
1
0.5
0
4% 5% 6% 7% 8% 9% 10%
■ Baseline■ Public capital■ Public sector wage
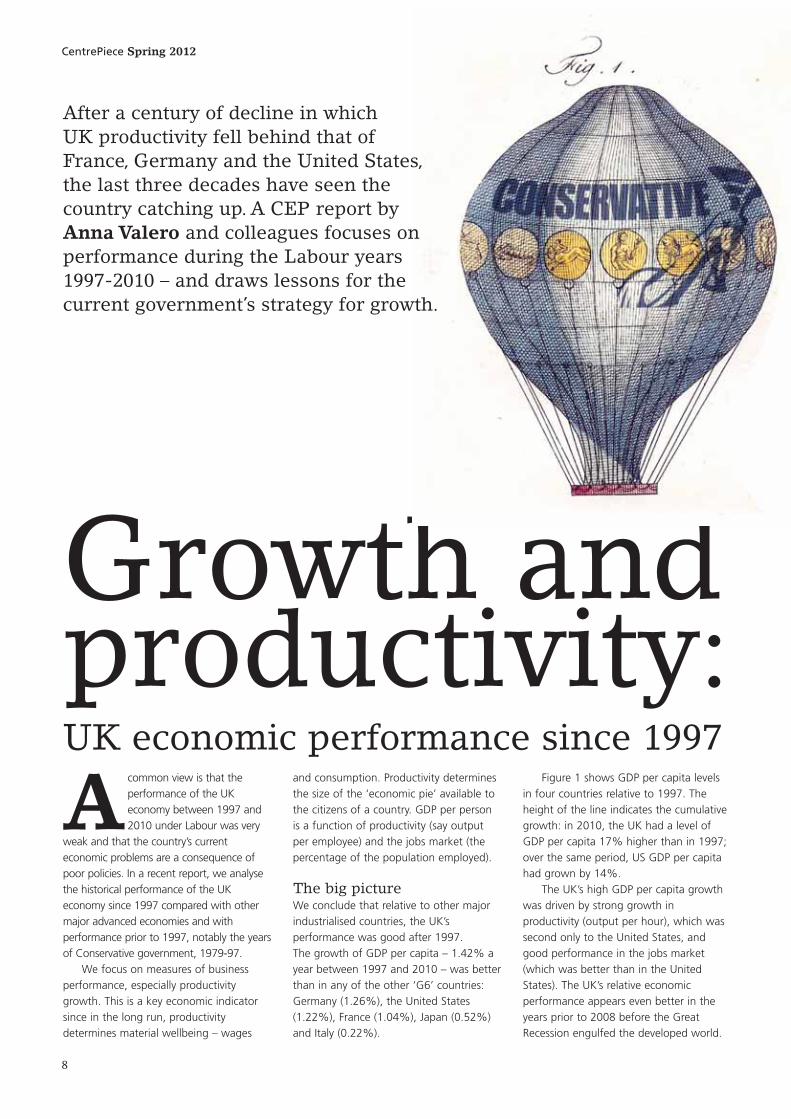
Figure 3:
Fiscal multipliers over the business cycle
Source: Michaillat (2012)
NU
MBE
R O
F JO
BS C
REA
TED
BY
SPE
ND
ING
1% O
F G
DP
ON
PU
BLIC
EM
PLO
YM
ENT
UNEMPLOYMENT RATE
The governmentdisturbs privateemployers muchless when ithires workers in recessionsinstead of inexpansions

CentrePiece Spring 2012
7
employment was to bring unemployedworkers back to work.
But the Roosevelt administration wasconcerned that the public jobs created aspart of the New Deal might make it moredifficult for private firms to hire workers bytaking away job applicants. They thoughtthat if a mason were hired by thegovernment to work on a public building,it could prevent a construction firm fromfilling a vacant mason job. If each publicjob displaced a private job, then it wouldindeed be ineffective to resort to publicemployment.
My research shows that while theRoosevelt administration would be right toworry about the displacement of privatejobs by public jobs in expansions, there isbarely any displacement in recessions.Public employment is especially effective atstimulating the economy at any timewhen the labour market is depressed.
This result is illustrated in Figure 3,which displays the increase in theemployment rate achieved by spending1% of GDP on public employment. In the basic model (the black line), thenumber of jobs created by publicemployment increases nearly fourfold from 0.27 to 1.15 when theunemployment rate increases from 4% to10% (Michaillat, 2012).
The number of jobs created is largerwhen public sector employees contributeto improving infrastructure (the orangeline) because building public capitalimproves productivity in the private sector,which translates into higher privateemployment in the future. The number isalso larger when public jobs paysomewhat below private jobs (the greenline, which is obtained with a 5% wagepremium in the private sector).
These results suggest that theRoosevelt administration respondedappropriately by hiring workers as part oflarge infrastructure projects, and by payingrelief-job wages typically well belowprivate sector wages.
The model is too simple to be thebasis for quantitative estimates of theeffects of actual fiscal policy interventions.Nonetheless, it has some theoreticalfeatures that could guide the design ofpolicies in recessions.
A first feature is that to maximise thebenefits to society as a whole,unemployment insurance should be moregenerous in recessions and less generous
in expansions. Another feature is that thegovernment disturbs private employersmuch less when it hires workers inrecessions instead of in expansions.
An implication is that if thegovernment needs to conductinfrastructure projects, it should plan to doit in recessions instead of expansions toavoid crowding out private employment.Another implication is that if thegovernment needs to lay off public sectoremployees, it should do it in expansionsinstead of recessions so that publicemployees who are laid off are able tofind a job rapidly in the private sector.
Pascal Michaillat is a lecturer in economics
at LSE and a research associate in CEP’s
labour markets programme. This article draws
on some of his recent research papers:
Pascal Michaillat (2010) ‘Do Matching
Frictions Explain Unemployment? Not in Bad
Times’, CEP Discussion Paper No. 1024
(http://cep.lse.ac.uk/pubs/download/
dp1024.pdf) and forthcoming in the American
Economic Review, June 2012
Camille Landais, Pascal Michaillat and
Emmanuel Saez (2011) ‘Optimal
Unemployment Insurance over the Business
Cycle’, CEP Discussion Paper No. 1078
(http://cep.lse.ac.uk/pubs/download/
dp1078.pdf)
Pascal Michaillat (2012) ‘Fiscal Multipliers
over the Business Cycle’, CEP Discussion
Paper No. 1115 (http://cep.lse.ac.uk/pubs/
download/dp1115.pdf)
If the government needsto lay off public sector
employees, it should do it in expansions rather
than recessionsht
tp://
yout
u.be
/d9g
Y2a
kv38
4
CentrePiece Spring 2012
8
Acommon view is that theperformance of the UKeconomy between 1997 and2010 under Labour was very
weak and that the country’s currenteconomic problems are a consequence ofpoor policies. In a recent report, we analysethe historical performance of the UKeconomy since 1997 compared with othermajor advanced economies and withperformance prior to 1997, notably the yearsof Conservative government, 1979-97.
We focus on measures of businessperformance, especially productivitygrowth. This is a key economic indicatorsince in the long run, productivitydetermines material wellbeing – wages
and consumption. Productivity determinesthe size of the ‘economic pie’ available tothe citizens of a country. GDP per personis a function of productivity (say outputper employee) and the jobs market (thepercentage of the population employed).
The big pictureWe conclude that relative to other majorindustrialised countries, the UK’sperformance was good after 1997. The growth of GDP per capita – 1.42% ayear between 1997 and 2010 – was betterthan in any of the other ‘G6’ countries:Germany (1.26%), the United States(1.22%), France (1.04%), Japan (0.52%)and Italy (0.22%).
Figure 1 shows GDP per capita levelsin four countries relative to 1997. Theheight of the line indicates the cumulativegrowth: in 2010, the UK had a level ofGDP per capita 17% higher than in 1997;over the same period, US GDP per capitahad grown by 14%.
The UK’s high GDP per capita growthwas driven by strong growth inproductivity (output per hour), which wassecond only to the United States, andgood performance in the jobs market(which was better than in the UnitedStates). The UK’s relative economicperformance appears even better in theyears prior to 2008 before the GreatRecession engulfed the developed world.
Growth andproductivity:UK economic performance since 1997
After a century of decline in which UK productivity fell behind that ofFrance, Germany and the United States,the last three decades have seen thecountry catching up. A CEP report by Anna Valero and colleagues focuses onperformance during the Labour years1997-2010 – and draws lessons for thecurrent government’s strategy for growth.

CentrePiece Spring 2012
9
But wasn’t it all a bubble?The UK’s impressive productivityperformance relative to other countrieswas a continuation of the trends duringthe period of Conservative governmentfrom 1979. This broke a pattern of relativeeconomic decline stretching back acentury or more.
UK GDP per capita fell relative toFrance, Germany and the United Statesfrom 1870 to 1979, but over the next threedecades this trend reversed. UK GDP percapita was 23% above the United States in1870 whereas the United States was 43%ahead of the UK in 1979. By 2007, the UKstill lagged behind the United States, butthe gap had closed to 33%.
During the past 30 years, the UK hashad a faster catch-up of GDP per capitawith the United States under Labour thanunder the Conservatives, although therehas been a slower rate of relativeimprovement when the UK is comparedwith France.
But surely the growth of productivitywas all due to ‘unsustainable bubbles’ insectors such as finance, property and oil?’Actually, the answer seems to be ‘no’. The expansion of property and the publicsector both actually held back aggregate
productivity. The financial sectorcontributed only about 0.4% of the 2.8%annual growth in the UK market economybetween 1997 and 2010.
Our analysis shows that theproductivity increases were mainly inbusiness services and distribution, andthey were generated through theincreased importance of skills and newtechnologies. It is difficult to see how allsuch activities could have been generatedby an artificial financial or propertybubble.
Analysis of other indicators ofbusiness performance – such asforeign direct investment, innovation,entrepreneurship and skills –supports our view that the gainsin productivity were largely realrather than a statistical artefact.
This points to a morepositive reading of the supplyside of the economy than thecurrent consensus. Althoughthe UK still has somelongstanding issues in terms oflower investment relative toother G6 economies (especially inR&D and vocational skills), thingshave improved.
Figure 1:
Trends in GDP per capita 1979-2010 (relative to 1997)
30%
20%
10%
0%
-10%
-20%
-30%
-40%
1980 1985 1990 1995 2000 2005 2010
■ UK■ United States■ Germany■ France
UK economicperformance
under Labourcontinued the trend
improvementunder the
previousConservativegovernment
Notes: The analysis is based on OECD data (with Germany dropped before 1997 due to
reunification). GDP is measured in US dollars at constant prices and constant PPPs, using the
OECD base year of 2005. The working age population data are from the US Bureau of Labor
Force Statistics. For each country the logged series is set to zero in 1997, so the level of the line in
any year indicates the cumulative growth rate (for example, a value of 0.1 in 2001 indicates that
the series grew by exp(0.1)-1=11% between 1997 and 2001). The steeper the slope of the line, the
faster growth was over that period.

CentrePiece Spring 2012
10
Did Labour’s policies haveany positive influence?Some have argued that Labour simplyenjoyed a ‘free ride’ on the radicalism ofMrs Thatcher. Most analysis suggests thatfreeing up the labour market throughbreaking union militancy, removingsubsidies for ‘lame ducks’ andimplementing privatisation, lower marginaltax rates and cuts in benefits all boostedperformance after 1979. On this line ofargument, the best that could be said isthat at least Labour did not return to thefailed pro-union, anti-competitive policiesof the 1970s.
But the ‘at least Labour didn’t mess itup’ argument is not compelling. It is hardto believe that the Thatcher reformspermanently kept productivity growthhigher for the next 15 years. The anti-union policies may have raised output, forexample, but it stretches credulity to thinkthat they kept the UK on a permanentlybetter path of productivity growth.
We believe that it is more likely thatsome policies of the Labour governmentdrove some of the productivityimprovement. In particular, thestrengthening of competition policy andutility regulation, the support forinnovation and the expansion of universityeducation played a positive role. It ispossible that immigration may have alsoplayed a positive role.
Establishing the exact magnitude ofthe causal impact of these policies isdifficult, and the need for properquantitative policy evaluation remains asstrong as ever. Unfortunately, Labour’srhetoric of ‘evidence-based policy’ oftendid not work out in practice. As with thepresent government, there was too much‘policy-based evidence’.
The policy area where Labour clearlyfailed was financial regulation. In addition,and more clearly with hindsight, publicdebt was allowed to rise higher than itshould have done. Although these factorsdid not drive the boom and did not causethe global recession by themselves, the UKeconomy was more vulnerable to therecession than it should have been.
Does the Great Recessionchange everything?Does the experience of the recession since2008 show that the productivityimprovements to the supply side since1997 were illusory? We have argued ‘no’
Policies based onan excessively
pessimistic viewof potential
output can leadto needlesslyslow growth
as the 1997-2010 improvements were realand not due to the bubble sectors offinance, property and oil. But how muchdid the financial crisis permanently reducethe rate and level of productivity growth?
The extreme version of the ‘supply-side pessimism’ argument is that becausethe recession was caused by a bankingcrisis, the fall in potential output has beenso severe that the UK’s output gap (thedifference between actual and potentialGDP) is now close to zero and productivitygrowth will be permanently lower.Pessimists point to the 7% fall in GDP andslower growth from the trough of the2009 recession.
It is likely that the recession hascaused some permanent fall in outputcompared with what it would have beenwithout a deep downturn. But there ishuge uncertainty over the size of theoutput gap. An alternative explanation toa supply shock that has permanentlyreduced the level and growth rate ofpotential output is simply that globaldemand is muted.
Productivityincreases underLabour weremainly inbusiness servicesand distribution,not finance andproperty bubbles
CentrePiece Spring 2012
11
A strategy for long-run growthWhatever view is taken on shorter-termpolicies, all sides agree on the need tofocus on longer-term growth. The report draws out some of the lessons from our analysis for how to restorelonger-term growth.
The structural improvement in the UK’srelative performance since 1979 containsthe lesson that getting the marketenvironment right is key: strong productmarket competition, openness to foreigninvestment, flexible labour markets, awelfare to work system and smartregulation are major factors in promotinggrowth. Government has a role in all ofthis, setting the rules, and it also needs tobe pro-active in building human capitaland infrastructure and supportinginnovation.
Our report argues that a growthstrategy must go beyond the‘laundry list’ approach as policiesinteract with each other andefforts must be focused. Wesketch a plan for a ‘V-shaped’recovery that requires the state andcivil society to scan the globaleconomy for potentialgrowth in demand, and thenfocus on areas where the UKhas actual or latentcomparative advantage.
Within this space, there has to berelentless scrutiny of where the state ishindering and where it could help. Aspecific example is higher education, aglobally growing sector in which the UKhas comparative advantage as witnessedby the country’s strong science base andhigh share of the market for overseasstudents (who count as service exports).Restricting immigration is hugelydamaging to this sector.
More generally, growth policies couldinclude supporting sector-specific skills,access to credit for small enterprises andinnovation in key industries such assoftware and healthcare. We offer less ofa blueprint for growth than a way ofthinking about growth that could form thebasis for economic revival.
Three considerations point in amore optimistic direction. First, the pre-2008 productivity growth rate suggeststhat the supply side made realimprovements before the crisis.
Second, the fall in productivitybetween 2008 and 2011 is broad-basedand not all due to specific sectors suchas finance and oil (just as the 1997-2008 productivity growth rates were notdominated by these sectors).
Third, wage growth remains verylow, consistent with substantial sparecapacity in the economy.
We worry that policies based on an excessively pessimistic view ofpotential output can lead to needlesslyslow economic growth. Indeed,pessimism over the state of the supplyside can become self-fulfilling as ever-larger austerity programmes causeexcess scrapping of human and physical capital.
Policies in the short tomedium run: to Plan B or not to Plan B?The current ‘Plan A’ for the UKeconomy is a period of very strongfiscal consolidation – spending cuts andtax rises to eliminate the structuralpublic sector deficit in the life of thisParliament.
An alternative Plan B would be toslow down the pace of the fiscalconsolidation. If the output gap werenear zero, then Plan B would simplyincrease inflation, so the fact that wethink there is a good chance of asubstantial output gap implies thepossibility of a Plan B.
The desirability of a Plan B wouldbe muted if monetary policy wassufficient, if fiscal policy was ineffectivein an open economy like the UK, if anyincrease in public spending or tax cutswas irreversible or if markets wouldpanic at any retreat from Plan A.
Our report considers theseproblems, but does not find themoverwhelming objections. We arguethat we do indeed need a medium-term plan for debt reduction but thisdoes not have to be done at thecurrent speed when the advancedworld economy is so fragile. Thus weneed a short-term stimulus (‘Plan B’) and a long-term growth strategy (‘Plan V’).
This article summarises ‘UK Economic
Performance Since 1997: Growth, Productivity
and Jobs’ by Dan Corry, Anna Valero and John
Van Reenen, CEP Special Paper No. 24
(http://cep.lse.ac.uk/pubs/download/
special/cepsp24.pdf).
Dan Corry, chief executive of New
Philanthropy Capital, was head of the
Number 10 Policy Unit, 2007-10. Anna Valero
is an occasional research assistant in CEP’s
productivity and innovation programme.
John Van Reenen is director of CEP and
co-chair with Tim Besley of the LSE Growth
Commission, which will report at the end
of the year on policies to boost sustainable
UK growth.
Getting the marketenvironment right is key forpromoting long-run growth

CentrePiece Spring 2012
12
The question of whether there is a link between schoolresources and pupil outcomes is very important at a timeof public spending cuts. In education, these cuts arearising because nominal expenditure on almost everythinghas been frozen while inflation is rising. The oneexception is the government’s ‘pupil premium’ policy,which pays schools a specific sum of money for each childfrom an economically disadvantaged background – asmeasured by whether they are eligible to receive freeschool meals.
The amount is currently £430 per disadvantaged pupil andit is set to rise to £600 in 2012/13. Because only 17% ofpupils are eligible to receive free school meals, this doesnot work out as a large amount on average. But while it isnot enough to outweigh the effects of inflation on overallschool expenditure (which is falling in real terms), it hasimportant distributional consequences for how resourcesare allocated between schools.
Our research looks at whether changes to schools’resources really make much difference to pupilachievement, as measured by key stage tests at the end ofprimary school. We are able to do this because of a quirkin the national funding formula.
This quirk is related to the ‘area cost adjustment’, which isintended to compensate for differences in the costs of
Urban schools:does money make a difference?It might seem self-evident that a school’s resources influence its pupils’educational outcomes, yet so many studies have found little associationbetween greater funding and improved academic achievement. Steve Gibbonsand colleagues examine whether money makes a difference in the context ofurban primary schools in England.
in brief...
Cuts to school funding arelikely to have negativeconsequences for pupils’academic achievement
Phot
o Ja
ckie
Sch
nied
er ja
ckie
ssch
oolfo
odbl
og.b
logs
pot

CentrePiece Spring 2012
13
employing teachers between local authorities. In reality,however, closely neighbouring schools in adjacent localauthorities are not recruiting in different labour markets,and their teachers are paid according to national payscales that do not correspond to the area costadjustments.
The result is that schools that are just yards apart on eitherside of a local authority boundary can get very differentlevels of funding. This has led to various local campaignsagainst the perceived unfairness of the arrangements – forexample, the ‘fair deal for Haringey schools’ campaign.For research purposes, the arrangements are usefulbecause they make it possible for us to compare schoolsthat are similar in every respect except for differences inschool funding.
We evaluate whether schools with different levels ofexpenditure (arising from the funding anomaly) havedifferent outcomes in national tests in English, maths andscience at the end of primary school (key stage 2 tests).The analysis is carried out using the National PupilDatabase (a census of all pupils in state schools) between2004 and 2009.
Since our strategy relies on schools being near a localauthority boundary, the schools in our sample tend to bein urban areas with a higher than average intake ofdisadvantaged pupils. Our research design ensures thatthe schools we are comparing on either side of the localauthority boundary really are similar. We only comparecommunity schools with a similar level of disadvantage (as measured by the intake of pupils eligible to receive free school meals) that are within 2km of the comparisonschool (on the other side of the boundary).
We also check that the schools look similar in otherrespects – for example, their ethnic mix, the proportion of pupils who speak English as a first language, schoolsize and neighbourhood house prices – and that pupils are not moving across boundaries in response to fundingdifferences between schools. All our checks suggest that the methodological design is appropriate formeasuring the true causal impact of the fundingdifferences between schools.
The results show large effects of expenditure oneducational attainment at the end of primary school. They suggest that an additional £1,000 per pupil paid toschools in these urban areas (close to local authorityborders) raises pupil test scores at key stage 2 significantly.The effect is equivalent to moving one in five pupilscurrently achieving level 4 in maths (the target grade) tolevel 5 (the top grade) and just under a third of pupilscurrently at level 3 in maths to level 4.
The effects of expenditure also tend to be higher inschools with more disadvantaged pupils. These effects arelarge. They suggest that cuts to funding in schools will
have consequences for pupils’ academic achievement.More positively, they suggest that the pupil premiumcould have a very beneficial effect and will help to closethe performance gap for schools that enrol high shares ofpupils from low-income families.
We cannot use this analysis to say what types ofexpenditure are more or less effective for raising pupilachievement. But we provide some insights by looking athow the overall funding differences affect spending invarious categories.
We find that additional income tends to get spentdisproportionately on items other than teaching costs (thebiggest item), with small increases in the shares spent onlearning and computer resources, professional services andsupplies. This might be because small expendituredifferentials cannot easily be used to employ additionalteachers and the inflexibility of pay structures limits anypay for performance.
The main insight of our analysis is that funding mattersconsiderably more than analysts and media commentatorsoften suggest. We should be concerned about theconsequences of cuts to real expenditure in state schools.Local campaigners have also been right to raise concernsabout school funding inequalities generated by the areacost adjustment in the national formula.
This article summarises ‘Does Additional Spending Help Urban
Schools? An Evaluation Using Boundary Discontinuities’ by Steve
Gibbons, Sandra McNally and Martina Viarengo, Centre for the Study of
the Economics of Education Discussion Paper No. 128
(http://cee.lse.ac.uk/ceedps/ceedp128.pdf).
Steve Gibbons is research director of the Spatial Economics Research
Centre (SERC), reader in economic geography at LSE and a research
associate in CEP’s education and skills programme. Sandra McNally is
director of CEP’s education and skills programme and professor of
economics at the University of Surrey. Martina Viarengo, an assistant
professor at the Graduate Institute in Geneva, is a research associate in
CEP’s education and skills programme.
More discussion of this study is on the SERC blog:
http://spatial-economics.blogspot.com/2011/09/
urban-schools-more-money-better.html
The pupil premium could close the
performance gap forschools with lots
of pupils from low-income families

CentrePiece Spring 2012
14
The number of non-native speakers of English in primaryschools in England has increased by a third over the past10 years. Now, roughly one in nine children between theages of 5 and 11 do not speak English as a first language.A significant driver of this change has been immigration,though the trend has also been influenced by higher birthrates among ethnic minority groups.
The change has led some commentators to fear that theimpact might be detrimental to the educationalattainment of native English speakers. They fear thatteachers’ time will be taken up giving extra help tochildren who do not speak English as a first language.
Yet several studies have shown that first and secondgeneration immigrants are, on average, better educatedthan the native population. This suggests that there mightbe things about the children of immigrants – such ashaving better educated parents – that can compensate forany lack of language fluency at an early age. In that case,native English speakers would not necessarily suffer fromhaving such children as their peers.
Our research analyses a census of all children in Englishschools – the National Pupil Database – to explore these
issues. We look at whether there is anassociation between the proportion of
non-native English speakers in a year group and theeducational attainment of native English speakers at theend of primary school – and whether it can be interpretedas a causal relationship.
We also split the data into white and non-white non-native speakers to see if there might be different effects.Although the latter group is more important numerically,the former has grown very sharply after the easternenlargement of the European Union (EU) in 2005.
We find that there is a modest negative correlation in theraw data between the educational attainment of nativeEnglish speakers and the proportion of non-native
Language barriers? The impactof non-native English speakers in the classroomThe number of primary school pupils in England who do not speak Englishas a first language has been growing in recent years. Sandra McNally andcolleagues examine whether this is damaging the educational outcomes ofnative English speakers.
in brief...
The growing proportion of non-native English
speakers in primaryschools is not detrimental
to the educationalattainment of native
English speakers

CentrePiece Spring 2012
15
speakers in their year group. This correlation is halvedonce the demographic characteristics of native Englishspeakers have been controlled for. It disappears altogetheronce the type of school attended by non-native Englishspeakers has been controlled for.
This means that the negative correlation in the raw datareflects the fact that non-native English speakers typicallyattend schools with more disadvantaged native speakers.Once this fact has been taken into account, there is zeroassociation between their presence in greater numbersand the educational attainment of their native English-speaking peers.
This result also holds true for younger cohorts (age 7instead of age 11) and when looking at the number oflanguages spoken in the year group instead of thepercentage of non-native English speakers. We exploremany different aspects of heterogeneity, for example,looking at native English speakers who are disadvantaged,who are of low ability and who are based in London.
We also divide non-native English speakers into those whoappeared in the school census in the last two years ofprimary school versus those who were in the school censusbefore that time. This affects the raw association betweenthe percentage of non-native English speakers and theeducational attainment of native English speakers. Butonce demographics of native speakers and school controlsare added, the effects go to zero in almost every case.
Under certain assumptions, our estimates can beinterpreted as reflecting a causal relationship. While wecannot fully test these assumptions, our analysis stronglysuggests that negative causal effects of non-native Englishspeakers on the educational attainment of native Englishspeakers can be ruled out.
We also use another research strategy to look at therelationship between the percentage of white non-nativeEnglish speakers and the educational attainment of nativeEnglish speakers. This strategy uses the fact that thenumber of white non-native English speakers grewdramatically after the EU’s eastern enlargement in 2005.
Since many of the new immigrants were Polish (and likelyto be Catholic), there was a big rise in the demand for Catholic schooling. The data show a much largerincrease in the percentage of white non-native Englishspeakers in (state) Catholic schools after 2005 comparedwith other schools.
We use this as a ‘natural experiment’ to see if there wereconsequences for the relative educational attainment ofnative English speakers in Catholic schools. The results for
reading and writing show no clear impact, but there issome evidence for a small, positive effect in the case ofmaths. In other words, native English speakers at Catholic schools that saw a strong relative increase inwhite non-native speakers benefited to a small extent intheir maths results.
We can only speculate as to the possible reasons for thisresult. It may be the fact that immigrants from EastEuropean countries are better educated and moreattached to the labour market than the native population.The children of such immigrants may be a welcomeinfluence in the schools they attend.
The two different research strategies apply to differentpopulations. The first shows associations that areapplicable to all schoolchildren. The second – making useof eastern enlargement – only estimates the effects onnative English speakers in Catholic schools who wereexposed to an increase in white non-native speakers afterenlargement. Thus, the latter results cannot beextrapolated to other contexts.
But both strategies suggest that negative effects of non-native English speakers can be ruled out. Thus, thegrowing proportion of non-native English speakers inprimary schools should not be a cause for concern: thistrend is not detrimental to the educational attainment ofnative English speakers.
This article summarises ‘Non-native Speakers of
English in the Classroom: What are the Effects on
Pupil Performance?’ by Charlotte Geay, Sandra
McNally and Shqiponja Telhaj, Centre for the
Study of the Economics of Education Discussion
Paper No. 137 (http://cee.lse.ac.uk/ceedps/
ceedp137.pdf). The research was funded
by the Nuffield Foundation.
Charlotte Geay is at the Paris Graduate School
of Economics, Statistics and Finance.
Sandra McNally is director of CEP’s research
programme on education and skills and professor
of economics at the University of Surrey.
Shqiponja Telhaj is a lecturer at the University
of Sussex and a research associate in CEP’s
education and skills programme.
Non-native Englishspeakers are more
likely to attend schoolswith disadvantaged
native speakers

CentrePiece Spring 2012
The idea that people who areresponsible for creating a messshould be charged for itsremoval resonates with
common perceptions of fairness. But inpublic policy-making, even before thefinancial crisis, there are many examples ofthis idea being turned on its head.
Climate change policy is one such area– a problem inherently linked to therealities of trying locally to regulategreenhouse gas emissions that are
thoroughly global in their impact. Despitemany efforts to coordinate policies acrosscountries since the signing of the UnitedNations Framework Convention on ClimateChange 20 years ago, climate changepolicy is still very much a localised affair.
So although some governments aretrying to reduce emissions, they also worryabout the possible negative effects ofpollution legislation on the competitivenessof their countries or regions. In a globalisedeconomy, such concerns are not
unfounded as the dynamics of comparativeadvantage are conducive to shiftingpollution-intensive production fromregulated to unregulated regions.
Regulated firms also have everyincentive to play up the risks to theircompetitiveness even if there is no basisfor their claims. What’s worse is thatgovernments have little to go by inevaluating such risks other than theassessments of the regulated firmsthemselves. And irrespective of any risks to
When governments design policies to reducefirms’ greenhouse gas emissions, are they toolenient on heavy polluters that claim suchmeasures will damage their ability to competein the global economy? Ralf Martin, Laure dePreux and Ulrich Wagner assess the UK’sexperience with the climate change levy.
The polluter-doesn’t-pay principle
CentrePiece Spring 2012
17
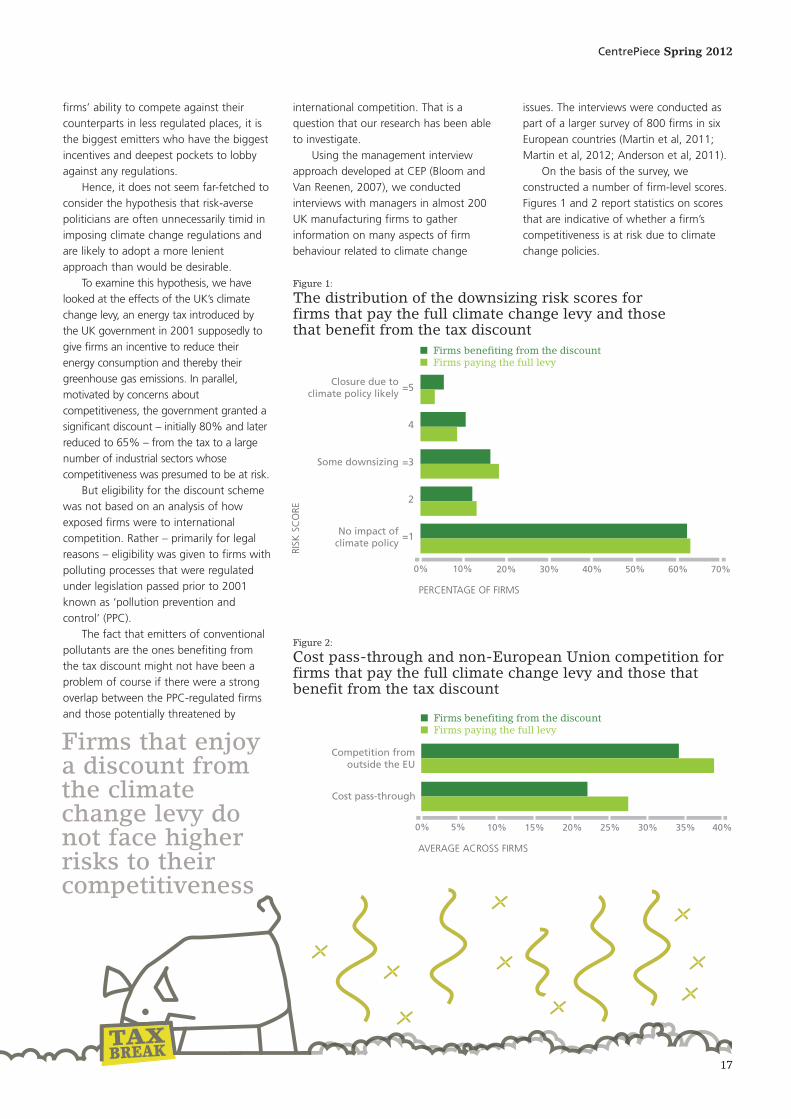
Figure 2:
Cost pass-through and non-European Union competition forfirms that pay the full climate change levy and those thatbenefit from the tax discount
0% 10% 20% 30% 40% 50% 60% 70%
Closure due toclimate policy likely
Some downsizing
No impact ofclimate policy
=5
4
=3
2
=1
■ Firms benefiting from the discount■ Firms paying the full levy
0% 5% 10% 15% 20% 25% 30% 35% 40%
Competition fromoutside the EU
Cost pass-through
■ Firms benefiting from the discount■ Firms paying the full levy
Figure 1:
The distribution of the downsizing risk scores forfirms that pay the full climate change levy and thosethat benefit from the tax discount
firms’ ability to compete against theircounterparts in less regulated places, it isthe biggest emitters who have the biggestincentives and deepest pockets to lobbyagainst any regulations.
Hence, it does not seem far-fetched toconsider the hypothesis that risk-aversepoliticians are often unnecessarily timid inimposing climate change regulations andare likely to adopt a more lenientapproach than would be desirable.
To examine this hypothesis, we havelooked at the effects of the UK’s climatechange levy, an energy tax introduced bythe UK government in 2001 supposedly togive firms an incentive to reduce theirenergy consumption and thereby theirgreenhouse gas emissions. In parallel,motivated by concerns aboutcompetitiveness, the government granted asignificant discount – initially 80% and laterreduced to 65% – from the tax to a largenumber of industrial sectors whosecompetitiveness was presumed to be at risk.
But eligibility for the discount schemewas not based on an analysis of howexposed firms were to internationalcompetition. Rather – primarily for legalreasons – eligibility was given to firms withpolluting processes that were regulatedunder legislation passed prior to 2001known as ‘pollution prevention andcontrol’ (PPC).
The fact that emitters of conventionalpollutants are the ones benefiting fromthe tax discount might not have been aproblem of course if there were a strongoverlap between the PPC-regulated firmsand those potentially threatened by
Firms that enjoya discount fromthe climatechange levy donot face higherrisks to theircompetitiveness
international competition. That is aquestion that our research has been ableto investigate.
Using the management interviewapproach developed at CEP (Bloom andVan Reenen, 2007), we conductedinterviews with managers in almost 200UK manufacturing firms to gatherinformation on many aspects of firmbehaviour related to climate change
issues. The interviews were conducted aspart of a larger survey of 800 firms in sixEuropean countries (Martin et al, 2011;Martin et al, 2012; Anderson et al, 2011).
On the basis of the survey, weconstructed a number of firm-level scores.Figures 1 and 2 report statistics on scoresthat are indicative of whether a firm’scompetitiveness is at risk due to climatechange policies.
PERCENTAGE OF FIRMS
RISK
SC
ORE
AVERAGE ACROSS FIRMS

CentrePiece Spring 2012
18
Figure 1 displays a score that is directlybased on asking managers if they expectthat their firms will downsize or indeedexit the UK (and Europe) due to climatechange policies during the next 10 years.We see very little difference between firmsthat benefit from the tax discountcompared with those that do not.
The same conclusion emerges whenlooking at the extent to which managersbelieve that they can pass on cost increasesfrom the tax to customers in the form ofhigher prices (‘cost pass-through’) or whenconsidering the share of foreign non-European Union competitors that a firmhas (see Figure 2). If the competitiveness offirms eligible for the discount is at risk, weshould see that they have lower cost pass-through rates, a higher share of overseascompetitors or both.
Hence, the government’s way ofidentifying firms whose competitiveness isat risk seems to be solidly off target. Whilethis is deplorable from a policy point ofview, it opens up a unique opportunity forresearchers to examine if an energy taxsuch as the climate change levy has thenegative impact that industry lobby groups claim.
Figure 1 indicates that roughly two infive managers report that climate changepolicy may have a negative impact on theirfirm to the extent that they expect todownsize or completely close down. But itis striking that these firms are fairly equallydistributed between those that pay the fullclimate change levy and those that benefitfrom the tax discount.
A comparison of what happened tofirms in the two categories following the2001 introduction of the climate changelevy should thus give us a good idea ofthe effects of such an energy tax. We turnto this next.
Figure 3 reports the average difference in growth rates of various firm-level outcomes between firms that are
eligible for the tax discount and thosepaying the full levy before and after 2001(Martin et al, 2009). We see that thegrowth rate of employment as well asoutput in firms that were not eligible forthe tax discount was on average morethan two percentage points higher than ineligible firms.
Similarly, there is no significantdifference in terms of productivity. Infurther analysis, we have confirmed thatthere is no significant difference in plantexit either. If there were any impact oncompetitiveness, we would expect that
Figure 3:
Growth rate differential between firms that pay thefull climate change levy and those that benefit fromthe tax discount
-8% -6% -4% -2% 0% 2% 4%
Electricity consumption
Energy expenditure over revenue
(Multifactor) productivity
Output
Employment
Note: Authors’ calculations based on data from the Office for National Statistics.
Firms that paythe full climate
change levyreduce their
energy use andtheir emissions
by more thanthose that get a
tax discount
CentrePiece Spring 2012
19
Ralf Martin, an assistant professor at
Imperial College Business School, is a senior
visiting research fellow at CEP. Laure de
Preux is a research officer in CEP’s
programmes on productivity and innovation
and wellbeing. Ulrich Wagner, an assistant
professor at Carlos III University in Madrid,
is a research associate in CEP’s productivity
and innovation programme.
By granting discounts, thegovernment is missing out on tax
revenues and achieving less inreducing emissions
firms without the tax discount would becontracting faster and would be morelikely to exit.
We also repeated this analysis fordifferent sub-samples in our data, forexample, focusing on more energy-intensive firms, which might be expectedto be more at risk. Again we find noevidence of negative effects oncompetiveness.
In contrast, we do find significantdifferences when looking at the growthrate of firms’ energy consumption,which is the target of a tax such as theclimate change levy. Our results suggestthat firms paying the levy in full reduceenergy consumption at a rate more than5% higher than firms benefiting fromthe discount (see Figure 3).
What are the implications of ourresults? First, there is no evidence thatfirms with the tax discount are facinghigher risks to their competitiveness thanfirms that pay the full climate changelevy. Moreover, we cannot find anyevidence for negative effects oncompetitiveness. Not only does thissuggest that the current system ofgranting discounts is badly targeted but also that there is no justification forthe discount.
Second, firms that pay the full taxreduce their energy use and therebytheir greenhouse gas emissions by morethan beneficiaries from the discount.Thus, by granting discounts, thegovernment is losing out twice: first, bymissing out on tax revenues in the orderof £350 million a year; and second, byachieving less in terms of reaching itstargets on reducing emissions.
It would seem to be a no-brainer to abolish the discount and use therevenue in continuing efforts to plug thebudget deficit. Alternatively, the extrarevenue could be recycled back to firmsvia lower national insurancecontributions, as has been the practicewith much of the revenue from theclimate change levy to date.
But the UK government has reached a different conclusion. Although the discount scheme wassupposed to run out in April 2013, thegovernment has recently decided toextend it until at least 2020. It iscurrently finalising the details of thelegislation to bring it before parliamentin September this year.
Further reading
Barry Anderson, Jorg Leib, Ralf Martin, Marty
McGuigan, Mirabelle Muûls, Laure de Preux
and Ulrich Wagner (2011) ‘Climate Change
and Business in Europe: Evidence from
Interviewing Managers’, CEP Occasional
Paper No. 27 (http://cep.lse.ac.uk/pubs/
download/occasional/op027.pdf).
Nicholas Bloom and John Van Reenen (2007)
‘Measuring and Explaining Management
Practices Across Firms and Countries’,
Quarterly Journal of Economics 122(4).
Ralf Martin, Laure de Preux and Ulrich
Wagner (2009) ‘The Impacts of the Climate
Change Levy on Manufacturing: Evidence
from Microdata’, CEP Discussion Paper No.
917 (http://cep.lse.ac.uk/pubs/download/
dp0917.pdf).
Ralf Martin, Mirabelle Muûls and Ulrich
Wagner (2011) ‘Climate Change, Investment
and Carbon Markets and Prices – Evidence
from Manager Interviews’, Climate
Strategies.
Ralf Martin, Mirabelle Muûls, Laure de Preux
and Ulrich Wagner (2012) ‘Industry
Compensation and Relocation Risk:
A Firm-level Analysis of the EU Emissions
Trading Scheme’, forthcoming CEP
Discussion Paper.

CentrePiece Spring 2012
20
The Great Recession has brought industrial policy backinto fashion. Governments around the world have given huge subsidies to private firms, most dramatically in financial services but also in other sectors such as thecar industry.
But business support policies are not new. Mostgovernments grant investment subsidies that claim tofoster employment and productivity, particularly indisadvantaged areas. In 2010, European Union (EU)countries spent €61 billion on aid that was unrelated tothe financial crisis; and the United States spends around$40-50 billion each year on local development policies.
Despite the ubiquity and cost of such schemes, rigorousevaluations of the effects of these ‘industrial policies’ onemployment and productivity are rare. That is what wehave done in an analysis of the impact of expenditurethrough Britain’s ‘regional selective assistance’ (RSA)programme over a 20-year period.
We have examined every manufacturing plant in England,Wales and Scotland – over 2.3 million observations –comparing firms that did and did not get grants bothbefore and after receiving government support. Because EU law changed over this 20-year period, someparts of Britain became eligible for subsidies and others saw their grants disappear, which makes it possiblefor us to work out the impact of investment subsidies onfirm performance.
Our research suggests that government grants to smaller firms in economically disadvantaged areas ofBritain can increase employment, but that grants to largerfirms have no effect. The positive impacts on smaller
firms translate into wider area benefits, for example,reduced unemployment.
But the resulting increases in local manufacturingemployment and reductions in unemployment come at acost in terms of productivity. Specifically, because RSAgrants support employment in lower productivity firmswhile having no impact on firm-level productivity, RSAlowers aggregate productivity by increasing theemployment share of low productivity firms.
Our findings suggest a large effect of grants on smallrecipient firms: a 10% investment subsidy causes about a7% increase in employment, with about half of this(3.6%) arising from growth in existing firms and halffrom firm entry. These effects are underestimated ifanalysis ignores the fact that the participants in thescheme are firms and areas that would otherwise performbadly.
So why are these positive employment effects confined tosmaller firms, those with fewer than 150 workers? Onepossible explanation is that larger firms are more able to‘game’ the system and take the subsidy without changingtheir investment and employment levels. Another possibleexplanation is that grants help to remove the financialconstraints faced by smaller firms.
The wider impacts on employment and unemployment atthe area level suggest that positive effects at the firmlevel are not just about shuffling jobs from nearbyfirms that do not receive financialsupport. In fact, the new jobs createdappear to come mostly from the poolof unemployed workers in the area.
Can industrial policy boost jobs?Business support policies aimed at revitalising economically disadvantaged regionscan be effective at raising employment, according to a team of CEP researchers. Butgovernment subsidies, such as Britain’s ‘grant for business investment’, only seemto work when targeted at smaller firms.
in brief...
Grants to smaller firms can boostjobs but grants to larger firms area waste of taxpayer money

CentrePiece Spring 2012
21
So grants to firms in disadvantaged areas can supportlocal employment. The policy is not costless, however,considering the negative effect on productivity.
Overall, then, our results are mixed news for advocates offirm-level grants to turn around disadvantaged areas.While these policies can increase area-level employment,they lower productivity, leaving firms vulnerable in thefuture (which may partly explain why firms and areaskeep coming back for more support).
As always with these types of policies, careful economicanalysis suggests that there is no ‘free lunch’: firm grantscan raise employment, but at a cost in terms ofproductivity that goes beyond the purely financialimplications of supporting investment in the first place.
This article summarises ‘The Causal Effects of an
Industrial Policy’ by Chiara Criscuolo, Ralf
Martin, Henry Overman and John Van Reenen,
CEP Discussion Paper No. 1113
(http://cep.lse.ac.uk/pubs/download/dp1113.pdf).
Chiara Criscuolo is a research associate in CEP’s
productivity and innovation programme.
Ralf Martin, an assistant professor at Imperial
College Business School, is a senior visiting
research fellow at CEP. Henry Overman is
director of the Spatial Economics Research
Centre. John Van Reenen is director of CEP.
Grants increase area-level employment but lower
productivity, leaving firms potentially vulnerable
in the future

CentrePiece Spring 2012
22
Do natural resource windfalls increase therisk of armed conflict within a country? Yu-Hsiang Lei and Guy Michaelsinvestigate the impact of giant oilfielddiscoveries on the likelihood of civil conflict.
Giant oilfieldsand
civil conflict

CentrePiece Spring 2012
23
Anecdotal evidence fromAngola, Iraq and Nigeriasuggests that discoveriesof natural resourcewealth in a country can
make civil conflict more likely. What’smore, recent research (for example, Besleyand Persson, 2011) has shed light on themechanisms underlying some of theseconflicts over resources. But as theexamples of Brazil, Canada and Norwaydemonstrate, not all oil-rich countriesexperience internal conflicts.
Careful surveys of research onconflicts and natural resources (forexample, Ross, 2006, and Blattman andMiguel, 2010) show how difficult it hasbeen to quantify the effect of oil onarmed conflict in all but a handful ofcountries. The goal of our research is toexamine whether giant oilfield discoveriesreally do fuel internal armed conflictsaround the world – and if so, in which settings.
To investigate this question, we wouldideally want oil windfalls to appear as if ina randomised controlled trial. But in reality,of course, oil-rich countries differ from oil-scarce ones in ways that are difficult toobserve and measure. Using data overtime to control for fixed differences acrosscountries is not straightforward either,because both the amount of oil extractedand its price may themselves respond to conflict.
To overcome this challenge, we focuson the discovery of giant oilfields (andnatural gas reserves) since the SecondWorld War, each of which containedrecoverable reserves of 500 million barrelsequivalent or more before extractionbegan. As we discuss below, we findevidence that the timing of thesediscoveries is largely down to chance, so wecan interpret the events that follow them asthe causal effects of the discoveries.
Our first finding is that, on average, oilproduction increases by about 35-50%within a few years of a giant discovery.Giant oilfield discoveries also increase oilexports by about 20-50% within just afew years (see Figure 1).
We also find that, on average, giantoilfield discoveries increase the incidenceof internal armed conflicts by about 5-8percentage points within four to eightyears of discovery, compared with abaseline probability of about 10% (see Figure 2).
Figure 1:
The effect of giant oilfield discoverieson per capita oil exports
Note: Point estimates in black and 95% confidence intervals in red.
60%
40%
20%
0
-20%
-40%
-5 -4 -3 -2 -1 0 1 2 3 4 5 6 7 8 9 10
YEARS FROM DISCOVERY
Note: Point estimates in black and 95% confidence intervals in red.
15%
10%
5%
0
-5%
-5 -4 -3 -2 -1 0 1 2 3 4 5 6 7 8 9 10
Figure 2:
The effect of giant oilfield discoveries on theincidence of internal armed conflicts
YEARS FROM DISCOVERY
Giant oilfielddiscoveries,
which are largelydown to chance,
significantlyincrease the risk
of civil conflict

CentrePiece Spring 2012
24
The discovery of giant oilfields isespecially likely to fuel internal conflicts incountries with recent histories of politicalviolence. For example, giant oilfielddiscoveries increase the incidence ofinternal armed conflict by about 11-18percentage points (compared with abaseline probability of about 37-39%)when a country experienced at least onesuch conflict in the decade prior todiscovery (see Figure 3).
Similarly, the effect of discovery on theincidence of internal armed conflict is 11-14 percentage points (compared with abaseline probability of about 19-20%) incountries that experienced at least onecoup in the decade prior to discovery. Bycontrast, in countries that experienced nointernal conflicts or coups in the decadebefore a discovery, there is no significanteffect of giant oilfield discoveries on theincidence of internal armed conflicts.
Turning to the effect of giant oilfielddiscoveries on economic outcomes, wefind that GDP per capita and governmentspending either increased modestly orremained unchanged within the decadefollowing a giant oilfield discovery. Ourevidence also suggests that suchdiscoveries did not affect private
consumption or investment. In otherwords, most residents gained little, ifanything, from the discoveries.
If we could be confident that thetiming of giant oilfield discoveries withincountries is random, then we couldinterpret what follows them as the causaleffect of these discoveries. While werecognise that the search effort is notcompletely random, we argue that theprecise timing of discoveries within eachcountry is largely a matter of chance.
To see why, consider how importantgiant oilfields are as a global source of oiland natural gas. These giants account forover 40% of the world’s oil and naturalgas reserves, so their discoveries areeconomically significant events. If acountry or a firm could be fairly certainthat a search will turn up a giant oilfield,then they will probably conduct thesearch.
But in fact, giant oilfield discoveriesare very rare. Averaging across allthe countries in the world,the odds of a giantdiscovery in a givenyear is less thanone-in-twenty. Thefact that these events are
so rare suggests that even when searcheffort is involved, the precise timing is dueless to planning than to chance.
Our research provides additionalevidence that addresses some potential concerns about the timing of the discoveries, and supports ourinterpretation that it is plausible to thinkthat timing is random.
First, we address the concern that thediscoveries may have resulted fromeconomic or political changes thatpreceded them. We find no evidence ofsignificant economic or political changes inthe five years leading up to giant oilfielddiscoveries or in the year of discoveryitself. We also test whether discoveriesfollow lulls in prior conflicts, and find noevidence to support this hypothesis.
Second, we tackle the concern thatfinding one giant oilfield may lead tofinding another one nearby. While it istrue that giant oilfield discoveries in a
Figure 3:
The effect of giant oilfield discoveries on the incidence of internal armed conflicts in countries with at least oneinternal armed conflict in the previous decade
30%
20%
10%
0
-10%
-20%
-5 -4 -3 -2 -1 0 1 2 3 4 5 6 7 8 9 10
Note: Point estimates in black and 95% confidence intervals in red.
Conflict over oil is especially
likely incountries with
recent historiesof political
violence
YEARS FROM DISCOVERY

CentrePiece Spring 2012
25
country’s recent past increase the oddsthat it finds one in a given year,controlling for these past discoveriesleaves the findings essentially unchanged.
Our results are also robust toexcluding observations within a decade orless of previous giant discoveries.Observations with giant oilfield discoveriesaccount for only about 1% of theremaining sample, making them especiallydifficult to anticipate.
Third, we address concerns thateconomic or political conditions shortlybefore discovery may affect our estimates,by showing that our results are robust tocontrolling for institutional quality andaggregate private investment.
Finally, we tackle the concern thatobservations with oil discoveries aredifferent from others in ways that aredifficult to measure directly. To do so, wecompare the effect of giant oilfielddiscoveries with the effect of smaller
oilfield discoveries, and find that ourresults still hold.
Our finding that giant oilfielddiscoveries fuel internal conflicts incountries prone to violence has importantimplications for policy. For example, thosewho strive to reduce armed conflict shouldbe concerned about the windfalls from oilthat incumbent governments obtain inconflict-prone areas, especially if thosewindfalls encourage challenges to theincumbent’s power.
At the same time, the firms thatprospect for oil in conflict-prone areas andthose who regulate them ought to beconcerned about negative consequencesfor many local people. Locals often havelittle to gain from giant oilfield discoveriesbut may suffer enormously from conflictsover the oil.
In conflict-prone areas,windfalls from oildiscoveries may wellencourage challenges to the incumbentgovernment’s power
This article summarises ‘Do Giant Oilfield
Discoveries Fuel Internal Armed Conflicts?’
by Yu-Hsiang Lei and Guy Michaels, CEP
Discussion Paper No. 1089
(http://cep.lse.ac.uk/pubs/download/
dp1089.pdf).
Yu-Hsiang Lei is an occasional research
assistant in CEP’s labour markets programme.
Guy Michaels is a lecturer in economics at
LSE and a research associate in CEP’s labour
markets programme.
Further reading
Timothy Besley and Torsten Persson (2011)
‘The Logic of Political Violence’, Quarterly
Journal of Economics 126(3): 1411-45
Christopher Blattman and Edward Miguel
(2010) ‘Civil War’, Journal of Economic
Literature 48(1): 3-57
Michael Ross (2006) ‘A Closer Look at Oil,
Diamonds, and Civil War’, Annual Review of
Political Science 9: 265-300

CentrePiece Spring 2012
26
Two cheers for Anglo-Saxonfinancial markets?
The increasing dominance of pension funds, mutualfunds and other institutional owners in the US and UKstock markets has been a positive force for industrialinnovation and growth over the past 30 years, accordingto a recent study that I have conducted with PhilippeAghion of Harvard and Luigi Zingales of Chicago.
Our research indicates that publicly traded companies inwhich institutional investors have raised their equity stakewill increase their innovation. These large companies havedispersed ownership so no individual has much of anincentive to keep an eye on the chief executive officer (CEO).
We suggest that the positive role of institutional investorsis because of their greater incentive and ability to monitorcompanies’ performance. They can offer a kind of jobinsurance to CEOs who are prepared to take a chance onrisky, but potentially rewarding, longer-term investments.
At a time when deregulated financial markets are underattack from many quarters, it rare to hear any positivewords for some aspects of the Anglo-Saxon financialmodel. Even before the financial crisis, the takeover of thestock market by institutions – pension funds, hedge funds,mutual funds and the like – was condemned for breedinga bias against long-term investments in innovation.Whereas Japanese and German research and development(R&D) created better cars, it was said, British andAmericans specialised in producing better quick-fixderivatives of no long-term value.
Our study takes a contrary position, arguing that therise in institutional ownership – from under 10% in the1950s to over 60% today – has actually been a positiveforce for innovation and growth. We look at publiclytraded US corporations that were responsible for thebulk of private sector R&D over the past 40 years andtrack what happens when institutions increase theirequity share.
Analysing data on the accounts and patenting activity of803 publicly traded US firms from the mid-1970s to theearly 2000s, we find that a greater role for institutionalinvestors is followed by a burst of innovation in futureyears as indicated by patents (weighted by citations toreflect their importance), R&D and productivity.
This does not seem to be because institutions are betterat predicting future breakthroughs, as the burst ofinnovation occurs even after events that increaseinstitutional investors’ role, such as policy changesfavouring investor activism and gaining membership ofthe S&P 500 index of the US stock market (which boostsinstitutional ownership).
We argue that institutions have a greater incentive tomonitor top managers than individual owners as theytypically have larger blocks of company shares. They alsohave a better ability to monitor managers as they ownshares in many companies and know how to set upbetter systems for keeping an eye on CEOs.
Institutional investors are good for industrial innovation, according toa study by CEP’s director John Van Reenen and colleagues.
in brief...
Publicly tradedcompanies in whichinstitutions haveraised their equitystake increase theirinnovation

CentrePiece Spring 2012
27
Monitoring might improve incentives for innovationbecause lazy managers are forced to put in more effortrather than lazing around on the golf course or the skislopes of Davos. This would imply that the impact ofinstitutional investors is stronger when managers aremore entrenched due to weak competition or protectionfrom takeovers.
In fact, we find that the role of institutions is greaterwhen managers are less entrenched, so we prefer anexplanation based on ‘career concerns’. Innovation is arisky business, so top managers fear that they will befired if they take a chance by investing in innovation andthings turn out badly through no fault of their own. By gathering more information on managerial quality,institutions offer some insurance to CEOs who areprepared to take a chance on risky, but rewarding,investments.
One test of our career concerns theory is to look at CEOfiring. Poor profitability performance is often followedwith the abrupt booting out of the incumbent CEO. Butour research shows that decreases in profit – which maynot be the sole fault of the CEO – are less likely to causea firing when institutional investors are stronger. This is inline with the view that institutions give some insuranceprotection to managers and encourage them to take onmore risky innovation.
Since innovation is the engine of growth, theinstitutional ownership that characterises the Anglo-American financial system clearly has long-runbenefits. These benefits should not be regulated away in the current backlash.
This article summarises ‘Innovation
and Institutional Ownership’ by
Philippe Aghion, John Van Reenen
and Luigi Zingales, CEP Discussion
Paper No. 911 (http://cep.lse.ac.uk/
pubs/download/dp0911.pdf) and
forthcoming in the American
Economic Review.
Philippe Aghion is at Harvard
University. John Van Reenen is
director of CEP. Luigi Zingales is at
the University of Chicago.
Institutional investorsoffer job insurance to CEOs who makerisky but potentiallyrewarding investments
CentrePiece Spring 2012
28
Recent figures indicate a resurgence in the growth ofexecutive pay in the UK at a time of austerity for most.Anger at these numbers is driven in part by a growing beliefthat such pay bears little relationship to how the companiesmanaged by these chief executive officers (CEOs) actuallyperform. In other words, the argument goes, there is payfor no performance.
To shed more light on whether there is any link between thepay of top business people and the performance of theirfirms, we have created a database of pay for CEOs, seniorexecutives and employees covering over 400 UK firms overthe period since 2001. These firms account for about 90%of UK stock market capitalisation.
This is the first time that data covering everyone from theCEO to the cleaners in a large sample of firms has beencollected and linked to stock market performance in thiscountry. It makes it possible to explore how pay changesacross a whole company as its performance improves orworsens.
As might be expected, we find that there are big differencesin average pay. CEOs earn around 40 times more than the average employee, but this multiple rises to around 80 when we look only at the very top companies – the FTSE100. The majority of pay for CEOs comes from bonuses andstock incentive plans, whereas 95% of employees’ paycomes from basic salary.
Our evidence also shows that when corporate performanceimproves, so does pay. But pay goes up much more forCEOs than for ordinary employees. For example, if the firm’svalue as measured by shareholder returns increases by 10%,CEOs on average get an extra 3% in pay while employeesget only 0.2% more.
This close pay-for-performance link among CEOs seems tobe a fairly new development. Evidence from the 1980s andearly 1990s found almost no link between pay andperformance for top executives. Our research shows thattoday’s correlation between pay and performance is drivenby bonuses and other incentive packages, which havebecome more important in recent years.
We also find that poorly performing firms are much morelikely to boot out their CEOs, and that when a firm does
badly, CEO pay goes down. But it is worth noting that CEOpay cuts for failure are not as speedy as pay increases onthe upside. So although it is true that CEOs are not just‘rewarded for failure’, they get more pleasure when thecompany’s performance goes up than pain whenperformance goes down.
Of course, these average effects of performance on paycover both well-governed firms that use pay to provideincentives for their CEO and poorly performing firms thatpay over the odds for questionable talent.
Finally, we demonstrate that there is a strong relationshipbetween how tightly firms link CEO pay with performanceand how significant institutional investors are among thefirms’ shareholders. For firms with low levels of institutionalownership, we find no link between pay and performancein general, although CEOs in such firms do benefit whenperformance is good.
In contrast, firms with high levels of institutional ownershipare more successful at linking pay and performance, andensuring that the link works in both good times and badtimes. This all suggests that active and large shareholderscan provide an important disciplining influence on thestructure of CEO pay.
What are the implications for policy? We think that thereare strong grounds for encouraging more transparentreporting of pay by companies. Many annual reports areunnecessarily complicated in their reporting of executive payand, perhaps inadvertently, tend to obscure the size andnature of the pay awards.
We also think that there should be a requirement for eachand every board to explain to shareholders and the publichow the growth in pay of their CEO is linked to theperformance of the company. Those that fail this test mustbe held to account by shareholders.
UK chief executives:paid for performance?Is there any clear relationship between corporate performanceand executive remuneration? To explore this question, Brian Belland John Van Reenen have created a new database of pay forsenior executives and employees in 400 UK firms.
in brief...
This article summarises ‘Firm Performance and Wages:
Evidence from across the Corporate Hierarchy’ by Brian Bell
and John Van Reenen, CEP Discussion Paper No. 1088
(http://cep.lse.ac.uk/pubs/download/dp1088.pdf).
Brian Bell is a research fellow in CEP’s productivity and innovation
programme. John Van Reenen is director of CEP.

PUBLICATIONSCEP Discussion Papers are available as electronic copies free to download from the Centre’s website:http://cep.lse.ac.uk/_new/publications
ENVIRONMENTAL POLICY AND DIRECTEDTECHNOLOGICAL CHANGE: EVIDENCEFROM THE EUROPEAN CARBON MARKETRaphael Calel and AntoineDechezleprêtreCEP Discussion Paper No. 1141April 2012
GOODS TRADE, FACTOR MOBILITY AND WELFAREStephen ReddingCEP Discussion Paper No. 1140April 2012
SPAN OF CONTROL AND SPAN OF ACTIVITYOriana Bandiera, Andrea Prat, Raffaella Sadun and Julie WulfCEP Discussion Paper No. 1139April 2012
TRADE AND INEQUALITY: FROM THEORY TO ESTIMATIONElhanan Helpman, Oleg Itskhoki, Marc-Andreas Muendler and Stephen ReddingCEP Discussion Paper No. 1138April 2012
INTERMEDIARIES IN INTERNATIONALTRADE: DIRECT VERSUS INDIRECT MODES OF EXPORT Andrew Bernard, Marco Grazzi and Chiara TomasiCEP Discussion Paper No. 1137March 2012
GENDER GAPS IN PERFORMANCE:EVIDENCE FROM YOUNG LAWYERS Ghazala Azmat and Rosa FerrerCEP Discussion Paper No. 1136March 2012
CEO BONDING: WHO POSTSPERFORMANCE BONDS AND WHY? Alex Bryson, John Forth and Minghai ZhouCEP Discussion Paper No. 1135March 2012
WHY ARE MIGRANTS PAID MORE? Alex Bryson, Giambattista Rossi and Rob SimmonsCEP Discussion Paper No. 1134March 2012
INCENTIVES FOR QUALITY OVER TIME –THE CASE OF FACEBOOK APPLICATIONS Jörg Claussen, Tobias Kretschmer and Philip MayrhoferCEP Discussion Paper No. 1133March 2012
CYCLICAL RISK AVERSION,PRECAUTIONARY SAVING ANDMONETARY POLICY Bianca De Paoli and Pawel ZabczykCEP Discussion Paper No. 1132March 2012
CEP SPECIAL PAPERSTHE POLITICAL ECONOMY OF THE GREEK DEBT CRISIS: A TALE OF TWO BAILOUTSSilvia Ardagna and Francesco CaselliCEP Special Paper No. 25March 2012
UK ECONOMIC PERFORMANCE SINCE 1997: GROWTH, PRODUCTIVITY AND JOBSDan Corry, Anna Valero and John Van ReenenCEP Special Paper No. 24December 2011
For further information on CEP publications and events, please contact:
The Publications Unit, Centre for Economic Performance, Houghton Street, London WC2A 2AE
Telephone: +44 (0) 207 955 7673
Fax: +44 (0) 207 955 7595
Email: [email protected]
We accept Visa, Access and Mastercard for payment by post, fax and phone
Overseas rates on request
CEP EVENTS
Forthcoming evidence sessions of the LSE Growth Commission co-chaired by Tim Besley and John Van Reenen
INFRASTRUCTURE, ENERGY AND GROWTHSpeakers: Steven Fries, David Newbery and Bridget RosewellWednesday 23 May 2012, 2pm, CEP
MANAGEMENT AND GROWTHSpeakers: Ian Davis and John Van ReenenMonday 28 May 2012, 3pm, venue to be confirmed
DRIVING GROWTH THROUGH SCIENCE, ENGINEERING AND INNOVATIONSpeakers: Ayman Asfari, Jon Moulton and Keith O’NionsWednesday 30 May 2012, 10am, venue to be confirmed
DRIVING GROWTH THROUGH SCIENCE, ENGINEERING AND INNOVATIONSpeakers: Ian Shott and Sir Andrew WittyThursday 28 June 2012, 4pm, CEP
For more information, visit the LSE Growth Commission website:http://www2.lse.ac.uk/growthcommission
Follow CEP on Twitter @CEP_LSE

CentrePiece is the magazine of the Centre for
Economic Performance at the London School of
Economics. Articles in this issue reflect the
opinions of the authors, not of the Centre.
Requests for permission to reproduce the
articles should be sent to the Editor at the
address below.
Editorial and Subscriptions Office
Centre for Economic Performance
London School of Economics
Houghton Street
London WC2A 2AE
© Centre for Economic Performance 2012
Volume 17 Issue 1
(ISSN 1362-3761) All rights reserved.
Centre Piece
The back issues
Follow CEP on Twitter @CEP_LSE