centralini nextel di nuova generazione super dkx ip
TRANSCRIPT

WM2013 Conference, February 24 – 28, 2013, Phoenix, Arizona, USA
1
Investigating Low Temperature Properties of Rubber Seals – 13020
M. Jaunich*; D. Wolff*; W. Stark* � BAM Federal Institute for Materials Research and Testing, Unter den Eichen 87, 12203
Berlin, Germany [email protected]
ABSTRACT
To achieve the required tightness levels of containers for low and intermediate level radioactive wastes rubbers are widely applied as main sealing materials. The save encapsulation of the radioactive container contents has to be guaranteed according to legislation and appropriate guidelines for long storage periods as well as down to temperatures of -40 °C during transportation. Therefore the understanding of failure mechanisms that lead to leakage at low temperatures is of high importance. It is known that the material properties of rubbers are strongly influenced by temperature. At low temperatures this is caused by the rubber-glass transition (abbr. glass transition). During continuous cooling the material changes from rubber-like entropy-elastic to stiff energy-elastic behaviour, that allows nearly no strain or retraction. Therefore, rubbers are normally used above their glass transition but the minimum working temperature limit is not defined precisely, what can cause problems during application. The temperature range where full functionality is possible is strongly dependent on the application conditions and the material. For this investigation mainly ethylene propylene diene (EPDM) and fluorocarbon rubbers (FKM) were selected as they are often used for radioactive waste containers. Differential Scanning Calorimetry (DSC) and Dynamic Mechanical Analysis (DMA) are typically used for the determination of the temperature range of the glass transition process. The standardized compression set measurement according to ISO 815 is common for investigation of rubber sealing materials as the test simulates the seal behaviour after release. To reduce the test time of the standard tests a faster technique giving the same information was developed. Additionally, the breakdown temperature of the sealing function of complete O-ring seals is measured in a component test setup to compare it with the results of the other tests. The experimental setup is capable of measuring the leakage rate at low temperatures by the pressure rise method. A model was developed that allows calculating the minimum working temperature limit of a seal by combining the results of the applied methods. INTRODUCTION: Elastomers are often used for seal applications due to their special material properties and easy use [1]. The key advantage of elastomeric seals in comparison to other seals is their high

WM2013 Conference, February 24 – 28, 2013, Phoenix, Arizona, USA
2
resilience [2]. Nearly every technical good incorporates at least some elastomeric seals. The application area reaches from simple seals that prevent the intrusion of dust into a machine housing to extend the lifetime and performance of a machine to rather important seals that prevent the release of dangerous goods to the environment. In many applications low temperatures occur during operation. Therefore it is important to know the material behaviour at low temperatures to determine the temperature range that allows a safe operation of the seal. The material properties of an elastomer are limited in temperature by the rubber-glass transition (abbreviated: glass transition) during which the material changes between a rubber like entropy-elastic to a stiff, energy-elastic behaviour [3]. In the glassy state the seal cannot recover the elastic deformation and the sealing force drops. This may result in a direct loss of the sealing function but especially for purely static applications a leak tightness well below the rubber-glass transition was observed [4]. Several testing techniques can be used to measure the material properties of elastomers at low temperatures. On the one hand, thermo-analytical methods are used to determine the glass transition temperature because of correlated changes in certain material properties. On the other hand, tests like the compression set are used to determine the material behaviour especially the possible recovery at different temperatures. In this work thermo-analytical methods and compression set results are compared with the results from component tests. A model was developed to describe the observed differences between thermal analysis and the behaviour under purely static stress conditions. MATERIALS: For the investigation a fluorocarbon rubber (FKM) and an ethylene propylene diene rubber (EPDM) were selected. In spite of the high price of FKM these specialty elastomers are commonly used for certain applications for transport containers of dangerous goods [5]. Their advantages are high temperature stability and chemical resistance. The samples were purchased from Parker Hannifin GmbH as seals with an inner diameter of 218 mm and a cord thickness of 12 mm. METHODS: The applied methods can be divided into two groups: methods to determine glass transition temperatures and more practical tests to investigate material performance. Methods for glass transition measurement: For the characterization of the glass-rubber transition often the so called glass transition temperature is applied. But this should be done carefully as the absolute value is strongly dependent on the measurement method, measurement parameters and the performed analysis. It is possible that several temperature values are determined from one measurement that shall

WM2013 Conference, February 24 – 28, 2013, Phoenix, Arizona, USA
3
describe the same process but are several Kelvin apart. Therefore it is essential to indicate the applied method and analysis in combination with the determined value. Differential Scanning Calorimetry (DSC): The used device was a DSC 204 F1 from Netzsch. The heating rate was 10 K/min and the measurement was performed under a nitrogen atmosphere with a flow rate of 20 ml/min. To analyse the observed typical step-like change in the heat flow curve, that is caused by the change of heat capacity due to glass transition [6], three straight lines are fitted to the data [7]. Dynamic Mechanical Analysis (DMA): DMA is a mechanical testing technique that can be applied for temperature dependent determination of viscoelastic material properties, namely the storage and the loss component of the material stiffness [8, 9]. The principle of DMA is that an oscillating stress is applied to the sample. The displacement of the sample is measured and due to the occurring phase shift between force and displacement the viscoelastic material properties (storage and loss modulus) can be determined. The measurements were performed with a Netzsch DMA 242 C. At first the samples were measured in a conventional DMA experiment in the temperature range from -80 to 50 °C with a heating rate of 1 K/min and amplitude of 40 μm at an frequency of 1 Hz. As sample holder a double cantilever with a free bending length of 2·5 mm was used. Thermo Mechanical Analysis (TMA): By means of Thermo Mechanical Analysis (TMA) the thermal expansion of a material can be measured under a small constant load during continuous heating respectively cooling and the thermal expansion coefficient can be calculated. The change in the expansion behaviour caused by glass-rubber transition is used to determine a glass transition temperature. TMA measurements were performed with a TMA SS 120C from Seiko in a nitrogen atmosphere. The measurement was performed between -150 °C and 70 °C wit a heating rate of 2 K/min. Samples where several mm thick and disc shaped. Methods for material performance: Standardized Compression Set (CS): The measuring principle of the compression Set (CS) measurement is the following: A cylindrical sample with a diameter of 13 mm and a height of 6.3 mm is compressed by 25 % at room temperature (RT). This reduces the initial height (h0) to the intermediate height (hs) that is given by the height of the used spacers. The sample is stored at test temperature (TT) for a defined time. Recommended values for low temperature testing are 24 or 72 h [10]. After storage, the sample is released from compression and the sample height (h1(t)) is measured at the test temperature. According to ISO 815-2 [11] data for h1 can be determined either at fixed times

WM2013 Conference, February 24 – 28, 2013, Phoenix, Arizona, USA
4
after release of the compressed sample or can be measured continuously over time. The latter is more versatile as it allows a further analysis of the time dependent recovery behaviour of the sample. The compression set is calculated as described in [11] according to:
100)(
0
10 ∗−−
=shhthhCS (1)
A compression set value of 100 % means that the material is totally stiff and shows no recovery. Compression Set using DMA (CSDMA): As the standardized compression set procedure is rather time consuming, an accelerated procedure using DMA was developed and applied for several materials [12-14]. The compression sample holder was used to measure the DMA compression set (CSDMA). The experiments were performed according to the temperature and force program given in Figure 1. The temperature and force program consist of three parts. In the first part the sample is kept at room temperature for e.g. 60 min to ensure temperature equilibration. In the second part the sample is compressed at room temperature by a force close to the maximum of the DMA equipment. After another 60 min for temperature equilibration, the temperature is decreased to the respective measuring temperature that can be chosen arbitrarily within the temperature range of the measurement equipment. The duration of this cooling step depends on the cooling rate and the temperature difference. After additional 60 min for temperature equilibration at the selected temperature, the third part of the experiment begins. During the third part the sample height recovery is measured after removing the compression force except for a small residual value which is necessary to ensure contact between probe and sample. The sample height h1(t) is measured over time at the test temperature. Data were recorded nearly every 10 seconds.As sample geometry a cuboid with an edge length of about 2 mm is used.

WM2013 Conference, February 24 – 28, 2013, Phoenix, Arizona, USA
5
Figure 1: Temperature and force program of CSDMA measurement at temperatures below room temperature.
With the h1(t) data the CSDMA values can be calculated by the following equation, described in [12]:
%100)(
0
10 ∗−−
=c
DMA hhthhCS (2)
Here hc is the height of the compressed sample directly before the release. This value differs from hs which is given by the used spacers in the standardized test. Component tests: To measure the sealing function a test flange was constructed that enables the measurement of leakage rates by the pressure rise method. In combination with a controlled low temperature cabinet the leakage rate can be measured at different temperatures. The temperature at the seal is measured additionally with a thermocouple. The device is schematically shown in Figure 2.
Figure 2: Component test setup for pressure rise measurements at low temperatures [15].
The design objective for this measurement setup was to develop test equipment for static seals of various inner seal diameters and cord thicknesses, and that can be handled by a single person without extensive equipment to determine the leakage rate at different temperatures. A sketch of the flange is shown in Figure 3.

WM2013 Conference, February 24 – 28, 2013, Phoenix, Arizona, USA
6
Figure 3: Sketch of the flange system with seal and spacer blocks positioned on a support.
The degree of compression can be varied by exchange of the spacer blocks. The influence of the degree of compression can therefore easily be studied with this device. For the tests a seal of an inner diameter of 218 mm and a cord thickness of 12 mm was compressed within the flange system by e.g. 25 %. The whole system was evacuated by the vacuum pump and then the pressure rise (Δp) measurement was started by closing the vent to shut off the pump. The tested volume of the setup consisted of the flange with the compressed seal, the pressure sensor and the metal tubing between flange and valve. The leakage rate (qL) was calculated with the following equation [16]:
tpVqL Δ
Δ∗= (3)
The experiments were performed in two parts. In the first part the temperature was decreased stepwise starting at room temperature where a good performance and therefore low leakage rate was detected; and the leakage rate was determined at every temperature. This was continued until a clear increase in leakage rate (by several orders of magnitude) was detected. In the second part the temperature was increased again stepwise from the lowest temperature of the first part at which a high leakage rate is observed to investigate whether the leakage path closes with increasing temperature. The measured leakage rates are overall values that describe the whole measurement setup and not only the seal under investigation. Therefore it has to be taken into account, that leakage can not only occur through the investigated seal within the flange but also through other seals used between different tube parts and sensors. But nevertheless as only the tested rubber seal is subjected to the low temperatures within the low temperature cabinet, the observed increase in leakage rate with decreasing temperature can be attributed to this seal as all others proved functional. RESULTS AND DISCUSSION: The performed measurements give an overview of the temperature dependent material properties, especially of the low temperature region showing the glass transition temperature range. In Figure 4 the measurement results of DSC, DMA and TMA are given. For DMA only the storage modulus curve at a measurement frequency of 1 Hz is given. The DSC results show a typical steplike increase in heat flow that is associated with the glass transition process. For EPDM this step lies between -60 and -50 °C and for the FKM material between -23 °C and -14 °C, respectively. Typical changes of measured values in the same temperature region were also detected with DMA and TMA. The storage modulus shows a steplike decrease and the slope of the length change increases.

WM2013 Conference, February 24 – 28, 2013, Phoenix, Arizona, USA
7
The storage modulus shows rather constant decrease with increasing temperature up to -23 °C for FKM respectively -60 °C for EPDM and then a steplike reduction is detected. At higher
Figure 4: DSC, DMA and TMA measurement results for EPDM (solid line) and FKM (dashed
line).
temperatures only slight temperature dependence is observed in the rubbery region. The steplike decrease can be used for the description of the glass transition process. The values of the glass transition temperatures Tg determined by DSC, DMA, and TMA are given in Table I.
Table I: Different glass transition temperatures determined by DMA at 1 Hz and DSC with a heating rate of 10 K/min
Method
Glass transition temperature Tg EPDM FKM
DSC: extrapolated onset -57 °C -21 °C DSC: inflection point -53 °C -17 °C
DSC: extrapolated offset -52 °C -14 °C DMA: E’-inflection point -54 °C -17 °C
DMA: E’-extrapolated onset -60 °C -23 °C

WM2013 Conference, February 24 – 28, 2013, Phoenix, Arizona, USA
8
DMA: E’-extrapolated offset -52 °C -11 °C DMA: tan δ -peak -52 °C -10 °C DMA: E’’-peak -55 °C -16 °C
TMA -60 °C -20 °C As can be seen from the data, the glass transition process covers a broad temperature range from -23 to -10 °C for different measuring and calculation methods. As the frequency dependence of the glass transition process is not included here, it is expected that the CS values show even more pronounced temperature dependence.
Results of the CSDMA measurements for the FKM sample are exemplary shown in Figure 5.
Figure 5: CSDMA measurements at different temperatures for FKM.
At higher temperatures the CSDMA value drops fast at the beginning of the measurement and shows then a slow decrease with time. With decreasing temperature the initial steplike decrease becomes smaller but the behaviour at longer times seems to be unchanged. At -29 °C the material shows a constant compression set value of 100 %. This means that the material is totally stiff and shows no recovery. In Figure 6 isochronal datasets derived from the CSDMA data are plotted (c.f. [13, 14, 17]).
Figure 6: Isochronal plots of the CSDMA values of FKM over temperature.

WM2013 Conference, February 24 – 28, 2013, Phoenix, Arizona, USA
9
A strong change of CSDMA can be seen in the region of the glass transition. For every isochronal curve a region where the decrease in CSDMA is strongest is observed. This region shifts to lower temperatures with increasing time. The time-temperature dependency of recovery is very important for the performance of a seal under dynamic conditions. A seal made of this material can only preserve leak-tightness if it is able to react fast enough to changes of the outer dimensions of the sealing groove or flange displacements due to external forces. If the reaction of the material is slower than the changes in the dimensions of the sealing groove or flange displacements a leakage path is formed. This leakage path can be closed again by a sufficient amount of recovery of the material if a sufficient operating temperature can be realized. The component test measurements were performed for both materials with a degree of compression of 13 %. The determined leakage rates are shown in Figure 7.
Figure 7: Leakage rate over temperature for 13 % degree of compression [17].
During the first part of the experiment where the temperature is decreased stepwise, the leakage rate remains nearly constant until a certain temperature - at about -63 °C for EPDM and -29 °C for FKM respectively - a drastic increase in leakage rate is observed. Further temperature decrease leads to a further almost linear increase of leakage rates. In the second part with stepwise temperature increase for the FKM material the same linear temperature dependence is observed up to about -25 °C that is followed by an even faster reduction in leakage rate in the temperature range between -25 °C and -18 °C. At -18 °C the initial low leakage rate value is reached again and the leakage rate remains almost constant up to 20 °C. For the EPDM material a fast decrease is observed between -70 °C and -56 °C. Between -56 °C and -44 °C the decrease is slower. The entire temperature dependence of leakage rate (on cooling and heating together) show a hysteresis like behaviour (see Figure 7.), as the temperature of the first increase in leakage rate is much lower than the temperature where the leakage rate level associated with full seal function is reached again.
WM2013 Conference, February 24 – 28, 2013, Phoenix, Arizona, USA
10
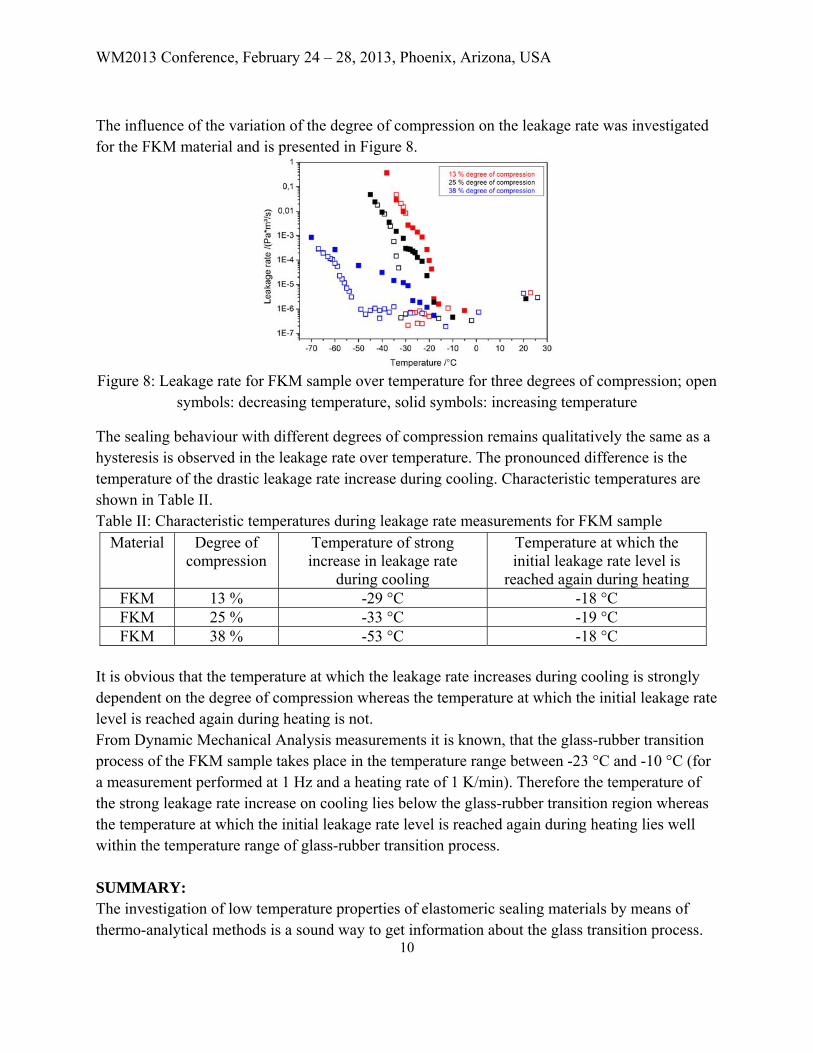
The influence of the variation of the degree of compression on the leakage rate was investigated for the FKM material and is presented in Figure 8.
Figure 8: Leakage rate for FKM sample over temperature for three degrees of compression; open
symbols: decreasing temperature, solid symbols: increasing temperature
The sealing behaviour with different degrees of compression remains qualitatively the same as a hysteresis is observed in the leakage rate over temperature. The pronounced difference is the temperature of the drastic leakage rate increase during cooling. Characteristic temperatures are shown in Table II. Table II: Characteristic temperatures during leakage rate measurements for FKM sample
Material Degree of compression
Temperature of strong increase in leakage rate
during cooling
Temperature at which the initial leakage rate level is
reached again during heating FKM 13 % -29 °C -18 °C FKM 25 % -33 °C -19 °C FKM 38 % -53 °C -18 °C
It is obvious that the temperature at which the leakage rate increases during cooling is strongly dependent on the degree of compression whereas the temperature at which the initial leakage rate level is reached again during heating is not. From Dynamic Mechanical Analysis measurements it is known, that the glass-rubber transition process of the FKM sample takes place in the temperature range between -23 °C and -10 °C (for a measurement performed at 1 Hz and a heating rate of 1 K/min). Therefore the temperature of the strong leakage rate increase on cooling lies below the glass-rubber transition region whereas the temperature at which the initial leakage rate level is reached again during heating lies well within the temperature range of glass-rubber transition process. SUMMARY: The investigation of low temperature properties of elastomeric sealing materials by means of thermo-analytical methods is a sound way to get information about the glass transition process.
WM2013 Conference, February 24 – 28, 2013, Phoenix, Arizona, USA
11
The measurement of time-dependent recovery of a compressed elastomer at low temperatures as performed during the compression set test gives additional information about the function of a seal at low temperatures and the contact between seal and flanges. The applied compression set measurement by DMA gives similar results to the standard technique. But it allows measuring the properties over a wide temperature range within a considerably shorter time. At temperatures in the region of the glass transition, between -10 and -23 °C, the FKM material shows no spontaneous rebound and the speed of recovery becomes lower with decreasing temperature. The sample shows no recovery of the applied compression at -28°C, where the material is completely within the energy elastic state. The time-temperature dependency of recovery is very important for the performance of a seal under dynamic conditions. A seal made of this material can only preserve leak-tightness if it is able to react fast enough to changes of the outer dimensions of the sealing groove or flange displacements due to external forces. If the reaction of the material is slower than the changes in these distances a leakage path is formed. This leakage path can be closed again by a sufficient amount of recovery of the material if a sufficient operating temperature can be realized. The breakdown temperature of the sealing function of O-ring seals was measured in a component test setup depending on material and degree of compression. An in depth explanation of observed behaviour requires the results of thermo-analytical methods and measurements as the compression set are used to explain the results of the component tests and is currently in preparation. Therefore a model was developed to describe the correlation between physical material parameters and observed component behaviour. REFERENCES [1] G. Streit and M. Achenbach, "Sealability of O-rings at low-temperatures .2. Influence of
fuels on seal reliability at low-temperatures," Kautschuk Gummi Kunststoffe, vol. 46, pp. 812-823, 1993.
[2] W. Schmitt, Kunststoffe und Elastomere in der Dichtungstechnik: W. Kohlhammer GmbH, 1987.
[3] H. P. Weise, H. Kowalewsky, and R. Wenz, "Behavior of elastomeric seals at low-temperature," in 3rd European Vacuum Conf ( Evc-3 ) / 5th Austrian - Hungarian - Yugoslav Joint Vacuum Conf, Vienna, Austria, 1991, pp. 555-557.
[4] H.-P. Weise, H. Kowalewsky, and R. Wenz, "Behaviour of elastomeric seals at low temperatures," Vacuum, vol. 43, pp. 555-557, 1992.
[5] B. Droste, T. Neumeyer, H. Kowalewsky, and D. A. E. V. Deutsch Atomforum E V, "High-temperature and low-temperature suitability of elastomer seal rings for transport and storage containers for radioactive materials," in Annual Meeting of Nuclear Technology 99, Karlsruhe, Germany, 1999, pp. 313-316.
[6] B. Tieke, Makromolekulare Chemie: Wiley-VCH Verlag, 2005. [7] G. W. Ehrenstein, G. Riedel, and P. Trawiel, Thermal Analysis of Plastics vol. 1.
Munich: Hanser, 2004.
WM2013 Conference, February 24 – 28, 2013, Phoenix, Arizona, USA
12
[8] T. Murayama, Dynamic Mechanical Analysis of Polymeric Material, 1st ed. vol. 1st: Elsevier, 1978.
[9] K. P. Menard, Dynamic Mechanical Analysis: A Practical Introduction, 2nd ed. Boca Raton: CRC Press, 2008.
[10] "DIN ISO 815-1:2010, Rubber vulcanized or thermoplastic-Determination of compression set - Part 1: At ambient of elevated temperatures."
[11] "DIN ISO 815-2:2010, Rubber vulcanized or thermoplastic-Determination of compression set - Part 2: At low temperatures."
[12] M. Jaunich, W. Stark, and D. Wolff, "A new method to evaluate the low temperature function of rubber sealing materials," Polymer Testing, vol. 29, pp. 815-823, 2010.
[13] M. Jaunich, W. Stark, and D. Wolff, "Low Temperature Properties of Rubber Seals," KGK-Kautschuk Gummi Kunststoffe, vol. 64, pp. 52-55, March 2011.
[14] M. Jaunich, W. Stark, and D. Wolff, "Comparison of low temperature properties of different elastomer materials investigated by a new method for compression set measurement," Polymer Testing, vol. 31, pp. 987-992, 2012.
[15] M. Jaunich, K. von der Ehe, D. Wolff, H. Völzke, and W. Stark, "Understanding low temperature properties of elastomer seals," Packaging, transport, storage & security of radioactive materials (RAMTRANS), vol. 22, pp. 83-88, 2011.
[16] M. Wutz, H. Adam, and W. Walcher, Handbuch Vakuumtechnik, 6 ed.: Vieweg & Sohn Verlagsgesellschaft mbH, 1997.
[17] M. Jaunich, Tieftemperaturverhalten von Elastomeren im Dichtungseinsatz vol. 79. Berlin: Bundesanstalt für Materialforschung und Prüfung, 2011.